Embed Size (px)
Citation preview

Glutamine and Asparagine Side Chain Hyperconjugation-InducedStructurally Sensitive VibrationsDavid Punihaole, Zhenmin Hong, Ryan S. Jakubek, Elizabeth M. Dahlburg, Steven Geib,and Sanford A. Asher*
Department of Chemistry, University of Pittsburgh, 219 Parkman Avenue, Chevron Science Center, Pittsburgh, Pennsylvania 15260,United States
*S Supporting Information
ABSTRACT: We identified vibrational spectral marker bands that sensitivelyreport on the side chain structures of glutamine (Gln) and asparagine (Asn).Density functional theory (DFT) calculations indicate that the Amide IIIP (AmIIIP)vibrations of Gln and Asn depend cosinusoidally on their side chain OCCC dihedralangles (the χ3 and χ2 angles of Gln and Asn, respectively). We use UV resonanceRaman (UVRR) and visible Raman spectroscopy to experimentally correlate theAmIIIP Raman band frequency to the primary amide OCCC dihedral angle. TheAmIIIP structural sensitivity derives from the Gln (Asn) Cβ−Cγ (Cα−Cβ) stretchingcomponent of the vibration. The Cβ−Cγ (Cα−Cβ) bond length inversely correlateswith the AmIIIP band frequency. As the Cβ−Cγ (Cα−Cβ) bond length decreases, itsstretching force constant increases, which results in an upshift in the AmIIIP frequency. The Cβ−Cγ (Cα−Cβ) bond lengthdependence on the χ3 (χ2) dihedral angle results from hyperconjugation between the CδOϵ (CγOδ) π* and Cβ−Cγ (Cα−Cβ)σ orbitals. Using a Protein Data Bank library, we show that the χ3 and χ2 dihedral angles of Gln and Asn depend on the peptidebackbone Ramachandran angles. We demonstrate that the inhomogeneously broadened AmIIIP band line shapes can be used tocalculate the χ3 and χ2 angle distributions of peptides. The spectral correlations determined in this study enable important newinsights into protein structure in solution, and in Gln- and Asn-rich amyloid-like fibrils and prions.
■ INTRODUCTION
Amyloid-like fibril protein aggregates and prion proteins oftencontain stretches of glutamine (Gln) and asparagine (Asn)residues. For example, polyglutamine (polyGln)-rich fibrils arethe pathological hallmarks of several “CAG” codon repeatdiseases.1−9 Similarly, Sup35p and Ure2p prions contain Gln-and Asn-rich regions that drive their aggregation and cause loss-of-function of these normally soluble proteins.10
Because Gln and Asn side chains can hydrogen bond towater, the peptide backbone, or other side chains, they serveunique roles in protein structure and conformationaltransitions. Unfortunately, there is relatively little knownabout the mechanisms by which the primary amide groups ofGln and Asn interact with other protein constituents or whatrole they play in the aggregation of prions and fibrils.Consequently, it is important to find spectroscopic markersthat can be used to monitor the conformations and hydrogenbonding environments of Asn and Gln side chains in order todevelop a deeper understanding of the roles that these residuesplay in protein aggregation.There are few methods to quantitatively examine the
conformations of Gln and Asn side chains in prion and fibrilaggregates. Recent solid-state NMR studies11−13 suggest thatthere are at least two different populations of Gln side chainconformers in polyGln fibrils. Sharma et al.14 claim on the basisof low-resolution X-ray fiber and powder diffraction data thatthe side chains in polyGln fibrils adopt an unusual bent
conformation; however, these highly uncommon side chainstructures have not been substantiated by other studies.High resolution X-ray diffraction studies15,16 on small
peptide microcrystals that contain amyloidogenic sequenceshave revealed important, atomic-resolution details regarding thesteric zipper interactions that could occur in Gln- and Asn-richprions and fibrils. These studies indicate, for example, thatdifferences in the structures and hydrogen bonding interactionsof amino acid side chains give rise to different fibrilpolymorphs. However, the conformations observed in thesmall peptide crystals may not reflect the side chain structuresand hydrogen bonding interactions that occur in bona fideprion and fibril aggregates.UV resonance Raman (UVRR) is a powerful, emerging tool
for studying the conformations of proteins, as well as thestructure, local hydrogen bonding, and dielectric environmentsof amino acid side chains.17−28 Deep UV excitation (∼200 nm)selectively resonance enhances secondary and primary amidevibrations.29,30 Previous investigations of secondary amidevibrations have developed a detailed understanding of theUVRR spectral dependence on the peptide bond structure andits hydrogen bonding.31−34 For example, Asher and co-workers35−37 quantitatively correlated the Amide III3
Received: August 6, 2015Revised: September 17, 2015Published: September 21, 2015
Article
pubs.acs.org/JPCB
© 2015 American Chemical Society 13039 DOI: 10.1021/acs.jpcb.5b07651J. Phys. Chem. B 2015, 119, 13039−13051

(AmIII3) frequency to the peptide bond Ramachandran Ψdihedral angle. They determined that the structural sensitivityof the AmIII3 vibration derives from coupling between thepeptide backbone amide N−H and Cα−H bending motions.35
This fundamental insight enabled incisive investigations thatelucidated, in detail, the mechanism of α-helix (un)folding in awide range of solution environments.38−43
We seek to develop a similar deep understanding of theUVRR spectral dependence of primary amide vibrations on thestructure of Gln and Asn side chains. In this work, we discoverthe structural sensitivity of the Amide IIIP (AmIIIP) vibrationon the primary amide OCCC dihedral angle (the χ3 and χ2angles of the side chains Gln and Asn, respectively). Thepotential energy distribution (PED) of this vibration in Gln(Asn) contains significant contributions of Cβ−Cγ (Cα−Cβ)stretching, NϵH2 (NδH2) rocking, and Cδ−Nϵ (Cγ−Nδ)stretching motions. We find that the structural sensitivity ofthe AmIIIP mode originates mainly from the Cβ−Cγ (Cα−Cβ)bond length dependence on the χ3 (χ2) dihedral angle. Wedemonstrate that the Cβ−Cγ (Cα−Cβ) bond length correlationon the χ3 (χ2) dihedral angle derives from hyperconjugationbetween the Cβ−Cγ (Cα−Cβ) σ orbital and the CδOϵ (CγOδ) π* orbital.We compare our results with the Gln and Asn entries of the
Shapovalov and Dunbrack side chain rotamer library44 andexamine the dependence of Gln (Asn) χ3 (χ2) dihedral angleson the peptide backbone Ramachandran (Φ, Ψ) angles. Weobserve distinct χ3 and χ2 dihedral angle preferences for Glnand Asn residues that adopt PPII, β-sheet and α-helixRamachandran angles. Applying this new insight and thedependence of the χ3 dihedral angle on the AmIIIP vibrationalfrequency, we determine the χ3 angle distribution of Gln3 andAsp2-Gln10-Lys2 peptides in aqueous solution. We find thatGln3 and Asp2-Gln10-Lys2 favor χ3 dihedral angles similar tothose of Gln in solution. This result is consistent with Gln3 andAsp2-Gln10-Lys2 containing side chains that are completelysolvated.Our work here develops a novel spectral marker for
experimentally probing the structures of Asn and Gln sidechains in fibrils and prion aggregates. Our methodology doesnot require extensive isotopic labeling or crystallization andallows us to monitor the side chain structural changes thatoccur during protein aggregation. This enables crucial,molecular-level insights into the role that Gln and Asn sidechains play in stabilizing fibril and prion aggregates. We aredeveloping new insights into why Gln- and Asn-rich sequenceshave strong propensities to aggregate into amyloid-like fibrilsand prions.
■ EXPERIMENTAL DETAILSMaterials. L-Glutamine (L-Gln, ≥99% purity), L-glutamine t-
butyl ester hydrochloride (Gln-TBE, ≥98% purity), and glycyl-L-glutamine (Gly-Gln, ≥97% purity) were purchased fromSigma-Aldrich. D-Glutamine (D-Gln, 98% purity) was purchasedfrom Acros Organics, and N-Acetyl-L-glutamine (NAcGln, 97%purity) was purchased from Spectrum Chemical Mfg. Corp. L-seryl-L-asparagine (Ser-Asn, ≥99% purity) was purchased fromBachem. Optima-grade H2O was purchased from FisherScientific, and D2O (99.9% atom D purity) was purchasedfrom Cambridge Isotope Laboratories, Inc. Gln3 was purchasedfrom Pierce Biotechnology at 95% purity.Sample Preparation. Gly-Gln and Ser-Asn were obtained
as crystalline powders and used without further purification or
recrystallization. D-Gln, NAcGln, L-Asn, and GlnTBE crystalswere prepared by drying saturated solutions in water. L-Glncrystals were obtained by drying a saturated solution in thepresence of 0.1 M NaCl. N-deuterated crystals were preparedvia multiple rounds of recrystallization in D2O. Samples of Gln3were prepared at 0.5 mg·mL−1 in HPLC-grade water containing0.05 M sodium perchlorate (Sigma-Aldrich, ≥98% purity). Thesodium perchlorate was used as an internal intensity standardto allow us to subtract the contribution of water.
X-ray Diffraction. X-ray diffraction of crystals wasperformed using a Bruker X8 Prospector Ultra equipped witha copper microfocus tube (λ = 1.54178 Å). The crystals weremounted and placed in a cold stream of N2 gas (230 K) for datacollection. The frames collected on each crystal specimen wereintegrated with the Bruker SAINT software package using thenarrow-frame algorithm. The Supporting Information discusses,in detail, the methods used to determine the unit cells andcrystal structures of the compounds examined.
Visible Raman Spectroscopy. Visible excitation Ramanspectra of crystals were collected using a Renishaw inViaspectrometer equipped with a research-grade Leica microscope.Spectra were collected using the 633 nm excitation line from aHeNe laser and a 5× objective lens. The spectrometerresolution was ∼2 cm−1. The 918 and 1376 cm−1 bands ofacetonitrile45 were used to calibrate the spectral frequencies.
UV Resonance Raman Spectroscopy. UV resonanceRaman (UVRR) spectra of crystals were collected using CW229 nm light generated by an Innova 300C FreD frequencydoubled Ar+ laser.46 The crystalline specimens were spun in acylindrical brass cell to prevent the accumulation of thermal orphotodegradation products. A SPEX triplemate spectrograph,modified for use in the deep UV, was utilized to disperse theRaman scattered light. A Spec-10 CCD camera (PrincetonInstruments, model 735-0001) with a Lumagen-E coating wasused to detect the Raman light. The power of UV lightilluminating the sample ranged from ∼1.5 to 2 mW. The 801,1028, 2852, and the 2938 cm−1 bands of cyclohexane were usedto calibrate the 229 nm excitation UVRR spectral frequencies.UVRR solution-state measurements were made using ∼204
nm excitation. The UV light was generated by Raman shiftingthe third harmonic of a Nd:YAG laser (Coherent, Inc.) with H2gas (∼30 psi) and selecting the fifth anti-Stokes line. Athermostated (20°) flow cell was employed to circulatesolutions in order to prevent the contribution of photo-degradation products. The scattered light was dispersed andimaged using a double monochromator, modified for use in theUV in a subtractive configuration47 and detected with a Spec-10CCD camera.
■ COMPUTATIONAL DETAILSDensity Functional Theory (DFT) Calculations. The
DFT calculations48 were carried out using the GAUSSIAN 09package.49 The geometry optimizations and frequencycalculations were performed using the M06-2X functional50
and the 6-311++g** basis set. The presence of water wassimulated implicitly by employing a polarizable continuumdielectric model (PCM). Vibrational frequencies were calcu-lated using the harmonic approximation. The calculatedfrequencies were not scaled. The potential energy distribution(PED) of each vibration was obtained from the Gaussianoutput files by employing a MATLAB program that we wrote(see Supporting Information). Figure 1 shows the DFTcalculated minimum energy structure of L-Gln and the atomic
The Journal of Physical Chemistry B Article
DOI: 10.1021/acs.jpcb.5b07651J. Phys. Chem. B 2015, 119, 13039−13051
13040
labeling scheme. To study the conformational dependence ofthe Raman bands, we fixed the χ3 dihedral angle of L-Gln,reoptimized the geometry, and calculated the harmonicvibrational frequencies for a series of conformers with χ3angles of −16°, 0°, 4°, ±30°, ±60°, ±90°, ±120°, ±150°,and ±180°.
■ RESULTS AND DISCUSSIONAssignment of L-Gln UVRR Bands in H2O and D2O.
Figure 2 shows the band-resolved ∼204 nm excitation UVRRspectra of L-Gln in H2O and D2O. Visible Raman and infraredspectra band assignments of L-Gln were reported previously byRamirez and co-workers for both solid-state crystallinesamples51 and in the solution state.52 Ramirez and co-workers
made assignments without performing normal mode calcu-lations in their study of crystalline L-Gln. In their solution-statestudy, they employed DFT calculations to aid in bandassignments. We found that their reported frequencies didnot match those in our solution-state UVRR spectra and thattheir band assignments were inconsistent with our intensityexpectations of the resonance enhanced bands.In the work here, we perform a new normal mode analysis of
L-Gln in order to assign our UVRR spectra. We employ DFTcalculations that use a more modern functional (M06-2X) thanthat of Ramirez and co-workers. These assignments build off ofour previous, detailed assignment of propanamide,28 a modelfor the side chains of Gln and Asn. Our assignments of L-Gln inH2O and D2O are shown in Tables 1 and 2, respectively.
The UVRR spectra are dominated by bands that derive fromvibrations of the primary amide group. This is because theseresonance enhanced vibrations couple to the strong ∼180 nmNV1 electronic transition. These resonance enhanced amidebands contain significant contributions of Cδ−Nϵ stretchingbecause the electronic excited state is expanded along thiscoordinate.53
Figure 1. Geometry of optimized structure and atomic labelingscheme of L-Gln used in DFT calculations and band assignments.
Figure 2. UVRR spectra excited at ∼204 nm of L-Gln in (a) H2O and(b) D2O. The spectral contributions of the solvents have beensubtracted. The reduced χ2 (χred
2 ) statistics for the spectral fits shown in(a) and (b) are 0.55 and 1.8, respectively.
Table 1. UVRR Frequencies (cm−1) and Assignments of L-Gln in H2O
expt calcd potential energy distributiona (≥5% contribution)
1679 1745 νCδOϵ (75), −νCδNϵ (8), βNϵCδCγ (7)1652 1666 δas′NH3 (48), −δasNH3 (44), −ρNH3 (5)1620 1623 −σNϵH2 (86), −νCδNϵ (10)
1621 δasNH3 (40), δas′NH3 (48), δsNH3 (10)1585 1715 −νCO (53), νCO (33), ρCαC (7)1464 1494 σCβH2 (88)
1466 −δsNH3 (33), σCγH2 (30), ωCγH2 (7), −ωCβH2 (5),νCβCγ (5)
1447 1460 −σCγH2 (44), −δsNH3 (36)1427 1445 −ωCγH2 (17), νCγCδ (13), σCγH2 (13), ωCβH2 (13),
−νCδNϵ(9), −νCβCγ (5), −δsNH3 (5), ρCδO (5)1411 1419 −νCO (26), ρCαH (12), νCαC(11), ωCγH2 (8),
βCOO (7), νCδNϵ (7), −νCO (7), −νCγCδ (6)1365 1388 ρCαH (25), ωCβH2 (13), νCO (10), −ρ′CαH (9),
νCαCβ (8), −τCβH2 (6), −νCαC (5)1351 1358 −ρCαH (30), ωCβH2 (16), −τCβH2 (15), τCγH2 (9),
νCδNϵ (6)1328 1348 −τCβH2 (26), −ωCβH2 (18), −ρ′CαH (13), −νCδNϵ (11)1293 1309 −τCγH2 (35), −ρ′CαH (26), ρCβH2 (8), −ρCαH (6)1264 1272 −ωCγH2 (43), −ωCβH2 (20), νCδNϵ (13)1206 1215 −τCβH2 (21), −νCαCβ (18), −τCγH2 (16), −ρ′NH3 (13),
δNCαC(OO) (5)1158 1153 −ρ′CαH (20), τCγH2 (17), −ρ′NH3 (13), τCβH2 (12),
−νCαCβ (8), ρCγH2 (6)1130 1122 νCβCγ (34), ρNϵH2 (17), −νCαCβ (7), νCαN (6),
−βNϵCδCγ (5)1109 ρNH3 (27), −ρ′CαH (10), −ρNϵH2 (10),
−δ′NCC(OO) (9), −ρCαH (7), νCαN (7)1110 1097 νCβCγ (26), −ρNϵH2 (26), −νCδNϵ (13), −ρNH3 (8)
1038 νCαN (36), −νCβCγ (9), ρCβH2 (8), ρ′NH3 (6),ρCγH2 (5), ρ′CαH (5)
1078 1003 ρNH3 (25), −νCαN (19), ρCγH2 (14), ρCβH2 (14),νCαCβ (7), −τCβH2 (5)
1006 974 −ρ′NH3 (38), νCαCβ (25), −νCαC (8), −σCCαCβ (7),νCαN (6)
aν, stretch; δas, asymmetric deformation; δs, symmetric deformation; δ,deformation; σ, scissoring; ρ, rocking; ω, wagging; β, in-plane bending;τ, twisting.
The Journal of Physical Chemistry B Article
DOI: 10.1021/acs.jpcb.5b07651J. Phys. Chem. B 2015, 119, 13039−13051
13041

The spectral region between 1600 and 1700 cm−1 isdominated by two primary amide vibrations, the Amide IP
(AmIP) and Amide IIP (AmIIP) bands. The superscript P
denotes the primary amide to distinguish these vibrationsfrom the widely known vibrations of secondary amides found inproteins. The AmIP band is located at ∼1680 cm−1 and derivesmainly from CδOϵ stretching. In D2O, the AmIP band (calledthe AmI’P) downshifts to ∼1650 cm−1. The AmIIP band at∼1620 cm−1 derives from a vibration whose PED containsmostly NϵH2 scissoring (∼86%) and Cδ−Nϵ stretching(∼10%). Upon N-deuteration, the Cδ−Nϵ stretching andND2 scissoring motions decouple. This causes the AmIIP
band to disappear, and a new band, which derives from NϵD2scissoring, appears at ∼1160 cm−1.The most intense features of the Gln spectra in Figure 2
occur in the region between 1400 and 1500 cm−1. Most of thebands found in this region derive from CH2 scissoring orwagging modes. However, we assign the most intense band,located at ∼1430 cm−1, to a vibration that contains significantcontributions of CH2 wagging, Cγ−Cδ stretching, CH2scissoring, and Cδ−Nϵ stretching in its PED. This assignment
is based on our previous work with propanamide,28 whichshows a similar intense band at ∼1430 cm−1.The region between 1200 and 1400 cm−1 contains bands that
derive mostly from CαH rocking, CH2 wagging, and CH2
twisting modes. We assign the ∼1365 and ∼1350 cm−1 bandsin the Figure 2a spectrum to CαH rocking modes. We assignthe strong bands located at ∼1330 cm−1, ∼1290 cm−1, and thevery weak ∼1205 cm−1 bands to CH2 twisting modes. The∼1265 cm−1 feature is assigned to a CH2 wagging vibration.Only two bands, at ∼1370 and ∼1345 cm−1, appear in D2O.We assign the ∼1370 cm−1 band to a CH2 wagging mode andthe ∼1345 cm−1 band to a CαH rocking mode. We concludethat these vibrations appear strongly in the UVRR spectrum inFigure 2b because they contain significant Cδ−Nϵ stretching.The region between 1000 and 1200 cm−1 contains bands that
derive from vibrations with large C−C stretching, NϵH2
rocking, or NH3 rocking contributions. Most of the vibrationsin this region are complex. We assign the ∼1160 cm−1 band toa coupled CαH rocking/CH2 twisting mode. The PED of thisvibration contains a significant contribution of NH3 rocking,which likely accounts for the disappearance of this band uponN-deuteration. We assign the ∼1080 and ∼1005 cm−1 bands toNH3 rocking vibrations.The remaining two bands in the 1000−1200 cm−1 region are
located at ∼1130 and ∼1110 cm−1. The observed frequencydifference between these two vibrations is ∼20 cm−1, which isclose to the calculated ∼25 cm−1 difference of our DFTcalculations. We assign the 1130 cm−1 band to a vibration thatis mainly an in-phase combination of Cβ−Cγ stretching andNϵH2 rocking. The ∼1110 cm−1 band is assigned to a vibrationthat consists of an out-of-phase combination of Cβ−Cγ
stretching and NϵH2 rocking. This vibration also contains asignificant Cδ−Nϵ stretching component (∼13%), which is inphase with NϵH2 rocking.The in-phase combination of NϵH2 rocking and Cδ−Nϵ
stretching of the ∼1110 cm−1 vibration is reminiscent of theAmIII mode of secondary amides. While complex, the AmIIIvibration contains significant contributions of in-phase C−Nstretching and N−H in-plane bending motions of thesecondary amide group. We propose to call the ∼1110 cm−1
mode the Amide IIIP (AmIIIP) because the eigenvectorcomposition of this vibration is analogous to that of thecanonical AmIII of secondary amides. As discussed in detailbelow, the AmIIIP vibration is sensitive to the χ3 and χ2 dihedralangles of Gln and Asn.
Conformational Dependence of the AmIIIP Band. Weperformed DFT calculations on L-Gln molecules with χ3dihedral angles fixed at different values (see Computationalsection for details) in order to identify spectroscopic markersthat are diagnostic of the side chain χ3 and χ2 dihedral angles ofGln and Asn, respectively. We examined the frequencydependence of different primary amide vibrations and foundthat the AmIIIP vibrational frequency and normal modedepends strongly on the OCCC dihedral angle.Figure 3a shows the calculated cosinusoidal dependence of
the AmIIIP vibrational frequency on the χ3 dihedral angle. Themaximum frequency of the vibration occurs at χ3 ∼ 0°, whileminima occur near χ3∼ ± 90°. The Gln AmIIIP band frequencydependence on the χ3 angle follows a cosinusoidal relationship:
ν χ ν χ χ= + + −A B C( ) cos(2 ) cos( )3 0 3 3 (1)
Table 2. UVRR Frequencies (cm−1) and Assignments of L-Gln in D2O
expt calcd potential energy distributiona (≥5% contribution)
1650 1739 νCδOϵ (78), −νCδNϵ (7), βNϵCδCγ (7)1637 1708 νCO (55), −νCO (34), −ρCαC (7)1465 1494 σCβH2 (88)1453 1465 −σCγH2 (48), −ωCγH2 (15), −νCβCγ (8), −νCδNϵ (7),
ωCβH2 (6)1440 1454 −σCγH2 (35), νCδNϵ (19), −νCγCδ (14), ωCγH2 (9),
−ρCδOϵ (5)1412 1424 −νCO (29), νCαC (12), −νCO (10), ωCβH2 (10),
βCOO (9), νCδNϵ (9), ρCαH (8)1368 1393 ωCβH2 (21), ρCαH (15), νCO (11), νCαCβ(8),
−ρ′CαH (6), νCO (6), −νCαC (5), νCδNϵ (5)1344 1362 −ρCαH (37), −ωCγH2 (13), νCδNϵ (12), ωCβH2 (11),
ρ′CαH (7), σNϵD2 (5)1349 −τCβH2 (44), τCγH2 (20), −ρCαH (15), −ρ′CαH (6)1304 −ρ′CαH (32), −τCγH2 (29), ρCβH2 (8), −ρCαH (7)1282 −ωCγH2 (37), −ωCβH2 (33), σNϵD2 (8), ρCαH (7),
νCδNϵ (6)1202 −δasND3 (23), δas′ND3 (20), τCβH2 (17), τCγH2 (12),
νCαCβ (8)1198 δasND3 (27), τCβH2 (12), τCγH2 (11), −ρ′CαH (9),
νCαCβ(8), δsND3 (7), −δas′ND3 (7)1186 −δas′ND3 (52), −δsND3 (27), −νCαN (8), −δasND3 (6)
1161 1150 σNϵD2 (56), ρ′CδOϵ (11), νCγCδ (9), ωCγH2 (8)1131 νCαCβ(21), −δsND3 (16), −νCαN (14), δasND3 (13),
−τCγH2 (5)1119 −νCβCγ (17), δasND3 (10), δNCαC(OO) (9), −νCαCβ(8),
−δsND3 (8), σCγCβCα (7), −νCαN (6), δas′ND3 (5)1105 νCβCγ (44), −δsND3 (15), δasND3 (8), δas′ND3 (6),
−νCαCβ (5)1058 ρCβH2 (21), ρ′CαH (16), ρCγH2 (12), δ′NCαC(OO) (9),
−νCαC (6), δC′CαCβ(6), νCαCβ(5), −ρND3 (5)992 998 νCαN (29), δsND3 (15), −δ′NCαC(OO) (10), −ρCαC (7),
−νCβCγ (5), −σCCαCβ (5)960 959 ρNϵD2 (22), νCδNϵ (14), νCγCδ (10), −σNϵD2 (9),
−νCαN (9), −βNϵCδCγ (8), νCαC (6), νCδOϵ (6)929 920 νCαC (17), ρCγH2 (16), ρND3 (16), −τCβH2 (8),
βCOO (8), −δ′NCαC(OO) (7), ΠNϵCδCγ (6)aν, stretch; δas, asymmetric deformation; δs, symmetric deformation; δ,deformation; σ, scissoring; ρ, rocking; ω, wagging; β, in-plane bending;τ, twisting; Π, out-of-plane deformation.
The Journal of Physical Chemistry B Article
DOI: 10.1021/acs.jpcb.5b07651J. Phys. Chem. B 2015, 119, 13039−13051
13042

where ν0 = 1084 cm−1, A = 10 cm−1, B = 3 cm−1, and C = −31°.These parameters were calculated from a least-squares fit of eq1 to the frequency dependence on the χ3 angle in Figure 3a.Figure 3a shows that the AmIIIP frequency dependence on
the χ3 dihedral angle is asymmetric about χ3 ∼ 0°. Thisasymmetry is due to the chirality of L-Gln and L-Asn and leadsto the requirement of two cosine terms to express the χ3frequency dependence of eq 1. This is evident when wecompare the L-Gln χ3 dependence on the AmIIIP frequencywith that of butyramide (shown in Supporting InformationFigure S1). In the case of butyramide, which is achiral, there isno asymmetry about 0°. As a result, the AmIIIP frequencydependence on the OCCC dihedral angle of butyramide can besatisfactorily modeled with just one cosine term (SupportingInformation eq S1).Origin of the OCCC Dihedral Angle Dependence of
the AmIIIP Vibration. Understanding the conformational
dependence of the AmIIIP frequency on the primary amideOCCC dihedral angle requires a detailed knowledge of theatomic motions that give rise to the vibration. On the basis ofour normal mode calculations of Gln, butyramide (SupportingInformation Table S14), and propanamide,28 we conclude thatNϵH2 rocking, Cδ−Nϵ stretching, and Cβ−Cγ stretching definethe AmIIIP vibration. However, depending on the OCCCdihedral angle, other motions such as CβH2 twisting and Cα−Cβ
stretching can contribute to this vibration.Therefore, we examined how the Gln Cδ−Nϵ, Cβ−Cγ, and
Cα−Cβ bond lengths change as a function of the χ3 dihedralangle in order to understand the origin of the conformationalsensitivity of the AmIIIP vibration. Changes in these bondlengths impact the AmIIIP frequency by affecting the vibrationalmode bond force constants. As seen in Figure 3b−d, all thebond lengths show a dependence on the χ3 dihedral angle.However, as seen in Figure 3b, the Cβ−Cγ bond length showsthe largest dependence on the χ3 dihedral angle. The AmIIIP
vibrational frequency has a strong correlation with the Cβ−Cγ
bond length, as shown in Figure 3e. The AmIIIP vibrationalfrequency increases as the Cβ−Cγ bond length decreases andvice versa.The Cβ−Cγ bond length dependence on the χ3 dihedral
angle appears to be due to hyperconjugation between the Cβ−Cγ σ and the CδOϵ π* orbitals (Figure 4). This interaction isstrongest when these orbitals maximally overlap in the absenceof significant phase cancellation due to the π* orbitalantisymmetry. When hyperconjugation occurs, the σ orbitaldonates electron density to the π* orbital, which decreases theCβ−Cγ bond order and increases its bond length. Thisdecreases the Cβ−Cγ stretching force constant, which down-shifts the AmIIIP frequency.We tested this hypothesis with natural bond orbital (NBO)
analysis, which allows the DFT calculated electron densities tobe displayed in terms of approximate σ and π* molecularorbitals. According to our hypothesis, the Cβ−Cγ bond lengthshould be largest when hyperconjugation is maximized andsmallest when there is no hyperconjugation. Indeed, as seen inFigure 4b, there is significant overlap of the Cβ−Cγ σ and CδOϵ π* NBO molecular orbitals at ±90°, where the Cβ−Cγ bondlength is largest. In contrast, at χ3 ∼ 0°, where the Cβ−Cγ bondlength is shortest, the orbital overlap cancels due to theantisymmetry of the π* orbital. Figure 5 shows the NBO chargeon the Cβ atom. As expected from our hyperconjugationhypothesis, the NBO Cβ atom charge is less negative at χ3 ∼±90° compared to χ3 ∼ 0°. The NBO Cβ atom charge becomeseven more negative at χ3 ∼ ±150° and χ3 ∼ ±180°, evenwithout additional hyperconjugation of the Cβ−Cγ σ and CδOϵ π* orbitals. This result is likely an artifact because theseextreme χ3 dihedral angles are associated with physicallyimpossible high energy structures that will be subject to otherelectron density alterations.Our model accounts for the AmIIIP frequency downshift as
the dihedral angles approach χ3∼±90°, where hyperconjuga-tion is strongest. This behavior is the reverse of the Bohlmanneffect,54−57 where a “negative” hyperconjugation transferselectron density from a lone pair orbital to an optimallypositioned C−H σ* orbital. This decreases the C−H bondorder and substantially downshifts the C−H stretchingfrequencies.
Experimental Dependence of AmIIIP Band Frequencyon OCCC Dihedral Angle. We experimentally examined thedependence of the AmIIIP band frequency on the primary
Figure 3. Calculated AmIIIP frequency and bond length dependenceon the χ3 dihedral angle of the Gln side chain. (a) AmIIIP frequencydependence, (b) Cβ−Cγ bond length, (c) Cδ−Nϵ bond length, (d)Cα−Cβ bond length, and (e) the dependence of the AmIIIP frequencyon the Cβ−Cγ bond length.
The Journal of Physical Chemistry B Article
DOI: 10.1021/acs.jpcb.5b07651J. Phys. Chem. B 2015, 119, 13039−13051
13043

amide OCCC dihedral angle by measuring the UVRR andvisible Raman spectra of different Gln and Asn derivatives inthe solid-state. We determined the structures of each of thedifferent Gln and Asn derivative crystals with X-ray diffractionand assigned the AmIIIP band by performing DFT calculationsand examining band shifts upon N-deuteration. Our X-raydiffraction methods and the band assignments of the crystalsare discussed, in detail, in the Supporting Information.Dependence of AmIIIP Band Frequency in Crystals. Figure
6 shows the AmIIIP frequency dependence on the exper-imentally determined primary amide OCCC dihedral angles.We fit the experimental data to a function of the same form aseq 1, obtaining the following relationship:
ν χ χ
χ
= + +
+ °
− − −( ) 1066(cm ) 29(cm ) cos(2 ) 9(cm )
cos( 99 )3
1 13
1
3 (2)
which is shown in the Figure 6 black curve. To obtain the eq 2parameters, we fixed the A/B ratio to ∼3 as found in eq 1 andperformed a least-squares minimization of the experimentaldata. Equation 2 provides an excellent fit of the experimentaldata and captures the chiral asymmetry that occurs near χ3∼±90°.
Dependence of AmIIIP Band Frequency for Fully HydratedPrimary Amides. The AmIIIP band frequency also depends onthe local hydrogen bonding and dielectric environment of theprimary amide group.28 In water, the AmIIIP band of L-Gln islocated at ∼1110 cm−1, as compared with ∼1097 cm−1 in thesolid-state. On the basis of Rhys et al.’s neutron diffractionstudy,58 the solution-state equilibrium structure of L-Gln inwater does not appear to differ significantly from the singleknown L-Gln crystal structure.59 From their solution-state
Figure 4. Hyperconjugation results in the Cβ−Cγ bond length sensitivity to the χ3 dihedral angle. Overlap of Cβ−Cγ σ and CδOϵ π* NBOmolecular orbitals when the χ3 dihedral angle is (a) 0°, (b) +90°, and (c) ±180°.
Figure 5. NBO charge of Cβ in L-Gln as a function of the χ3 dihedralangle.
Figure 6. Experimental correlation of the AmIIIP frequency to the χ3dihedral angle. The average frequency (from the 633 and 229 nmRaman spectra) of the AmIIIP band was plotted as a function of theOCCC dihedral angle: 1 = L-Gln, 2 = Gly-Gln, 3 = D-Gln, 4 =GlnTBE, 5 = NAcGln, and 6 = Ser-Asn. The data were fit with eq 2(black line, radj
2 = 0.83). The blue curve corresponds to eq 3. The redcurve corresponds to eq 4. The yellow curve corresponds to eq 5 andis an average of the red and blue curves.
The Journal of Physical Chemistry B Article
DOI: 10.1021/acs.jpcb.5b07651J. Phys. Chem. B 2015, 119, 13039−13051
13044

structure, we determine that the equilibrium χ3 dihedral angleof L-Gln in water is ∼ −12.8°. This differs by less than a degree(−13.54°) from the L-Gln crystal examined in this study. Thus,by setting the AmIIIP frequency to 1110 cm−1, χ3 to −13.54°,and solving for ν0, we obtain eq 3:
ν χ χ
χ
= + +
+ °
− − −( ) 1083(cm ) 29(cm ) cos(2 ) 9(cm )
cos( 99 )3
1 13
1
3 (3)
which is shown by the Figure 6 blue curve. This equationcorrelates the AmIIIP band frequency to OCCC dihedral anglesfor situations in which the primary amide group is fully exposedto water, such as in polyproline II-like (PPII-like) structures,2.51-helices,
60 and extended β-strand-like peptide conforma-tions dissolved in water.Dependence of AmIIIP Band Frequency for Low Dielectric
Constant and Weak Hydrogen Bonding Environments. TheAmIIIP frequency downshifts ∼15 cm−1 in the low dielectricand hydrogen bonding environment of acetonitrile comparedto that in water (see Supporting Information and Figure S6).This downshift derives from the different water versusacetonitrile stabilizations of the ground state OϵCδNϵH2and −OϵCδNϵH2
+ resonance structures of the primaryamide group.28 In both solvents, the OϵCδNϵH2 resonancestructure dominates; however, in acetonitrile, the −OϵCδNϵH2
+ resonance structure contributes less than in water. Thus,the Cδ−Nϵ bond length is larger in acetonitrile compared towater due to the lesser favorability of the −OϵCδNϵH2
+
resonance structure. Consequently, there is a smaller Cδ−Nϵ
stretching force constant in acetonitrile compared to water,which results in a downshift of the AmIIIP frequency.Equation 3 can be modified in order to account for situations
where the primary amide group is not engaged in significanthydrogen bonding interactions or when located in a lowdielectric environment. We apply a 15 cm−1 downshift in ν0from eq 3 to determine eq 4:
ν χ χ
χ
= + +
+ °
− − −( ) 1068(cm ) 29(cm ) cos(2 ) 9(cm )
cos( 99 )3
1 13
1
3 (4)
which is shown in red in Figure 6.Dependence of AmIIIP Band Frequency for Unknown
Dielectric and Hydrogen Bonding Environments. We suggestthe use of eq 5, which is the average of eqs 3 and 4, for caseswhere the hydrogen bonding and dielectric environment of theprimary amide group is unknown:
ν χ χ
χ
= + +
+ °
− − −( ) 1076(cm ) 29(cm ) cos(2 ) 9(cm )
cos( 99 )3
1 13
1
3 (5)
It can be applied, for example, to determine the side chain χ3and χ2 dihedral angles of Gln and Asn residues located in turnstructures of proteins. For these residues, it may not be clear ifthe side chains are hydrogen bonded to water, to other sidechains, or the peptide backbone. Equation 5 is shown by theyellow curve in Figure 6.
Predicting Side Chain χ3 and χ2 Dihedral Angles in Glnand Asn as a Function of Ramachandran (Φ, Ψ) Angles.
Figure 7. Gln and Asn side chain χ3 and χ2 dihedral angle dependence on secondary structure. Plots showing Ramachandran angles for PDB entriesfrom the Shapovalov and Dunbrack database of (a) Gln and (b) Asn. The colored boxes correspond to canonical PPII (Φ = −65°, Ψ = 145°) angles(red), β-sheet (Φ = −115°, Ψ = 130°) angles (blue), and α-helix (Φ = −63°, Ψ = −43°) angles (yellow). Distributions of χ3 and χ2 dihedral anglesfor Gln and Asn residues that have (Φ, Ψ) angles close to canonical: (c,d) PPII-like, (e,f) β-sheet, and (g,h) α-helical structures.
The Journal of Physical Chemistry B Article
DOI: 10.1021/acs.jpcb.5b07651J. Phys. Chem. B 2015, 119, 13039−13051
13045

Shapovalov and Dunbrack44 recently developed a new peptidebackbone dependent rotamer library, which includes thenonrotameric Gln and Asn side chain χ3 and χ2 dihedralangles. Their database was compiled by analyzing highresolution crystal structures from the Protein Data Bank(PDB) and consists of ∼30000 entries for Asn and ∼20000entries for Gln. Parts a and b of Figure 7 show Ramachandranplots of all of the Gln and Asn entries in the Shapovalov andDunbrack database. The Gln and Asn side chains populatesimilar regions of the Ramachandran plot, and both show apreference for α-helical region (Φ, Ψ) angles. Asn populates amuch broader range of (Φ, Ψ) angles, especially in the nearlyforbidden “bridge” region between β-sheet and α-helicalregions of the Ramachandran plot.We used the Shapovalov and Dunbrack database to examine
the side chain χ3 and χ2 dihedral angle preferences of Gln andAsn residues that possess canonical PPII, β-sheet, or α-helixRamachandran angle values. On the basis of work byRichardson61 and Karplus,62 we assume (Φ, Ψ) angles centeredaround (−65°, 145°) for canonical PPII structures, (−115°,130°) for canonical β-sheets and (−63°, −43°) for canonical α-helices. Parts c−h of Figure 7 depict histograms of the χ3 and χ2dihedral angles observed for the population of Gln and Asnresidues with canonical PPII, β-sheet or α-helical Ramachan-dran angles.The Gln and Asn side chain χ3 and χ2 dihedral angles clearly
depend upon the peptide bond Φ and Ψ angles. Thiscorrelation could result from a preference for particular χ3 orχ2 dihedral angles for stretches of consecutive peptide bondswith (Φ, Ψ) angles that result in PPII, β-sheet, or α-helicalsecondary structures. Alternatively, it could result from apreference for χ3 or χ2 dihedral angles for the (Φ, Ψ) anglevalues of their individual peptide bonds.The χ3 and χ2 dihedral angle histograms of Gln and Asn
residues that populate the canonical PPII region of theRamachandran plot are shown in Figure 7c,d. The distributionof χ3 angles adopted by Gln is broader than that of the χ2 anglesof Asn. Both histograms are centered about negative dihedralangles, with Gln showing a peak at around χ3 ∼ −8° and Asnshowing a peak near χ2 ∼ −36°. It should be noted that the biasdue to the L-amino acid chirality gives rise to a clear preferencefor negative χ2 dihedral angles for the shorter side chain Asnresidues.The χ3 and χ2 dihedral angle histograms of Gln and Asn with
β-sheet (Φ, Ψ) angles in Figure 7e,f differ dramatically fromone another. The population of Gln χ3 dihedral angles (Figure7e) is nearly symmetric about χ3 ∼ 0°. The histogram isbimodal, with two peaks located near χ3 angles of ∼ −44° and∼41°. In contrast, the population of Asn residues (Figure 7f)predominately adopts negative dihedral angles and is peakedaround χ2 ∼ −61°. A minor peak also occurs around χ2 ∼ 56°.Parts g and h of Figure 7 show histograms of the χ3 and χ2
dihedral angles of Gln and Asn residues that adopt canonical α-
helical Ramachandran angles. As in Figure 7e, the Figure 7gGln χ3 dihedral angle population is roughly bimodal and nearlysymmetric about χ3 ∼ 0°. It is peaked at χ3 angles of ∼ −34°and ∼45°. In contrast, in Figure 7h, the population of Asn χ2dihedral angles is narrow and sharply peaked at χ2 ∼ −19° withtwo minor peaks at χ2 ∼ −49° and ∼62°.The χ3 and χ2 dihedral angle dependencies on the peptide
bond Ramachandran angles, shown by the Shapovalov andDunbrack database, enable us to predict the most probableAmIIIP frequencies of Gln and Asn residues that adoptcanonical PPII, β-sheet, and α-helix (Φ, Ψ) angles (shown inTable 3). For example, using eq 3, we calculate that Gln andAsn side chains with PPII (Φ, Ψ) angles will have a maximumprobability of showing AmIIIP bands centered at ∼1111 cm−1
and ∼1096 cm−1, respectively. Similarly, we calculate that theAmIIIP bands of Gln residues with β-sheet Ramachandranangles will have the greatest probability of being located at∼1080 cm−1 and/or ∼1089 cm−1. In contrast, the AmIIIP bandsfor Asn residues with β-sheet (Φ, Ψ) angles will have thelargest probability of being located at ∼1064 cm−1 and/or∼1075 cm−1. For α-helical Ramachandran angles, we calculatethat the probability maxima for AmIIIP bands will be at ∼1076cm−1 and/or ∼1098 cm−1 for Gln and ∼1058, ∼1085, and/or∼1107 cm−1 for Asn residues.We can calculate the expected Raman spectral AmIIIP band
shapes from the Gln χ3 and Asn χ2 dihedral angle histograms inFigure 7 using the AmIIIP Raman band frequency dependenciesof eqs 2−5. These calculated band shapes (not shown) areunphysically broad (>100 cm−1). This clearly indicates thatthese histograms derive from the inhomogeneous distributionof χ3 and χ2 angles of individual Gln and Asn residues withinthe proteins found in the Shapovalov and Dunbrack database.This distribution of Raman frequencies from the calculatedAmIIIP band is much broader than the homogeneous line widthof an AmIIIP band expected for a single Gln and Asn residue ina typical PPII, β-sheet, or α-helix conformation in proteins. Thelarge widths of the Gln χ3 and Asn χ2 dihedral angle histogramsresult because the residues in the Shapovalov and Dunbrackdatabase exist in a larger distribution of conformations,hydrogen bonding states, and chemical environments than wehave so far encountered in our UVRR investigations.
Experimentally Determined Gln PPII-like StructurePeptide χ3 Dihedral Angles. UVRR Spectra of Gln Peptidesin PPII-like Structures. We examined the UVRR spectra of twopeptides, Gln3 and Asp2-Gln10-Lys2, in order to determine theirsolution-state χ3 angles. Xiong et al.30 previously showed thatAsp2-Gln10-Lys2 exists in predominately PPII-like and 2.51-helix-like conformations when prepared using a “disaggrega-tion” protocol developed by Wetzel and co-workers.63 In thisprotocol, the Asp2-Gln10-Lys2 peptide is initially dissolved in amixture of trifluoroacetic acid and hexafluoroisopropanol.These solvents are subsequently evaporated under dry N2gas, and the peptide is redissolved in pure water.
Table 3. Predicted AmIIIP Frequencies and OCCC Dihedral Angles for Gln and Asn Residues with Different RamachandranAngles
Gln Asn
Φ (deg) Ψ (deg) χ3 (deg) AmIIIP freq (cm−1) χ2 (deg) AmIIIP freq (cm−1)
PPII −65 145 −8 (−22, −32)a 1111 (1106, 1099)a −36 1096β-sheet 115 130 −44, 41 1089, 1080 −6, 56 1075, 1064α-helix −63 −43 −34, 45 1098, 1076 −49, −19, 62 1085, 1107, 1058
aValues in parentheses were measured experimentally for Gln3 and Asp2-Gln10-Lys2.
The Journal of Physical Chemistry B Article
DOI: 10.1021/acs.jpcb.5b07651J. Phys. Chem. B 2015, 119, 13039−13051
13046

The UVRR spectra indicate that Gln3 has predominatelyPPII-like peptide bond conformations. Figure 8a shows the
peak fitted ∼204 nm excitation UVRR spectrum of Gln3 in theregion between 1050 and 1500 cm−1. The AmIII3 region,between ∼1200 and 1280 cm−1, is most sensitive to thesecondary structure of the peptide because its frequencydepends on the Ramachandran Ψ angle.35,37 This region is wellfit by two Gaussian bands located at ∼1210 and ∼1260 cm−1.Using the methodology of Mikhonin et al.,37 we correlated theband peak positions to their Ψ angles. We used their eq 6A tocorrelate the 1210 cm−1 frequency of the AmIII3 band to a Ψangle of 103° ± 3° and the 1260 cm−1 frequency to a Ψ angleof 157° ± 2°. The Ψ angle of ∼157° derives from peptidebonds situated in PPII-like conformations, while the Ψ angle of∼103° derives from peptide bond situated in β-strand-likeconformations. Assuming identical Raman cross sections forthese two different species, we find that the peptide bonds aredominated by PPII-like Ψ angles (∼87 ± 2%), while a smallfraction adopt β-strand-like Ψ angles (∼13 ± 2%). This issupported by the circular dichroism spectra of Gln3 shown inSupporting Information Figure S7, which show a predom-inantly PPII spectral signature.χ3 Dihedral Angle Determination of Side Chains in Gln
Peptides. The AmIIIP bands of Gln3 and Asp2-Gln10-Lys2 arefound in the region between ∼1050 and 1150 cm−1. On thebasis of our normal mode analysis of Gln, we fit this region forGln3 with four bands that derive from CαH rocking/CγH2twisting, Cβ−Cγ stretching/NϵH2 rocking, NH3 rocking/Cα−N
stretching, and the AmIIIP vibrations. For Gln3, these bands arelocated within a broad asymmetric spectral feature at ∼1080,∼1106, ∼1130, and ∼1160 cm−1.We assign these Gln3 bands based on our analysis of Gln. We
assign the ∼1160 cm−1 band to a CαH rocking/CγH2 twistingmode, the ∼1130 cm−1 band to a Cβ−Cγ stretching/NϵH2rocking vibration, and the ∼1080 cm−1 band to a NH3 rocking/Cα−N stretching mode. The ∼1106 cm−1 band appears as alow-frequency shoulder feature and is assigned to the AmIIIP
vibration. This is very close to the predicted AmIIIP vibrationalfrequency band center from the Gaussian fit of PPII-likestructures in Figure 7c, as listed in Table 3. In fact, the AmIIIP
frequency band center of Gln3 differs by only ∼5 cm−1 from thepredicted frequency band center (∼1111 cm−1) for PPIIRamachandran angles.Figure 8b shows the 198−204 nm difference spectrum of
disaggregated Asp2-Gln10-Lys2 published by Xiong et al.30
Xiong et al. showed that excitation at 198 nm enhances theprimary amide UVRR bands more than does excitation at 204nm. Thus, the Figure 8b Asp2-Gln10-Lys2 difference spectrum isdominated by the primary amide Gln side chain bands withlittle interference from the secondary amide peptide bondUVRR bands.The inset in Figure 8b shows the region where the AmIIIP
band of Asp2-Gln10-Lys2 is located. We parsimoniously peak fitthis region to three Gaussian bands located at ∼1099, ∼1118,and ∼1140 cm−1. Using prior knowledge from our analysis ofGln, we assign the bands at ∼1118 and ∼1140 cm−1 to the Cβ−Cγ stretching/NϵH2 rocking and CαH rocking/CγH2 twistingvibrations, respectively. The ∼1099 cm−1 band is assigned tothe AmIIIP band.The AmIIIP bandwidths of Gln3 and Asp2-Gln10-Lys2 are ∼30
cm−1, which is similar to that of Gln in H2O (Figure 2a). Thesebandwidths are roughly twice as large as those found in theRaman spectra of the different Gln and Asn derivative crystals,which we measure to be on average ∼13.3 ± 5.0 cm−1. Thisbandwidth is significantly larger than our spectrometerresolution of ∼4.5 cm−1. Thus, if we assume a Lorentzianband shape, we estimate that the AmIIIP band homogeneousline width for a Gln compound with a well-defined χ3 angle is∼6.6 cm−1. The fact that the AmIIIP bandwidths of solution-state Gln, Gln3, and Asp2-Gln10-Lys2 are much broader thanthose measured in our crystals suggests that there is adistribution of hydrogen bonding states and χ3 angles inthese compounds.Given the estimated homogeneous line width, we can
roughly calculate the distribution of χ3 angles of Gln, Gln3, andAsp2-Gln10-Lys2 by using a methodology that is similar to thatof Asher et al.36 To do this, we assume that theinhomogeneously broadened AmIIIP bands derive from adistribution of different χ3 dihedral angles, which can berepresented as the sum of M Lorentzian bands:
∑νπ ν ν
= ΓΓ + −=
A I( )1
( )i
M
ii1
2
2 2(6)
where Ii is the intensity of a Lorentzian band that occurs at agiven center frequency, νi, and Γ is the homogeneous linewidth.We can apply eq 3 to correlate the νi AmIII
P frequencies ofthe M Lorentzian bands to their corresponding χ3 dihedralangles. As shown in Figure 6, a single AmIIIP frequency cancorrespond to as many as four possible χ3 dihedral angles.
Figure 8. Deconvolution of the UVRR spectra of Gln3 and Asp2-Gln10-Lys2. (a) Fitting the 204 nm excitation UVRR spectrum of Gln3. (b)The 198−204 nm difference spectrum of Asp2-Gln10-Lys2 taken fromXiong et al.30 The inset shows the AmIIIP region of Asp2-Gln10-Lys2.The χred
2 statistics for the spectral fits shown in (a) and (b) are 1.1 and0.74, respectively.
The Journal of Physical Chemistry B Article
DOI: 10.1021/acs.jpcb.5b07651J. Phys. Chem. B 2015, 119, 13039−13051
13047

However, the Shapovalov and Dunbrack database show that χ3dihedral angles that are greater than +90° and less than −90°are nearly forbidden (Figure 7). Thus, we consider only the twoχ3 dihedral angle solutions that are found in the region between−90° and +90°, as shown in Figure 9.
To determine which of the two remaining χ3 dihedral anglesolutions is occurring in our peptides, we first fit the histogramsto the sum of two Gaussians with identical amplitudes, A, andwidths, w, but different center χ3 angles, χ3,1 and χ3,2:
χ = +χ χ χ χ
−− −
− ⎛⎝⎜
⎞⎠⎟
⎛⎝⎜
⎞⎠⎟I Ae Ae( ) w w
3
3 3,12
3 3,22
(7)
The Gln, Gln3, and Asp2-Gln10-Lys2 results all show oneGaussian centered at negative χ3 angles and another Gaussiancentered at positive χ3 angles (Figure 9). For Gln, we assumethat the Gaussian centered at χ3 ∼ −13° is the physicallyrelevant solution based on the neutron diffraction study of Rhyset al.58 For Gln3 and Asp2-Gln10-Lys2, we conclude that theGaussians centered at negative χ3 angles correspond to thephysically relevant solutions to eq 3 because they fall within therange of χ3 dihedral angles most commonly adopted by Glnresidues that populate PPII (Φ, Ψ) angles (Figure 7c).Figure 10 shows the resulting χ3 dihedral angle distributions
for Gln, Gln3, and Asp2-Gln10-Lys2 by assuming the physicallyrelevant solutions to eq 3. The distributions of Gln3 and Asp2-Gln10-Lys2 populate χ3 angles similar to that of Gln. Thissuggests that primary amides of Gln3 and Asp2-Gln10-Lys2 arefully solvated like that of monomeric Gln in water. Thus, the
Gln side chains are not engaged in side chain−backbonepeptide bond hydrogen bonding as previously hypothesized.64
Determination of the Gibbs Free Energy Landscape forGln and Gln Peptides along the χ3 Dihedral Angle ReactionCoordinate. The structure sensitivity of the AmIIIP bandenables us to determine the Gibbs free energy landscape of theGln side chains along the χ3 dihedral angle structure coordinate.To do this, we assume that the probability of each χ3,i angle inthe χ3 dihedral angle distributions of Gln, Gln3, and Asp2-Gln10-Lys2 shown in Figure 10a−c is given by a Boltzmanndistribution:
χ
χ= χ− Δp
pe
( )
( )i G RT3,
3,0
( ( )/ )i3,
(8)
where p(χ3,i)/p(χ3,0) is the ratio of populations with χ3 anglesχ3,i and χ3,0. The angle, χ3,0, is the minimum energy χ3 angle, Ris the molar gas constant, T is the experimental temperature(293 K), and ΔG(χ3,i) = G(χ3,i) − G(χ3,0). We assume in eq 8that each χ3,i dihedral angle state has a degeneracy of one.To calculate the free energy difference, ΔG(χ3,i), between a
particular χ3,i angle and the equilibrium χ3,0 angle, we rearrangeeq 8:
χχ
χΔ = −
⎡⎣⎢⎢
⎤⎦⎥⎥G RT
p
p( ) ln
( )
( )ii
3,3,
3,0 (9)
Figure 9. χ3 dihedral angle historgrams calculated by decomposingAmIIIP bands into a sum of Lorentzians for (a) Gln, (b) Gln3, and (c)Asp2-Gln10-Lys2 in water. Because the solution to eq 3 is double valuedbetween ±90°, the histograms show two peaks. The histograms werefit to two identical Gaussians that differed only in center χ3 dihedralangles (shown in dashed lines). The sum of the Gaussians is shown inthe solid red lines.
Figure 10. Comparison of χ3 dihedral angle distributions between (a)Gln, (b) Gln3 in a predominately PPII-like conformation, and (c)Asp2-Gln10-Lys2 in a PPII/2.51-helix equilibrium. (d) χ3 angledistribution of Gln residues with PPII-like Ramachandran anglesfrom the Shapovalov and Dunbrack database.
The Journal of Physical Chemistry B Article
DOI: 10.1021/acs.jpcb.5b07651J. Phys. Chem. B 2015, 119, 13039−13051
13048
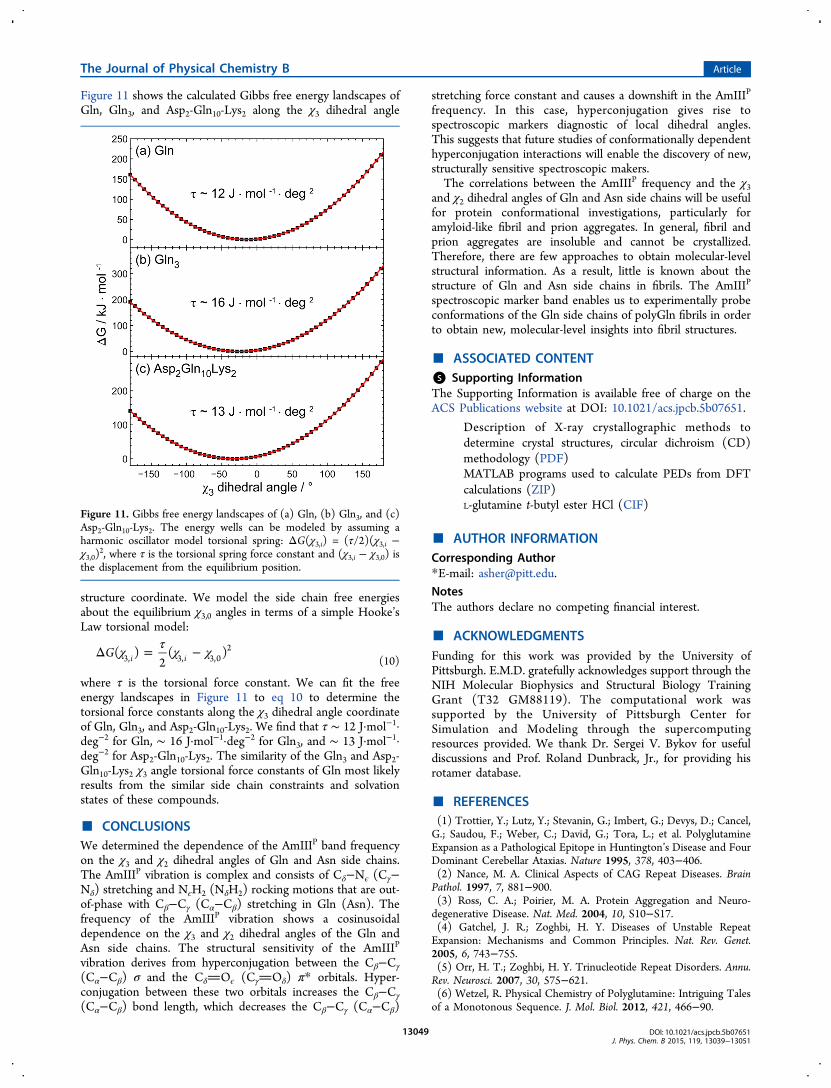
Figure 11 shows the calculated Gibbs free energy landscapes ofGln, Gln3, and Asp2-Gln10-Lys2 along the χ3 dihedral angle
structure coordinate. We model the side chain free energiesabout the equilibrium χ3,0 angles in terms of a simple Hooke’sLaw torsional model:
χ τ χ χΔ = −G( )2
( )i i3, 3, 3,02
(10)
where τ is the torsional force constant. We can fit the freeenergy landscapes in Figure 11 to eq 10 to determine thetorsional force constants along the χ3 dihedral angle coordinateof Gln, Gln3, and Asp2-Gln10-Lys2. We find that τ ∼ 12 J·mol−1·deg−2 for Gln, ∼ 16 J·mol−1·deg−2 for Gln3, and ∼ 13 J·mol−1·deg−2 for Asp2-Gln10-Lys2. The similarity of the Gln3 and Asp2-Gln10-Lys2 χ3 angle torsional force constants of Gln most likelyresults from the similar side chain constraints and solvationstates of these compounds.
■ CONCLUSIONSWe determined the dependence of the AmIIIP band frequencyon the χ3 and χ2 dihedral angles of Gln and Asn side chains.The AmIIIP vibration is complex and consists of Cδ−Nϵ (Cγ−Nδ) stretching and NϵH2 (NδH2) rocking motions that are out-of-phase with Cβ−Cγ (Cα−Cβ) stretching in Gln (Asn). Thefrequency of the AmIIIP vibration shows a cosinusoidaldependence on the χ3 and χ2 dihedral angles of the Gln andAsn side chains. The structural sensitivity of the AmIIIP
vibration derives from hyperconjugation between the Cβ−Cγ
(Cα−Cβ) σ and the CδOϵ (CγOδ) π* orbitals. Hyper-conjugation between these two orbitals increases the Cβ−Cγ
(Cα−Cβ) bond length, which decreases the Cβ−Cγ (Cα−Cβ)
stretching force constant and causes a downshift in the AmIIIP
frequency. In this case, hyperconjugation gives rise tospectroscopic markers diagnostic of local dihedral angles.This suggests that future studies of conformationally dependenthyperconjugation interactions will enable the discovery of new,structurally sensitive spectroscopic makers.The correlations between the AmIIIP frequency and the χ3
and χ2 dihedral angles of Gln and Asn side chains will be usefulfor protein conformational investigations, particularly foramyloid-like fibril and prion aggregates. In general, fibril andprion aggregates are insoluble and cannot be crystallized.Therefore, there are few approaches to obtain molecular-levelstructural information. As a result, little is known about thestructure of Gln and Asn side chains in fibrils. The AmIIIP
spectroscopic marker band enables us to experimentally probeconformations of the Gln side chains of polyGln fibrils in orderto obtain new, molecular-level insights into fibril structures.
■ ASSOCIATED CONTENT*S Supporting InformationThe Supporting Information is available free of charge on theACS Publications website at DOI: 10.1021/acs.jpcb.5b07651.
Description of X-ray crystallographic methods todetermine crystal structures, circular dichroism (CD)methodology (PDF)MATLAB programs used to calculate PEDs from DFTcalculations (ZIP)L-glutamine t-butyl ester HCl (CIF)
■ AUTHOR INFORMATIONCorresponding Author*E-mail: [email protected] authors declare no competing financial interest.
■ ACKNOWLEDGMENTSFunding for this work was provided by the University ofPittsburgh. E.M.D. gratefully acknowledges support through theNIH Molecular Biophysics and Structural Biology TrainingGrant (T32 GM88119). The computational work wassupported by the University of Pittsburgh Center forSimulation and Modeling through the supercomputingresources provided. We thank Dr. Sergei V. Bykov for usefuldiscussions and Prof. Roland Dunbrack, Jr., for providing hisrotamer database.
■ REFERENCES(1) Trottier, Y.; Lutz, Y.; Stevanin, G.; Imbert, G.; Devys, D.; Cancel,G.; Saudou, F.; Weber, C.; David, G.; Tora, L.; et al. PolyglutamineExpansion as a Pathological Epitope in Huntington’s Disease and FourDominant Cerebellar Ataxias. Nature 1995, 378, 403−406.(2) Nance, M. A. Clinical Aspects of CAG Repeat Diseases. BrainPathol. 1997, 7, 881−900.(3) Ross, C. A.; Poirier, M. A. Protein Aggregation and Neuro-degenerative Disease. Nat. Med. 2004, 10, S10−S17.(4) Gatchel, J. R.; Zoghbi, H. Y. Diseases of Unstable RepeatExpansion: Mechanisms and Common Principles. Nat. Rev. Genet.2005, 6, 743−755.(5) Orr, H. T.; Zoghbi, H. Y. Trinucleotide Repeat Disorders. Annu.Rev. Neurosci. 2007, 30, 575−621.(6) Wetzel, R. Physical Chemistry of Polyglutamine: Intriguing Talesof a Monotonous Sequence. J. Mol. Biol. 2012, 421, 466−90.
Figure 11. Gibbs free energy landscapes of (a) Gln, (b) Gln3, and (c)Asp2-Gln10-Lys2. The energy wells can be modeled by assuming aharmonic oscillator model torsional spring: ΔG(χ3,i) = (τ/2)(χ3,i −χ3,0)
2, where τ is the torsional spring force constant and (χ3,i − χ3,0) isthe displacement from the equilibrium position.
The Journal of Physical Chemistry B Article
DOI: 10.1021/acs.jpcb.5b07651J. Phys. Chem. B 2015, 119, 13039−13051
13049

(7) Murphy, R. M.; Walters, R. H.; Tobelmann, M. D.; Bernacki, J. P.In Non-fibrillar Amyloidogenic Protein AssembliesCommon CytotoxinsUnderlying Degenerative Diseases; Rahimi, F., Bitan, G., Eds.; Springer:Dordrecht, The Netherlands, 2012; Chapter 11, pp 337−375.(8) Arrasate, M.; Finkbeiner, S. Protein Aggregates in Huntington’sDisease. Exp. Neurol. 2012, 238, 1−11.(9) Blum, E. S.; Schwendeman, A. R.; Shaham, S. PolyQ Disease:Misfiring of a Developmental Cell Death Program? Trends Cell Biol.2013, 23, 168−174.(10) Michelitsch, M. D.; Weissman, J. S. A Census of Glutamine/Asparagine-rich Regions: Implications for their Conserved Functionand the Prediction of Novel Prions. Proc. Natl. Acad. Sci. U. S. A. 2000,97, 11910−11915.(11) Sivanandam, V. N.; Jayaraman, M.; Hoop, C. L.; Kodali, R.;Wetzel, R.; van der Wel, P. C. A. The Aggregation-EnhancingHuntingtin N-Terminus Is Helical in Amyloid Fibrils. J. Am. Chem. Soc.2011, 133, 4558−4566.(12) Schneider, R.; Schumacher, M. C.; Mueller, H.; Nand, D.;Klaukien, V.; Heise, H.; Riedel, D.; Wolf, G.; Behrmann, E.; Raunser,S.; et al. Structural Characterization of Polyglutamine Fibrils by Solid-State NMR Spectroscopy. J. Mol. Biol. 2011, 412, 121−136.(13) Kar, K.; Hoop, C. L.; Drombosky, K. W.; Baker, M. A.; Kodali,R.; Arduini, I.; van der Wel, P. C.; Horne, W. S.; Wetzel, R. β-Hairpin-Mediated Nucleation of Polyglutamine Amyloid Formation. J. Mol.Biol. 2013, 425, 1183−1197.(14) Sharma, D.; Shinchuk, L. M.; Inouye, H.; Wetzel, R.; Kirschner,D. A. Polyglutamine Homopolymers Having 8−45 Residues FormSlablike β-crystallite Assemblies. Proteins: Struct., Funct., Genet. 2005,61, 398−411.(15) Nelson, R.; Sawaya, M. R.; Balbirnie, M.; Madsen, A. O.; Riekel,C.; Grothe, R.; Eisenberg, D. Structure of the Cross-β Spine ofAmyloid-like Fibrils. Nature 2005, 435, 773−778.(16) Wiltzius, J. J. W.; Landau, M.; Nelson, R.; Sawaya, M. R.;Apostol, M. I.; Goldschmidt, L.; Soriaga, A. B.; Cascio, D.;Rajashankar, K.; Eisenberg, D. Molecular Mechanisms for Protein-Encoded Inheritance. Nat. Struct. Mol. Biol. 2009, 16, 973−8.(17) Caswell, D. S.; Spiro, T. G. Ultraviolet Resonance RamanSpectroscopy of Imidazole, Histidine, and Cu(Imidazole)4
2+: Implica-tions for Protein Studies. J. Am. Chem. Soc. 1986, 108, 6470−6477.(18) Miura, T.; Takeuchi, H.; Harada, I. Tryptophan Raman BandsSensitive to Hydrogen Bonding and Side-chain Conformation. J.Raman Spectrosc. 1989, 20, 667−671.(19) Harhay, G. P.; Hudson, B. S. Ultraviolet Resonance RamanStudy of Proline Isomerization. J. Phys. Chem. 1991, 95, 3511−3513.(20) Markham, L. M.; Mayne, L. C.; Hudson, B. S.; Zgierski, M. Z.Resonance Raman Studies of Imidazole, Imidazolium, and theirDerivatives: the Effect of Deuterium Substitution. J. Phys. Chem. 1993,97, 10319−10325.(21) Maruyama, T.; Takeuchi, H. Effects of Hydrogen Bonding andSide-chain Conformation on the Raman bands of Tryptophan-2,4,5,6,7-d5. J. Raman Spectrosc. 1995, 26, 319−324.(22) Jordan, T.; Mukerji, I.; Wang, Y.; Spiro, T. G. UV ResonanceRaman Spectroscopy and Hydrogen Bonding of the Proline PeptideBond. J. Mol. Struct. 1996, 379, 51−64.(23) Chi, Z.; Asher, S. A. UV Raman Determination of theEnvironment and Solvent Exposure of Tyr and Trp Residues. J. Phys.Chem. B 1998, 102, 9595−9602.(24) Ahmed, Z.; Myshakina, N. S.; Asher, S. A. Dependence of theAmII’p Proline Raman Band on Peptide Conformation. J. Phys. Chem.B 2009, 113, 11252−11259.(25) Takeuchi, H. Raman Spectral Marker of TryptophanConformation: Theoretical Basis and Extension to a Wider Range ofTorsional Angle. J. Mol. Struct. 2012, 1023, 143−148.(26) Oladepo, S. A.; Xiong, K.; Hong, Z.; Asher, S. A.; Handen, J.;Lednev, I. K. UV Resonance Raman Investigations of Peptide andProtein Structure and Dynamics. Chem. Rev. 2012, 112, 2604−2628.(27) Hong, Z.; Wert, J.; Asher, S. A. UV Resonance Raman and DFTStudies of Arginine Side Chains in Peptides: Insights into ArginineHydration. J. Phys. Chem. B 2013, 117, 7145−7156.
(28) Punihaole, D.; Jakubek, R. S.; Dahlburg, E. M.; Hong, Z.;Myshakina, N. S.; Geib, S.; Asher, S. A. UV Resonance RamanInvestigation of the Aqueous Solvation Dependence of Primary AmideVibrations. J. Phys. Chem. B 2015, 119, 3931−3939.(29) Dudik, J. M.; Johnson, C. R.; Asher, S. A. UV Resonance RamanStudies of Acetone, Acetamide, and N-Methylacetamide: Models forthe Peptide Bond. J. Phys. Chem. 1985, 89, 3805−3814.(30) Xiong, K.; Punihaole, D.; Asher, S. A. UV Resonance RamanSpectroscopy Monitors Polyglutamine Backbone and Side ChainHydrogen Bonding and Fibrillization. Biochemistry 2012, 51, 5822−5830.(31) Wang, Y.; Purrello, R.; Georgiou, S.; Spiro, T. G. UVRRSpectroscopy of the Peptide Bond. 2. Carbonyl H-Bond Effects on theGround- and Excited-State Structures of N-methylacetamide. J. Am.Chem. Soc. 1991, 113, 6368−6377.(32) Triggs, N. E.; Valentini, J. J. An Investigation of HydrogenBonding in Amides Using Raman Spectroscopy. J. Phys. Chem. 1992,96, 6922−6931.(33) Markham, L. M.; Hudson, B. S. Ab Initio Analysis of the Effectsof Aqueous Solvation on the Resonance Raman Intensities of N-Methylacetamide. J. Phys. Chem. 1996, 100, 2731−2737.(34) Myshakina, N. S.; Ahmed, Z.; Asher, S. A. Dependence ofAmide Vibrations on Hydrogen Bonding. J. Phys. Chem. B 2008, 112,11873−11877.(35) Asher, S. A.; Ianoul, A.; Mix, G.; Boyden, M. N.; Karnoup, A.;Diem, M.; Schweitzer-Stenner, R. Dihedral ψ Angle Dependence ofthe Amide III Vibration: A Uniquely Sensitive UV Resonance RamanSecondary Structural Probe. J. Am. Chem. Soc. 2001, 123, 11775−11781.(36) Asher, S. A.; Mikhonin, A. V.; Bykov, S. UV RamanDemonstrates that α-Helical Polyalanine Peptides Melt to PolyprolineII Conformations. J. Am. Chem. Soc. 2004, 126, 8433−8440.(37) Mikhonin, A. V.; Bykov, S. V.; Myshakina, N. S.; Asher, S. A.Peptide Secondary Structure Folding Reaction Coordinate: Correla-tion Between UV Raman Amide III Frequency, Ψ RamachandranAngle, and Hydrogen Bonding. J. Phys. Chem. B 2006, 110, 1928−1943.(38) Mikhonin, A. V.; Asher, S. A. Direct UV Raman Monitoring of310-Helix and π-Bulge Premelting During α-Helix Unfolding. J. Am.Chem. Soc. 2006, 128, 13789−13795.(39) Ma, L.; Ahmed, Z.; Mikhonin, A. V.; Asher, S. A. UV ResonanceRaman Measurements of Poly-L-Lysine’s Conformational EnergyLandscapes: Dependence on Perchlorate Concentration and Temper-ature. J. Phys. Chem. B 2007, 111, 7675−7680.(40) Xiong, K.; Asciutto, E. K.; Madura, J. D.; Asher, S. A. SaltDependence of an α-Helical Peptide Folding Energy Landscapes.Biochemistry 2009, 48, 10818−10826.(41) Xiong, K.; Asher, S. A. Circular Dichroism and UV ResonanceRaman Study of the Impact of Alcohols on the Gibbs Free EnergyLandscape of an α-Helical Peptide. Biochemistry 2010, 49, 3336−3342.(42) Ma, L.; Hong, Z.; Sharma, B.; Asher, S. A. UV ResonanceRaman Studies of the NaClO4 Dependence of Poly-L-lysineConformation and Hydrogen Exchange Kinetics. J. Phys. Chem. B2012, 116, 1134−1142.(43) Hong, Z.; Damodaran, K.; Asher, S. A. Sodium Dodecyl SulfateMonomers Induce XAO Peptide Polyproline II to α-Helix Transition.J. Phys. Chem. B 2014, 118, 10565−10575.(44) Shapovalov, M.; Dunbrack, R. L. A Smoothed Backbone-Dependent Rotamer Library for Proteins Derived from AdaptiveKernel Density Estimates and Regressions. Structure 2011, 19, 844−858.(45) Shimanouchi, T. Tables of Molecular Vibrational FrequenciesConsolidated Volume I; National Bureau of Standards: Gaithersburg,MD, 1972.(46) Asher, S. A.; Bormett, R. W.; Chen, X. G.; Lemmon, D. H.; Cho,N.; Peterson, P.; Arrigoni, M.; Spinelli, L.; Cannon, J. UV ResonanceRaman Spectroscopy Using a New CW Laser Source: Convenienceand Experimental Simplicity. Appl. Spectrosc. 1993, 47, 628−633.
The Journal of Physical Chemistry B Article
DOI: 10.1021/acs.jpcb.5b07651J. Phys. Chem. B 2015, 119, 13039−13051
13050

(47) Bykov, S.; Lednev, I.; Ianoul, A.; Mikhonin, A.; Munro, C.;Asher, S. A. Steady-State and Transient Ultraviolet Resonance RamanSpectrometer for the 193−270 nm Spectral Region. Appl. Spectrosc.2005, 59, 1541−1552.(48) Kohn, W.; Sham, L. J. Self-Consistent Equations IncludingExchange and Correlation Effects. Phys. Rev. 1965, 140, A1133−A1138.(49) Frisch, M. J.; Trucks, G. W.; Schlegel, H. B.; Scuseria, G. E.;Robb, M. A.; Cheeseman, J. R.; Scalmani, G.; Barone, V.; Mennucci,B.; Petersson, G. A. et al. Gaussian09, revision D.01; Gaussian Inc.:Wallingford, CT, 2009.(50) Zhao, Y.; Truhlar, D. The M06 Suite of Density Functionals forMain Group Thermochemistry, Thermochemical Kinetics, Non-covalent Interactions, Excited States, and Transition Elements: TwoNew Functionals and Systematic Testing of Four M06-classFunctionals and 12 Other Functionals. Theor. Chem. Acc. 2008, 120,215−241.(51) Dhamelincourt, P.; Ramirez, F. Polarized Micro-Raman and FT-IR Spectra of L-Glutamine. Appl. Spectrosc. 1993, 47, 446−451.(52) Ramírez, F. J.; Tunon, I.; Silla, E. Amino Acid Chemistry inSolution: Structural Study and Vibrational Dynamics of Glutamine inSolution. An ab Initio Reaction Field Model. J. Phys. Chem. B 1998,102, 6290−6298.(53) Clark, L. B. Polarization Assignments in the Vacuum UVSpectra of the Primary Amide, Carboxyl, and Peptide Groups. J. Am.Chem. Soc. 1995, 117, 7974−7986.(54) Bohlmann, F. Zur Konfigurationsbestimmung von Chinolizin-Derivaten. Angew. Chem. 1957, 69, 641−642.(55) Lii, J.-H.; Chen, K.-H.; Allinger, N. L. Alcohols, Ethers,Carbohydrates, and Related Compounds Part V. The BohlmannTorsional Effect. J. Phys. Chem. A 2004, 108, 3006−3015.(56) Bykov, S. V.; Myshakina, N. S.; Asher, S. A. Dependence ofGlycine CH2 Stretching Frequencies on Conformation, IonizationState, and Hydrogen Bonding. J. Phys. Chem. B 2008, 112, 5803−5812.(57) Adhikary, R.; Zimmermann, J.; Liu, J.; Forrest, R. P.; Janicki, T.D.; Dawson, P. E.; Corcelli, S. A.; Romesberg, F. E. Evidence of anUnusual N-H N Hydrogen Bond in Proteins. J. Am. Chem. Soc. 2014,136, 13474−13477.(58) Rhys, N. H.; Soper, A. K.; Dougan, L. The Hydrogen-BondingAbility of the Amino Acid Glutamine Revealed by Neutron DiffractionExperiments. J. Phys. Chem. B 2012, 116, 13308−13319.(59) Cochran, W.; Penfold, B. R. The Crystal Structure of L-Glutamine. Acta Crystallogr. 1952, 5, 644−653.(60) Mikhonin, A. V.; Myshakina, N. S.; Bykov, S. V.; Asher, S. A. UVResonance Raman Determination of Polyproline II, Extended 2.51-helix, and β-sheet Ψ Angle Energy Landscape in Poly-L-Lysine andPoly-L-Glutamic Acid. J. Am. Chem. Soc. 2005, 127, 7712−20.(61) Richardson, J. S. The Anatomy and Taxonomy of ProteinStructure; Academic Press: New York, 1981; Vol. 34.(62) Hollingsworth, S. A.; Berkholz, D. S.; Karplus, P. A. On theOccurrence of Linear Groups in Proteins. Protein Sci. 2009, 18, 1321−1325.(63) Chen, S.; Wetzel, R. Solubilization and Disaggregation ofPolyglutamine Peptides. Protein Sci. 2001, 10, 887−891.(64) Chellgren, B. W.; Miller, A.; Creamer, T. P. Evidence forPolyproline II Helical Structure in Short Polyglutamine Tracts. J. Mol.Biol. 2006, 361, 362−371.
The Journal of Physical Chemistry B Article
DOI: 10.1021/acs.jpcb.5b07651J. Phys. Chem. B 2015, 119, 13039−13051
13051