Embed Size (px)
Citation preview

Ferdinando Giacco,1,2 Xueliang Du,1,2 Anna Carratú,3 Gary J. Gerfen,4
Maria D’Apolito,5 Ida Giardino,6 Andrea Rasola,7 Oriano Marin,7 Ajit S. Divakaruni,8
Anne N. Murphy,8 Manasi S. Shah,1,2 and Michael Brownlee1,2,9
GLP-1 Cleavage Product ReversesPersistent ROS Generation AfterTransient Hyperglycemia by Disruptingan ROS-Generating Feedback LoopDiabetes 2015;64:3273–3284 | DOI: 10.2337/db15-0084
The assumption underlying current diabetes treatmentis that lowering the level of time-averaged glucoseconcentrations, measured as HbA1c, prevents microvas-cular complications. However, 89% of variation in risk ofretinopathy, microalbuminuria, or albuminuria is due toelements of glycemia not captured by mean HbA1c val-ues. We show that transient exposure to high glucoseactivates a multicomponent feedback loop that causesa stable left shift of the glucose concentration-reactiveoxygen species (ROS) dose-response curve. Feedbackloop disruption by the GLP-1 cleavage product GLP-1(9–36)amide reverses the persistent left shift, thereby nor-malizing persistent overproduction of ROS and its path-ophysiologic consequences. These data suggest thathyperglycemic spikes high enough to activate persistentROS production during subsequent periods of normalglycemia but too brief to affect the HbA1c value are amajor determinant of the 89% of diabetes complicationsrisk not captured by HbA1c. The phenomenon andmechanism described in this study provide a basis forthe development of both new biomarkers to comple-ment HbA1c and novel therapeutic agents, includingGLP-1(9–36)amide, for the prevention and treatment ofdiabetes complications.
The assumption underlying current clinical treatment oftype 1 diabetes is that lowering the level of time-averaged
glucose concentrations, measured as HbA1c, prevents thedevelopment and progression of vascular complications.This current treatment recommendation, adopted by di-abetes professional societies around the world, is based ondata from the Diabetes Control and Complications Trial(DCCT) (1), where the intensive treatment group hada 73% reduction in risk of sustained retinopathy progres-sion compared with the standard treatment group.
Of note, subsequent analysis of DCCT data by theDCCT/Epidemiology of Diabetes Interventions and Com-plications (EDIC) Research Group showed that for theentire study population, HbA1c values explained only 6.6–11% of the risk of retinopathy, albuminuria, or microal-buminuria. The DCCT/EDIC Research Group concludedthat the unexplained 89% of variation in risk is due toelements of glycemia not captured by mean HbA1c values(2,3). The nature and identity of those elements are notyet understood.
HbA1c represents the time-averaged mean level of gly-cemia and thus provides no information about howclosely the fluctuations of blood glucose levels aroundthat mean mimic the normal narrow range of blood glu-cose excursion. Continuous glucose monitoring data showthat in patients with type 1 diabetes with identical HbA1c
values, amplitude and duration of glycemic spikes differsignificantly (4). This suggests to us that a potential majordeterminant of complications not captured by HbA1c
1Diabetes Research Center, Albert Einstein College of Medicine, Bronx, NY2Department of Medicine, Albert Einstein College of Medicine, Bronx, NY3Department of Pharmaceutical and Biomedical Sciences, University of Salerno,Salerno, Italy4Department of Physiology and Biophysics, Albert Einstein College of Medicine,Bronx, NY5Institute of Pediatrics, Department of Medical and Surgical Sciences, Universityof Foggia, Foggia, Italy6Department of Clinical and Experimental Medicine, University of Foggia, Foggia,Italy7Department of Biomedical Science, University of Padua, Padua, Italy
8Department of Pharmacology, University of California, San Diego, La Jolla, CA9Department of Pathology, Albert Einstein College of Medicine, Bronx, NY
Corresponding author: Michael Brownlee, [email protected].
Received 20 January 2015 and accepted 6 May 2015.
This article contains Supplementary Data online at http://diabetes.diabetesjournals.org/lookup/suppl/doi:10.2337/db15-0084/-/DC1.
F.G. and X.D. contributed equally to this work.
© 2015 by the American Diabetes Association. Readers may use this article aslong as the work is properly cited, the use is educational and not for profit, andthe work is not altered.
Diabetes Volume 64, September 2015 3273
COMPLIC
ATIO
NS
could be hyperglycemic spikes high enough to activatecomplication-causing mechanisms but too brief to affectthe HbA1c value (5).
Because hyperglycemia-induced overproduction of mito-chondrial reactive oxygen species (ROS) initiates many ofthe complex series of molecular events that result indiabetic tissue damage (6), we hypothesized that transientexposure to high glucose causes persistent mitochondrialoverproduction of ROS during subsequent prolonged peri-ods of normal glucose. Mitochondrial ROS generation in-creases when the inner mitochondrial transmembranepotential (DC) exceeds a threshold level (7). Maintaininga constant level of DC requires binding of the glycolyticenzyme hexokinase II (HK-II) to the outer mitochondrialmembrane protein VDAC (voltage-dependent anion chan-nel). The HK-II/VDAC association is regulated by severalmechanisms (8–10). Because activated glycogen synthasekinase-3b (GSK-3b) phosphorylates VDAC in the mitochon-drial outer membrane of HeLa cells, preventing VDAC as-sociation with hexokinase (11), we speculated that invascular cells, activation of GSK-3b by transient hypergly-cemia could be a critical element in a multicomponent feed-back loop that would maintain persistently increased ROSproduction during subsequent periods of normoglycemia.
GLP-1(9–36)amide, originally considered to be an inac-tive degradation product of GLP-1(7–36)amide, has impor-tant physiologic effects distinct from GLP-1 (12). Inhippocampal slices from the APP/presenilin 1 (PS1)mouse model of Alzheimer disease, continuous exposureto this GLP-1 cleavage product reduced elevated mito-chondrial superoxide and increased levels of the inhibi-tory phosphorylation of GSK-3b at serine 9 (13).
In the current study, we show that transient exposureto high glucose activates a multicomponent feedback loopinvolving mitochondrial superoxide-induced release of freeiron and H2O2. As a consequence, protein phosphatase 2(PP2A) is activated and dephosphorylates Akt1, reducingits activity. Reduced Akt1 activity decreases inhibitoryphosphorylation of GSK-3b, resulting in increased phos-phorylation of VDAC. Impaired association of phosphory-lated VDAC with the glycolytic enzyme hexokinase causesa stable left shift of the glucose concentration-ROS dose-response curve (Fig. 3). Feedback loop disruption by theGLP-1 cleavage product GLP-1(9–36)amide reverses the per-sistent left shift, thereby normalizing persistent ROS pro-duction and its pathophysiologic consequences in culturedendothelial cells and in mice after transient hyperglycemia.
RESEARCH DESIGN AND METHODS
Cell Culture Conditions and MaterialsHuman aortic endothelial cells (HAECs) were fromInvitrogen (Grand Island, NY) and maintained in endo-thelial cell growth medium-2 containing 0.4% FBS plusgrowth factor additives obtained from Lonza (Walkersville,MD). Microcystin, okadaic acid, and deferoxamine mesy-late used at 25 nmol/L, 0.1 mg/mL, and 100 mmol/L,respectively, were from Sigma-Aldrich (St. Louis, MO).
[g32P]ATP was from GE Healthcare Life Sciences (Piscataway,NJ). TAT-Scr and TAT-HK peptides used at 10 mmol/Lwere synthesized as previously described (14). To preventTAT-HK–induced cell death (14), cells treated with TAT-HK and TAT-Scr were pretreated for 1 h with 1 mmol/Lcyclosporin A. GLP-1(9–36)amide used at 100 pmol/L wasfrom Bachem (Torrance, CA). GSK-3b inhibitory peptideused at 10 mmol/L was obtained from EMD (San Diego,CA). Antibodies to GSK-3b, p-GSK-3b (S9), HK-II, andVDAC were from Cell Signaling Technology (Danvers,MA), BD Bioscience (San Diego, CA), and Santa Cruz Bio-technology (Dallas, TX), respectively. Antibodies to p-Thrwere from Invitrogen. Mitochondrial isoform of superoxidedismutase (Mn-SOD), empty vector, and catalase adenovi-rus were obtained as previously described (15). Constitu-tively active GSK-3b adenovirus and plasmids containingconstitutively activated Akt1 (Akt-1CA) and dominant neg-ative Akt (Akt-DN) were gifts from M. Birnbaum, Univer-sity of Pennsylvania. Akt-1CA and Akt-DN cDNAs weresubcloned into a shuttle vector for adenoviral particle pack-aging (15). Adenoviruses were used at a multiplicity of in-fection of 100. Six- to 8-week-old C57BL/6 mice werepurchased from The Jackson Laboratory (Bar Harbor, ME).
ROS MeasurementCells were plated in 96-well cell culture plates. IntracellularROS were detected using the fluorescent probe CM-H2DCFDA, which reacts with superoxide, H2O2, hydroxylradical, and ONOO2. Cells were loaded with 10 mmol/LCM-H2DCFDA after two washes with no phenol red min-imum essential medium, incubated for 45 min at 37°C, andanalyzed with an HTS 7000 Bio Assay Fluorescent PlateReader (PerkinElmer) using the HTSoft program (16).
Mitochondrial Membrane Potential MeasurementMitochondrial membrane potential was assessed usingJC-1 dye from Life Technologies.
Immunoprecipitation and Western BlottingImmunoprecipitation (IP) and Western blot (WB) experi-ments were performed as previously described (15).
Determination of Kinase ActivityGSK-3b and Akt1 activities were measured using a kitfrom Sigma-Aldrich and Cell Signaling Technology, respec-tively. The effect of GLP-1(9–36)amide on Akt1 activity wasmeasured as described in the Supplementary Data.
Determination of PP2A ActivityPP2A activity was analyzed using a kit from R&D Systems.
Determination of Intracellular Free IronFree iron was measured by electron paramagnetic reso-nance (EPR) using a modification of the method describedby Srinivasan et al. (17). See Supplementary Data fordetails.
Induction of Transient Hyperglycemia in Nondiabetic,Normoglycemic MiceTransient hyperglycemia was induced as previously de-scribed (18).
3274 Persistent ROS Generation During Normal Glucose Diabetes Volume 64, September 2015
Prostacyclin Synthase ActivityProstacyclin synthase (PGI2) activity was measured by de-termination of 6-keto-PGF-1a as previously described (19).
StatisticsROS data are expressed as mean 6 SEM. All other dataare expressed as mean 6 SD. ANOVA in conjunction withthe Tukey-Kramer test was used for comparison of exper-imental groups. Statistical analyses were performed usingPHStat2 software.
RESULTS
Transient Exposure to High Glucose InducesPersistent Mitochondrial ROS Production by Shiftingthe Glucose Concentration-ROS Curve to the LeftExposure of HAECs to 25 mmol/L glucose for 6 h induceda 2.5-fold increase in ROS production (Fig. 1A, bar 2). Ofnote, the increase in ROS production induced by 6 h of 25mmol/L glucose persisted for 2 days of subsequent incuba-tion in 5 mmol/L glucose (Fig. 1A, bar 3). The increased ROSproduction induced by transient high glucose was preventedby overexpression of Mn-SOD (Fig. 1A, bar 4). Mn-SODoverexpression was confirmed by Western blot (data availableon request). Cu/Zn-SOD also prevented a high glucose–induced increased ROS (Supplementary Fig. 1). Theobservations that both Mn-SOD and Cu/Zn-SOD preventglucose-induced ROS are best explained by a mitochondrialorigin of superoxide with Cu/Zn-SOD carrying out dismuta-tion in the mitochondrial intermembrane space. To deter-mine the exposure time necessary to reach the ROS levelsobserved at 6 h, a time course experiment was performed inwhich HAECs were exposed to 25 mmol/L glucose for in-creasing times up to 6 h (Fig. 1B). Maximal ROS levels werereached at 1 h and unchanged after 2–6 h exposure to highglucose (Fig. 1B). Because maximal ROS levels were reachedafter 1 h of exposure to 25 mmol/L glucose, a similar time-course experiment was performed to determine how manyhours of transient high glucose were required to inducepersistent elevation of ROS production after 2 days’ expo-sure to 5 mmol/L glucose (Fig. 1C). Although only 1 h ofexposure to 25 mmol/L glucose was sufficient to inducemaximal ROS production (Fig. 1B), induction of persistentelevation of ROS production for 2 days of subsequent ex-posure to 5 mmol/L glucose required a minimum of 4 htransient exposure to 25 mmol/L glucose (Fig. 1C).
To understand how 6 h of exposure to 25 mmol/Lglucose caused persistent elevation of ROS productionduring 2 days of subsequent exposure to 5 mmol/Lglucose, cells were incubated for 6 h in either 5 or 25mmol/L glucose. Both groups of cells were then incubatedin 5 mmol/L glucose for 2 days. After that 2-day in-cubation in 5 mmol/L glucose, cells from both groups wereexposed to various concentrations of glucose for 6 hand ROS measured using CM-H2DCFDA (Fig. 1D).
In the dose-response curve from cells exposed only to 5mmol/L glucose, ROS production did not increase signifi-cantly between glucose concentrations of 5 and 8 mmol/L.From 9 to 12 mmol/L glucose, ROS production increased
rapidly until reaching a maximum at 12 mmol/L. Furtherincreases in ROS were not induced by exposure to higherconcentrations of glucose. In contrast, cells transientlypreexposed to 25 mmol/L glucose showed a left shift inthe glucose concentration-ROS dose-response curves after 2days’ exposure to 5 mmol/L glucose. In these cells, ROSproduction increased rapidly from 2.5 to 5 mmol/L glucose,reaching the same maximal level at 5 mmol/L glucose as themaximal level reached at 12 mmol/L in cells incubated onlyin 5 mmol/L glucose. Further increases in ROS were notinduced by exposure to concentrations of glucose.5 mmol/L.
Persistent Mitochondrial ROS Production AfterTransient Exposure to High Glucose Is Maintained bya Multicomponent Feedback Loop
Transient Exposure to High Glucose Inducesa Persistent Reduction in HK-II/VDAC AssociationMitochondrial ROS generation increases when DCexceeds a threshold level (7). Maintaining a constant levelof DC requires binding of the glycolytic enzyme HK-II tothe outer mitochondrial membrane protein VDAC. Thisbinding regulates shuttling of ATP out of and ADP intothe mitochondrial matrix.
In HAECs, DC and ROS were both increased by 6 h ofexposure to 25 mmol/L glucose (Fig. 2A, top and bottompanels). In 5 mmol/L glucose, dissociation of HK-II fromVDAC induced by a cell-permeable HK-II N-terminal pep-tide, HK-TAT (14), caused an increase in HAEC DC andROS identical to that induced by exposure to 25 mmol/Lglucose for 6 h (Fig. 2A, top and bottom panels). More-over, maximal respiration was reduced by ;38% after 6 hof exposure to 25 mmol/L glucose (Supplementary Fig. 2).This result suggests that oxidative damage to enzymes ofthe tricarboxylic acid cycle, the electron transport chain(ETC), or the inner mitochondrial membrane lipids oc-curred by 6 h of 25 mmol/L glucose incubation (20,21).
Because dissociation of HK-II from VDAC in thepresence of 5 mmol/L glucose increased HAEC DC andROS production to the same extent as exposure of thesecells to 25 mmol/L glucose, we next asked whether exposureof HAECs to 25 mmol/L glucose would cause dissociation ofHK-II from VDAC. The association of HK-II with VDAC wasevaluated by coimmunoprecipitation (IP:VDAC, WB:HK-II)after 1, 2, 3, 4, 5, and 6 h of exposure of HAECs to 25mmol/L glucose (Fig. 2B). HK-II/VDAC association was re-duced by 50% at 3 h and by 75% at 6 h. Consistent with thepersistence of increased ROS production in 5 mmol/L glu-cose after transient exposure to 25 mmol/L glucose, theHK-II dissociation from VDAC induced by 6 h of exposureto 25 mmol/L glucose also persisted for 2 days of subse-quent exposure to 5 mmol/L glucose (Fig. 2B, red bar).
HK-II/VDAC association is regulated by several mecha-nisms (8–10). VDAC threonine phosphorylation by GSK-3bcauses detachment of HK-II from VDAC (8). To determinewhether the HK-II/VDAC dissociation induced by transientexposure to high glucose was caused by increased threonineVDAC phosphorylation, IP-WB experiments were performed
diabetes.diabetesjournals.org Giacco and Associates 3275

Figure 1—Transient exposure to high glucose induces persistent mitochondrial ROS production by shifting the glucose concentration-ROScurve to the left. A: ROS levels in HAECs exposed to 25 mmol/L glucose for 6 h (green bar) and 25 mmol/L glucose for 6 h followed by2 days (d) of subsequent incubation in 5 mmol/L glucose (red bars). In the indicated groups, cells were infected with Mn-SOD or controladenoviral vectors before transient exposure to 25 mmol/L glucose. B: ROS levels in HAECs exposed to 25 mmol/L glucose for varyingtimes. C: ROS levels after 2 days of incubation in 5 mmol/L glucose following transient exposure to 25 mmol/L glucose for varying times.D: Glucose concentration-ROS dose-response curves from HAECs transiently exposed to 25 mmol/L glucose (6 h) and then to 5 mmol/Lglucose for 2 days (red line) and from HAECs exposed to 5 mmol/L glucose for 6 h continued for 2 days (blue line). ROS levels weremeasured by CM-H2DCFDA. Data are mean 6 SEM from three independent experiments with at least eight technical replicates. *P < 0.05.
3276 Persistent ROS Generation During Normal Glucose Diabetes Volume 64, September 2015

Figure 2—Persistent mitochondrial ROS production after transient exposure to high glucose is maintained by activation of a multicomponentfeedback loop. A: Inner mitochondrial transmembrane potential and ROS level in HAECs after transient exposure to 25 mmol/L glucose ordissociation of HK-II from VDAC with the cell-permeable HK-II N-terminal peptide HK-TAT in 5 mmol/L glucose. Top panel shows representativephotomicrographs of increased JC-1 red fluorescence, indicating increased mitochondrial membrane potential. Bottom panel shows ROSproduction measured by CM-H2DCFDA. B–G: HAECs were exposed to 25 mmol/L glucose for the indicated times with (red bars) or without(green bars) subsequent incubation in 5 mmol/L glucose for 2 days (d). Cells exposed to 5 mmol/L glucose were used as controls (blue bars). B:HK-II/VDAC association after transient exposure of HAECs to high glucose, after 2 days of 5 mmol/L glucose following 6 h of 25 mmol/Lglucose, and after 6 h of exposure to 25 mmol/L in the presence of a peptide inhibitor of GSK-3b. Top panel shows IP-WB of VDAC:VDAC andVDAC:HK-II. Bottom panel shows quantitation of IP-WB data from top panel. C: VDAC phosphorylation after transient exposure of HAECs tohigh glucose, after 2 days of 5 mmol/L glucose following 6 h of 25 mmol/L glucose, and after 6 h of exposure to 25 mmol/L in the presence of
diabetes.diabetesjournals.org Giacco and Associates 3277

after 1, 2, 3, 4, 5, and 6 h of exposure to 25 mmol/L, HAECswere collected, and cell lysates were immunoprecipitatedwith an antibody against VDAC. Phosphorylation of VDACwas evaluated using a p-Thr antibody. High-glucose treat-ment induced a significant increase in VDAC phosphoryla-tion starting at 3 h (Fig. 2C). Increased VDAC threoninephosphorylation reached a maximum at 6 h (Fig. 2C). Con-sistent with the persistence of a decreased HK-II/VDACassociation in 5 mmol/L glucose after transient exposureto 25 mmol/L glucose, VDAC phosphorylation induced by6 h of exposure to 25 mmol/L glucose also persisted for 2days of subsequent exposure to 5 mmol/L glucose (Fig. 2C,red bar). To demonstrate that the increased VDAC phos-phorylation and subsequent dissociation of HK-II was me-diated by GSK-3b, a cell-permeable peptide inhibitor of thekinase was used. Pretreatment with this inhibitor preventedboth the high glucose–induced increase in VDAC threoninephosphorylation and the resulting HK-II/VDAC dissociation(Fig. 2B and C).
Transient Exposure to High Glucose Inducesa Persistent Increase in GSK-3b ActivityBecause these data suggest that high glucose increasesGSK-3b activity, causing increased VDAC phosphorylation andconsequent HK-II/VDAC dissociation, GSK3b activity wasassessed directly by 32P incorporation into a specific GSK-3bsubstrate in HAECs treated for 1, 2, 3, 4, 5, and 6 h with25 mmol/L glucose (Fig. 2D). High glucose induced a signif-icant increase in GSK-3b activity starting at 3 h, whichreached a maximum at 6 h. These data mirror the timecourse of the increase in VDAC threonine phosphorylationinduced by high glucose. Consistent with the persistence ofincreased VDAC threonine phosphorylation in 5 mmol/Lglucose after transient exposure to 25 mmol/L glucose,increased GSK-3b activity induced by 6 h of exposure to25 mmol/L glucose also persisted for 2 days of subse-quent exposure to 5 mmol/L glucose (Fig. 2D, red bar).
Transient Exposure to High Glucose Inducesa Persistent Decrease in Akt1 ActivityGSK-3b activity is controlled by the phosphorylation ofspecific residues by other kinases and is inhibited by
phosphorylation at serine 9 by Akt, ILK, PKA, p90RSK,and PKC (9,10,22). Because increased GSK-3b activity in-duced by high glucose was prevented by overexpression ofAkt-1CA (Fig. 2D), Akt1 activity was determined in HAECsexposed to high glucose. Cells were exposed to 25 mmol/Lglucose, and Akt1 activity was measured 1, 2, 3, 4, 5, and6 h after treatment. High glucose induced a significant de-crease in Akt1 activity starting at 3 h, with activity reducedby 60% at 6 h (Fig. 2E). Consistent with the persistence ofincreased GSK-3b activity in 5 mmol/L glucose after tran-sient exposure to 25 mmol/L glucose, decreased Akt1 ac-tivity induced by 6 h of exposure to 25 mmol/L glucose alsopersisted for 2 days of subsequent exposure to 5 mmol/Lglucose (Fig. 2E, red bar).
Akt1 is activated by phosphoinositide 3-kinase–dependentphosphorylation at Ser473 and Thr308. Akt1 can be inac-tivated by several protein phosphatases, including PP2A,the lipid protein phosphatase PTEN, and PHLPP2 (23,24).Treatment with either of two PP2A-specific inhibitors,microcystin and okadaic acid, completely prevented thehigh glucose–induced decrease in Akt1 activity, suggestingthat high glucose increases the activity of this phosphatase(Fig. 2E).
Transient Exposure to High Glucose Inducesa Persistent Increase in PP2A ActivityBecause PP2A inhibition prevented the decrease in Akt1activity induced by high glucose, PP2A activity was thenmeasured in HAECs treated for 1, 2, 3, 4, 5, and 6 h with 25mmol/L glucose (Fig. 2F). High-glucose treatment induceda significant increase in PP2A activity by 2 h (2.7-fold) andreached a sixfold increase of control activity at 6 h (Fig. 2F).Consistent with the persistence of reduced Akt1 activity in5 mmol/L glucose after transient exposure to 25 mmol/Lglucose, increased PP2A activity induced by 6 h of exposureto 25 mmol/L glucose also persisted for 2 days of subsequentexposure to 5 mmol/L glucose (Fig. 2F, red bar). Overexpres-sion of Mn-SOD prevented high glucose–induced PP2Aactivation (Fig. 2F), demonstrating that increased mito-chondrial superoxide production was necessary for PP2Aactivation by high glucose. Overexpression of catalase
a peptide inhibitor of GSK-3b. Top panel shows IP-WB of VDAC:VDAC and VDAC:P-Thr. Bottom panel shows quantitation of IP-WB datafrom top panel. D: GSK-3b activity after transient exposure of HAECs to high glucose, after 2 days of 5 mmol/L glucose following 6 h of 25mmol/L glucose, and after 6 h of exposure to 25 mmol/L in the presence of adenoviral (Ad) Akt-1CA. Activity was measured by 32P in-corporation into a GSK-3b–specific substrate. E: Akt1 activity after transient exposure of HAECs to high glucose, after 2 days of 5 mmol/Lglucose following 6 h of 25 mmol/L glucose, and after 6 h of exposure to 25 mmol/L in the presence of PP2A inhibitors. F: PP2A activityafter transient exposure of HAECs to high glucose, after 2 days of 5 mmol/L glucose following 6 h of 25 mmol/L glucose, and after 6 h ofexposure to 25 mmol/L in the presence of Ad-Mn-SOD, Ad-catalase, or deferoxamine. G: Free iron concentration after transient exposureof HAECs to high glucose, after 2 days of 5 mmol/L glucose following 6 h of 25 mmol/L glucose, and after 6 h of exposure to 25 mmol/L inthe presence of Ad-Mn-SOD. Free iron in HAECs was measured by EPR. H: Effect of Akt-DN or GSK-3b-CA on inner mitochondrialtransmembrane potential and ROS level in HAECs in 5 mmol/L glucose. HAECs were exposed to 5 mmol/L glucose for 6 h after infectionwith Ad vectors expressing Akt-DN, GSK-3b-CA, or vector alone. Top panel shows representative photomicrographs of increased JC-1 redfluorescence, indicating increased mitochondrial membrane potential. Bottom panel shows ROS production measured by CM-H2DCFDA.ROS data are mean 6 SEM from three independent experiments with at least eight technical replicates. All other data are mean 6 SD fromfive independent experiments. *P< 0.05. AU, arbitrary unit; d, days; DFO, deferoxamine; dpm, disintegrations per minute; inh, inhibitor; OD,optical density.
3278 Persistent ROS Generation During Normal Glucose Diabetes Volume 64, September 2015

also prevented high glucose–induced PP2A activation, indi-cating that extramitochondrial diffusion of H2O2 producedby Mn-SOD was also necessary for PP2A activation. Finally,deferoxamine, an iron chelator, also prevented activation ofPP2A by high glucose. Together, these results are consistentwith PP2A activation by hydroxyl radicals generated by thereaction of H2O2 with free iron released from intramito-chondrial stores by superoxide (25).
Transient Exposure to High Glucose Inducesa Persistent Increase in Intracellular Free IronMitochondrial superoxide production has been shown tocause increased free iron by inducing release of the metalfrom ferritin (26,27) and from mitochondrial iron-sulfurcluster proteins (28,29). To determine whether high glucose–induced mitochondrial superoxide production causes anincreased release of free iron, cellular levels of the metalwere measured by EPR. Free intracellular iron was mea-sured in HAECs after 1, 2, 3, 4, 5, and 6 h of treatmentwith 25 mmol/L glucose. High glucose induced a signifi-cant increase in free iron levels after 2 h, reaching 2.8-fold after 6 h (Fig. 2G). Consistent with the persistence ofincreased PP2A activity in 5 mmol/L glucose after tran-sient exposure to 25 mmol/L glucose, increased intracel-lular free iron levels induced by 6 h exposure to 25 mmol/Lglucose also persisted for 2 days of subsequent exposureto 5 mmol/L glucose (Fig. 2G, red bar). Overexpressionof Mn-SOD completely prevented high glucose–inducedrelease of free iron, demonstrating that hyperglycemia-induced increase in mitochondrial superoxide productioncauses release of Fe2+ from intramitochondrial stores.
Mimicking Effects of High Glucose on Different LoopComponents Increases DC and ROS in Cells ExposedOnly to 5 mmol/L GlucoseDetachment of VDAC-bound HK-II in cells incubated in5 mmol/L glucose increases DC and ROS production to thesame level as does incubation in 25 mmol/L glucose (Fig.2A). To demonstrate that altering other loop componentshas the same effect in cells exposed only to 5 mmol/Lglucose, HAECs were cultured in 5 mmol/L glucose afterinfection with adenoviral vectors expressing either Akt-DNto mimic the effect of high glucose on Akt1 activity ora constitutively active form of GSK-3b (GSK-3b-CA) tomimic the effect of high glucose on GSK-3b. Overexpres-sion of either Akt-DN or GSK-3b-CA induced an increasein DC and ROS production to the same level as did in-cubation in 25 mmol/L glucose (Fig. 2H). A schematicrepresentation of the multicomponent feedback loopthat maintains persistent mitochondrial ROS productionafter transient exposure to high glucose is shown in Fig. 3.
Disruption of the Multicomponent Feedback LoopReverses the Persistent Left Shift of the Glucose-ROSDose-Response Curve Induced by Transient Exposureto High GlucoseTo demonstrate that persistent activation of the multi-component feedback loop stably shifts the glucose-ROS
dose-response curve to the left, thus maintaining persis-tently increased mitochondrial ROS in 5 mmol/L glucosefor days after transient exposure to high glucose, cellswere incubated for 6 h in either 5 or 25 mmol/L glucose.Both groups of cells were then incubated in 5 mmol/Lglucose for 2 days. After that 2-day incubation in 5 mmol/Lglucose, cells transiently exposed to 25 mmol/L glucoseat the beginning of the experiment had activity of thepenultimate loop component GSK-3b normalized for 6 husing a degradable peptide inhibitor of GSK-3b (Fig. 4A,orange curve). This curve is shown in comparison with thecurve from cells exposed to 5 mmol/L initially (Fig. 4A,blue curve) and the curve from cells initially exposed to25 mmol/L glucose (Fig. 4A, red curve from Fig. 1).
Brief Exposure to 12 mmol/L Glucose Has the SameEffects on Feedback Loop Components as TransientExposure to a Higher Glucose Concentration, andGLP-1(9–36)amide Prevents ThisBecause the data in Fig. 1D demonstrate that maximumROS production in HAECs occurs at a glucose concentra-tion of 12 mmol/L with no further increase at higherglucose concentrations, we next used 12 mmol/L glucose,a concentration often seen in hyperglycemic spikes inpatients with type 1 diabetes, to show that brief exposureto this glucose concentration has the same effects on
Figure 3—Schematic representation of the multicomponent feed-back loop that maintains persistently increased ROS productionafter transient exposure to high glucose. Transient exposure tohigh glucose induces a transient increase in ETC flux, increasingDC and thereby increasing mitochondrial superoxide production. Inthe mitochondria, this superoxide causes the release of Fe2+ fromferritin and iron sulfur cluster–containing proteins. This released freeiron reacts with diffused superoxide-derived hydrogen peroxide toform hydroxyl radicals, which increase PP2A activity. ActivatedPP2A then dephosphorylates Akt1, decreasing its activity. DecreasedAkt1 activity increases GSK-3b activity, which then increases VDACthreonine phosphorylation (P). Increased VDAC threonine phos-phorylation decreases HK-II association with VDAC, whichincreases the DC at physiologic levels of glucose. Operation ofthis loop causes a stable left shift of the glucose concentration-ROS dose-response curve, thereby maintaining increased ROSlevels at normal glucose levels for days after transient exposureof cells to high glucose.
diabetes.diabetesjournals.org Giacco and Associates 3279
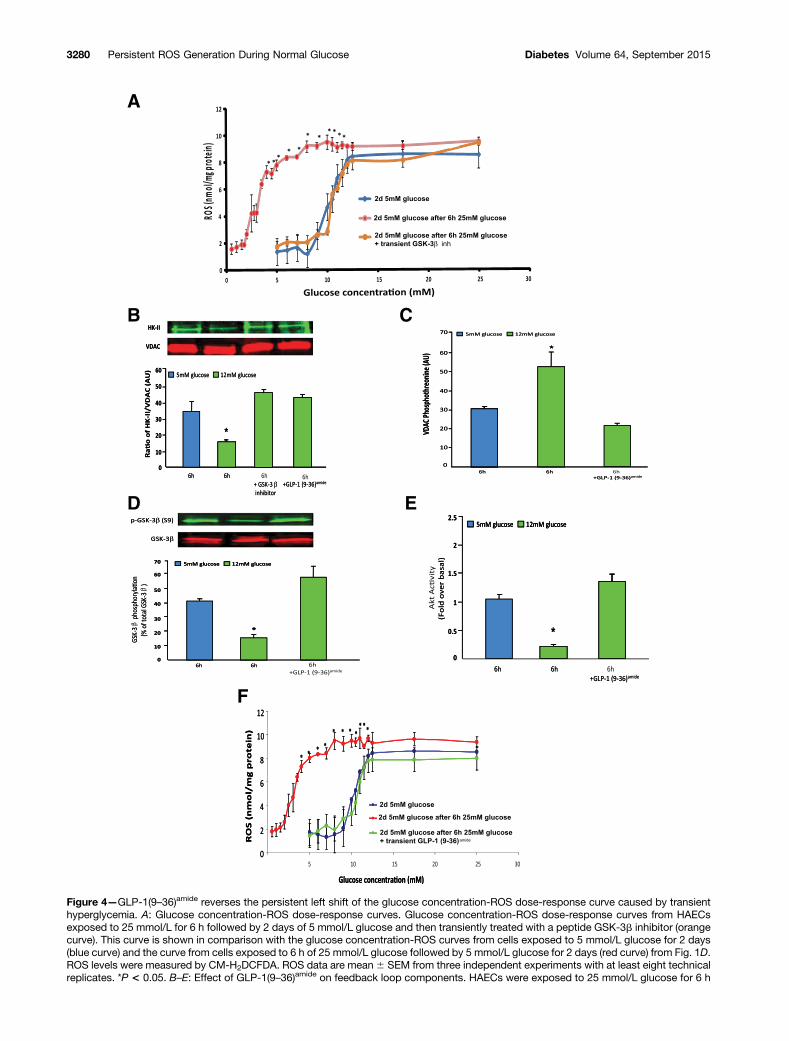
Figure 4—GLP-1(9–36)amide reverses the persistent left shift of the glucose concentration-ROS dose-response curve caused by transienthyperglycemia. A: Glucose concentration-ROS dose-response curves. Glucose concentration-ROS dose-response curves from HAECsexposed to 25 mmol/L for 6 h followed by 2 days of 5 mmol/L glucose and then transiently treated with a peptide GSK-3b inhibitor (orangecurve). This curve is shown in comparison with the glucose concentration-ROS curves from cells exposed to 5 mmol/L glucose for 2 days(blue curve) and the curve from cells exposed to 6 h of 25 mmol/L glucose followed by 5 mmol/L glucose for 2 days (red curve) from Fig. 1D.ROS levels were measured by CM-H2DCFDA. ROS data are mean6 SEM from three independent experiments with at least eight technicalreplicates. *P < 0.05. B–E: Effect of GLP-1(9–36)amide on feedback loop components. HAECs were exposed to 25 mmol/L glucose for 6 h
3280 Persistent ROS Generation During Normal Glucose Diabetes Volume 64, September 2015

feedback loop components as brief exposure to a higherglucose concentration. We also determined the effect ofthe GLP-1 cleavage product GLP-1(9–36)amide, which israpidly produced in vivo by dipeptidyl peptidase IV cleav-age, on components of the ROS-generating feedback loop.
HAECs were exposed to 12 mmol/L glucose for 6 h inthe presence or absence of GLP-1(9–36)amide or a GSK-3binhibitor peptide and HK-II/VDAC association was evalu-ated by IP-WB. GLP-1(9–36)amide prevented the high glucose–induced decrease in HK-II/VDAC association as effectivelyas the GSK-3b inhibitor peptide (Fig. 4B). GLP-1(9–36)amide
also prevented the high glucose–induced increase in VDACphosphorylation (Fig. 4C), GSK-3b activity measured asp-GSK-3b (S9)/GSK-3b was increased to the same extentby 12 mmol/L glucose as it was by higher glucose concentra-tions. GLP-1(9–36)amide completely prevented this (Fig. 4D).Moreover, Akt activity was reduced to the same extent by6 h of exposure to 12 mmol/L glucose as it was by higherglucose concentrations, and GLP-1(9–36)amide completelyprevented this (Fig. 4E).
Feedback Loop Disruption by the GLP-1 CleavageProduct GLP-1(9–36)amide Reverses the Persistent LeftShift of the Glucose Concentration-ROS Dose-Response Curve After Transient Hyperglycemia,Thereby Normalizing Persistent ROS Production and ItsPathophysiologic Consequences in CulturedEndothelial Cells and in MiceTo demonstrate that GLP-1(9–36)amide reverses the leftshift of the glucose-ROS dose-response curve, HAECs pre-viously exposed for 6 h to 25 mmol/L glucose followed by5 mmol/L glucose for 2 days were transiently exposed tothe peptide on day 2, and a glucose concentration-ROSdose-response experiment was performed. Transient expo-sure to GLP-1(9–36)amide completely reversed the persis-tent left-shifted glucose concentration-ROS dose-responsecurve (Fig. 4F, green curve). The glucose concentration-ROSdose-response obtained is superimposed on the curve fromcells exposed to 5 mmol/L glucose for 2 days (blue curve)and from cells exposed to 6 h of 25 mmol/L glucose followedby 5 mmol/L glucose for 2 days (red curve) from Fig. 1. Theeffect of GLP-1(9–36)amide and its precursor peptideGLP-1(7–36)amide on ROS generation after transient expo-sure to 25 mmol/L glucose is shown in Supplementary Fig. 3.
ROS induced by high glucose directly inhibit the activityof the endothelial cell enzyme PGI2 (30). In experimentaldiabetes, this has been shown to accelerate both nephrop-athy and cardiac fibroblast proliferation (31–33).
In cultured HAECs, prostacyclin activity was reduced80% after 2 days’ incubation in 5 mmol/L glucose afterprior transient exposure to 25 mmol/L glucose (data notshown). To demonstrate that transient hyperglycemiaalso induces persistent ROS production and consequentPGI2 inhibition in vivo, we measured PGI2 activity ina transient hyperglycemia mouse model (18). In nondia-betic mice, PGI2 activity was measured in mouse aortas 6days after transient hyperglycemia, and despite normalglucose metabolism for 6 days, PGI2 activity was still re-duced.90% (Fig. 5, bar 2). Because the half-life of PGI2 is2.5 h (34), the persistent inhibition of its activity for 6days in normoglycemic, nondiabetic mice after transienthyperglycemia is consistent with continuous productionof ROS maintained by the multicomponent feedback loop.To test this hypothesis, continuous ROS production wasblocked by transient treatment with GLP-1(9–36)amide.Two days after transient hyperglycemia, a micro-osmoticpump containing GLP-1(9–36)amide (300 mg/mL) wasinserted in the mice for 24 h and then removed (Fig. 5,top panel). As shown in Fig. 5, bar 3, 3 days after theGLP-1(9–36)amide was removed, the dramatic reduction ofPGI2 activity, which persisted for 6 days in nondiabeticanimals after transient hyperglycemia (Fig. 5, bar 2), wascompletely normalized. Because in mouse liver the half-lifeof GLP-1(9–36)amide is 52 min and that of its potentiallybioactive cleavage product GLP-1(28–36)amide is 13 min(35), the persistent effect on PGI2 activity is most consis-tent with disruption of the ROS-generating feedback loopestablished by transient hyperglycemia.
DISCUSSION
In this study, we show that 4–6 h of exposure to a level ofhigh glucose frequently seen in the glycemic spikes ofpatients with type 1 diabetes activates a multicomponentfeedback loop that causes a stable left shift of the glucoseconcentration-ROS dose-response curve. This left shiftcauses persistent mitochondrial overproduction of ROSfor days after glucose concentration is normalized. InHAECs, the GLP-1 cleavage product GLP-1(9–36)amide re-versed the persistent left shift caused by transient hyper-glycemia. Similarly, in nondiabetic mice, brief disruptionof the feedback loop with GLP-1(9–36)amide 2 days aftertransient hyperglycemia normalized persistent ROS inac-tivation of endothelial cell PGI2, a defect believed to playan important role in the pathogenesis of both diabeticnephropathy and cardiac fibrosis (30–32).
with or without 100 pmol/L GLP-1(9–36)amide. Cells exposed to 5 mmol/L glucose were used as controls (blue bars). B: HK-II/VDAC as-sociation. A peptide inhibitor of GSK-3b was used as control. C: VDAC phosphorylation: quantitation of IP-WB data. D: GSK-3b phos-phorylation. Top panel shows IP-WB of GSK-3b:GSK-3b and GSK-3b:p-GSK-3b (S9). Bottom panel shows quantitation of IP-WB datafrom top panel. E: Akt1 activity. Data are mean 6 SD from five independent experiments. *P < 0.01. F: Effect of GLP-1(9–36)amide onglucose concentration-ROS dose-response curves. Glucose concentration-ROS dose-response curve from HAECs exposed to 25 mmol/Lfor 6 h followed by 2 days of 5 mmol/L glucose and then transiently treated with GLP-1(9–36)amide (green curve). This curve has beensuperimposed on the glucose concentration-ROS curves from A. ROS levels were measured by CM-H2DCFDA. ROS data are mean6 SEMfrom three independent experiments with at least eight technical replicates. *P < 0.05. AU, arbitrary unit; d, days; inh, inhibitor.
diabetes.diabetesjournals.org Giacco and Associates 3281

Because hyperglycemia-induced overproduction of mito-chondrial ROS also initiates many of the other complexseries of molecular events that result in diabetic tissuedamage (36), these data suggest that hyperglycemic spikeshigh enough to activate persistent ROS production duringsubsequent periods of normal glycemia but too brief toaffect the HbA1c value are a major determinant of the89% of diabetes complications risk not captured by HbA1c(3). The stable left shift of the glucose concentration-ROSdose-response curve induced by short exposure to highglucose is an example of bistability, a fundamental propertyof many biological systems in which the system can be ineither of two alternative, stable steady states (37,38). Bist-ability is based on the continued activation or inhibition offeedback loops. For example, transient exposure of Xenopusoocytes to progesterone induces stable cellular differentia-tion, which persists in the absence of progesterone (37).Similarly, both stable transformation of differentiated cellsinto induced pluripotent stem cells and stable transforma-tion of embryonic stem cells into differentiated cells involvestable feedback loops initiated by transient exposure toa small number of transcription factors (39,40).
In this study, 1 h of transient exposure to high glucosemaximally increased ROS in HAECs. However, 4–6 h ofexposure to high glucose were required for the persistentgeneration of ROS after normoglycemia restoration.These data suggest that a critical change in other loopcomponents takes at least 4 h to establish. It may alsoreflect the time course of other ROS-mediated effects.
Why does increased ROS not activate a negative feed-back loop to restore homeostasis as proposed by Brand andcolleagues (41)? A plausible answer is suggested by the
work of Harper and colleagues (42,43) who confirmedthat uncoupling proteins (UCPs) 2 and 3 are activated byROS and discovered that reversible posttranslational mod-ification of UCPs with glutathione reverses ROS-mediatedactivation of UCPs. Because mitochondrial ROS can triggerboth protein glutathionylation and protein deglutathiony-lation through the enzyme glutaredoxin 2, 4–6 h of suffi-ciently high levels of ROS in the presence of high glucosemay adversely affect S-glutathionylation of UCPs anda number of other mitochondrial proteins (42).
In the current study, GLP-1(9–36)amide was shown toprevent the excess VDAC phosphorylation induced by tran-sient hyperglycemia, the excess activation of GSK-3b re-sponsible for this, and the decreased association of HK-IIwith VDAC and to prevent the inhibition of Akt activitycaused by transient hyperglycemia. As a result, GLP-1(9–36)amide reversed the persistent left shift of the glucoseconcentration-ROS dose-response curve caused by transienthyperglycemia and thereby reversed the ROS-dependentinactivation of PGI2. GLP-1(9–36)
amide is the cleavageproduct of the incretin hormone GLP-1(7–36)amide. Studieshave shown that GLP-1(9–36)amide, initially considered tobe an inactive degradation product of GLP-1, performsimportant physiologic functions distinct from its precursor(12). GLP-1(9–36)amide has been reported to have uniqueextrapancreatic insulin-like actions in the heart, vascula-ture, and liver, which appear not to be mediated throughthe GLP-1 receptor (35). In HAECs, GLP-1(9–36)amide acti-vate cardioprotective signaling pathways, whereas GLP-1receptor agonists do not (44). Whether the effects ofGLP-1(9–36)amide in the current study are mediatedthrough an unidentified cell surface receptor or through
Figure 5—GLP-1(9–36)amide reverses the persistent reduction of PGI2 caused by transient hyperglycemia in vivo. Top panel showsexperiment schematic. Bottom panel shows findings in C57BL/6 mice (n = 5/group) that received four sequential injections of glucose3 g/kg i.p. (red bars) or an equivalent volume of 0.9% saline (blue bar) at 2-h intervals. Two days after transient hyperglycemia, a micro-osmotic pump containing GLP-1(9–36)amide (300 mg/mL) was inserted in the mice for 24 h and then removed. Aortas were removed andPGI2 activity measured in all groups 6 days after initial glucose or saline injections. Data are mean 6 SD. *P < 0.01. d, days.
3282 Persistent ROS Generation During Normal Glucose Diabetes Volume 64, September 2015

further degradation to a nonapeptide possibly targeted tomitochondria remains to be elucidated.
Paneni et al. (45) proposed an ROS-generating feed-back loop in HAECs consisting of two components:p66Shc and protein kinase C (PKC) bII. They reported thatcontinuous exposure of endothelial cells to 25 mmol/Lglucose increased expression of the adaptor protein p66Shcand activated p66Shc by a PKC bII–dependent mechanism.In contrast, in the current experiments, we did not ob-serve any change in either p66Shc protein levels or in-creased p66Shc phosphorylation (data not shown). Ourobservations that GLP-1(9–36)amide prevents the highglucose–induced changes in feedback loop componentsidentified in this study and that this peptide reversespersistent ROS inactivation of PGI2 after transient hy-perglycemia in nondiabetic mice support the feedbackloop elucidated here.
Hyperglycemia-induced overproduction of mitochon-drial ROS initiates many of the complex series ofmolecular events that result in diabetic tissue damage(36), and transgenic expression of the antioxidant enzymeSOD prevents each complication in experimental diabetes(46–48). We have previously observed (49) that in endo-thelial Rho-zero (cells that have been depleted of theirown mitochondrial DNA by prolonged incubation withethidium bromide and consequently lacking functionalmitochondria), exposure to high glucose failed to increaseROS production (50). Thus, it appears that the mitochon-dria are required for the initiation of hyperglycemia-induced superoxide production. Published evidence hasindicated that this in turn can activate a number of othersuperoxide production pathways that may amplify theoriginal damaging effect of hyperglycemia, including acti-vation of NADPH oxidases and uncoupling of endothelialnitric oxide synthase (6).
Because the major cause of death in people with type 1diabetes is cardiovascular disease (CVD), HAECs wereused in the current study. During the DCCT, the smallnumber of CVD events in the relatively young cohortprecluded a determination of the effect of HbA1c on therisk of CVD. However, the DCCT data show that at least89% of variation in risk of diabetic retinopathy and a sim-ilar percentage of risk of microalbuminuria or albuminuriaare not captured by mean HbA1c values (2,3). In 2005,long-term follow-up data on the DCCT/EDIC cohort showedno difference in mean HbA1c values between the two EDICstudy groups. However, the hazard ratio for risk of non-fatal myocardial infarction, stroke, or death from CVDwas increased 2.5- to 2.9-fold in patients with eithermicroalbuminuria or albuminuria (51).
The data presented here suggest that the 89% ofvariation in risk of diabetic microalbuminuria or albu-minuria not captured by mean HbA1c values in the DCCTcohort may reflect transient above-threshold spikes ofhyperglycemia that continue to activate damaging mech-anisms for days of subsequent near-normal glycemia. Thephenomenon and mechanism described in this study
provide a basis for the development of new biomarkersto complement HbA1c and novel therapeutic agents, in-cluding GLP-1(9–36)amide, for the prevention and treat-ment of diabetes complications.
Acknowledgments. The authors thank Aviv Bergman, Chair, Departmentof Systems and Computational Biology, Albert Einstein College of Medicine, forhelpful discussions during the course of this work. The authors also thank MorrisBirnbaum, Willard and Rhoda Ware Professor of Diabetes and Metabolic Dis-eases, University of Pennsylvania, for providing plasmids, adenoviral vectors, andadvice.Funding. F.G. was supported by a European Diabetes Foundation/Lilly post-doctoral fellowship. X.D. was supported in part by National Institutes of Health(NIH) grant 5P60-DK-020541. A.C. was supported by an Italian Ministry ofUniversity and Scientific Research (MIUR) fellowship. G.J.G. was supported byNational Science Foundation grant CHE-1335708. M.D. and I.G. were supportedby MIUR grant Progetti di ricerca di interesse nazionale 08:20082P8CCE_002.A.R. was supported by “Progetti di Ateneo of Padua University.” A.N.M. wassupported by NIH grant P01-DK-054441. This project was funded by NIH grant1R01-DK-33861, JDRF grants 8-2003-784 and 4-2004-804, and JDRF ScholarAward 16-2006-501 (to M.B.).Duality of Interest. A.S.D. was supported by Seahorse Bioscience. Noother potential conflicts of interest relevant to this article were reported.Author Contributions. F.G. performed the experiments and contributedto the study concept, research design, and drafting of the manuscript. X.D.performed the experiments and contributed to the study concept and researchdesign. A.C., G.J.G., and M.S.S. performed the experiments. M.D., I.G., A.S.D.,and A.N.M. contributed to the discussion and data interpretation. A.R. and O.M.provided critical reagents and advice for the experiments. M.B. contributed to thestudy concept, research design, and drafting of the manuscript. M.B. is theguarantor of this work and, as such, had full access to all the data in the studyand takes responsibility for the integrity of the data and the accuracy of the dataanalysis.
References1. The Diabetes Control and Complications Trial Research Group. The effect ofintensive treatment of diabetes on the development and progression of long-termcomplications in insulin-dependent diabetes mellitus. N Engl J Med 1993;329:977–9862. The Diabetes Control and Complications Trial Research Group. The re-lationship of glycemic exposure (HbA1c) to the risk of development and pro-gression of retinopathy in the diabetes control and complications trial. Diabetes1995;44:968–9833. Lachin JM, Genuth S, Nathan DM, Zinman B, Rutledge BN; DCCT/EDICResearch Group. Effect of glycemic exposure on the risk of microvascularcomplications in the diabetes control and complications trial—revisited. Diabetes2008;57:995–10014. Kovatchev BP, Otto E, Cox D, Gonder-Frederick L, Clarke W. Evaluation ofa new measure of blood glucose variability in diabetes. Diabetes Care 2006;29:2433–24385. Brownlee M, Hirsch IB. Glycemic variability: a hemoglobin A1c-independentrisk factor for diabetic complications. JAMA 2006;295:1707–17086. Giacco F, Brownlee M. Oxidative stress and diabetic complications. Circ Res2010;107:1058–10707. Korshunov SS, Skulachev VP, Starkov AA. High protonic potential actuatesa mechanism of production of reactive oxygen species in mitochondria. FEBS Lett1997;416:15–188. Pastorino JG, Hoek JB. Regulation of hexokinase binding to VDAC. J Bio-energ Biomembr 2008;40:171–1829. Medina M, Garrido JJ, Wandosell FG. Modulation of GSK-3 as a therapeuticstrategy on tau pathologies. Front Mol Neurosci 2011;4:24
diabetes.diabetesjournals.org Giacco and Associates 3283

10. Medina M, Wandosell F. Deconstructing GSK-3: the fine regulation of itsactivity. Int J Alzheimers Dis 2011;2011:47924911. Pastorino JG, Hoek JB, Shulga N. Activation of glycogen synthase kinase3beta disrupts the binding of hexokinase II to mitochondria by phosphorylatingvoltage-dependent anion channel and potentiates chemotherapy-induced cyto-toxicity. Cancer Res 2005;65:10545–1055412. Tomas E, Stanojevic V, Habener JF. GLP-1-derived nonapeptide GLP-1(28-36)amide targets to mitochondria and suppresses glucose production and oxi-dative stress in isolated mouse hepatocytes. Regul Pept 2011;167:177–18413. Ma T, Du X, Pick JE, Sui G, Brownlee M, Klann E. Glucagon-like peptide-1cleavage product GLP-1(9-36) amide rescues synaptic plasticity and memorydeficits in Alzheimer’s disease model mice. J Neurosci 2012;32:13701–1370814. Chiara F, Castellaro D, Marin O, et al. Hexokinase II detachment from mi-tochondria triggers apoptosis through the permeability transition pore in-dependent of voltage-dependent anion channels. PloS One 2008;3:e185215. D’Apolito M, Du X, Zong H, et al. Urea-induced ROS generation causes insulinresistance in mice with chronic renal failure. J Clin Invest 2010;120:203–21316. Nishikawa T, Edelstein D, Du XL, et al. Normalizing mitochondrial super-oxide production blocks three pathways of hyperglycaemic damage. Nature2000;404:787–79017. Srinivasan C, Liba A, Imlay JA, Valentine JS, Gralla EB. Yeast lacking su-peroxide dismutase(s) show elevated levels of “free iron” as measured by wholecell electron paramagnetic resonance. J Biol Chem 2000;275:29187–2919218. Okabe J, Orlowski C, Balcerczyk A, et al. Distinguishing hyperglycemicchanges by Set7 in vascular endothelial cells. Circ Res 2012;110:1067–107619. Du X, Edelstein D, Obici S, Higham N, Zou MH, Brownlee M. Insulin re-sistance reduces arterial prostacyclin synthase and eNOS activities by increasingendothelial fatty acid oxidation. J Clin Invest 2006;116:1071–108020. Murphy MP. How mitochondria produce reactive oxygen species. Biochem J2009;417:1–1321. Adam-Vizi V, Chinopoulos C. Bioenergetics and the formation of mito-chondrial reactive oxygen species. Trends Pharmacol Sci 2006;27:639–64522. Hardt SE, Sadoshima J. Glycogen synthase kinase-3beta: a novel regulatorof cardiac hypertrophy and development. Circ Res 2002;90:1055–106323. Ugi S, Imamura T, Maegawa H, et al. Protein phosphatase 2A negativelyregulates insulin’s metabolic signaling pathway by inhibiting Akt (protein kinaseB) activity in 3T3-L1 adipocytes. Mol Cell Biol 2004;24:8778–878924. Liao Y, Hung MC. Physiological regulation of Akt activity and stability. Am JTransl Res 2010;2:19–4225. Horowitz MP, Greenamyre JT. Mitochondrial iron metabolism and its role inneurodegeneration. J Alzheimers Dis 2010;20(Suppl. 2):S551–S56826. Welch KD, Davis TZ, Van Eden ME, Aust SD. Deleterious iron-mediatedoxidation of biomolecules. Free Radic Biol Med 2002;32:577–58327. Williams DM, Lee GR, Cartwright GE. The role of superoxide anion radical inthe reduction of ferritin iron by xanthine oxidase. J Clin Invest 1974;53:665–66728. Kell DB. Iron behaving badly: inappropriate iron chelation as a major con-tributor to the aetiology of vascular and other progressive inflammatory anddegenerative diseases. BMC Med Genomics 2009;2:229. Cantu D, Schaack J, Patel M. Oxidative inactivation of mitochondrial aco-nitase results in iron and H2O2-mediated neurotoxicity in rat primary mesen-cephalic cultures. PLoS One 2009;4:e709530. Zou MH. Peroxynitrite and protein tyrosine nitration of prostacyclin synthase.Prostaglandins Other Lipid Mediat 2007;82:119–12731. Zhao HJ, Wang S, Cheng H, et al. Endothelial nitric oxide synthase de-ficiency produces accelerated nephropathy in diabetic mice. J Am Soc Nephrol2006;17:2664–2669
32. Nasu T, Kinomura M, Tanabe K, et al. Sustained-release prostacyclinanalog ONO-1301 ameliorates tubulointerstitial alterations in a mouse ob-structive nephropathy model. Am J Physiol Renal Physiol 2012;302:F1616–F162933. Chen Y, Yang S, Yao W, et al. Prostacyclin analogue beraprost inhibitscardiac fibroblast proliferation depending on prostacyclin receptor activationthrough a TGF b-Smad signal pathway. PLoS One 2014;9:e9848334. Nusing R, Goerig M, Habenicht AJ, Ullrich V. Selective eicosanoid formationduring HL-60 macrophage differentiation. Regulation of thromboxane synthase.Eur J Biochem 1993;212:371–37635. Sharma R, McDonald TS, Eng H, et al. In vitro metabolism of the glucagon-like peptide-1 (GLP-1)-derived metabolites GLP-1(9-36)amide and GLP-1(28-36)amide in mouse and human hepatocytes. Drug Metab Dispos 2013;41:2148–215736. Brownlee M. Biochemistry and molecular cell biology of diabetic compli-cations. Nature 2001;414:813–82037. Xiong W, Ferrell JE Jr. A positive-feedback-based bistable ‘memory module’that governs a cell fate decision. Nature 2003;426:460–46538. Burrill DR, Silver PA. Making cellular memories. Cell 2010;140:13–1839. Macarthur BD, Ma’ayan A, Lemischka IR. Systems biology of stem cell fateand cellular reprogramming. Nat Rev Mol Cell Biol 2009;10:672–68140. Takahashi K, Tanabe K, Ohnuki M, et al. Induction of pluripotent stemcells from adult human fibroblasts by defined factors. Cell 2007;131:861–87241. Echtay KS, Roussel D, St-Pierre J, et al. Superoxide activates mitochondrialuncoupling proteins. Nature 2002;415:96–9942. Mailloux RJ, McBride SL, Harper ME. Unearthing the secrets of mitochon-drial ROS and glutathione in bioenergetics. Trends Biochem Sci 2013;38:592–60243. Mailloux RJ, Seifert EL, Bouillaud F, Aguer C, Collins S, Harper ME. Glu-tathionylation acts as a control switch for uncoupling proteins UCP2 and UCP3. JBiol Chem 2011;286:21865–2187544. Ban K, Kim KH, Cho CK, et al. Glucagon-like peptide (GLP)-1(9-36)amide-mediated cytoprotection is blocked by exendin(9-39) yet does not require theknown GLP-1 receptor. Endocrinology 2010;151:1520–153145. Paneni F, Mocharla P, Akhmedov A, et al. Gene silencing of the mito-chondrial adaptor p66(Shc) suppresses vascular hyperglycemic memory in di-abetes. Circ Res 2012;111:278–28946. Shen X, Zheng S, Metreveli NS, Epstein PN. Protection of cardiac mito-chondria by overexpression of MnSOD reduces diabetic cardiomyopathy. Di-abetes 2006;55:798–80547. Vincent AM, Russell JW, Sullivan KA, et al. SOD2 protects neurons frominjury in cell culture and animal models of diabetic neuropathy. Exp Neurol 2007;208:216–22748. Kowluru RA, Kowluru V, Xiong Y, Ho YS. Overexpression of mitochondrialsuperoxide dismutase in mice protects the retina from diabetes-induced oxidativestress. Free Radic Biol Med 2006;41:1191–119649. Brownlee M. The pathobiology of diabetic complications: a unifyingmechanism. Diabetes 2005;54:1615–162550. King MP, Attardi G. Isolation of human cell lines lacking mitochondrial DNA.Methods Enzymol 1996;264:304–31351. Nathan DM, Cleary PA, Backlund JY, et al.; Diabetes Control and Com-plications Trial/Epidemiology of Diabetes Interventions and Complications(DCCT/EDIC) Study Research Group. Intensive diabetes treatment and cardio-vascular disease in patients with type 1 diabetes. N Engl J Med 2005;353:2643–2653
3284 Persistent ROS Generation During Normal Glucose Diabetes Volume 64, September 2015