Embed Size (px)
Citation preview

Globalization: An Economic
Perspective
World View
Global Education Leaders' Program
14 June 2010
Professor Peter Brews, Kenan-Flagler
Business School, the University of North
Carolina at Chapel Hill

Globalization has many facets/dimensions:
Historic...first globalization of peoples; then globalization for
resources (scramble for Africa...)
Most recently: economic globalization
Discussion today pertains to economic globalization, which relates to
the explosion of productivity experienced over the past three hundred
years or so

Economic Globalization:
Relates to understanding differences between pre-industrial,
industrial, post industrial contexts, and what drives competitiveness in
the last two
Pertains to knowing which factors/resources/competencies are
available/becoming available in other parts of the world, and then
knowing what to do/focus on to compete in this widening
productivity/resource/competence availability
Requires knowing the difference between market and supply seeking,
and to what happens to consumption/PPP as nations get in the game

Pre Industrial Industrial
Principal
factors of
production
Land
Labor
Land
Labor (physical)
Capital
Key work
units
Rural families, small
tribal societies, class
based feudal
systems
Urbanized, vertically integrated, hierarchically
controlled factories
Capability
of Capital
Minimal Dedicated, inflexible, electro-mechanical
processors, supported by dedicated humans;
hands and machines
Marketing
challenge
Meeting basic needs Meeting demands of unsophisticated consumers
with little choice
Principals
of
production
Survival,
generalization
High volume, low variety leads to high
quality/low cost; specialization, standardization,
mass production/distribution
The Pre Industrial and Industrial Worlds

Industrial Post Industrial
Principal
factors of
production
Land
Labor (physical)
Capital
Land
Labor (mental)
Capital
Key work
units
Urbanized, vertically integrated,
hierarchically controlled factories
Small/large, centralized/de-
centralized, local/global, vert. de-
integrated/IT integrated networks
Capability
of Capital
Dedicated, inflexible, electro-
mechanical processors,
supported by dedicated humans;
hands and machines
Flexible, ‘smart’ programmable
processors, operating with little
human intervention once
programmed; minds and machines
Marketing
challenge
Meeting demands of
unsophisticated consumers with
little choice
Meeting demands of informed
consumers with much choice;
services and solutions intensive
Principals
of
production
High volume, low variety leads to
high quality/low cost;
specialization, standardization,
mass production/distribution
Automation, specialization, high/low
vol., high variety, speed, flexibility,
mass customization, continuous
innovation/advantage upgrading
The Industrial and Post Industrial Worlds

In the Industrial to Post Industrial shift two categories of businesses worth
studying:
1. Classic Post Industrial firms, e.g.
Microsoft
Cisco Systems
Oracle/SAP
Amazon.com
eBay
Nike
or
2. Industrial firms moving towards Post Industrial status, e.g.
Caterpillar Siemens
Cemex GE
Medtronics GM
Industrial Post Industrial
Physical capital dependent; asset
and labor intensive
Intellectual capital dependent;
fewer ‘smarter’ people
Physical/tangible product based Intangible, high value added
services/solution based
Employs many, mostly in the factory Employs fewer, on the campus, at
home, anywhere
Balance sheet orientation Income statement orientation
Low net income per person High net income per person
Scale constraints Easily scaleable
Low market value per person (MVP) High MVP
Slow wealth creation dispersed to
outside suppliers of capital; few
inside shareholders
Fast wealth creation more
dispersed to inside suppliers of
knowledge; more inside
shareholders
Industrial versus Post Industrial Organizations: A Summary

Industrial versus Post Industrial Companies: Comparative Data
Microsoft Cisco Nike Wal-Mart Caterpillar Ford GM
Date established 1975 1984 1968 1962 1925 1903 1908
Number of employees 57,000 34,000 23,000 1.5 million 69,169 327,000 324,000
Market cap in US$
(at Feb. 28, 2005)
273bn 113bn 23bn 218bn 32bn 23bn 20bn
Market value per
employee ((US$)
4.8m 3.3m 1m 145,333 463,768 70,336 61,728
Net income/Sales
(%, 2004)
26.0 22.8 8.4 3.6 6.7 2.1 1.9
Net income/Employee
(US$)
175,368 158,441 47,565 6,850 29,492 11,113 11,391
Unless otherwise stated, all data based on most recent annual financial statements as at April 2005.
Net income is from continuing operations before extraordinary items for most recent 12 months ending 31
January 2005

The industrial to post industrial shift is profoundly effecting:
• Role of humans in productive work
• Structure, scope, speed, operational performance of firms
and
• Nature/complexity of goods and services (and solutions) on offer
All organizations around the world are currently adjusting to the effects
of this structural change

Why is Economic Globalization important to the state/citizens of North
Carolina?
• First, economic globalization for Americans was a supply seeking
enterprise; consumers in America greatly benefitted
• Over the 20th Century America was consumer of last resort to the global
economy
• Economic globalization will now become more a market seeking enterprise
for Americans; instead of selling only to 300 million at home the potential
market is billions of consumers elsewhere…go where the money is!
• Can producers in America offer products/services/solutions others in the
world will want?

At the leading edge innovating faster than those behind can replicate is best
route for competitive survival (remember Solow’s tfp as the major source of
national growth for the United States)
Political, community, and education leaders must ensure North Carolinians are
ready to compete in this post industrial, globalizing, fast moving world…
And that NC is an attractive location to invest in in the ongoing struggle for
productivity, as well as an attractive place to live in, holiday in, and retire in…

What must educators do?
• Prepare American human capital for knowledge intensive, creative work, so
we can innovate at a rate faster than others can replicate; high level math and
science skills are table stakes
• Discipline and deferred gratification must be instilled in students so they
make the educational investment and learn how to THINK, problem solve,
research, imagine, create, connect dots etc.
• My contract with my children…
• Schools, Universities and Community Colleges must develop curricula that
prepare workers for 21st Century, high value creative work, or for work co-
operating with smart machines delivering smart goods, services, or solutions

Digging out: America in the
Reset World
Global Education Leaders' Program
World View
Professor Peter Brews
Kenan-Flagler Business School,
University of North Carolina at Chapel Hill

14
The US is in worst shape it has been in for generations:
• 25 years living beyond means have finally caught up
• Economically, out of balance both publically and privately
• Some core industries in deep trouble (banking, automobiles, construction, retail)
while others face serious funding issues (healthcare, education, military…)

15
Not really credit crisis but over-consumption/living beyond means crisis: credit
symptom, not cause
Two propositions:
• Americans could cut consumption by 20% and probably wouldn’t notice: 20%
smaller houses, 20% smaller cars; 20% less food; 20% less clothing etc.
• In face of global imbalances and global competition/scramble for resources,
2006/7 American consumption levels unsustainable

16
US Political Economy/Public Sector Imbalances

.
US Federal Gross Debt as % of GDP: 1940-2009
Source: zFacts.com

US Gross Federal Debt is now close to 100% of US GDP
Source: http://www.usgovernmentspending.com/downchart_gs.php?year=1792_2010&view=1&expand=
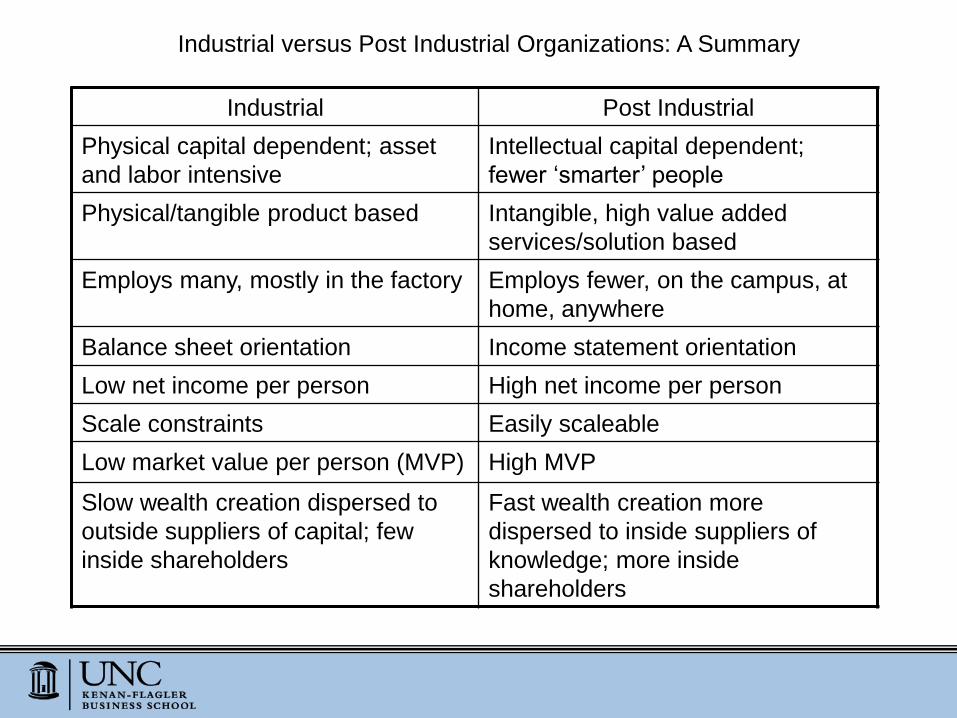
Even before the Credit Crisis:
• Social Security/Medicaid surpluses being raided to balance federal budget
• Federal government borrowing to meet expenditures; foreign savers
meeting some of need…Japan, China, Saudi Arabia

Country Nov 2008 Nov 2009
China 681.9 798.9
Japan 577.1 751.5
United Kingdom 360.0 249.3
Caribbean Banking Centers 220.8 171.7
Oil Exporters 129.6 185.3
Brazil 78.1 144.9
Total 2047.5 2,301.6
MAJOR FOREIGN HOLDERS OF TREASURY
SECURITIES (in billions of dollars)
Source: Department of the Treasury/Federal Reserve Board, November 2009

21
US Private Sector Imbalances

Source: http://www.econ.yale.edu/~shiller
US Macroeconomic data: Home prices, building costs, interest rates, population

Graph constructed by Professor Christian Lundblad, Kenan-Flagler Business School, University of North Carolina at
Chapel Hill.
Consumption and GDP data from the Bureau of Economic Analysis (BEA). Mortgage equity withdrawals are measured as
the year-over-year change in mortgage debt (from the Federal Reserve Flow of Funds) minus 70 percent of residential
investment spending (from the BEA). (Source: L. Josh Bivens, Economic Policy Institute)
US Macroeconomic data: Consumption and Mortgage Equity Withdrawals
Private sector imbalances:
• Private consumption expenditure sustained by freely available low cost
capital, tax cuts, real estate asset bubble/boom, credit card debt
• World’s largest ponzi scheme ever operating between US consumers and
PRC
• US private savings rate also very low/even negative over past decade

Immediate credit crisis result of many factors accumulating over last decade
or so:
• Securitization of financial instruments/misalignment of incentives
• Poor financial market oversight/regulation
• Political desire to increase home ownership through Freddie Mae/Mac
• Expansionary US fiscal and monetary policy
• Real estate asset bubble that developed over 00s
All led to Borrow and Spend

Structural Effects of Crisis: Globally
Geo Politically
• Age of American driven global economy ending; 300 million cannot drive 6.8 billion:
new global consumer(s) of last resort needed, but consumption patterns will differ
(emerging consumers ≠ rich uncle)
• America moves from last super power left standing to first among equals, emerging
countries (BRICs) power > as economies strengthen
Macro-economically
• Re-regulation of financial markets likely
• Consumer growth mostly in emerging economies

US adjustments needed:
• < 5 - 10 % in US Consumption as % of GDP
• > in US Savings to 5 - 10% of GDP
• > in US taxes 3 - 5 of GDP %
• < 20% in average US body weight
i.e. we all must save more, consume less, adjust consumption expectations,
de-lever
Note: 2009 QIII Personal Consumption Expenditure was estimated to be just
over 71% of GDP; GDP in 2009 < by more than 3 percent

Year Growth Rate
2009 -3.2
2008 0.43
2007 2.13
2006 2.65
2005 3.08
2004 3.58
2003 1.83
U.S. Bureau of Economic Analysis
2009 estimate until Sept.
Average Real GDP Growth


Year
US$ billions
(2005 base year)
2009 1,453.0
2008 1,989.4
2007 2,146.2
2006 2,230.4
2005 2,172.2
2004 2,058.2
2003 1,871.6
U.S. Bureau of Economic Analysis
2009 2nd Quarter estimate
Gross Private Domestic Fixed Investment

Future US Scenarios:
Party On, Dude
To
Tighten Belts

Party On, Dude
• Bailouts continue/budget deficits grow, pandering rather than pain: no pay as
you go imposed
• Government borrowing increases, private investment/GDFI crowded out,
welfare grows - corporate and consumer
• Protectionist impulses lead to closing of American economy to buffer against
foreign competition/protect US jobs
• World eventually becomes nervous of US$/Economy, dumps US$, status of
world reserve currency lost to Euro or Rmb
• US descends into second class status, paying off today’s debt through
inflation, debasing currency into Mickey Mouse money
• This is worst case scenario, unlikely but possible
• If we don’t discipline ourselves the market will eventually discipline us…the
US could be Greece in five year’s time

Tighten Belts: Take the Pain, Adjust, Emerge..
• After stabilization, tightening occurs: interest rates rise to encourage
savings/counter inflation, budget deficit stabilizes, federal govt. > discipline
• Short to near term economic growth declines/moderates, jobs lost, Americans
reduce consumption, increase savings to de-lever balance sheets, increase
savings/cushions
• Adjustments will probably be required at the Federal, State, and Local levels
• After initial adjustment US economy resumes growth based on ongoing
productivity gains, clean tech/high tech/innovation, local and export led growth
• China, Brazil, India, others become locomotives of global growth, lasting well
into the 21st Century, consumption model evolves
• US evolves from last Superpower to First Among Equals

Likely macro trends over the next two generations:
• Curbing Climate Change/Global Warming > energy, transport costs; boom in
clean energy, production techniques, products and sevices
• Consumption models change in face of > commodity prices, > energy costs, >
transport costs, need for cleaner, more re-cyclable products
• US consumption levels < relatively as emerging markets >; US becomes global
market seeker, not supply seeker
• Global inequality diminishes, but does not disappear; but in 2050 US PPP per
capita still exceeds those of most residents in emerging world, and remember, not
a zero sum game!!!

For the sake of children/grand children US must deal with its current
economic imbalances (short term), as well as with Global
Warming/Climate Change (long term)
Country is currently mortgaging descendants futures, economically
and environmentally…
BIG TIME

But don‘t go from irrational exuberance to irrational depression
It is a question of balance...

Whether US declines or revitalizes depends upon political
choices/leadership, and willingness of all to confront reality and adjust
accordingly
And remember end of world not nigh, it could be far worse…
You could be an Icelander, or in Ireland, Mexico, or Zimbabwe
US economy still envy of the world, flexible, innovative, open for
business, productive
While recovering from party/hangover, all in US must work to keep it that
way!!!!