Embed Size (px)
Citation preview

Foreign aid, economic globalization, and pollution
Sijeong Lim • Victor Menaldo • Aseem Prakash
Published online: 23 September 2014� Springer Science+Business Media New York 2014
Abstract This paper explores how trade and foreign direct investment (FDI) condition
the effect of foreign aid on environmental protection in aid-recipient countries. We suggest
that (1) environmental protection should be viewed as a public good and (2) all else equal,
resource flows from abroad (via aid, trade, and FDI) influence governments’ incentives to
provide public goods. (3) Because these resources shape governments’ incentives differ-
ently, their interactive effects should be examined. We begin with the assumption that
developing country governments seek some optimal level of environmental protection, a
level conditioned by their factor-intensive growth phase. We hypothesize that at low levels
of export receipts or FDI inflows from the developed world, foreign aid is associated with
superior environmental protection. This is because foreign aid, as an environmentally
neutral addition to revenue, allows recipient governments to partially relax the trade-off
between economic growth and environmental protection. As levels of export receipts or
FDI inflows from the developed world increase, however, the salutary effect of foreign aid
will diminish and eventually be reversed. This is because foreign aid mitigates the recipient
government’s dependence on traders and investors in the developed world, and concom-
itantly reduces their pro-environmental policy leverage. Our analysis of 88 aid recipients,
for the period 1980–2005, lends support to our argument.
Keywords Foreign aid � Economic globalization � Diffusion � Pollution
S. Lim (&)Department of Political Science, Stockholm University, Stockholm, Swedene-mail: [email protected]
V. MenaldoDepartment of Political Science, University of Washington, Seattle, WA, USAe-mail: [email protected]
A. PrakashDepartment of Political Science and the Center for Environmental Politics,University of Washington, Seattle, WA, USAe-mail: [email protected]
123
Policy Sci (2015) 48:181–205DOI 10.1007/s11077-014-9205-6
Introduction
Foreign aid is an important instrument for shaping public policy. Donors provide aid for a
range of objectives, including economic development, democratization, security, and
disaster relief. This paper examines the unanticipated consequences of foreign aid on
environmental protection in aid-recipient countries. The literature is inconclusive on this
subject: While some suggest a negative relationship between aid and environmental pro-
tection, others argue that aid supports environmental protection. There are few empirical
tests conducted on this subject, and the results are mixed (Arvin and Lew 2009). We
suggest that this inconclusiveness arises when scholars ignore how the effect of aid is
conditioned by alternative resource inflows from abroad. Thus, rather than evaluate the
average or unconditional relationship between aid and environmental protection, we
examine how exports to and foreign direct investment (FDI) inflows from developed
countries (globalization flows from the North, hereafter) condition the association between
foreign aid and the environmental protection.
We introduce and test a theory that posits that at low levels of globalization flows from
the North, increased foreign aid reduces pollution in aid-recipient countries. At high levels
of globalization flows from the North, however, the salutary effect of aid on environmental
protection diminishes and eventually reverses. While we discuss the mechanism behind
such a seemingly counterintuitive interactive effect later in the paper, we provide a
summary below.
Governments pursue multiple, sometimes contradictory, objectives. These include eco-
nomic growth and environmental protection. We assume that developing country govern-
ments seek some optimal level of environmental protection; a level conditioned by their
factor-intensive growth phase. Although governments recognize the negative environmental
consequences of economic growth, their immediate focus tends to be on economic growth in
the short run, simply because it supports their political survival. The formerMalaysian Prime
Minster, Dr. Mahathir Mohamad, controversially alluded to the growth–environment trade-
off in response to criticism about rampant deforestation in his country:
… But we are also acutely conscious that we are a developing country which needs
the wealth afforded by our forests. We do not cut down our trees foolishly. We need
living space, we need space for agriculture, and we need the money from the sale of
our timber (Mohamad 1992).
We expect this trade-off between growth and environmental protection would be most
pronounced for governments not having access to external resources and seeking to
mobilize resources domestically to finance their operations. Such governments often allow,
or even participate in, resource plunder—e.g., extracting minerals, hydrocarbons, and
timber at rates that exceed the optimal rate—which leads to environmental degradation.
Thus, the level of environmental protection in the absence aid and globalization flows from
the North is lower than the optimal level desired by governments.
Enter foreign aid in the context of such an economy. We suggest that while aid, in and
of itself, is neutral in relation to environmental protection,1 it allows developing country
1 While environmental groups have actively lobbied multilateral organizations such as the World Bank, andthe Bank has instituted policies such as the Strategic Environmental Assessment and Environmental ImpactAssessment (Gutner 2002; Nielson and Tierney 2003; Park 2005), such groups nonetheless tend to lack theleverage that would lead donors to prioritize environmental issues over other goals. A recent empirical studyalso suggests that aid is largely ‘‘environmentally neutral’’ (Hicks et al. 2008).
182 Policy Sci (2015) 48:181–205
123

governments to partially relax the trade-off between economic growth and environmental
protection. Thus, at low levels of globalization flows from the North, an increase of foreign
aid is expected to be associated with an improvement in environmental stewardship.
Now consider the introduction of globalization flows without aid flows. As levels of
globalization flows from the North rise, developed country importers and investors begin to
exercise political leverage over developing country governments. As suggested by the
literature on ‘‘trading up’’ (Vogel 1995; Greenhill et al. 2009) and ‘‘investing up’’ (Prakash
and Potoski 2007), the preferences of traders and investors located in developed countries
are, on average, pro-environmental. Thus, at high levels of globalization flows from the
North, the level of environmental protection is higher than the optimal level desired by
governments and closer to foreign stakeholders’ ideal point.
What if such a country also receives foreign aid, the issue we examine in this paper? As
an environmentally neutral addition to government revenue, aid mitigates the recipient
government’s dependence on globalization flows from the North. Recall, trade and FDI led
a developing country to provide protection above its ideal point. With aid, the political
leverage of foreign traders and investors over developing country governments is reduced,
and governments can begin to supply protection at their ideal point, which is below the ideal
point of Northern traders and investors. Thus, our theory predicts that aid in the presence of
trade and FDI will reduce the level of environmental protection in developing countries.
We find empirical evidence for this seemingly paradoxical interaction effect between
globalization flows and aid flows. A series of dynamic panel data analyses of 88 official
development assistance (ODA) recipients over 26 years (1980–2005) suggest that aid is
associated with higher levels of environmental protection at low levels of globalization
flows from the North. As globalization flows from the North rise, however, the marginal
effects of aid are diminished and are eventually reversed.
The rest of the paper is organized as follows. In the following section, we review the
literature on the environmental implications of foreign aid and economic globalization. We
then outline our theoretical framework and hypotheses, which will be followed by a section
summarizing the data and methods for empirical analyses and our findings. The last section
concludes and tenders policy implications based on our findings.
Aid, globalization, and pollution: what do we know?
The debate on how foreign aid influences a recipient’s environment remains inconclusive
(Castro and Hammond 2009). Roughly, there are two camps. Some researchers suggest
that foreign aid can help protect the environment. Aid provides resources to recipient
governments to clean up pollution and to proactively invest in environmental protection.
By enhancing economic development and increasing income in poorer nations, aid might
improve the environment indirectly as well. If environmental protection can be viewed as a
normal good, citizens’ demand for environmental protection would increase as the econ-
omy grows (Arvin and Lew 2009). Some suggest that donors can explicitly dispense
foreign aid to help bolster environmental protection. Although ‘‘green aid’’ still remains a
small fraction of the total flows of foreign aid, the share composed by so-called ‘‘dirty aid’’
has diminished significantly over the past few decades (Hicks et al. 2008).
Conversely, because donors typically provide aid for reasons that are not associated
with environmental protection, aid may be unlikely to encourage pro-environmental pol-
icies in recipient countries. In fact, by encouraging economic development, foreign aid
may create incentives for resource plunder or the growth of polluting industries, all under
Policy Sci (2015) 48:181–205 183
123
the guise of economic development. In addition, some suggest that aid creates perverse
incentives by encouraging leaders to delay socioeconomic reforms (Gibson et al. 2005) and
undermines the development of democratic political institutions (Djankov et al. 2008).
Consequently, aid may work as a ‘‘resource curse’’ (Knack 2001): Because governments no
longer have to rely on their populations for fiscal revenues and political support, they under
supply public goods demanded, including environmental protection.
There is a relatively small literature that empirically examines how aid influences
recipients’ environmental outcomes. Most studies have assessed the effects of environ-
mental aid on specific environmental projects (Ross 1996), a specific country recipient
(Gutner 2002), or even a specific donor agency (Dauvergne 2001). When it comes to an
analysis of a broader set of countries, Arvin and Lew (2009) are the rare exception. They
study the relationship between foreign aid and three ecological indicators in developing
countries (CO2 emissions, water pollution, and deforestation), and find that while foreign
aid reduces CO2 emissions, it increases water pollution and deforestation.
How might one explain these contradictory theoretical expectations and inconclusive
empirical findings? Part of the problem is that the literature focuses on the average,
unconditional, impact of aid on environmental protection. Indeed, Arvin and Lew (2009:
298) conclude by suggesting that ‘‘the economic and social conditions of individual
recipient countries’’ should be examined to understand such mixed findings. We contribute
to this literature by examining how other types of resources flows from developed countries
can condition the effect of foreign aid on recipient countries’ environmental protection. We
are most interested in examining trade and FDI inflows. While foreign aid is a direct and
intergovernmental resource transfer from donors to recipient governments, trade and FDI
also generate resources for recipient governments indirectly, through economic interac-
tions in the private sector. It would therefore not be all too surprising if trade and FDI
condition the effect of foreign aid on the incentives faced by governments to protect the
environment in aid-recipient countries.
Much attention has been given to how trade influences pollution levels in exporting
countries (Antweiler et al. 2001). Two competing arguments have received attention: the
‘‘pollution haven’’ hypothesis (Eskeland and Harrison 2003) and the ‘‘California effect’’
hypothesis (Vogel 1995; Prakash and Potoski 2006). The ‘‘pollution haven’’ hypothesis
suggests that trade openness leads to industry flight. Dirty industries located in developed
countries with strict environmental regulations relocate to pollution havens in developing
countries with less stringent regulations. Because stringent regulations are associated with
higher production costs, international trade provides a mechanism for mobile firms to avoid
higher costs by relocating to lower cost locations, a pattern of industrial flight that con-
forms to the sorting mechanism identified in the fiscal federalism literature (Tiebout 1956).
The consequences for developing countries are obvious: Trade leads to increased pollution
because they now host dirty industries that have relocated from developed countries (Jaffe
et al. 1995).
Other scholars are more optimistic about the effects of trade on pollution in developing
countries. Levinson’s (2010) analysis of US imports for the period 1972–2001 does not
find support for the pollution haven hypothesis. To the contrary, he finds that the com-
position of US imports shifted toward relatively clean goods, and much to his surprise, the
green shift of US imports is found to be larger than the corresponding green shift of US
domestic manufacturing. What might work against the pollution haven incentives?
Scholars suggest that the cost savings by relocating to (and/or exporting from) pollution
havens are often offset by the negative publicity firms receive at home. Stakeholders
actively scrutinize firm behavior in their home countries and abroad—including the
184 Policy Sci (2015) 48:181–205
123
practices of their foreign suppliers. Firms importing from developing countries will face
pressure from stakeholders in their home countries for environmental protection abroad
(Prakash and Potoski 2007). Thus, trade can serve as a vehicle for transmitting the envi-
ronmental preferences of importing countries to exporting countries. In particular, when
developing countries’ key export markets have stringent environmental standards, trade
can lead developing country governments to ratchet up environmental standards at home
(Perkins and Neumayer 2012).
In addition to trade, there is a burgeoning literature examining the effects of FDI inflows
on environmental protection in the developing world. Similar to the trade debate, two
schools of thought have emerged: one pessimistic and the other optimistic. Some studies
suggest FDI inflows have a negative effect on the environment in developing countries. As
profit-seeking actors, MNCs headquartered in developed countries are likely to channel
investments to developing countries offering competitive advantages: lower labor costs,
less regulation, and lower production costs (Caves 1996; Dunning 1993). Moreover, MNCs
may deploy technologies and management practices in host countries that are cheaper and
inferior to the ones used in their home countries (Frank 1967).
Other scholars suggest that MNCs have incentives to transfer technologies and man-
agement practices that are significantly influenced by those used in their home country
(Pauly and Reich 1997). In a recent study, Rivera and Oh (2013) find that European MNCs
tend to invest in countries with environmental regulations that are more stringent than
home country regulations. In the context of the Chinese automobile industry, Saikawa
(2013) finds that in order to attract foreign FDI and promote trade, the Chinese government
made regulatory standards at home as strict, if not stricter, than abroad. Madsen (2009)
finds that FDI inflows are not deterred by the stringency of host countries’ environmental
regulations.
Why would MNCs diffuse superior environmental practices to the developing world?
One good reason is legal liability. This became especially relevant in the wake of the 1984
Bhopal disaster, a deadly gas leak in India that was among the worst industrial accidents in
history, and left nearly 3,000 people dead. In that case, Union Carbide, a multinational
conglomerate, was found liable for punitive damages caused by the disaster because its
Indian subsidiary had deployed technologies that were inferior to those used by Carbide in
its US operations. As a consequence, MNC subsidiaries in developing countries have
increasingly adopted the environmental practices and technologies used in host countries.
And MNCs have also encouraged and sometimes required their suppliers to adopt these
superior environmental standards and practices (Rivera and Oh 2013).
Another reason why MNCs might promote environmental protection in host countries is
the so-called liability of foreignness (Zaheer 1995). MNCs and their supply chains are
typically subjected to extra scrutiny by local groups. Hence, MNCs have incentives to be
environmentally responsible and diffuse norms that promote environmental sustainability
throughout their supply chain (King and Shaver 2001). Moreover, given the relative
immobility of FDI, MNCs often have economic incentives to ensure that the host country
adopts their preferred technologies and practices.2 This serves two purposes. First, it levels
the playing field, so that the MNCs are not at a cost disadvantage in relation to local firms.
2 As the salience of FDI originating from developing countries such as China and India increases, the pro-environmental pressures of FDI on the host economy might diminish. However, in the time period of ourstudy, 1980–2005, the bulk of FDI received by developing countries originated from the North. According toAykut and Ratha (2004), by the end of 1990s, over two thirds of the total FDI inflows to the developingworld originated from the high income countries.
Policy Sci (2015) 48:181–205 185
123

Second, recognizing that environmental mishaps or pollution-related stories in the host
country would besmirch their reputation in global markets, MNCs have a vested interest in
ensuring that environmental laws, practices, and standards in host countries are up to par
(Ahlquist and Prakash 2010).
To be sure, claims about MNCs’ environmental stewardship should be viewed with
caution. MNCs can and do indulge in ‘‘greenwashing’’ and cheap talk (Egels-Zanden
2007). Hence, we subject the claims about the pro-environmental effects of trade and FDI
to rigorous empirical tests in this paper, rather than assume that these preferences exist.
Theoretical framework
We begin with the assumption that governments in developing countries pursue political
survival, and promoting economic growth is an important component of their survival
strategy. Yet, growth and environmental stewardship often work at cross-purposes in the
developing world. While most incumbents recognize that they cannot completely ignore
the environmental consequences of growth, and invariably face pressures to provide
environmental protection at some level, they often face strong incentives to favor policies
that generate economic growth and material prosperity at the expense of the environment.
How do incumbents protract their survival in office? We draw on retrospective voting
models to provide an answer (Ferejohn 1986, 1999). A class of these models posits that to
secure reelection, incumbents and their political allies must please a winning political
coalition by improving macroeconomic performance—most importantly, they must stim-
ulate economic growth (Hibbs 2000, 2001). Recent contributions to this literature are more
inclusive, and put economic performance at the heart of any effort to maintain political
power across regimes, both democratic and autocratic. One class of models treats the
domestic political elites, those who have a say in the selection of leader, as having
incomplete information about incumbent’s ability. They rely on objective indicators of
performance to infer said ability. Economic growth and material prosperity are an effective
signal, as its benefits tend to be tangible and quickly realized (Rogoff 1990). The political
elites then use their updated knowledge to decide whether to keep or displace the leader
(Galetovic and Sanhueza 2000). Other researchers put forth complete information models.
In these models, the executive can make an economic investment in the first period but
nonetheless be replaced in the second period (Gallego and Pitchik 2004). In such a sce-
nario, the decision to keep the incumbent versus replace her is based on the difference
between the benefits generated by the leader’s investment and the opportunity costs of
ousting her. Because economic growth spurred by a productive investment increases these
opportunity costs, it deters leader replacement.
Our own framework is flexible, and agnostic about the level of information possessed by
an incumbent’s selectorate and the ultimate reason why economic growth is paramount to
political survival. We posit that incumbents tend to be politically vulnerable and risk being
replaced if their supporters’ material prosperity is compromised. Thus, incumbents who
hope to survive are incentivized to pursue economic growth and the rents it provides them,
which often leads to the under-provision of environmental protection.
The conflict between economic growth and environmental protection should be espe-
cially strong in developing countries that are in the resource intensive phase of industri-
alization. The Environmental Kuznets Curve (Grossman and Kreuger 1995) literature
suggests that, during this phase, governments and citizens prioritize economic growth over
186 Policy Sci (2015) 48:181–205
123
environmental protection. As India’s former Rural Development Minister Jairam Ramesh
candidly noted:
The last 25–30 years, with accelerated economic growth and the pressure that eco-
nomic growth has brought to bear on our natural resources, it has created this new
animal of ecological poverty that we have to now address.3
We now discuss how incumbents’ disposition changes as external resource inflows are
introduced. Figure 1 summarizes the effect of different resource inflows in a hypothetical
developing country whose optimal level of environmental protection (denoted as O) is
located somewhere on the environmental protection continuum. We begin with a null
scenario when the country has low levels of aid and globalization flows from the North;
that is, little external resource inflows. To finance economic growth, governments seek to
extract resources from the domestic economy. Given the low level of development and a
small tax base, resource plunder is often the most readily available strategy (Haber and
Menaldo 2011; Hamilton and Clemens 1999). At said levels of fiscal poverty, the provision
of public goods such as a clean environment is not a governmental priority. The level of
environmental protection provided will be far below the optimal level, denoted as A1 on the
continuum.
Suppose, however, that this government was to receive an increased amount of foreign
aid. Recall that foreign donors are motivated by a host of objectives, including their
economic interests, security, and democratization. Consequently, the bulk of foreign aid is
neither purposefully environmentally destructive nor environmentally protective (Hicks
et al. 2008). Because much of the aid flows directly into the government’s coffers, how-
ever, the incumbent can use the aid to improve the material prosperity of her supporters,
trading off environmentally destructive resource plunder in the process.4 Therefore, the
infusion of aid allows the incumbent to get closer to the optimal level of environmental
protection and reduce pollution levels without having to kill political support. Thus, the
level of environmental protection provided will be somewhere above A1 and below O,
denoted as A2 on the continuum.
Now consider increased globalization flows from the North, but without an increase in
foreign aid. As discussed in the previous section, globalization flows from the North serve
as a mechanism to transmit the pro-environmental preferences of the developed countries’
stakeholders. These pro-environmental pressures are shaped by the incentives traders and
investors face at home; stakeholders such as environmental and labor groups have sought
to improve the environmental practices in subsidiaries and supply chains (Prakash and
Potoski, 2007; Rivera and Oh 2013; Saikawa 2013). Consequently, a developing country’s
government depending heavily on globalization flows from the North faces pressure to
provide environmental protection closer to the level that matches the preferences of
developed country stakeholders. This level exceeds the optimal level desired for a
developing country and is denoted as A3 on our continuum (see Fig. 1). The liberalization
3 http://health.india.com/news/indias-public-health-system-has-collapsed-jairam-ramesh/.4 We believe that our characterization of foreign aid as a free addition to recipient government’s coffersholds even for earmarked aid or in-kind aid. There is a literature suggesting that aid earmarked for theprovision of specific public goods such as schools and hospitals is largely fungible, and can produce fiscaldisplacement. Feyzioglu et al. (1998), for instance, find that developing-country governments receivingloans for agriculture, education, and energy can reduce public investments in these sectors. Farag et al.(2009) find that an increase in donor funding for health is associated with a proportionate decrease ingovernment health spending. Foreign aid, even when it is earmarked for a specific purpose, still enablesgovernments to divert resources elsewhere, according to their own priorities (Waddington 2004).
Policy Sci (2015) 48:181–205 187
123

of trade and capital flows therefore represents, in a sense, a ‘‘globalization’’ tax that distorts
behavior in a developing country.
Lastly, suppose that this globalized economy was also to receive an increased amount of
foreign aid. Here, aid has an unexpected consequence. By reducing recipient governments’
dependence on globalization flows from the North, aid undermines the leverage of foreign
traders and direct investors who hold pro-environmental preferences. With foreign aid as a
new revenue source, recipient governments have greater leeway to pursue policies that
improve their chances of political survival without providing for environmental protection
above their own, desired level. Instead, they will provide environmental protection at a
level that better coheres with their political needs. Given the weak endogenous domestic
demand for environmental public goods in most developing countries, foreign aid would
encourage their governments to either lower regulatory standards or simply not adequately
enforce them (Cao and Prakash 2010). The level of environmental protection would
decline from A3 down to A4.
Therefore, our key hypotheses are as follows:
Hypothesis 1 Foreign aid has a pro-environmental effect when the recipient country has
low-economic dependence on globalization flows from the North.
Hypothesis 2 Foreign aid has a negative effect on the environment when the recipient
country has high-economic dependence on globalization flows from the North.
Our hypotheses are tested in the following section. In addition, we empirically dem-
onstrate how our theoretical framework is supported over alternative explanations such as
the conventional rentier story and is robust to endogeneity concerns. We also empirically
investigate how our hypothesized relationship is affected by the incentives and constraints
provided by different donors and domestic political institutions.
••
••
••
••
Fig. 1 Provision of environmental protection continuum
188 Policy Sci (2015) 48:181–205
123
Data, methods, and findings
To test the relationship between aid and environmental protection conditional on levels of
globalization flows from the North, we construct an unbalanced time series cross-sectional
dataset of aid-recipient countries over a 26-year period, 1980–2005. This sample includes
all countries that ever received ODA based on data from the Organization for Economic
Cooperation and Development (OECD). Due to missing data on control variables, the
regression models with the most coverage have 88 aid-recipient countries. The model with
the largest number of observation has 1,569 observations.
We measure the dependent variable, pollution intensity, as sulfur dioxide (SO2) emis-
sions (Stern 2005) per dollar of GDP in constant 2000 US dollars. This is a widely
employed pollution measure in the environmental politics and policy literatures. For our
purposes, SO2 is an excellent indicator of pollution for several reasons. First, it is a direct
result of economic activities, industrial production in particular. The largest share of SO2
emissions stem from stationary sources such as electricity generation, iron, and the steel
industry, all reflecting the backbone of the industrialization process in developing coun-
tries. Second, because SO2 emissions have high visibility, there is political awareness
about its negative consequences among governments, the media, and various interest
groups (Cao and Prakash 2010). Third, governments across the world seek to regulate
SO2.5 Consistent with the literature, we take the natural log of this measure; the logged
measure exhibits close to a normal distribution.6 In robustness check, we show that our
results hold when we employ SO2 (logged, but not GDP denominated) as our dependent
variable (Bernauer and Koubi 2009) while controlling for the size of GDP separately.
Our key explanatory variables are indicators of foreign aid, exports, and FDI inflows.7
For foreign aid, we use the OECD’s data on ODA. Consistent with the foreign aid literature
(Alesina and Dollar 2000 and Younas and Bandyopadhyay 2009), we use ODA per capita
(in constant 2009 dollars) as our primary indicator of foreign aid. This measure combines
bilateral aid from government donors who are members of the Development Assistant
Committee (DAC) in the OECD and multilateral aid from intergovernmental institutions
such as the World Bank. In a robustness check, we show that our results hold when we
employ ODA as percentage of GDP as an alternative indicator of foreign aid.
To measure exports, consistent with the California effect hypothesis, we examine exports
destined to developed donor countries as percentage of exporting countries’GDP.8 For FDI,we
primarily use net FDI inflows, but also present a specification that uses FDI stocks as a
5 We also evaluated other dependent variables such as biochemical Oxygen demand (BOD), as a proxy forwater pollution, and NO2 (Nitrous Oxide). Data for both of these pollutants is available for a smaller numberof countries, and for much limited time period (from mid and late 1990s for most countries). Hence, we didnot include these analyses in our study. While the data on CO2 intensity is widely available, we do not usethe CO2 indicator because it is not a regulated pollutant in developing countries during most of the periodcovered in our study, and therefore is not appropriate as a proxy for the government’s commitment toenvironmental protection.6 Fisher type Augmented Dickey-Fuller (ADF) panel unit root tests conducted with several different laglength selections (1–5 years) reject the null hypothesis of a unit root.7 In using the OECD foreign aid dataset, we treat all reported missing values as truly missing (and thusexclude them from the analysis).8 Exports to donor countries were calculated using bilateral trade data from the Correlates of War Project(COW 2008). We treat all reported missing values as truly missing (and thus exclude them from theanalysis), and accept all reported zeros as true zeros. Donor countries refer to the members of the Devel-opment Assistance Committee (DAC) in the OECD. Greece, Portugal, South Korea, and Spain are excludeddue to their very recent membership into the DAC.
Policy Sci (2015) 48:181–205 189
123

robustness check.9 We use aggregated FDI inflows rather than the subset of FDI from donor
countries for three reasons. First, the disaggregated statistics (based on bilateral FDI flows) are
highly unreliable for many developing countries during the period covered in this study.
Second, themajority of FDI to developing countries is from the developedworld: around 95 %
of the total FDI in the early 1980 s and still over two-thirds of total FDI in the last decade.10
We also control for economic, political, and demographic factors used in the literature on
pollution levels. We control for total trade because overall trade openness might influence
levels of pollution intensity.11 We control for (logged) GDP per capita in constant 2007
dollars and adjusted for purchasing power parity12 and its squared term to allow for the
possible curvilinear relationship between economic development and environmental pro-
tection as suggested by the Environmental Kuzents Curve. We also control for annual GDP
growth and the size of the industry valued added as a percentage of GDP.13 The Polity 2
Score14 is included to capture the effect of regime type on pollution (Bernauer and Koubi
2009; Li and Reuveny 2006). To control for demographic characteristics, our models include
population density and urban population as a percentage of total population.15 Descriptive
statistics of the key variables included in our analysis are summarized in Table 1.
Our research strategy proceeds as follows. We first estimate some parsimonious spec-
ifications that regress SO2 emissions per unit of GDP on foreign aid, exports to donors,
FDI, and the interaction terms between foreign aid and the two measures of globalization
flows. A basic set of control variables, described above, will also be added to these models.
We then proceed to test our mechanism against potential alternative explanations and
reverse causation, explore more nuanced versions of our theoretical mechanism, and
conduct several robustness checks.
Model
We model the annual SO2 emission per unit of GDP in country i during year t as a function
of foreign aid (ODA per capita), globalization flow, their interaction term, and other
control variables. The restricted dynamic OLS equation can be expressed as follows:
SO2 Intensityit ¼ /1SO2 Intensityi;t�1 þ c1Aidi;t�1 þ c2Globalization Flowi;t�1
þ c3Aid� Globalization Flowi;t�1 þ Xi;tb1þ ai þ st þ eit
where Globalization Flow represents either export to donors or FDI inflows; c1,c2, and c3represent the coefficient estimates of the foreign aid, globalization flow, and their inter-
action term, respectively; X is the matrix of control variables; b represents the vector of
9 FDI flow data is from the World Bank Development Indicators (WBDI); FDI stock data is from the UnitedNations Conference on Trade and Development (UNCTAD). Both FDI indicators are expressed as a per-centage of GDP, and the correlation between the two is 0.41. We treat all reported missing values as trulymissing (and thus exclude them from the analysis), and accept all reported zeros as true zeros.10 Outward FDI from China has become an important phenomenon only in the recent years. Chinese FDIstock by the end of 2006 only accounted for 0.85 % of the world’s total FDI (Yang 2008).11 Total trade data are from the WBDI.12 The data are from Haber and Menaldo (2011).13 The data are from the WBDI. The industry value added indicator comprises value added in the mining,manufacturing, construction, and energy (electricity, water, and gas) sectors.14 The data are from Polity IV (2010).15 The data are from the WBDI.
190 Policy Sci (2015) 48:181–205
123
Table
1Determinantsofpollutionintensity
Null
Main
Robustnesschecks
Model
1Model
2Model
3Model
4Model
5Model
6Model
7Model
8Model
9
Nointeraction
With
interaction
Controlfor
natural
resources
Controlfor
environmentalaid
GMM
ODA
-0.007(0.008)
-0.026+(0.016)
-0.025*(0.011)
-0.024(0.015)
-0.024*(0.011)
-0.024*(0.011)
-0.0002(0.0045)-0.018**(0.004)-0.018**(0.003)
Exportto
donors
-0.005(0.006)
-0.008+(0.005)
-0.004(0.006)
-0.007(0.005)
-0.004(0.006)
0.008(0.007)
0.013(0.008)
-0.008**(0.002)-0.006**(0.002)
ODA
9exportto
donors
0.001*(0.0005)
0.001*(0.0004)
0.0013**(0.0004)
0.001**(0.0002)
FDI
-0.005(0.011)
-0.005(0.012)-0.026**(0.010)
-0.005(0.012)
-0.045*(0.010)
-0.003(0.005)
-0.014*(0.007)
0.009**(0.003)
-0.006(0.004)
ODA
9FDI
0.006**(0.001)
0.005**(0.002)
0.003*(0.0015)
0.004**(0.001)
Trade
0.001(0.002)
0.001(0.002)
0.001(0.002)
0.001(0.002)
0.001(0.002)
-0.004(0.004)
-0.004(0.004)
0.000(0.001)
0.000(0.001)
GDPper
capita
2.771**(0.920)
2.380(0.874)
2.477**(0.886)
1.951*(0.835)
2.036*(0.841)
0.453(1.351)
0.564(1.322)
1.580(0.527)
1.949**(0.534)
GDPper
capita2
-0.157**(0.048)
-0.132**(0.046)-0.137**(0.046)
-0.109*(0.044)-0.114**(0.044)
0.025(0.081)
0.018(0.078)
-0.091**(0.031)-0.113**(0.032)
GDPgrowth
0.003(0.006)
0.003**(0.006)
0.003(0.006)
0.004(0.006)
0.004(0.006)
0.000(0.004)
0.001(0.004)
-0.004**(0.001)-0.003**(0.001)
Polity2
-0.010(0008)
-0.010(0.008)
-0.010(0.008)
-0.009(0.008)
-0.010(0.008)
0.008(0.010)
0.008(0.010)
0.010**(0.003)
0.011**(0.002)
Industry
(%GDP)
0.008(0.005)
0.009*(0.005)
0.008+(0.005)
0.014**(0.005)
0.013**(0.005)
-0.004(0.005)
-0.006(0.004)
0.004*(0.002)
0.004*(0.002)
Populationdensity
0.003**(0.001)
0.003**(0.001)
0.003**(0.001)
0.003**(0.001)
0.003**(0.001)
0.002**(0.001)
0.003**(0.001)
0.002**(0.001)
0.003**(0.001)
Urban
population
0.030**(0.007)
0.030**(0.007)
0.029**(0.007)
0.030**(0.007)
0.029**(0.007)
0.005(0.013)
0.004(0.012)
0.033**(0.004)
0.032**(0.004)
Naturalresources
-0.008**(0.003)-0.008**(0.003)
Environmentalaid
0.010(0.007)
0.008(0.007)
Lagged
D.V.
0.657**(0.068)
0.657**(0.067)
0.657**(0.067)
0.653**(0.069)
0.653**(0.069)
0.530**(0.135)
0.537**(0.136)
0.158+(0.096)
0.163+(0.084)
N(n),max
T1,569(88),26
1,569(88),26
1,569(88),26
1,568(88),26
1,568(88),26
632(75),10
632(75),10
1,410(85),26
1,410(85),26
DependentVariable
is(logged)SO2per
GDPin
grams;
only
LRMsareshown(exceptforthelagged
D.V.);ForModels1–7,Driscoll-K
raay
standarderrors
arein
parentheses;ForModel
8–9,
heteroscedasticity-consistentstandarderrors
calculatedfrom
sandwichvariance–covariance
estimators
inparentheses;countryandyearfixed
effectsareestimated
forModels1–5andModels7–8,
andonly
countryfixed
effectsareestimates
forModels6–7
Policy Sci (2015) 48:181–205 191
123
coefficient estimates of the control variables; a and s represent country and time fixed
effects, respectively, and eit is the error term. We include country fixed effects to control
for country-specific and time-invariant heterogeneity that may influence a country’s pro-
pensity to pollute. This includes factors such as ethnic fractionalization, geography, and
history. Because pollution intensities may reflect common shocks or trends, we also
estimate year fixed effects.
The lag structure of the variables is as follows. Globalization Flow, foreign aid, and
their interaction term are lagged by 1 year because their effect on government decision
making is not instantaneous. A lag of the dependent variable, SO2 intensityt-1, is included
in the equation to explicitly model the dynamic process by which pollution adjusts to
changes in the independent variables: current pollution is equal to past pollution plus a
delayed adjustment to a new level of pollution induced by a permanent increase in the
independent variables.16 To identify the long-run (cumulative) effects of the independent
variables, we calculate each variable’s long-run multiplier (LRM): the coefficient on the
independent variable divided by (1,the coefficient on the lagged dependent variable, /).For instance, the LRM for foreign aid is calculated as follows:
LRMAid ¼c1
1� /1
The models’ standard errors are adjusted in several ways. First, the delta method is used
to calculate the correct standard errors for the LRM since it is computed as the ratio of two
estimated regression coefficients. We also adjust the standard errors with the Driscoll-
Kraay variance–covariance estimator, a nonparametric technique designed for panel data
estimated with country fixed effects. Driscoll-Kraay standard errors address both group-
wise contemporaneous correlation and heteroskedasticity (Driscoll and Kraay 1998). The
results are also robust to estimating panel-corrected standard errors or robust (Huber-
White-Sandwich) standard errors clustered by country.
Findings
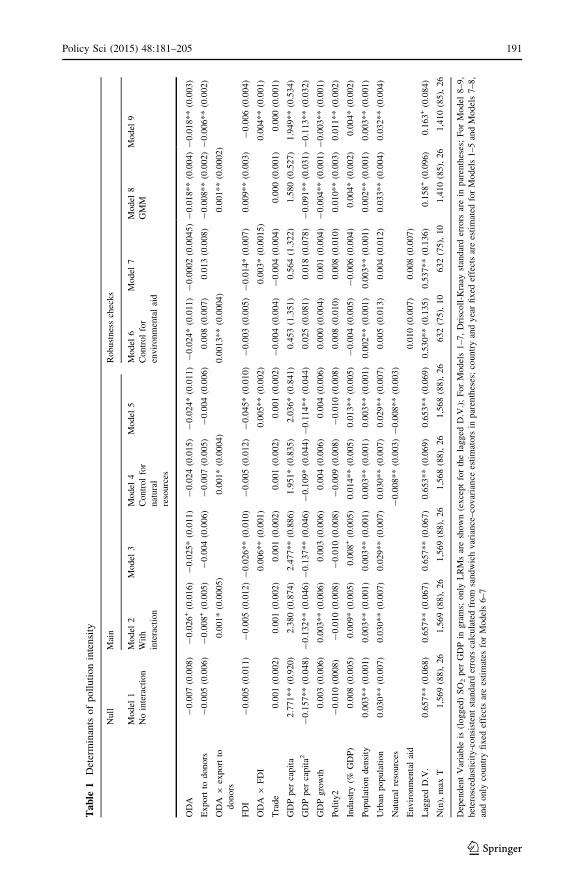
Column 1 in Table 1 reports the results from the most parsimonious model specification,
which lacks any interaction term. None of the resource flows—aid, trade, and FDI—is
statistically significant. Column 2 includes an interaction term for aid, measured as ODA,
and exports to donors. Column 3 includes an interaction term for ODA and FDI inflows.
All of these models include the control variables outlined above. The results of the Column
2 and Column 3 models support our theoretical narrative. First, the negative coefficient
estimates obtained for export to donors (-0.008, in Model 2) and FDI inflows (-0.026, in
Model 3) as lower-order terms confirm the pollution-reducing effect of these revenue flows
in developing countries that receive no foreign aid. We infer that this implies that pro-
environmental pressures emanating from investors and importers located in the North are
affecting host governments. Second, the negative and significant coefficient estimate of the
foreign aid as a lower-order term (-0.026 in Model 2 and -0.025 in Model 3) suggests
that foreign aid has a pollution-reducing effect in countries with no globalization flows
originating in the developed world. This is consistent with Hypothesis 1.
16 We test for remaining serial correlation across our LDV models, and do not find any remaining serialcorrelation. Although our main models are partial adjustment models, we also estimate a more generalAutoregressive Distributed Lag (ADL) specification as a robustness check.
192 Policy Sci (2015) 48:181–205
123

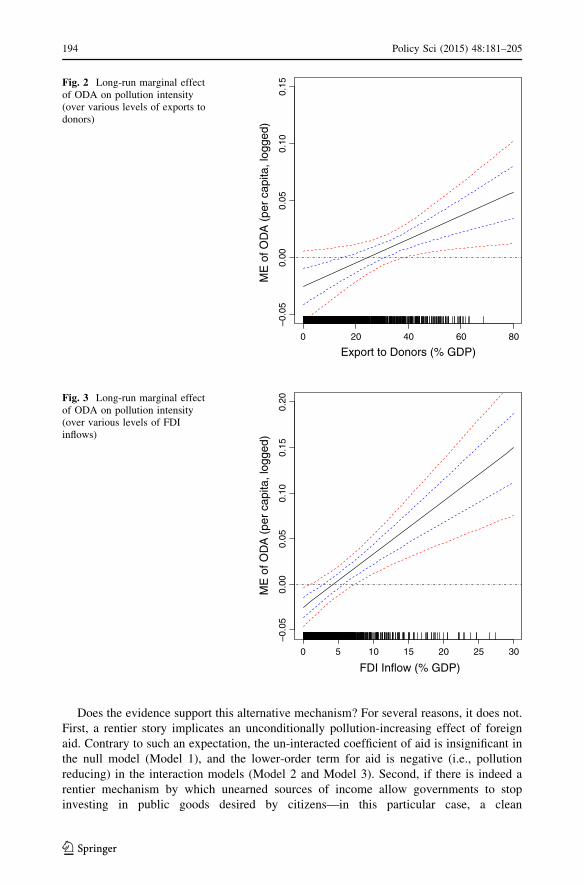
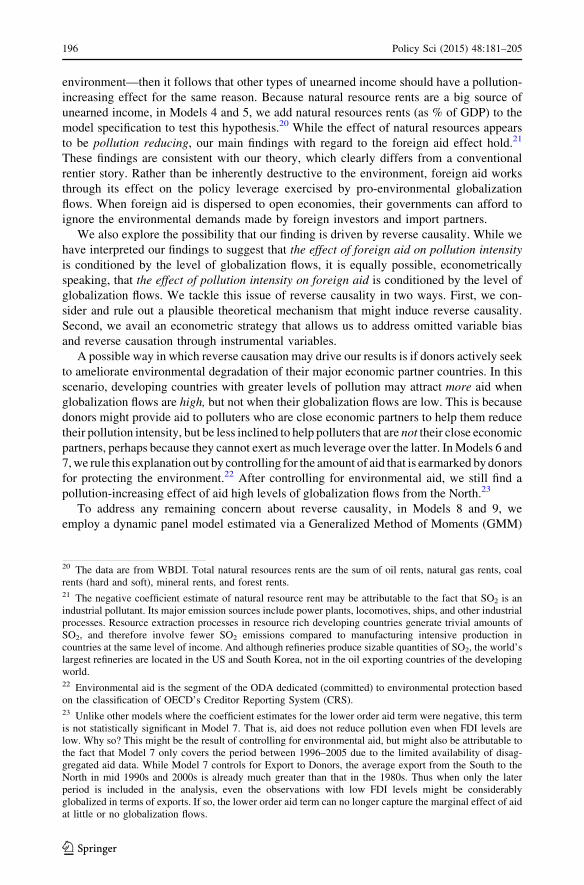
The interaction terms are positive and significant in both models. Following Brambor
et al. (2006), in Figs. 2 and 3, we display the marginal effect of foreign aid on pollution
intensity conditional on recipient countries’ exposure to globalization flows from the
North. Any particular point on the interior solid sloping line is the long-run marginal effect
of foreign aid at different levels of globalization flows.17 The exterior and interior dotted
lines are 95 and 67 % confidence intervals, respectively. They reveal the range of glob-
alization flows under which foreign aid has a statistically significant effect on the pollution
intensity. Aid has a statistically significant pollution-increasing effect whenever lower
bounds of the confidence interval are above the dashed horizontal line marked zero.
Consistent with Hypothesis 2, we find that foreign aid has a pollution-increasing effect
when the recipient country exhibits a greater dependence on globalization flows from the
North. In Fig. 2, the solid sloping interior line indicates that, at the very low levels of
exports to donors, foreign aid has a pollution-reducing effect. The effect is only significant
at the 67 % confidence level, however, which is a weak relationship. The marginal effect
of aid becomes pollution increasing as exports to donors increase. When the level of
exports to donors is greater than 38 %, the pollution-increasing effect of aid is significant at
a 95 % confidence level.18 Likewise, Fig. 3 shows that the marginal effect of aid is
pollution reducing at low levels of FDI, but is pollution increasing when the level of FDI
inflows is greater than 7 % of GDP.19
What are the substantive effects of these interactive relationships? Since the variables
that operationalize both foreign aid and pollution are logged, the magnitude of the marginal
effect can be stated as elasticities. When FDI inflows are close to zero, a 1 % increase in
foreign aid per capita leads to about a 0.03 % decrease in SO2 per unit of GDP. In a large
FDI recipient where FDI inflows are close to 20 % of GDP, however, the same 1 %
increase in foreign aid leads to about a 0.1 % increase in SO2 per unit GDP.
Alternative explanations and reverse causality
Although our findings are consistent with our theoretical narrative, it behooves us to
consider the possibility that alternative explanations may potentially account for the same
finding. Our theoretical narrative emphasizes that developing country governments’ ability
to pursue economic growth, possibly at the expense of the preferences of foreign pro-
environmental stakeholders, increases as a function of the degree of foreign aid it receives.
A potential alternative explanation, however, is a conventional rentier mechanism. A
rentier story would suggest that governments whose budgets depend on nontax sources of
revenue may fail to supply public goods. The logic is that the fiscal link between citizens
and the government is severed by the fact that an aid-dependent government would no
longer need to ‘‘rely’’ on regular taxation to finance its operations or remain in power. This
would render an aid-dependent government politically unaccountable, and more likely to
ignore citizens’ desire for a clean environment (Table 2).
17 LRMAid þ LRMInteracton:term � GlobalizationFlows:18 Exports and FDI tend to be highly correlated. By including both in our model, we are estimating onlytheir unique (non-overlapping) effects on pollution intensities. It makes little sense to drop either of thembecause that would lead to an under-specified model. Nevertheless, because of this collinearity, the resultswe present should be viewed as conservative estimates.19 In different geographic regions and time periods, we find cases where developing countries receivinghigh levels of globalization flows from the North (i.e., levels close to or above the cut points we estimate)also receive increasing amounts of foreign aid. Among the cases are Singapore (during the early 1980s),Congo, Angola, and Cambodia (all during the mid 1990s), and the Czech Republic in the early 2000s.
Policy Sci (2015) 48:181–205 193
123
Does the evidence support this alternative mechanism? For several reasons, it does not.
First, a rentier story implicates an unconditionally pollution-increasing effect of foreign
aid. Contrary to such an expectation, the un-interacted coefficient of aid is insignificant in
the null model (Model 1), and the lower-order term for aid is negative (i.e., pollution
reducing) in the interaction models (Model 2 and Model 3). Second, if there is indeed a
rentier mechanism by which unearned sources of income allow governments to stop
investing in public goods desired by citizens—in this particular case, a clean
–0.0
50.
000.
050.
100.
15
Export to Donors (% GDP)
ME
of O
DA
(pe
r ca
pita
, log
ged)
0 20 40 60 80
Fig. 2 Long-run marginal effectof ODA on pollution intensity(over various levels of exports todonors)
0 5 10 15 20 25 30
–0.0
50.
000.
050.
100.
150.
20
FDI Inflow (% GDP)
ME
of O
DA
(pe
r ca
pita
, log
ged)
Fig. 3 Long-run marginal effectof ODA on pollution intensity(over various levels of FDIinflows)
194 Policy Sci (2015) 48:181–205
123

Table
2Determinantsofpollutionintensity:aiddisaggregationandsplitsample
analyses
Model
10
Model
11
Model
12
Model
13
Model
14
Model
15
ODA
increase
driven
by
bilateral
aid
ODA
increase
driven
by
multilateral
aid
Non/lim
ited
dem
ocracies
Fulldem
ocracies
Below
ormedianveto
point
Abovemedianveto
point
ODA
-0.016(0.008)?
-0.030(0.010)**
-0.020(0.009)*
0.028(0.010)**
-0.014(0.006)*
0.011(0.019)
Multilateral
ODA
-0.006(0.004)?
Bilateral
ODA
0.008(0.004)?
FDI
-0.025(0.012)*
-0.030(0.010)**
-0.035(0.009)**
0.062(0.017)**
-0.039(0.010)**
0.001(0.015)
ODA
9FDI
0.006(0.001)**
0.006(0.001)**
0.008(0.002)**
-0.008(0.002)**
0.011(0.003)**
0.001(0.004)
Exportto
donors
-0.001(0.008)
-0.005(0.005)
-0.006(0.007)
-0.003(0.013)
-0.014(0.007)*
0.016(0.012)
Trade
-0.000(0.002)
0.001(0.002)
0.001(0.002)
0.001(0.004)
-0.001(0.002)
-0.001(0.005)
GDPper
capita
1.512(0.920)
1.865(0.811)*
0.400(0.792)
10.103(3.785)**
2.157(0.918)*
4.758(2.793)*
GDPper
capita2
-0.076(0.050)
-0.094(0.044)*
-0.001(0.042)
-0.623(0.199)**
-0.116(0.048)*
-0.294(0.160)*
GDPgrowth
0.002(0.008)
0.003(0.006)
0.002(0.005)
0.004(0.007)
-0.0002(0.005)
0.001(0.011)
Polity2
-0.004(0.007)
-0.011(0.008)
-0.017(0.010)
-0.011(0.008)
0.011(0.021)
Industry
(%GDP)
0.007(0.006)
0.006(0.005)
-0.004(0.006)
0.021(0.010)*
0.002(0.006)
0.025(0.009)**
Population
density
0.003(0.001)**
0.003(0.001)**
0.002(0.001)**
0.006(0.005)
0.006(0.001)*
0.003(0.001)**
Urban
population
0.017(0.007)**
0.026(0.007)**
0.029(0.006)**
0.028(0.013)*
0.049(0.010)*
-0.008(0.017)
Lagged
D.V.
0.708(0.043)**
0.629(0.064)**
0.589(0.066)**
0.763(0.028)**
0.474(0.071)*
0.842(0.041)**
ObsN
(n),
Max
T1,457(80),26
1,459(80),26
1,061(70),26
506(45),26
785(68),25
782(64),26
NotesDependentVariableis(logged)SO2per
GDPin
grams;only
LRMsareshown(exceptforthelagged
D.V.)withDriscoll-Kraay
standarderrorsin
parentheses;country
andyearfixed
effectsareestimated
Policy Sci (2015) 48:181–205 195
123
environment—then it follows that other types of unearned income should have a pollution-
increasing effect for the same reason. Because natural resource rents are a big source of
unearned income, in Models 4 and 5, we add natural resources rents (as % of GDP) to the
model specification to test this hypothesis.20 While the effect of natural resources appears
to be pollution reducing, our main findings with regard to the foreign aid effect hold.21
These findings are consistent with our theory, which clearly differs from a conventional
rentier story. Rather than be inherently destructive to the environment, foreign aid works
through its effect on the policy leverage exercised by pro-environmental globalization
flows. When foreign aid is dispersed to open economies, their governments can afford to
ignore the environmental demands made by foreign investors and import partners.
We also explore the possibility that our finding is driven by reverse causality. While we
have interpreted our findings to suggest that the effect of foreign aid on pollution intensity
is conditioned by the level of globalization flows, it is equally possible, econometrically
speaking, that the effect of pollution intensity on foreign aid is conditioned by the level of
globalization flows. We tackle this issue of reverse causality in two ways. First, we con-
sider and rule out a plausible theoretical mechanism that might induce reverse causality.
Second, we avail an econometric strategy that allows us to address omitted variable bias
and reverse causation through instrumental variables.
A possible way in which reverse causation may drive our results is if donors actively seek
to ameliorate environmental degradation of their major economic partner countries. In this
scenario, developing countries with greater levels of pollution may attract more aid when
globalization flows are high, but not when their globalization flows are low. This is because
donors might provide aid to polluters who are close economic partners to help them reduce
their pollution intensity, but be less inclined to help polluters that are not their close economic
partners, perhaps because they cannot exert as much leverage over the latter. InModels 6 and
7,we rule this explanation out by controlling for the amount of aid that is earmarked by donors
for protecting the environment.22 After controlling for environmental aid, we still find a
pollution-increasing effect of aid high levels of globalization flows from the North.23
To address any remaining concern about reverse causality, in Models 8 and 9, we
employ a dynamic panel model estimated via a Generalized Method of Moments (GMM)
20 The data are from WBDI. Total natural resources rents are the sum of oil rents, natural gas rents, coalrents (hard and soft), mineral rents, and forest rents.21 The negative coefficient estimate of natural resource rent may be attributable to the fact that SO2 is anindustrial pollutant. Its major emission sources include power plants, locomotives, ships, and other industrialprocesses. Resource extraction processes in resource rich developing countries generate trivial amounts ofSO2, and therefore involve fewer SO2 emissions compared to manufacturing intensive production incountries at the same level of income. And although refineries produce sizable quantities of SO2, the world’slargest refineries are located in the US and South Korea, not in the oil exporting countries of the developingworld.22 Environmental aid is the segment of the ODA dedicated (committed) to environmental protection basedon the classification of OECD’s Creditor Reporting System (CRS).23 Unlike other models where the coefficient estimates for the lower order aid term were negative, this termis not statistically significant in Model 7. That is, aid does not reduce pollution even when FDI levels arelow. Why so? This might be the result of controlling for environmental aid, but might also be attributable tothe fact that Model 7 only covers the period between 1996–2005 due to the limited availability of disag-gregated aid data. While Model 7 controls for Export to Donors, the average export from the South to theNorth in mid 1990s and 2000s is already much greater than that in the 1980s. Thus when only the laterperiod is included in the analysis, even the observations with low FDI levels might be considerablyglobalized in terms of exports. If so, the lower order aid term can no longer capture the marginal effect of aidat little or no globalization flows.
196 Policy Sci (2015) 48:181–205
123

approach.24 Specifically, we employ a structure (difference) GMM approach designed for
‘‘small T, large N’’ panel datasets (Roodman 2009a) and suited for a stationary-dependent
variable such as our own. While the structure GMM estimation transforms the equation
into first differences to expunge the country fixed effects, the potentially endogenous
regressors are instrumented with some of their lags in levels. This is possible because these
lags should be uncorrelated with the error term. Specifically, while the first-differenced
LDV is instrumented with its second through fourth lags in levels, we instrument aid,
globalization flows (Export to Donors/FDI), and its interaction term with their second lags
in levels.25
Our main finding is robust to this strategy. The significant and negative coefficient
estimates of the lower-order terms for aid in both models suggest aid is pollution reducing
at low levels of Export to Donors (in Model 8) and FDI (in Model 9). And as the significant
and positive coefficient estimates of the interaction terms suggest, aid becomes pollution
increasing as the levels of globalization flows rise. Moreover, the GMM assumptions
appear to be satisfied in both Model 8 and Model 9. A Sargan test of the over-identifying
restrictions returns a chi-square test statistic of 85 (p value = 0.99) in both, failing to reject
the hypothesis that the instrumental variables required by the GMM approach are exog-
enous. An Arellano-Bond test of AR(2) returns a z-score of 1.028 (p value = 0.15) in
Model 8 and a z-score of 0.75 (p value = 0.23) in Model 9, satisfying the requirement that
there will be no autocorrelation in levels.
Donor characteristics and domestic politics
In this section, we discuss the more nuanced versions of our theoretical mechanism. The
gist of our argument has been that foreign aid as an environmentally neutral source of
revenue enhances the resources at a recipient government’s discretion, possibly at the
expense of pro-environmental leverage of globalization flows. Yet, there might be varia-
tion in how much discretion recipient governments enjoy. Specifically, this discretion
might vary by (1) the type of donor the government receives aid from, and also by (2) a
recipient country’s domestic political institutions.
When it comes to the type of donor, we focus on the potential difference between
bilateral ODA and multilateral ODA. Bilateral ODA is more likely to be driven by nar-
rowly defined common interests between two governments, such as the political survival of
the recipient’s government or exploiting the recipient’s market for donor’s economic
interests (Wagner 2003). This should align the incentives of donors and political incum-
bents, allowing the latter to pursue their political agenda unencumbered by the pressures
from external stakeholders. Specifically, this should give recipient governments more
leeway to neglect environmental protection in favor of economic growth. Multilateral
ODA, on the other hand, tends to more sensitive to the long-run sustainability of the
recipient’s development strategy (Lebovic and Voeten 2009). Multilateral donors might
encourage recipient governments to engage in sustainable development as a quid-pro-quo
for future aid. If so, the pollution-reducing effect of aid (Hypothesis 1) might be weaker in
24 This technique also addresses the possibility that, in our previous models, Nickell bias is distorting ourresults due to the correlation between the lagged dependent variable and country fixed effects.25 As we have a relatively long time dimension (the maximum is 26 years), to prevent instrument prolif-eration we use instruments at these lag depths rather than using all available lags (Roodman 2009b).
Policy Sci (2015) 48:181–205 197
123
the context of bilateral aid, while the pollution-increasing interaction effect (Hypothesis 2)
might be more pronounced.
We find some support for this argument in Model 10 and Model 11. In Model 10, we
control for multilateral aid to examine the marginal effect of ODA when an aid increase is
in the form of bilateral aid. In Model 11, we control for bilateral aid in the model to
examine the marginal effect of ODA when an aid increase is driven by multilateral aid.
While the size of the interaction term coefficients is similar in both models (0.006), the
coefficient estimates of the lower-order ODA term are more pollution reducing when ODA
increases are driven by multilateral aid (-0.030, Model 11) versus bilateral aid (-0.016,
Model 10). This suggests that the pollution-reducing effect of bilateral ODA is not only
weaker to begin with, but also the effect is more easily nullified and reversed at relatively
modest level of FDI (about 2.6 % of GDP) than the pollution-reducing effect of multi-
lateral ODA (which are nullified at FDI inflows greater than 5 % of GDP).
It should also be the case that variation in domestic politics, centered on differences in
formal institutions, affects the hypothesized relationship between aid, trade/FDI, and
environmental protection.26 This is because governments’ willingness to respond to/
neglect pressures from foreign stakeholders is influenced by institutional constraints that
pluralize political power (Spilker 2012). Following Tsebelis (1995) and Henisz (2010), a
larger number of veto points can make executives less responsive to demands made by
pressure group. Institutions such as independent judiciaries, separately elected legislatures,
competitive political parties, and a free media would make it much harder for these
groups, including foreign traders and investors, to capture policymaking, for either good
or ill.
We expect executives that face a greater number of such constraints to be less sus-
ceptible to pressures (either pro-environmental or anti-environmental) from foreign
stakeholders than those who face fewer constraints. If pro-environmental foreign stake-
holders’ leverage is weak to begin with, the level of globalization flows from the North is
unlikely to serve as a conditioning environment of foreign aid effect. Thus, our hypoth-
esized mechanism will be more pronounced in countries where executives face fewer
institutional constraints.
We test this hypothesis by conducting split sample analyses.27 We first split countries by
their level of democracy; specifically, by whether they are full versus limited democracies,
following Gleditsch and Ward (2006). We then split countries by their veto points using the
Political Constraint Index III (Henisz 2010), separating observations into those below or at
the median number of veto points and those above the median. The results from the split
sample analyses are summarized in Models 12 through 15. The results are consistent with
our expectations. Our findings hold in the sample of limited/nondemocracies, but not in full
democracies where executives tend to face many domestic constraints. Similarly, our
findings hold in countries with low political constraints expressed as veto points, but not
when incumbents face a large number of veto points.
26 In our earlier models, the Polity 2 Score was included as a control variable. The coefficient estimates ofthis variable (which capture the average marginal effect of regime type on pollution intensity) wereinsignificant.27 Rather than introducing three-way-interaction terms, we conduct split sample analyses to allow theeffects of independent and control variables to vary by regime type as well.
198 Policy Sci (2015) 48:181–205
123
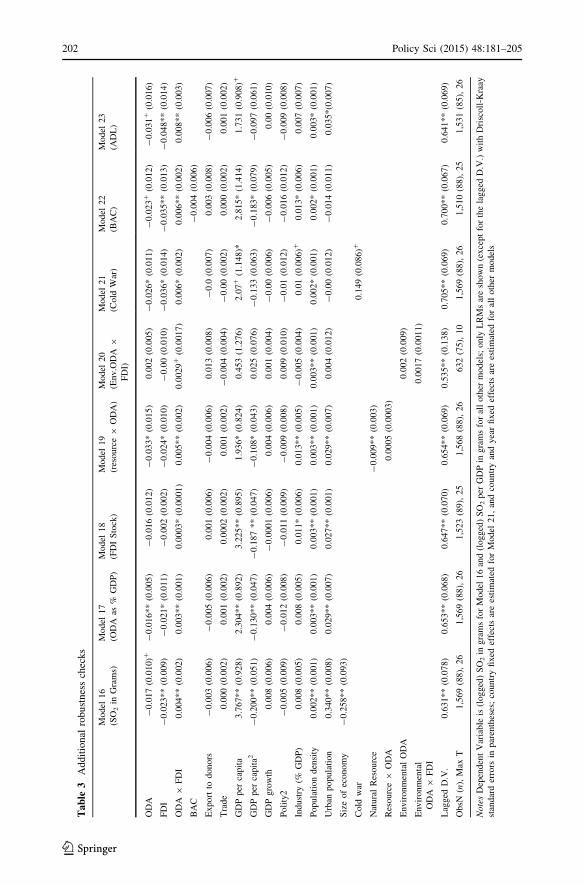
Additional robustness checks
We report several additional robustness checks in the ‘‘Appendix’’ (Model 16-Model23).Model
16 employs (logged) SO2 emissions in gramswithout being denominated in terms ofGDPas the
dependent variable. Model 17 employs ODA as a percentage of GDP (Lundsgaarde et al. 2007)
instead of ODA per capita.Model 18 employs a stockmeasure of FDI instead of FDI measured
as a flow. The interaction effects are significant across each of these models; therefore, our
findings are not sensitive to the ways in which the key variables are operationalized.
In addition to the interaction between ODA and FDI, Model 19 adds an interaction term
between ODA and natural resources, and Model 20 adds an interaction between environ-
mental aid and FDI. Even when these additional interaction dynamics are included, our main
finding holds. The newly added interaction terms are positive (i.e., pollution increasing), but
their substantive effects are small and not statistically significant. These results suggest that
while many different sources of revenue may potentially work in interaction to influence a
developing country government’s incentives, the more prominent interaction affecting
pollution intensity is between the economic globalization flows and the overall ODA. In
Model 21, we examine whether our finding is being driven by the Cold War period, when
donor countries’ environmental consciousness was arguably overwhelmed by geopolitical
confrontations. Our results hold when a Cold War dummy variable is included in the
specification. The coefficient estimates of the lower-order ODA term and the interaction
term are very similar to those from Model 3, our main model.
In Model 22, we examine whether our findings are being driven by donorwise variation
in environmental preferences. Instead of treating foreign aid as an undifferentiated cate-
gory, we construct a spatial lag variable capturing the variation in the environmental
intensities of bilateral donors, as reflected in their own pollution intensity. The new var-
iable, bilateral aid context (BAC), is the weighted average of donors’ SO2 intensity:
Bilateral Aid Context BACð Þi¼Xj
1
SO2 Intensityj � Bilateral Aidij=Total Bilateral Aidi� �
where county i is the bilateral aid recipient that receives aid form j number of donors. We
include a 1-year lag of the logged BAC in the model specification. Low values of BAC
suggest that the recipient has an environmentally conscious aid context. Our results hold
when BAC is controlled for.
Lastly, Model 23 examines whether our finding is driven by the dynamic model
specification. It has been shown that partial adjustment models, such as those we reported
above, potentially impose invalid restrictions on the structure of the data, thereby biasing
the results (De Boef and Keele 2008). Thus, in Model 18, we estimate a rational,
infinitely distributed lag model as an autoregressive distributed lag model (ADL). Such a
model allows us to be agnostic about the lag structure and does not run the risk of
imposing invalid restrictions on the dynamic process and allows us to estimate the long-
run effect of a change of the independent variables on the level of the dependent vari-
able. Specifically, the model specification now includes the 1-year lag of the dependent
variable and the independent variables of interest are entered both contemporaneously
and with a 1-year lag.28 As with the partial adjustment models estimated above, the
28 SO2Intensityit ¼ /1SO2Intensityi;t�1 þ c1Aidit þ c2Aidi;t�1 þ c3Globalization Flowit þ c4GlobalizationFlowi;t�1 þ c5Aid� Globalization Flowit þ c6Aid� Globalization Flowi;t�1 þ xitb1 þ xi;t�1b2 þ ai þ stþeit:
Policy Sci (2015) 48:181–205 199
123
standard errors of the LRM coefficients, which is the sum of the coefficients on the
independent variables at time t and t-1 divided by (1-the coefficient on the lagged
dependent variable, /), are computed. Our findings are robust to this estimation strategy.
This suggests that the partial adjustment models estimated above are not imposing invalid
restrictions.
Conclusion
Since the 1980s, developing countries have been urged, and sometimes coerced by the
IMF and the World Bank, to liberalize their economies. This trend accelerated in the
1990s. In the last decade, there have also been calls to increase levels of foreign aid
flows to developing countries. While the intentions behind such efforts are laudable, we
believe the interactive effects of globalization flows and foreign aid have not been
adequately understood. Our paper provides some evidence that aid can have unex-
pected, negative environmental consequences in many developing countries that depend
heavily on globalization flows from the North. Because aid is an intergovernmental
flow and trade and FDI are private flows, their negative interaction effect on envi-
ronmental quality poses interesting policy challenges to donors, recipients, and firms
alike.
Empirically, the negative interaction effect between aid and globalization flows is
driven by aid increases in a country with a high level of export receipts/FDI inflows from
the North. Our theory suggests that the main actor driving this effect is the recipient
government, which uses the aid as leverage against pro-environmental pressures emanating
from foreign importers/investors to drive economic growth to its preferred level. The key
to addressing this negative interaction effect thus lies in changing the recipient govern-
ments’ incentives.
One strategy to accomplish this is to foster environmental demand among the constit-
uents that developing country governments are responsive to, perhaps by creating insti-
tutions that link environmental protection with profits in the domestic private sector. Once
in place, certain domestic actors would develop a vested interest in maintaining such
institutions, regardless of their linkages with, and responsiveness to, foreign pro-envi-
ronmental exporters and investors. For example, creating a market for pollution (e.g., a
cap-and-trade system) might potentially create and provoke pro-environmental preferences
among domestic firms who can then lobby the government in this regard. There is some
evidence that market-oriented environmental policies have been successfully adopted in
the developing world (Coria and Sterner 2010; Grieg-Gran, et al. 2005). Indeed, China is
currently implementing cap-and-trade systems across the country to include Shenzhen,
Beijing, Tianjin, Shanghai, and Chongqing, as well as the provinces of Guangdong and
Hubei. These polices can be combined with other, more traditional, regulations that seek to
reduce pollution, such as command and control regimes that impose limits on emission
rates, Pigovian taxes on harmful emissions, or subsidies for green technologies—the latter
having the advantage of also helping to create stakeholders that have a pecuniary interest
on sustaining pro-environmental policies.
The recipient countries’ incentives may change if they are subjected to a powerful
countervailing force that can neutralize the leverage provided by foreign aid. Developed
country governments could include explicit and ‘‘hard’’ environmental clauses in trade
agreements with developing countries, or link these agreements with environmental treaty
200 Policy Sci (2015) 48:181–205
123

ratifications. While there is much debate on the efficacy of international treaties, one
advantage is that they make a country’s commitments internationally visible. The fear of
incurring reputational damage might subsequently deter governments from violating these
treaties or withdrawing from them.
Last but not least, recipient countries’ incentives might change if they receive
explicit environmental pressure from aid donors. For example, donors can seek to offer
aid incentives based on recipients’ environment-related performance, including condi-
tioning the size of future aid flows. One way in which this can be facilitated is by
empowering domestic stakeholders to monitor both recipient governments and donors
in a manner similar to the Extractive Industries Transparency Initiative (EITI) that has
taken hold among oil and mineral producers in the developing world. The EITI is a
voluntary, multilateral system. To be designated as compliant, a country must satisfy
twenty-one requirements, each of them quite stringent. These include completing a
validation audit within two and a half years of becoming a candidate and undergoing
validation every 5 years after becoming a candidate. The validation process is overseen
by a multi-stakeholder consortium that guarantees that EITI standards are met. EITI
participation also calls on contract disclosure in general, which helps government
agencies, citizens, and NGOs monitor and inspect extractive sectors in the developing
world.
Such a system could be duplicated for foreign aid and include covenants that obligate
developing country governments to invest the flows in environmentally responsive ways.
Recipient governments, not just donors, would be required to publish and disseminate the
amounts of foreign aid they received and for what purposes it was deployed. Moreover,
foreign importers and investors might form part of the group of stakeholders who monitor
compliance with EITI-type requirements.
We believe this paper opens up an important area for future research. Policy scholars
should build on to our suggestion and discuss measures to create incentives that can
ameliorate the negative effects of the aid and economic globalization combination. What
are the sticks and carrots that can be availed to make this combination of resource inflows
work better for developing countries? How can international institutions and donors
constrain the discretion of recipient governments that deploy foreign aid toward growth
strategies that neglect environmental sustainability when their economies are highly
integrated with the global economy? How can the domestic actors in recipient developing
countries be incentivized to constrain their own governments from trading off too much
environment protection for growth in the short run? Future research should attempt to offer
answers to these vital questions.
Appendix
See Tables 3 and 4.
Policy Sci (2015) 48:181–205 201
123
Table
3Additional
robustnesschecks
Model
16
(SO2in
Grams)
Model
17
(ODA
as%
GDP)
Model
18
(FDIStock)
Model
19
(resource9
ODA)
Model
20
(Env.ODA
9
FDI)
Model
21
(Cold
War)
Model
22
(BAC)
Model
23
(ADL)
ODA
-0.017(0.010)?
-0.016**(0.005)
-0.016(0.012)
-0.033*(0.015)
0.002(0.005)
-0.026*(0.011)
-0.023?(0.012)
-0.031?(0.016)
FDI
-0.023**(0.009)
-0.021*(0.011)
-0.002(0.002)
-0.024*(0.010)
-0.00(0.010)
-0.036*(0.014)
-0.035**(0.013)
-0.048**(0.014)
ODA
9FDI
0.004**(0.002)
0.003**(0.001)
0.0003*(0.0001)
0.005**(0.002)
0.0029?(0.0017)
0.006*(0.002)
0.006**(0.002)
0.008**(0.003)
BAC
-0.004(0.006)
Exportto
donors
-0.003(0.006)
-0.005(0.006)
0.001(0.006)
-0.004(0.006)
0.013(0.008)
-0.0
(0.007)
0.003(0.008)
-0.006(0.007)
Trade
0.000(0.002)
0.001(0.002)
0.0002(0.002)
0.001(0.002)
-0.004(0.004)
-0.00(0.002)
0.000(0.002)
0.001(0.002)
GDPper
capita
3.767**(0.928)
2.304**(0.892)
3.225**(0.895)
1.936*(0.824)
0.453(1.276)
2.07?(1.148)*
2.815*(1.414)
1.731(0.908)?
GDPper
capita2
-0.200**(0.051)
-0.130**(0.047)
-0.187**(0.047)
-0.108*(0.043)
0.025(0.076)
-0.133(0.063)
-0.183*(0.079)
-0.097(0.061)
GDPgrowth
0.008(0.006)
0.004(0.006)
-0.0001(0.006)
0.004(0.006)
0.001(0.004)
-0.00(0.006)
-0.006(0.005)
0.00(0.010)
Polity2
-0.005(0.009)
-0.012(0.008)
-0.011(0.009)
-0.009(0.008)
0.009(0.010)
-0.01(0.012)
-0.016(0.012)
-0.009(0.008)
Industry
(%GDP)
0.008(0.005)
0.008(0.005)
0.011*(0.006)
0.013**(0.005)
-0.005(0.004)
0.01(0.006)?
0.013*(0.006)
0.007(0.007)
Populationdensity
0.002**(0.001)
0.003**(0.001)
0.003**(0.001)
0.003**(0.001)
0.003**(0.001)
0.002*(0.001)
0.002*(0.001)
0.003*(0.001)
Urban
population
0.340**(0.008)
0.029**(0.007)
0.027**(0.001)
0.029**(0.007)
0.004(0.012)
-0.00(0.012)
-0.014(0.011)
0.035*(0.007)
Sizeofeconomy
-0.258**(0.093)
Cold
war
0.149(0.086)?
NaturalResource
-0.009**(0.003)
Resource9
ODA
0.0005(0.0003)
EnvironmentalODA
0.002(0.009)
Environmental
ODA
9FDI
0.0017(0.0011)
Lagged
D.V.
0.631**(0.078)
0.653**(0.068)
0.647**(0.070)
0.654**(0.069)
0.535**(0.138)
0.705**(0.069)
0.700**(0.067)
0.641**(0.069)
ObsN
(n),Max
T1,569(88),26
1,569(88),26
1,523(89),25
1,568(88),26
632(75),10
1,569(88),26
1,510(88),25
1,531(85),26
NotesDependentVariable
is(logged)SO2in
gramsforModel
16and(logged)SO2per
GDPin
gramsforallother
models;only
LRMsareshown(exceptforthelagged
D.V.)withDriscoll-K
raay
standarderrors
inparentheses;countryfixed
effectsareestimated
forModel
21,andcountryandyearfixed
effectsareestimated
forallother
models
202 Policy Sci (2015) 48:181–205
123
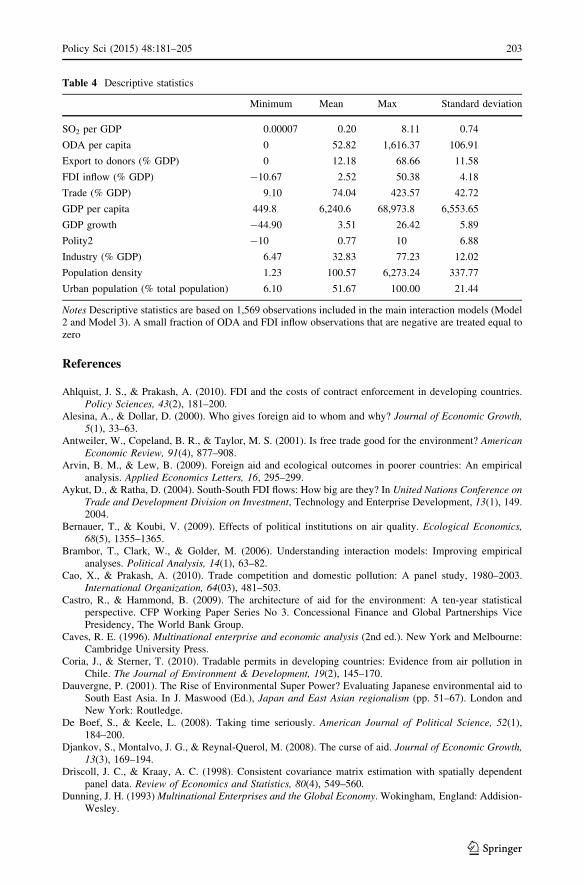
References
Ahlquist, J. S., & Prakash, A. (2010). FDI and the costs of contract enforcement in developing countries.Policy Sciences, 43(2), 181–200.
Alesina, A., & Dollar, D. (2000). Who gives foreign aid to whom and why? Journal of Economic Growth,5(1), 33–63.
Antweiler, W., Copeland, B. R., & Taylor, M. S. (2001). Is free trade good for the environment? AmericanEconomic Review, 91(4), 877–908.
Arvin, B. M., & Lew, B. (2009). Foreign aid and ecological outcomes in poorer countries: An empiricalanalysis. Applied Economics Letters, 16, 295–299.
Aykut, D., & Ratha, D. (2004). South-South FDI flows: How big are they? In United Nations Conference onTrade and Development Division on Investment, Technology and Enterprise Development, 13(1), 149.2004.
Bernauer, T., & Koubi, V. (2009). Effects of political institutions on air quality. Ecological Economics,68(5), 1355–1365.
Brambor, T., Clark, W., & Golder, M. (2006). Understanding interaction models: Improving empiricalanalyses. Political Analysis, 14(1), 63–82.
Cao, X., & Prakash, A. (2010). Trade competition and domestic pollution: A panel study, 1980–2003.International Organization, 64(03), 481–503.
Castro, R., & Hammond, B. (2009). The architecture of aid for the environment: A ten-year statisticalperspective. CFP Working Paper Series No 3. Concessional Finance and Global Partnerships VicePresidency, The World Bank Group.
Caves, R. E. (1996). Multinational enterprise and economic analysis (2nd ed.). New York and Melbourne:Cambridge University Press.
Coria, J., & Sterner, T. (2010). Tradable permits in developing countries: Evidence from air pollution inChile. The Journal of Environment & Development, 19(2), 145–170.
Dauvergne, P. (2001). The Rise of Environmental Super Power? Evaluating Japanese environmental aid toSouth East Asia. In J. Maswood (Ed.), Japan and East Asian regionalism (pp. 51–67). London andNew York: Routledge.
De Boef, S., & Keele, L. (2008). Taking time seriously. American Journal of Political Science, 52(1),184–200.
Djankov, S., Montalvo, J. G., & Reynal-Querol, M. (2008). The curse of aid. Journal of Economic Growth,13(3), 169–194.
Driscoll, J. C., & Kraay, A. C. (1998). Consistent covariance matrix estimation with spatially dependentpanel data. Review of Economics and Statistics, 80(4), 549–560.
Dunning, J. H. (1993)Multinational Enterprises and the Global Economy. Wokingham, England: Addision-Wesley.
Table 4 Descriptive statistics
Minimum Mean Max Standard deviation
SO2 per GDP 0.00007 0.20 8.11 0.74
ODA per capita 0 52.82 1,616.37 106.91
Export to donors (% GDP) 0 12.18 68.66 11.58
FDI inflow (% GDP) -10.67 2.52 50.38 4.18
Trade (% GDP) 9.10 74.04 423.57 42.72
GDP per capita 449.8 6,240.6 68,973.8 6,553.65
GDP growth -44.90 3.51 26.42 5.89
Polity2 -10 0.77 10 6.88
Industry (% GDP) 6.47 32.83 77.23 12.02
Population density 1.23 100.57 6,273.24 337.77
Urban population (% total population) 6.10 51.67 100.00 21.44
Notes Descriptive statistics are based on 1,569 observations included in the main interaction models (Model2 and Model 3). A small fraction of ODA and FDI inflow observations that are negative are treated equal tozero
Policy Sci (2015) 48:181–205 203
123
Egels-Zanden, N. (2007). Suppliers’ compliance with MNCs’ codes of conduct: Behind the scenes atChinese toy suppliers. Journal of Business Ethics, 75(1), 45–62.
Eskeland, G., & Harrison, A. (2003). Moving to greener pastures? Multinationals and the pollution havenhypothesis. Journal of Development Economics, 70(1), 1–23.
Farag, M., Nandakumar, A. K., Wallack, S. S., Gaumer, G., & Hodgkin, D. (2009). Does funding fromdonors displace government spending for health in developing countries? Health Affairs, 28(4),1045–1055.
Ferejohn, J. (1986). Incumbent performance and electoral control. Public Choice, 50(1), 5–25.Ferejohn, J. (1999). Accountability and authority: Toward a theory of political accountability. In A. Prze-
worski, S. Stokes, & B. Manin (Eds.), Democracy, accountability, and representation. Cambridge:Cambridge University Press.
Feyzioglu, T., Swaroop, V., & Zhu, M. (1998). A panel data analysis of the fungibility of foreign aid. TheWorld Bank Economic Review, 12(1), 29–58.
Frank, A. G. (1967). Capitalism and underdevelopment in Latin America. New York: Monthly ReviewPress.
Galetovic, A., & Sanhueza, R. (2000). Citizens, autocrats, and plotters: A model and new evidence on coupsd’etat. Economics and Politics, 12(2), 183–204.
Gallego, M., & Pitchik, C. (2004). An economic theory of leadership turnover. Journal of Public Economics,88(12), 2361–2382.
Gibson, C. C., Andersson, K., Ostrom, E., & Shivakumar, S. (2005). The samaritan’s dilemma. C. C. Gibson(Ed.). New York (NY): Oxford University Press.
Gleditsch, K. S., & Ward, M. D. (2006). Diffusion and the international context of democratization.International Organization, 60(4), 911.
Greenhill, B., Mosley, L., & Prakash, A. (2009). Trade and labor rights: A panel study, 1986–2002.American Political Science Review, 103(4), 669–690.
Grieg-Gran, M., Porras, I., & Wunder, S. (2005). How can market mechanisms for forest environmentalservices help the poor? Preliminary lessons from Latin America. World Development, 33(9),1511–1527.
Grossman, G., & Kreuger, A. B. (1995). Economic growth and the environment. Quarterly Journal ofEconomics, 110(2), 353–375.
Gutner, T. L. (2002). Banking on the environment: Multilateral development banks and their environmentalperformance in Central and Eastern Europe. MA: MIT Press.
Haber, S., & Menaldo, V. (2011). Do natural resources fuel authoritarianism? A reappraisal of the resourcecurse. American Political Science Review, 105(1), 1–26.
Hamilton, K., & Clemens, M. (1999). Genuine savings rates in developing countries. The World BankEconomic Review, 13(2), 333–356.
Henisz, W. J. (2010). Political constraint index (POLCON). Wharton School of the University ofPennsylvania.
Hibbs, D. (2000). Bread and peace voting in U.S. presidential elections. Public Choice, 104, 149–180.Hibbs, D. (2001). The politicization of growth theory. Kyklos, 54, 265–286.Hicks, R. L., Parks, B. C., Roberts, J. T., & Tierney, M. J. (2008). Greening aid? Understanding the
environmental impact of development assistance. Oxford: Oxford University Press.Jaffe, A. B., Peterson, S. R., Portney, P. R., & Stavins, R. N. (1995). Environmental regulation and the
competitiveness of US manufacturing: What does the evidence tell us? Journal of Economic Litera-ture, 33, 132–163.
King, A. A., & Shaver, J. M. (2001). Are aliens green? Assessing foreign establishments’ environmentalconduct in the United States. Strategic Management Journal, 22(11), 1069–1085.
Knack, S. (2001). Aid dependence and the quality of governance: Cross-country empirical tests. SouthernEconomic Journal, 68(2), 310–329.
Lebovic, J. H., & Voeten, E. (2009). The cost of shame: international organizations and foreign aid in thepunishing of human rights violators. Journal of Peace Research, 46(1), 79–97.
Levinson, A. (2010). Offshoring pollution: Is the U.S. increasingly importing polluting goods? Review ofEnvironmental Economics and Policy, 4(1), 63–83.
Li, Q., & Reuveny, R. (2006). Democracy and environmental degradation. International Studies Quarterly,50(4), 935–956. 27.
Lundsgaarde, E., Breunig, C., & Prakash, A. (2007). Trade versus Aid? donor generosity in the era ofglobalization. Policy Sciences, 40(2), 157–179.
Madsen, P. M. (2009). Does corporate investment drive a race to the bottom in environmental protection? Areexamination of the effect of environmental regulation on investment. Academy of ManagementJournal, 52(6), 1297–1318.
204 Policy Sci (2015) 48:181–205
123
Mohamad, M. (1992). Speech at the official opening of the 2nd Ministerial conference of developingcountries on environment and development, http://www.mahathir.com/malaysia/speeches/1992/1992-04-27.php.
Nielson, D., & Tierney, M. (2003). Delegation to international organizations: Agency theory and world bankenvironmental reform. International Organization, 57(2), 241–276.
Park, S. (2005). How transnational environmental advocacy networks socialize international financialinstitutions. Global Environmental Politics, 5(4), 95–119.
Pauly, L., & Reich, S. (1997). National structures and multinational corporate behaviors. InternationalOrganization, 51(1), 1–30.
Perkins, R., & Neumayer, E. (2012). Does the ‘California effect’ operate across borders? Journal ofEuropean Public Policy, 19(2), 217–237.
Prakash, A., & Potoski, M. (2006). Racing to the bottom? Globalization, environmental governance, andISO 14001. American Journal of Political Science, 50(2), 347–361.
Prakash, A., & Potoski, M. (2007). Investing up: FDI and the cross-country diffusion of ISO 14001management systems. International Studies Quarterly, 51(3), 723–744.
Rivera, J., & Oh, C. H. (2013). Environmental regulations and multinational corporations’ foreign marketentry investments. Policy Studies Journal, 41(2), 243–272.
Rogoff, K. (1990). Equilibrium political budget cycles. American Economic Review, 80, 21–36.Roodman, D. (2009a). A note on the theme of too many instruments. Oxford Bulletin of Economics and
Statistics, 71(1), 135–158.Roodman, D. (2009b). How to do xtabond2: An introduction to difference and system GMM inStata. Stata
Journal, 9(1), 86.Ross, M. (1996). Conditionality and logging reform in the tropics. In R. O. Keohane & M. A. Levy (Eds.),
Institutions for environmental aid (pp. 167–197). MA: MIT Press.Saikawa, E. (2013). Policy diffusion of emission standards is there a race to the top? World Politics, 65(01),
1–33.Spilker, G. (2012). Globalization, political institutions, and the environment in developing countries.
Routledge.Stern, D. I. (2005). Global sulfur emissions from 1850 to 2000. Chemosphere, 58(2), 163–175.Tiebout, C. (1956). A pure theory of local expenditures. The Journal of Political Economy, 64(5), 416–424.Tsebelis, G. (1995). Decision making in political systems: Veto players in presidentialism, parliamentarism,
multicameralism and multipartyism. British Journal of Political Science, 25(3), 289–325.Vogel, D. (1995). Trading up. Cambridge: Harvard University Press.Waddington, C. (2004). Does earmarked donor funding make it more or less likely that developing countries
will allocate their resources towards programmes that yield the greatest health benefits? Bulletin of theWorld Health Organization, 82, 703–708.
Wagner, D. (2003). Aid and trade-an empirical study. Journal of the Japanese and International Economies,17(2), 153–173.
Yang, C. (2008). Corporate social responsibility and china overseas extractive industry operations:Achieving sustainable natural resource extraction. Foundation for Environmental Security and Sus-tainability (FESS) Issue Brief.
Younas, J., & Bandyopadhyay, S. (2009). Do donors care about declining trade revenue from liberalization?An analysis of bilateral aid allocation. Federal Reserve Bank of St. Louis Review, 91(3), 141–151.
Zaheer, S. (1995). Overcoming the liability of foreignness. Academy of Management Journal, 38(2),341–343.
Policy Sci (2015) 48:181–205 205
123