Embed Size (px)
Citation preview
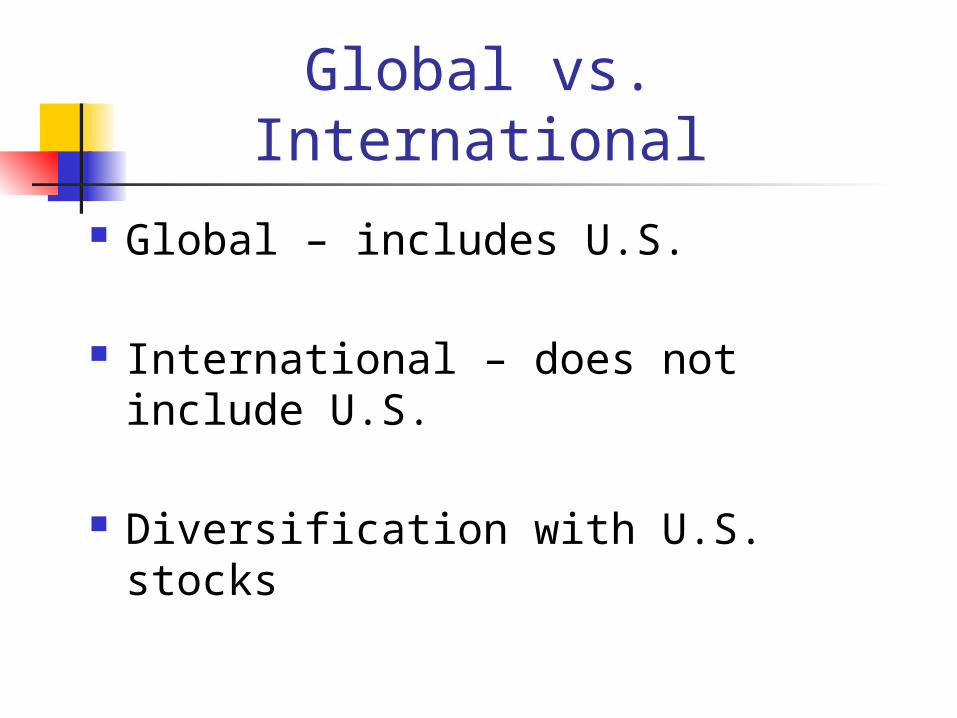
Global vs. International Global – includes U.S.
International – does not include U.S.
Diversification with U.S. stocks
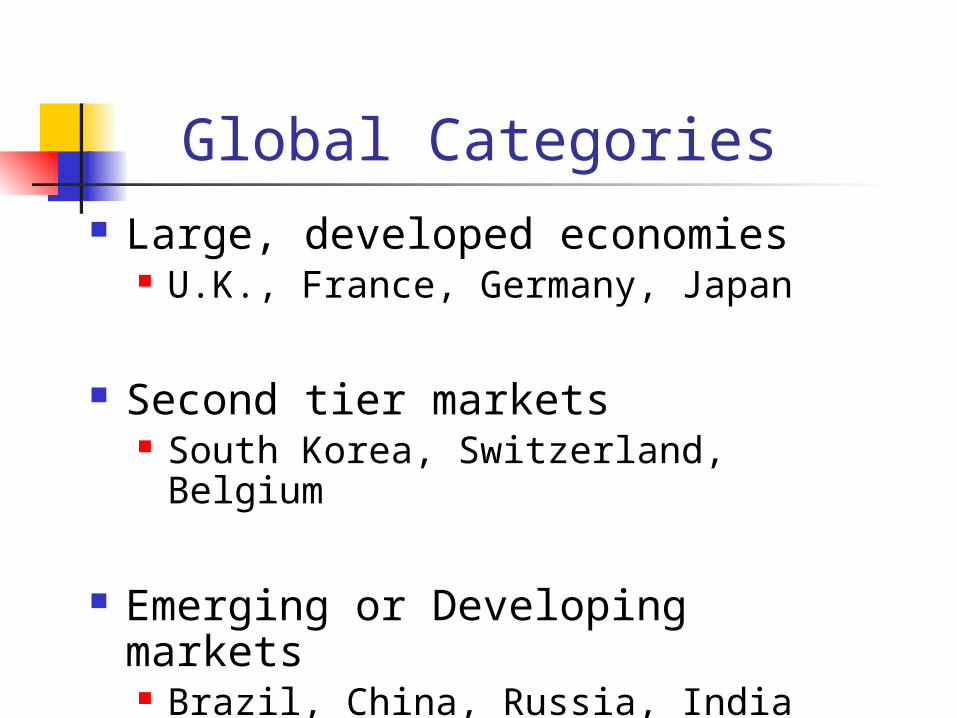
Global Categories Large, developed economies
U.K., France, Germany, Japan
Second tier markets South Korea, Switzerland, Belgium
Emerging or Developing markets Brazil, China, Russia, India
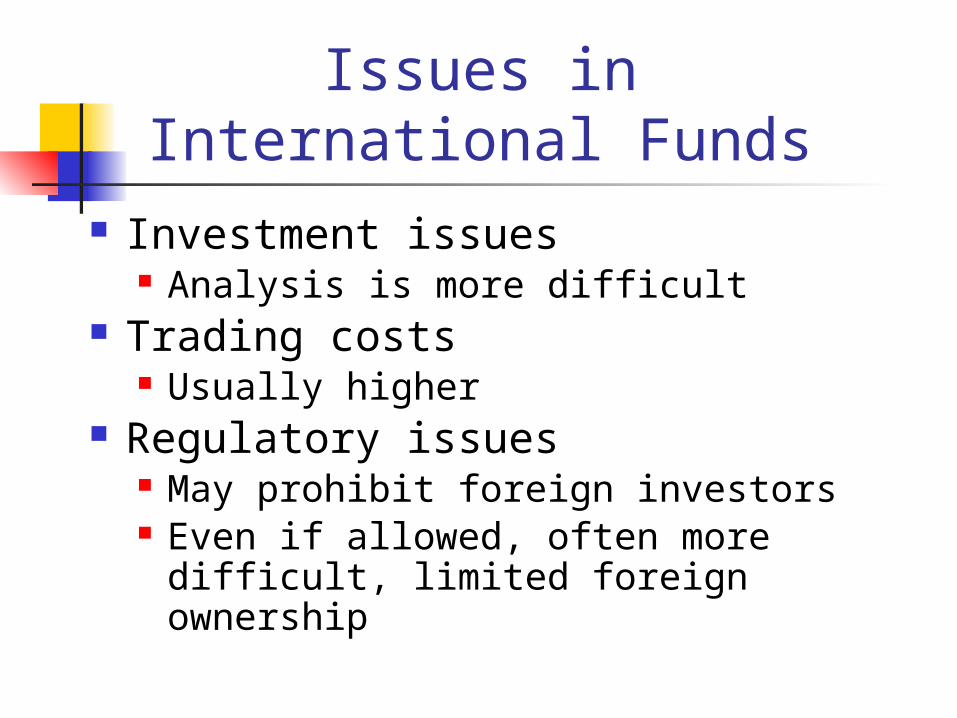
Issues in International Funds
Investment issues Analysis is more difficult
Trading costs Usually higher
Regulatory issues May prohibit foreign investors Even if allowed, often more difficult,
limited foreign ownership
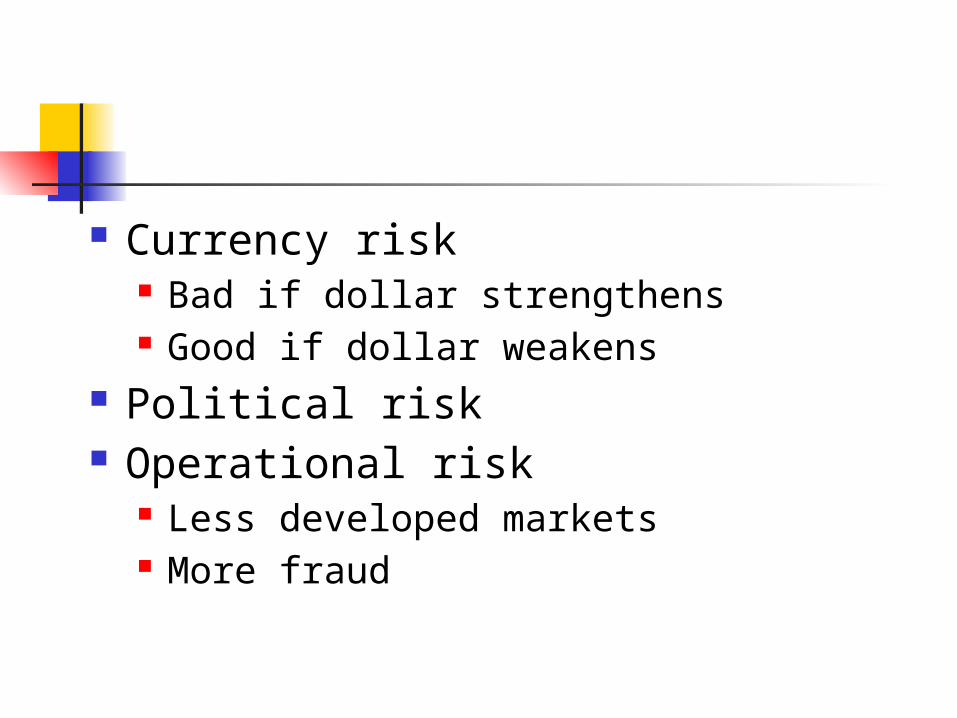
Currency risk Bad if dollar strengthens Good if dollar weakens
Political risk Operational risk
Less developed markets More fraud
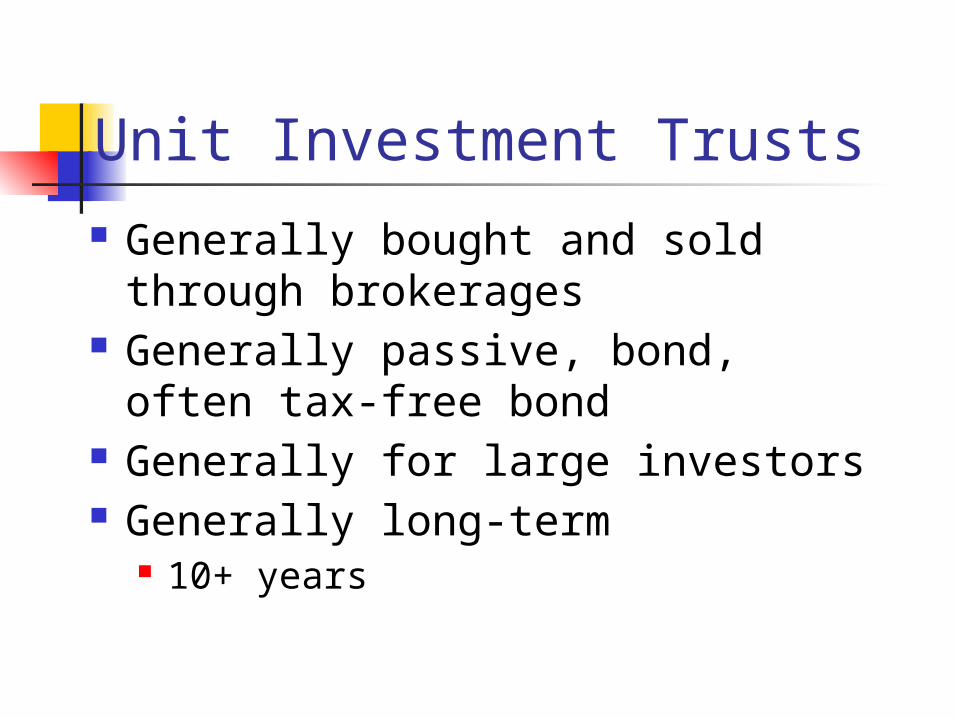
Unit Investment Trusts Generally bought and sold through
brokerages Generally passive, bond, often tax-
free bond Generally for large investors Generally long-term
10+ years

UIT Negatives Front end load as high as 5.5% Sponsors (broker) often has market
Spreads from 1.5% to 5.5% “Dribble back” of principal as
bonds redeemed No manager to restructure if
needed Available information is limited

New UIT Short term
1 year even
Example: Dogs of the Dow Highest 10 dividend Dow stocks Jan 1 to Dec 31

Exchange Traded Funds (ETF)
Hybrid UIT and closed end fund
Generally indexed Possibility of actively managed
Low management fee

Advantages Trade during day Short sell Margin Limit order No load – transaction fee

Sale price can differ from NAV Generally close because of arbitrage –
redeem or create shares

ETF Names Diamonds – DJIA Spyders – S&P 500 Cubes – NASDAQ 100 WEBS – World Equity Benchmark Series iShares – Barclays Global Investor HOLDRS – sector Vipers – Vanguard Real assets – Gold & Silver
http://www.amex.com
Mutual Fund Abuses Late trading Front running
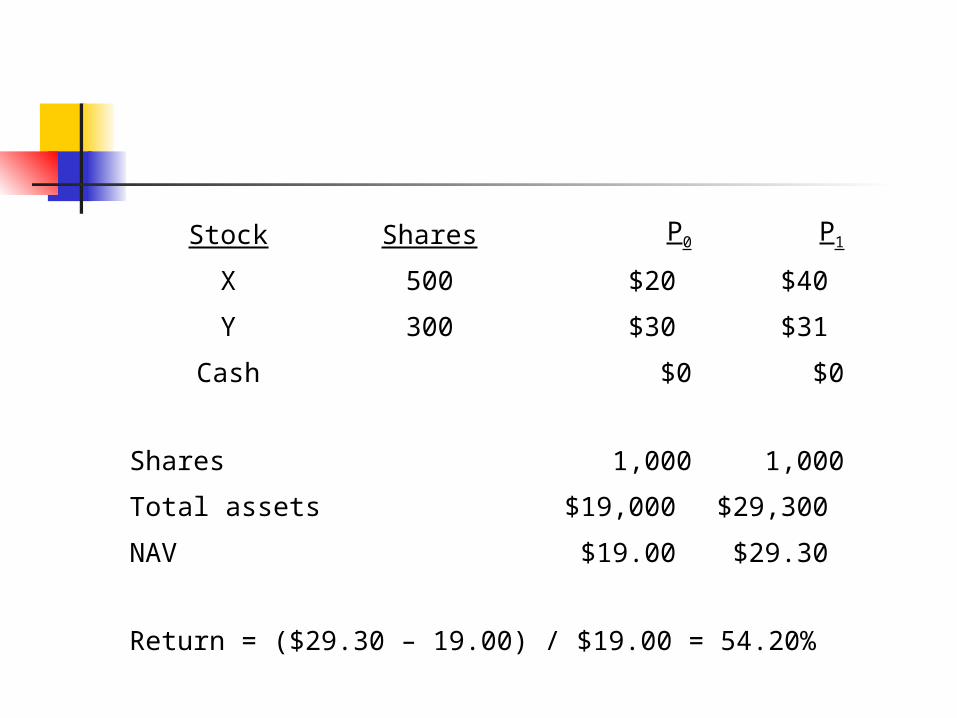
Stock Shares P0 P1
X 500 $20 $40
Y 300 $30 $31
Cash $0 $0
Shares 1,000 1,000
Total assets $19,000 $29,300
NAV $19.00 $29.30
Return = ($29.30 – 19.00) / $19.00 = 54.20%
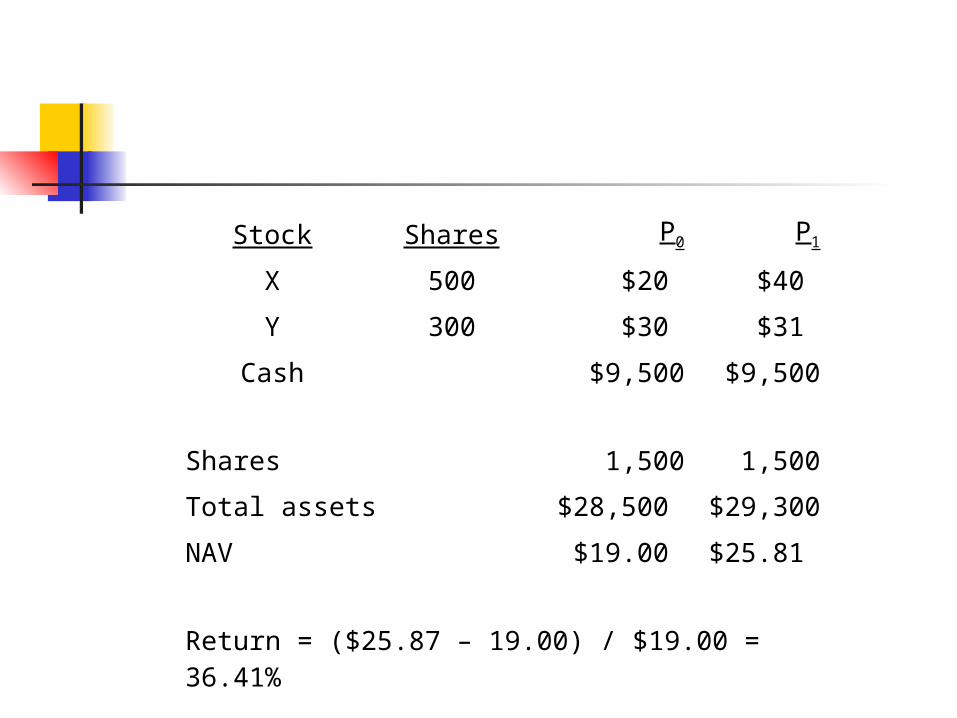
Stock Shares P0 P1
X 500 $20 $40
Y 300 $30 $31
Cash $9,500 $9,500
Shares 1,500 1,500
Total assets $28,500 $29,300
NAV $19.00 $25.81
Return = ($25.87 – 19.00) / $19.00 = 36.41%

MF distributions Record date Ex-dividend date – usually one day
later Fund drops by distribution
Reinvestment date Usually ex-dividend date
Payable date

Taxes Don’t buy distributions
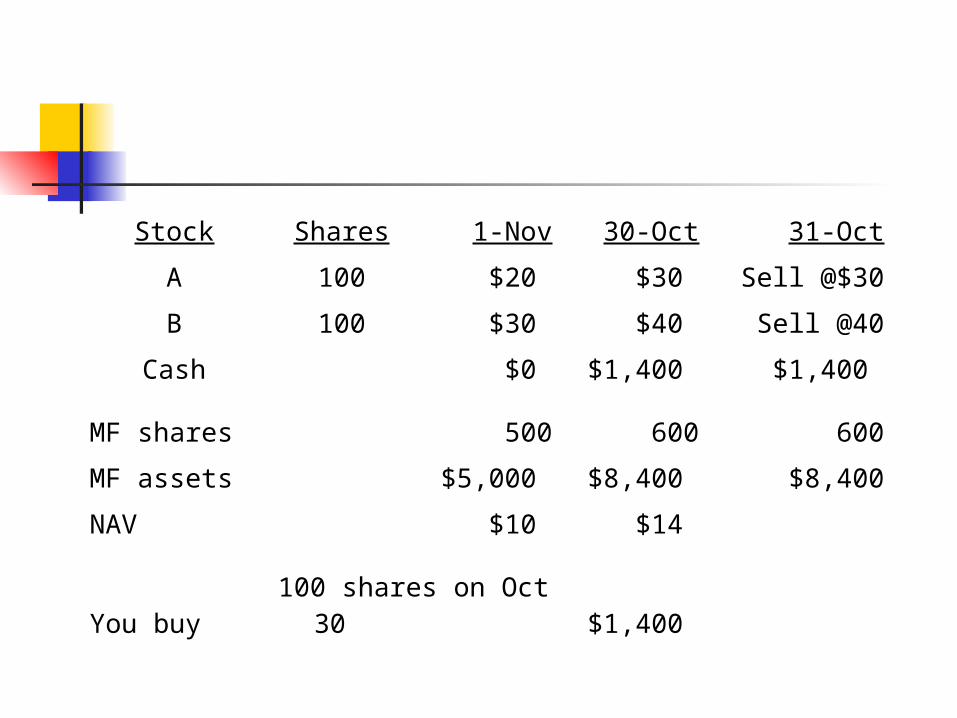
Stock Shares 1-Nov 30-Oct 31-Oct
A 100 $20 $30 Sell @$30
B 100 $30 $40 Sell @40
Cash $0 $1,400 $1,400
MF shares 500 600 600
MF assets $5,000 $8,400 $8,400
NAV $10 $14
You buy 100 shares on Oct 30 $1,400
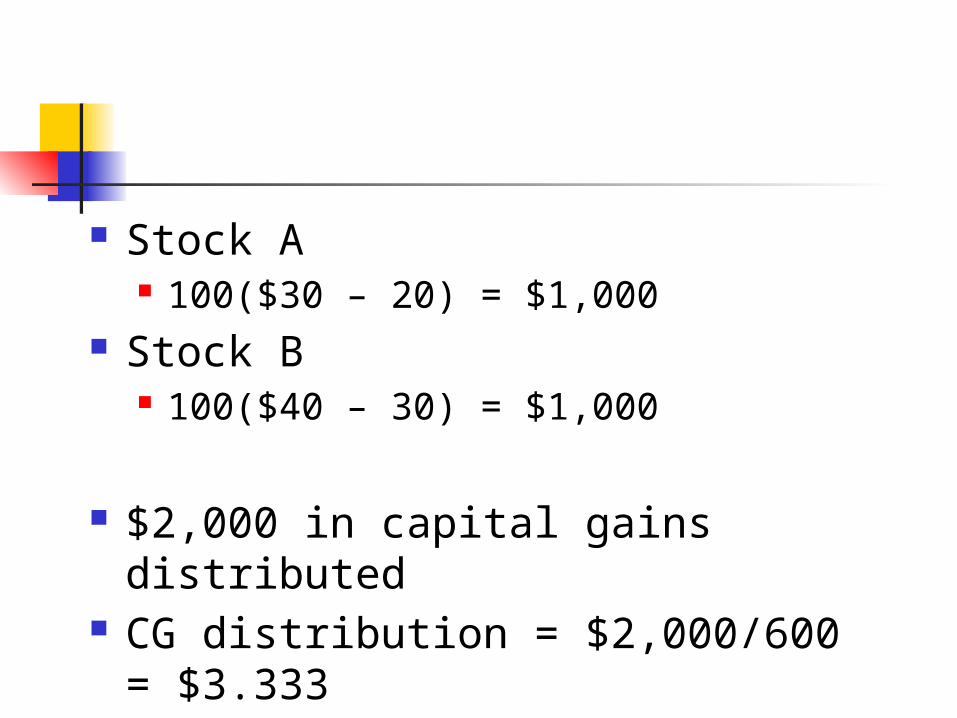
Stock A 100($30 – 20) = $1,000
Stock B 100($40 – 30) = $1,000
$2,000 in capital gains distributed CG distribution = $2,000/600 =
$3.333
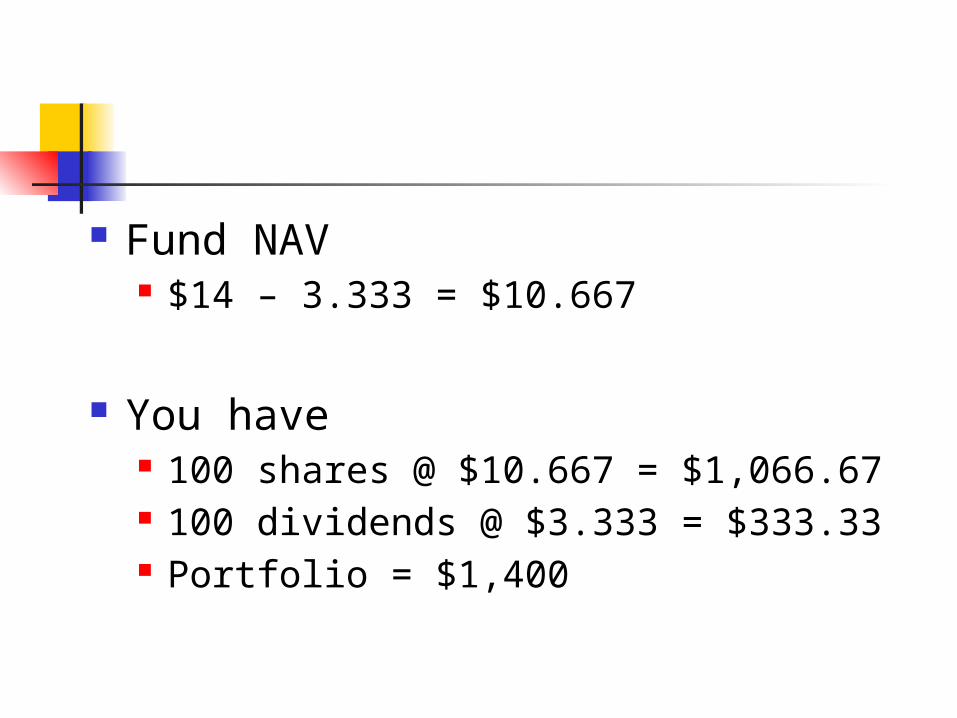
Fund NAV $14 – 3.333 = $10.667
You have 100 shares @ $10.667 = $1,066.67 100 dividends @ $3.333 = $333.33 Portfolio = $1,400
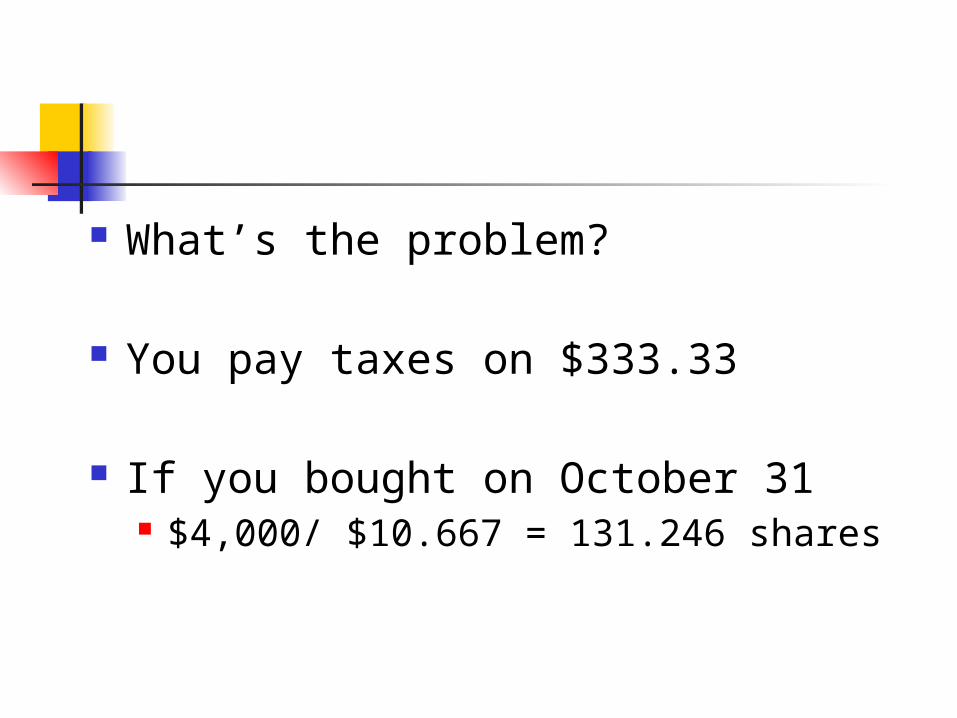
What’s the problem?
You pay taxes on $333.33
If you bought on October 31 $4,000/ $10.667 = 131.246 shares

Turnover Lesser of:
Total Sales / Avg. Daily Assets Total Purchases / Avg. Daily Assets

Traditional vs. Roth IRA Traditional
$2,000/year, 30 years, 10% return, 30% tax
Value in 30 years = $328,988 Annual withdrawal for 20 years =
$38,642.81 Taxes @ 30% = $11,592.84 Aftertax withdrawal = $27,049.97

Roth Deposit = $2,000(1 - .30) = $1,400
Value in 30 years = $230,291.63 Annual withdrawal (tax-free) =
$27,049.97
The advantage of a Roth is increased deposits, not the tax-free withdrawals

Distributions Ordinary dividends Capital gains
Long-term Short-term
Nontaxable distributions Return of principal (rare)
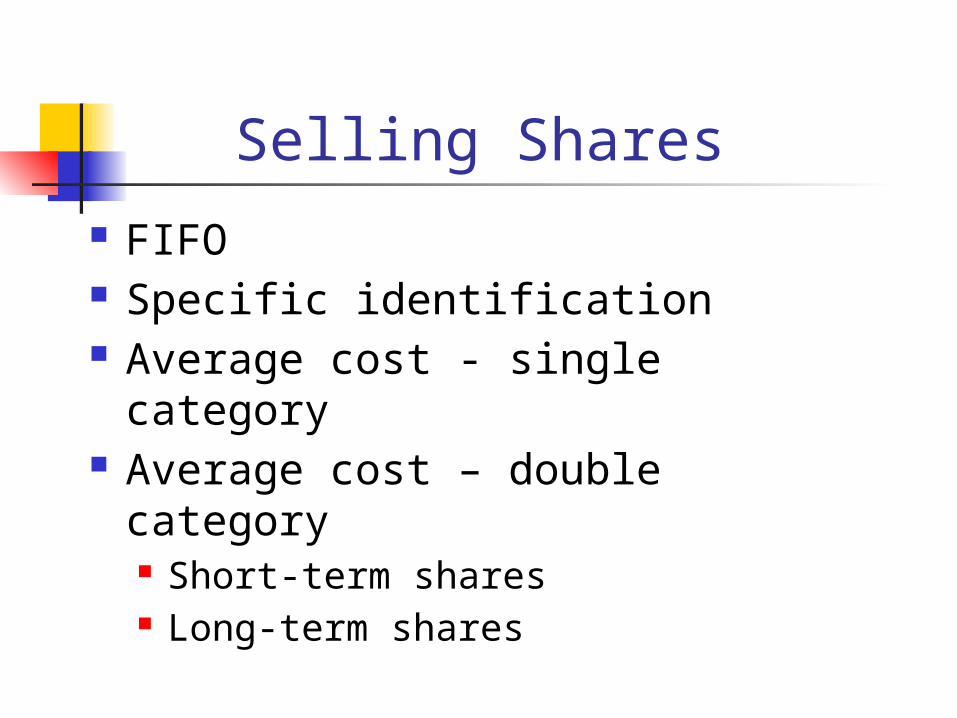
Selling Shares FIFO Specific identification Average cost - single category Average cost – double category
Short-term shares Long-term shares

Taxes Don’t buy distributions Step-up at death Kiddie tax
First $650 of passive income free At 14, kid’s tax rate
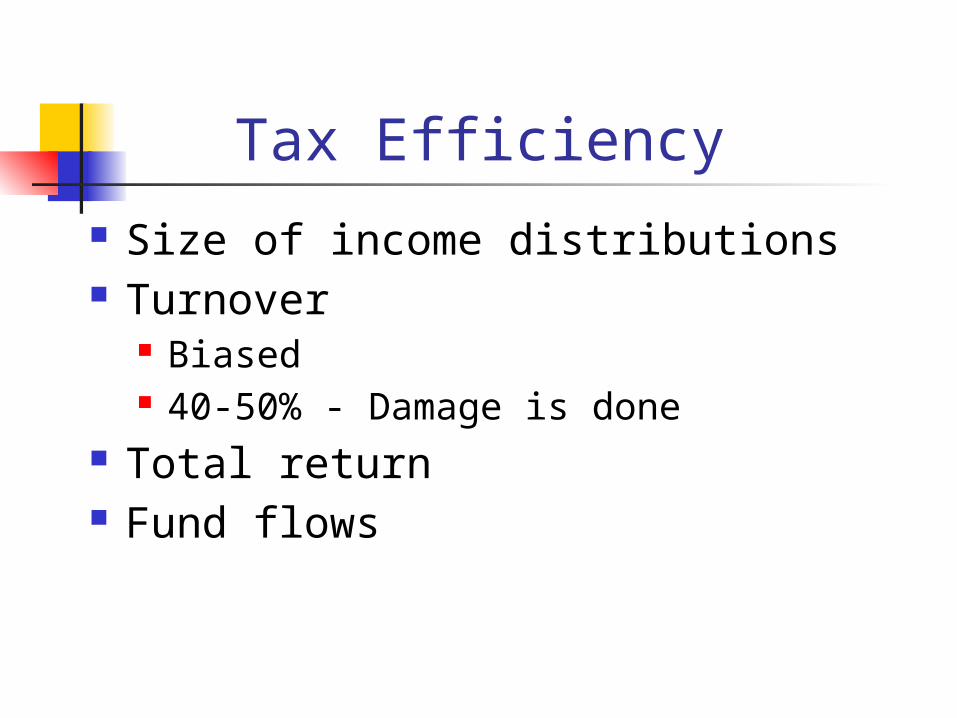
Tax Efficiency Size of income distributions Turnover
Biased 40-50% - Damage is done
Total return Fund flows

Lock in losses $3,000 per year Can’t buy 30 days before or after
Step up at death

Embedded Capital Gains
Shares
P0 P1
A 100 $40
$4,000 $45
$4,500
B 200 $80
$16,000
$87
$17,400
C 300 $35
$10,500
$39
$11,700
Total $30,500
$33,600
Shares
100 100
NAV $30.50 $33.60
Embedded CG = ($33.60 – 30.50) /$30.50 = 10.16%
What to Look For Expenses, expenses, expenses Turnover not important
No capital gains