Embed Size (px)
Citation preview

GLOBAL TRENDS IN CLEAN ENERGY INVESTMENT
Luke MillsJoseph Byrne
April 2016

1
CONTENTS
19 April 2016
2. Annual clean energy investment overview
3. Quarterly trends in clean energy: new investment
4. Quarterly trends in clean energy: funds in circulation
5. Clean energy indexes
1. Clean energy coverage and definitions
6. Renewable energy capacity investment

2
CLEAN ENERGY INVESTMENT HOMEPAGE
19 April 2016
Find the latest research and create and download your own charts and datasets on the new clean energy investment homepage
CLEAN ENERGY COVERAGE & DEFINITIONS

4Source: Bloomberg New Energy Finance19 April 2016
CLEAN ENERGY COVERAGE
Technology / Services Asset
Finance (1MW+)
Small Scale Finance (<1MW)
Public Markets VCPE M&A Re-Invested
EquityCorporate
R&DGovernment
R&D
Biofuels
Biomass & Waste
Geothermal
Marine
Small hydro
Solar
Wind
Offshore wind transmission
Carbon Markets
General Finance & Legal Services
Services & Support (Clean Energy)
Digital Energy
Efficiency: Built Environment
Efficiency: Industry
Efficiency: Supply Side
Electrified Transport
Energy Storage
Fuel Cells
Hydrogen
Ener
gy S
mar
t Te
chno
logi
es
Low
C
arbo
n Se
rvic
esR
enew
able
s
Tota
l Cle
an E
nerg
y
Asset Class
Key:
Renewable Quarterly Clean Energy Annual Only

5
Source: Bloomberg New Energy Finance
19 April 2016
DEFINITIONS: ASSET CLASSES
Venture capital & private equity (VCPE)
Early and late stage VC funding rounds as well as funds raised privately for the purposes of expansion by companies that are primarily involved in the clean energy industry according to BNEF exposure ratings.
Public markets (PM) New equity raised on capital or over-the-counter markets by publicly quoted companies that are primarily involved in the clean energy industry according to BNEF exposure ratings . This may be through initial public offerings (IPOs) or follow-on offerings (secondary, PIPEs, convertibles etc).
Asset finance (AF) The new-build financing of renewable energy generating projects. This includes both electricity generating and biofuel production assets. Projects may be financed via the balance sheets of the project owners, or through financing mechanisms such as syndicated equity from institutional investors, or project debt from banks.
Asset finance (EST) Same as above, but for digital energy and energy storage sub categories of the Energy Smart Technologies sector. We only calculate this on an annual basis, so will not be included in quarterly investment estimates.
Re-invested equity Isolates values for balance-sheet-financed project investments (AF) by companies that have raised money through VC/PE investors or on the capital markets over the past 12 months. The purpose of this calculation is to prevent double-counting upon aggregation of project investments and company investments when calculating total new financial investment in clean energy.
Small-scale solar Rooftop solar PV below 1MW in capacity. Given the difficulty in tracking individual residential-scale projects, our main asset finance database excludes projects below a certain threshold. This threshold for most tracked sectors is around 1MW. To compensate for this, we add back top-level estimates for missed deals of this nature.
Government R&D Government R&D figures are sourced from the IEA, IMF, OECD, various government agencies and the BNEF green stimulus dataset.
Corporate R&D The Bloomberg terminal is used to source Corporate R&D figures for key quoted companies in each clean energy sector, supplemented by data from the BNEF desktop and insight.

6Source: Bloomberg New Energy Finance19 April 2016
DEFINITIONS: SECTORS
Wind Included in this sector are players across the entire value chain of both onshore and offshore developments. From direct investment into wind farms to funds raised by manufacturers of turbines, components and subassemblies, developers, generators, utilities and engineering firms.
Solar All technologies that capture energy directly from the sun. These include production of electricity using semiconductor-based photovoltaic (PV) materials, use of concentrated sunlight to heat fluid to drive power generation equipment (solar thermal electricity generation or 'STEG'), and passive methods which use solar to replace fossil fuel energy, e.g. to heat water. Whilst company level investment of passive methods is recorded, investment in passive projects is not.
Biofuels Liquid transportation fuels including biodiesel and bioethanol. These can be derived from a range of biomass sources, including sugar cane, rape seed (canola), soybean oil or cellulose. Our database excludes producers of base biomass, but includes suppliers of everything from the processing technologies and equipment, through the logistics of distribution, to manufacturers of energy systems that are specially adapted for the use of biofuels and products, and the services on which they depend.
Biomass & waste Production and consumption of solid and gaseous fuels derived from biomass. Solid biomass for the energy sector can include a number of specially-grown crops, such as elephant grass or coppiced willow, but it can also consist of crop residues such as straw. We include in this sector processors of other waste matter for energy generation, such as sewage waste, chemical by-products and biogas produced from municipal waste, as their exploitation often involves the same technologies as grown-for-purpose biomass.
Other renewables Includes: Small hydro – the generation of electric power from the movement of water, with project capacity between 1MW and 50MW Geothermal – the extraction of useful power from heat stored in the earth Marine – the extraction of energy from the sea.
Energy smart technologies (EST)
This sector covers a range of non-renewable clean energy technologies including digital energy and smart grids, power storage, hydrogen and fuel cells, advanced transportation and energy efficiency on both the demand and supply side. For more in depth definitions of these please visit our corporate website:
Other low-carbon tech / services
This sector covers clean energy service companies such as consultants, government agencies and policy makers, NGOs, financial service providers, investors, and clean energy information providers (such as ourselves). It also covers the corporate activity of organisations across the carbon capture and storage (CCS) and carbon market value chains.

ANNUAL CLEAN ENERGY INVESTMENT OVERVIEW
8
Note: Total values include estimates for undisclosed deals. AF = asset finance, SDC = small distributed capacity. Source: Bloomberg New Energy Finance
19 April 2016
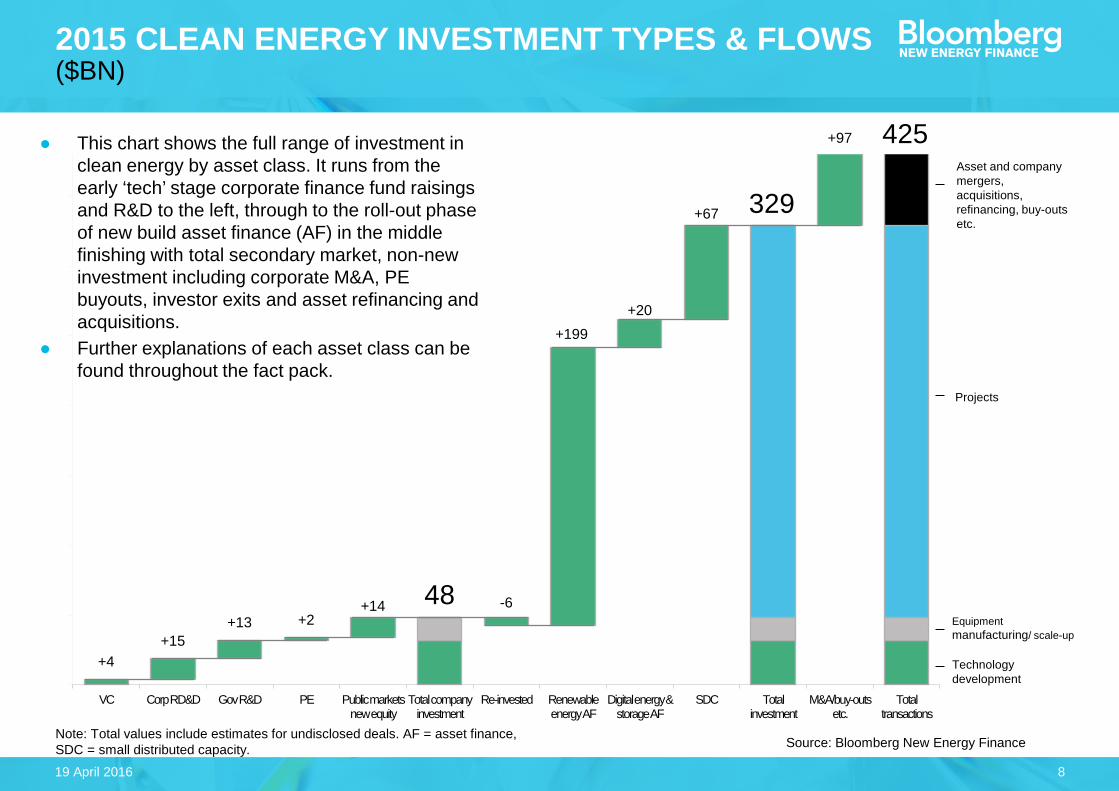
2015 CLEAN ENERGY INVESTMENT TYPES & FLOWS($BN)
Technology development
Equipment manufacturing/ scale-up
Projects
Asset and company mergers, acquisitions, refinancing, buy-outs etc.
● This chart shows the full range of investment in clean energy by asset class. It runs from the early ‘tech’ stage corporate finance fund raisings and R&D to the left, through to the roll-out phase of new build asset finance (AF) in the middle finishing with total secondary market, non-new investment including corporate M&A, PE buyouts, investor exits and asset refinancing and acquisitions.
● Further explanations of each asset class can be found throughout the fact pack.
+4+15
+13 +2+14 48 -6
+199+20
+67 329
+97 425
VC Corp RD&D Gov R&D PE Public markets new equity
Total company investment
Re-invested Renewable energy AF
Digital energy & storage AF
SDC Total investment
M&A/buy-outs etc.
Total transactions
9
Note: Total values include estimates for undisclosed deals. Includes corporate and government R&D, and spending for digital energy and energy storage projects (not reported in quarterly statistics). Source: Bloomberg New Energy Finance
19 April 2016
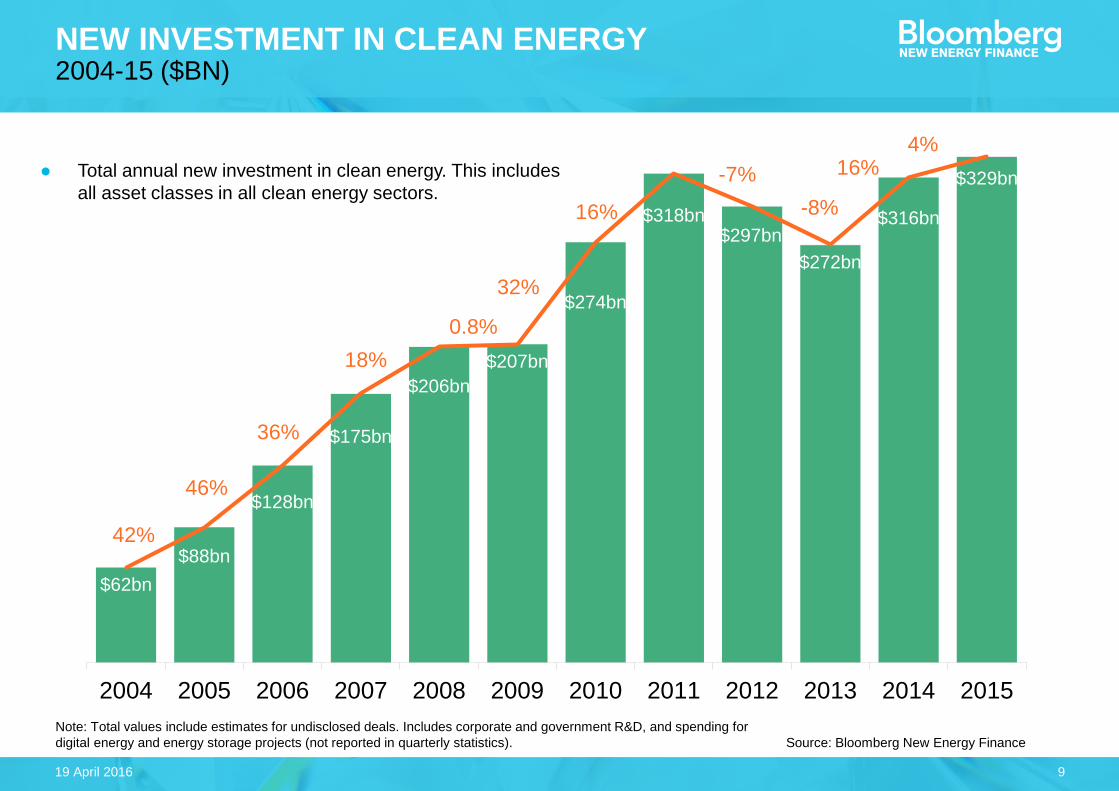
NEW INVESTMENT IN CLEAN ENERGY2004-15 ($BN)
● Total annual new investment in clean energy. This includes all asset classes in all clean energy sectors.
$62bn$88bn
$128bn
$175bn
$206bn$207bn
$274bn
$318bn$297bn
$272bn
$316bn
$329bn
42%
46%
36%
18%0.8%
32%
16%
-7%-8%
16%4%
2004 2005 2006 2007 2008 2009 2010 2011 2012 2013 2014 2015

10
Note: Total values include estimates for undisclosed deals. Includes corporate and government R&D, and spending for digital energy and energy storage projects (not reported in quarterly statistics). Source: Bloomberg New Energy Finance
19 April 2016
NEW INVESTMENT IN CLEAN ENERGY BY REGION2004-15 ($BN)
● Total annual new investment in clean energy by region. This includes all asset classes and all clean energy sectors.
$30bn $39bn $53bn$75bn
$91bn $92bn$126bn $135bn
$109bn$79bn $80bn $72bn$14bn
$24bn
$44bn
$58bn$63bn $51bn
$68bn$85bn
$75bn
$66bn $75bn $78bn
$19bn
$25bn
$31bn
$42bn
$52bn $64bn
$80bn
$98bn
$113bn
$127bn
$161bn $179bn
42%
46%
36%
18%0.8%
32%
16%
-7%
-8%16%
4%
2004 2005 2006 2007 2008 2009 2010 2011 2012 2013 2014 2015
EMEA AMER APAC

11
Notes: (1) The funds raised by green bonds are neither entirely inclusive nor exclusive of figures for clean energy asset finance. (2) 'Corporate', 'sovereign, supranational andagency' and ‘US municipal’ include only bonds explicitly labelled as green and which meet the criteria for receiving a green bond ‘tag’ on the Bloomberg Terminal. (3) 'Project'includes bonds backed by the cash flows of an underlying renewable energy project or portfolio of projects. (4) 'ABS' includes asset-backed securities whose cash flows comefrom a portfolio of underlying receivables such as loans, leases and PPAs where the receivables are associated with green (eg, renewable energy, energy efficiency) projects.‘Extrapolated’ indicates total 2016 issuance assuming that the rate of issue remains unchanged from Q1 2016.
Source: Bloomberg New Energy Finance
ANNUAL HISTORICAL GREEN BOND ISSUANCE, BY TYPE, 2007-16 ($BN)

QUARTERLY TRENDS IN CLEAN ENERGY: NEW INVESTMENT

13
Note: Total values include estimates for undisclosed deals. Excludes corporate and government R&D, and spending for digital energy and energy storage projects (reported in annual statistics only). Source: Bloomberg New Energy Finance
19 April 2016
NEW INVESTMENT IN CLEAN ENERGYQ1 2004-Q1 2016 ($BN)
● Quarterly new investment in clean energy. This includes investment into all asset classes except EST asset finance and R&D, which are compiled on an annual basis only.
9.213.4
9.310.813.3
20.2
15.5
21.021.8
27.423.0
37.2
27.8
35.537.7
52.2
35.8
52.245.9
44.4
30.5
50.447.6
44.9
50.4
56.158.4
70.9
57.4
80.0
73.2
62.5
53.4
71.4
60.265.9
42.8
64.2
54.7
64.357.7
73.8 69.568.8
60.5
85.3
66.868.1
53.1
Q1
Q2
Q3
Q4
Q1
Q2
Q3
Q4
Q1
Q2
Q3
Q4
Q1
Q2
Q3
Q4
Q1
Q2
Q3
Q4
Q1
Q2
Q3
Q4
Q1
Q2
Q3
Q4
Q1
Q2
Q3
Q4
Q1
Q2
Q3
Q4
Q1
Q2
Q3
Q4
Q1
Q2
Q3
Q4
Q1
Q2
Q3
Q4
Q1
2004 2005 2006 2007 2008 2009 2010 2011 2012 2013 2014 2015 '16
Four quarter running average

14
Note: Total values include estimates for undisclosed deals. Excludes corporate and government R&D, and spending for digital energy and energy storage projects (reported in annual statistics only). Source: Bloomberg New Energy Finance
19 April 2016
NEW INVESTMENT IN CLEAN ENERGY BY REGIONQ1 2004-Q1 2016 ($BN)
● Quarterly new investment in clean energy. This includes investment into all asset classes except EST asset finance and R&D, which are compiled on an annual basis only.
9.213.4
9.310.813.3
20.2
15.5
21.021.8
27.4
23.0
37.2
27.8
35.537.7
52.2
35.8
52.2
45.944.4
30.5
50.447.6
44.9
50.4
56.158.4
70.9
57.4
80.0
73.2
62.5
53.4
71.4
60.2
65.9
42.8
64.2
54.7
64.3
57.7
73.869.5
68.8
60.5
85.3
66.868.1
53.1
Q1
Q2
Q3
Q4
Q1
Q2
Q3
Q4
Q1
Q2
Q3
Q4
Q1
Q2
Q3
Q4
Q1
Q2
Q3
Q4
Q1
Q2
Q3
Q4
Q1
Q2
Q3
Q4
Q1
Q2
Q3
Q4
Q1
Q2
Q3
Q4
Q1
Q2
Q3
Q4
Q1
Q2
Q3
Q4
Q1
Q2
Q3
Q4
Q1
2004 2005 2006 2007 2008 2009 2010 2011 2012 2013 2014 2015 '16
EMEA AMER APAC

15
Note: Total values include estimates for undisclosed deals. Excludes corporate and government R&D, and spending for digital energy and energy storage projects (reported in annual statistics only). Source: Bloomberg New Energy Finance
19 April 2016
NEW INVESTMENT IN CLEAN ENERGY IN EUROPEQ1 2004-Q1 2016 ($BN)
● Quarterly new investment in clean energy. This includes investment into all asset classes except EST asset finance and R&D, which are compiled on an annual basis only.
4.2
8.9
4.35.46.3
10.9
7.08.17.8
13.9
7.9
16.1
9.7
16.814.3
24.8
14.0
23.5 22.1
20.0
13.5
27.6
22.3
17.1
22.4
25.1
29.6
33.6
27.6
34.5
30.7
26.7
21.3
23.6
19.3
21.7
15.6
12.9
13.014.7
13.6
16.4
11.3
18.2
10.0
16.1
6.3
13.9
17.0
Q1
Q2
Q3
Q4
Q1
Q2
Q3
Q4
Q1
Q2
Q3
Q4
Q1
Q2
Q3
Q4
Q1
Q2
Q3
Q4
Q1
Q2
Q3
Q4
Q1
Q2
Q3
Q4
Q1
Q2
Q3
Q4
Q1
Q2
Q3
Q4
Q1
Q2
Q3
Q4
Q1
Q2
Q3
Q4
Q1
Q2
Q3
Q4
Q1
2004 2005 2006 2007 2008 2009 2010 2011 2012 2013 2014 2015 '16
Four quarter running average

16
1.21.70.91.72.03.6
2.14.3
6.36.56.4
10.3
7.37.49.4
11.49.6
11.1
8.37.3
3.1
8.76.55.6
6.7
9.47.2
12.6
5.9
16.4
18.5
9.69.2
14.8
8.09.3
3.9
9.66.4
16.1
8.9
12.010.5
9.18.9
13.3 12.110.4
9.7
Q1
Q2
Q3
Q4
Q1
Q2
Q3
Q4
Q1
Q2
Q3
Q4
Q1
Q2
Q3
Q4
Q1
Q2
Q3
Q4
Q1
Q2
Q3
Q4
Q1
Q2
Q3
Q4
Q1
Q2
Q3
Q4
Q1
Q2
Q3
Q4
Q1
Q2
Q3
Q4
Q1
Q2
Q3
Q4
Q1
Q2
Q3
Q4
Q1
2004 2005 2006 2007 2008 2009 2010 2011 2012 2013 2014 2015 '16
Four quarter running average
Note: Total values include estimates for undisclosed deals. Excludes corporate and government R&D, and spending for digital energy and energy storage projects (reported in annual statistics only). Source: Bloomberg New Energy Finance
19 April 2016
NEW INVESTMENT IN CLEAN ENERGY IN THE USQ1 2004-Q1 2016 ($BN)
● Quarterly new investment in clean energy. This includes investment into all asset classes except EST asset finance and R&D, which are compiled on an annual basis only.

17
Note: Total values include estimates for undisclosed deals. Excludes corporate and government R&D, and spending for digital energy and energy storage projects (reported in annual statistics only). Source: Bloomberg New Energy Finance
19 April 2016
NEW INVESTMENT IN CLEAN ENERGY IN CHINAQ1 2004-Q1 2016 ($BN)
● Quarterly new investment in clean energy. This includes investment into all asset classes except EST asset finance and R&D, which are compiled on an annual basis only.
0.60.30.60.81.42.21.52.42.12.1
3.13.13.13.95.2
3.63.8
7.86.66.37.27.3
10.312.7
7.5
10.210.9
10.810.5
15.0
10.79.7
10.1
19.8
16.313.9
7.9
18.717.4
15.714.1
24.526.0
20.7
18.9
32.9
25.7
23.7
11.8
Q1
Q2
Q3
Q4
Q1
Q2
Q3
Q4
Q1
Q2
Q3
Q4
Q1
Q2
Q3
Q4
Q1
Q2
Q3
Q4
Q1
Q2
Q3
Q4
Q1
Q2
Q3
Q4
Q1
Q2
Q3
Q4
Q1
Q2
Q3
Q4
Q1
Q2
Q3
Q4
Q1
Q2
Q3
Q4
Q1
Q2
Q3
Q4
Q1
2004 2005 2006 2007 2008 2009 2010 2011 2012 2013 2014 2015 '16
Four quarter running average

18
9.213.4
9.310.813.3
20.2
15.5
21.021.8
27.4
23.0
37.2
27.8
35.537.7
52.2
35.8
52.2
45.944.4
30.5
50.447.6
44.9
50.4
56.158.4
70.9
57.4
80.0
73.2
62.5
53.4
71.4
60.2
65.9
42.8
64.2
54.7
64.3
57.7
73.869.568.8
60.5
85.3
66.868.1
53.1
Q1
Q2
Q3
Q4
Q1
Q2
Q3
Q4
Q1
Q2
Q3
Q4
Q1
Q2
Q3
Q4
Q1
Q2
Q3
Q4
Q1
Q2
Q3
Q4
Q1
Q2
Q3
Q4
Q1
Q2
Q3
Q4
Q1
Q2
Q3
Q4
Q1
Q2
Q3
Q4
Q1
Q2
Q3
Q4
Q1
Q2
Q3
Q4
Q1
2004 2005 2006 2007 2008 2009 2010 2011 2012 2013 2014 2015 '16
Wind Solar Biofuels Other
Note: Total values include estimates for undisclosed deals. Excludes corporate and government R&D, and spending for digital energy and energy storage projects (reported in annual statistics only). Source: Bloomberg New Energy Finance
19 April 2016
NEW INVESTMENT IN CLEAN ENERGY BY SECTOR Q1 2004-Q1 2016 ($BN)
● Quarterly new investment in clean energy. This includes investment into all asset classes except EST asset finance and R&D, which are compiled on an annual basis only.

19
4.3
9.2
4.45.56.6
11.0
7.18.37.9
14.0
8.3
16.6
10.0
17.314.8
25.3
14.4
23.922.820.8
13.9
28.1
22.6
17.6
23.7
25.6
30.0
35.6
28.8
35.1
31.0
27.6
22.0
24.4
21.7
27.9
17.017.1
14.0
17.515.3
18.6
12.9
20.5
14.9
19.2
9.5
15.2
19.1
Q1
Q2
Q3
Q4
Q1
Q2
Q3
Q4
Q1
Q2
Q3
Q4
Q1
Q2
Q3
Q4
Q1
Q2
Q3
Q4
Q1
Q2
Q3
Q4
Q1
Q2
Q3
Q4
Q1
Q2
Q3
Q4
Q1
Q2
Q3
Q4
Q1
Q2
Q3
Q4
Q1
Q2
Q3
Q4
Q1
Q2
Q3
Q4
Q1
2004 2005 2006 2007 2008 2009 2010 2011 2012 2013 2014 2015 '16
Wind Solar OtherNote: Total values include estimates for undisclosed deals. Excludes corporate and government R&D, and spending for digital energy and energy storage projects (reported in annual statistics only). Source: Bloomberg New Energy Finance
19 April 2016
EMEA NEW INVESTMENT IN CLEAN ENERGY BY SECTOR Q1 2004-Q1 2016 ($BN)
● Quarterly new investment in clean energy. This includes investment into all asset classes except EST asset finance and R&D, which are compiled on an annual basis only.

20
1.62.11.92.52.74.9
3.9
6.98.18.48.5
13.211.2
10.1
13.6
17.2
12.4
15.8
12.013.7
5.2
11.69.9
10.412.1
14.410.6
17.8
9.7
20.922.1
16.9
12.6
18.5
12.4
15.1
6.6
14.4
11.0
20.0
14.1
17.715.5
14.112.7
18.717.3
15.5
11.2
Q1
Q2
Q3
Q4
Q1
Q2
Q3
Q4
Q1
Q2
Q3
Q4
Q1
Q2
Q3
Q4
Q1
Q2
Q3
Q4
Q1
Q2
Q3
Q4
Q1
Q2
Q3
Q4
Q1
Q2
Q3
Q4
Q1
Q2
Q3
Q4
Q1
Q2
Q3
Q4
Q1
Q2
Q3
Q4
Q1
Q2
Q3
Q4
Q1
2004 2005 2006 2007 2008 2009 2010 2011 2012 2013 2014 2015 '16
Wind Solar Other
Note: Total values include estimates for undisclosed deals. Excludes corporate and government R&D, and spending for digital energy and energy storage projects (reported in annual statistics only). Source: Bloomberg New Energy Finance
19 April 2016
AMER NEW INVESTMENT IN CLEAN ENERGY BY SECTOR Q1 2004-Q1 2016 ($BN)
● Quarterly new investment in clean energy. This includes investment into all asset classes except EST asset finance and R&D, which are compiled on an annual basis only.

21
3.32.0
3.02.84.04.34.4
5.85.85.06.2
7.36.78.1
9.49.89.0
12.511.2
9.911.410.7
15.216.9
14.616.1
17.817.518.9
24.0
20.118.018.7
28.5
26.1
22.9
19.3
32.7
29.626.8
28.2
37.5
41.1
34.2
32.8
47.3
40.0
37.4
22.9
Q1
Q2
Q3
Q4
Q1
Q2
Q3
Q4
Q1
Q2
Q3
Q4
Q1
Q2
Q3
Q4
Q1
Q2
Q3
Q4
Q1
Q2
Q3
Q4
Q1
Q2
Q3
Q4
Q1
Q2
Q3
Q4
Q1
Q2
Q3
Q4
Q1
Q2
Q3
Q4
Q1
Q2
Q3
Q4
Q1
Q2
Q3
Q4
Q1
2004 2005 2006 2007 2008 2009 2010 2011 2012 2013 2014 2015 '16
Wind Solar OtherNote: Total values include estimates for undisclosed deals. Excludes corporate and government R&D, and spending for digital energy and energy storage projects (reported in annual statistics only). Source: Bloomberg New Energy Finance
19 April 2016
APAC NEW INVESTMENT IN CLEAN ENERGY BY SECTOR Q1 2004-Q1 2016 ($BN)
● Quarterly new investment in clean energy. This includes investment into all asset classes except EST asset finance and R&D, which are compiled on an annual basis only.

22
9.213.4
9.310.813.3
20.2
15.5
21.021.8
27.4
23.0
37.2
27.8
35.537.7
52.2
35.8
52.2
45.944.4
30.5
50.447.6
44.9
50.4
56.158.4
70.9
57.4
80.0
73.2
62.5
53.4
71.4
60.2
65.9
42.8
64.2
54.7
64.3
57.7
73.869.5
68.8
60.5
85.3
66.868.1
53.1
Q1
Q2
Q3
Q4
Q1
Q2
Q3
Q4
Q1
Q2
Q3
Q4
Q1
Q2
Q3
Q4
Q1
Q2
Q3
Q4
Q1
Q2
Q3
Q4
Q1
Q2
Q3
Q4
Q1
Q2
Q3
Q4
Q1
Q2
Q3
Q4
Q1
Q2
Q3
Q4
Q1
Q2
Q3
Q4
Q1
Q2
Q3
Q4
Q1
2004 2005 2006 2007 2008 2009 2010 2011 2012 2013 2014 2015 '16
Asset finance* Public markets VC/PE Small distributed capacity*Asset finance adjusted for re-invested equityNote: Total values include estimates for undisclosed deals. Excludes corporate and government R&D, and spending for digital energy and energy storage projects (reported in annual statistics only). Source: Bloomberg New Energy Finance
19 April 2016
NEW INVESTMENT IN CLEAN ENERGY BY ASSET CLASS Q1 2004-Q1 2016 ($BN)
● Quarterly new investment in clean energy. This includes investment into all asset classes except EST asset finance and R&D, which are compiled on an annual basis only.

23
Source: Bloomberg New Energy Finance
19 April 2016
PUBLIC MARKET NEW INVESTMENT IN CLEAN ENERGY Q1 2004-Q1 2016 ($BN)
Note: Total values include estimates for undisclosed deals.
● New equity raised on capital or over-the-counter (OTC) markets by publicly quoted companies that are primarily involved in the clean energy industry. This may be through initial public offerings (IPOs) or follow-on offerings (secondary, PIPEs, convertibles etc).
0.20.1 0.40.80.90.7
2.51.8
4.3
1.0
3.43.34.23.9
13.2
1.1
6.8
2.7
1.00.4
4.64.0
5.9
1.4
3.33.5
5.44.64.3
1.41.00.81.51.9
0.61.0
3.8
2.0
5.16.7
5.05.7
2.3 2.3
6.2
3.8
2.1
0.6
Q1
Q2
Q3
Q4
Q1
Q2
Q3
Q4
Q1
Q2
Q3
Q4
Q1
Q2
Q3
Q4
Q1
Q2
Q3
Q4
Q1
Q2
Q3
Q4
Q1
Q2
Q3
Q4
Q1
Q2
Q3
Q4
Q1
Q2
Q3
Q4
Q1
Q2
Q3
Q4
Q1
Q2
Q3
Q4
Q1
Q2
Q3
Q4
Q1
2004 2005 2006 2007 2008 2009 2010 2011 2012 2013 2014 2015 '16
Four quarter running average

24
Source: Bloomberg New Energy Finance
19 April 2016
TOP PUBLIC MARKET TRANSACTIONS OF THE QUARTER Q1 2016
Organisation Stock exchange Sector Type of transaction
New equity raised
Total offering size
NextEra Energy New York Stock Exchange (NYSE) Wind Secondary $252m $252m
Renova Energia São Paulo (BOVESPA) Wind Exercise of Rights $188m $188m
Woongjin Energy Korea Stock Exchange (KOSPI) Solar Private Investment in
Public Equity (PIPE) $8m $8m
Global Bioenergies Euronext Paris (PAR or EPA) Biofuels Secondary $7m $7m
AFC Energy AIM (London) Fuel Cells Secondary $5m $5m

25
Note: Total values include estimates for undisclosed deals. Source: Bloomberg New Energy Finance
19 April 2016
VC/PE NEW INVESTMENT IN CLEAN ENERGY Q1 2004-Q1 2016 ($BN)
● Early- and late-stage VC funding rounds as well as funds raised privately for the purposes of expansion by companies that are primarily involved in the clean energy industry according to BNEF exposure ratings.
0.20.60.30.30.50.70.40.71.11.51.81.22.01.51.8
2.62.43.1
4.12.6
1.31.82.2
1.42.72.8
1.5
4.1
2.02.31.91.81.81.91.21.41.41.10.70.91.21.51.11.01.21.41.71.3 1.4
Q1
Q2
Q3
Q4
Q1
Q2
Q3
Q4
Q1
Q2
Q3
Q4
Q1
Q2
Q3
Q4
Q1
Q2
Q3
Q4
Q1
Q2
Q3
Q4
Q1
Q2
Q3
Q4
Q1
Q2
Q3
Q4
Q1
Q2
Q3
Q4
Q1
Q2
Q3
Q4
Q1
Q2
Q3
Q4
Q1
Q2
Q3
Q4
Q1
2004 2005 2006 2007 2008 2009 2010 2011 2012 2013 2014 2015 '16
Four quarter running average

26
Source: Bloomberg New Energy Finance
19 April 2016
TOP VC/PE TRANSACTIONS OF THE QUARTER Q1 2016
Organisation Country Sector Type of transaction Value
Sunnova Energy Corp United States Solar PE Expansion Capital $300m
United Wind Inc United States Wind PE Expansion Capital $142m
Renew Financial LLC United States Efficiency: Built Environment VC Late Stage $70m
Asia Clean Capital Ltd Hong Kong Solar PE Expansion Capital $40m
Sunverge Energy Inc United States Energy Storage VC Late Stage $37m

27
Note: Total values include estimates for undisclosed deals. Excludes spending for digital energy and energy storage projects (reported in annual statistics only). Source: Bloomberg New Energy Finance
19 April 2016
ASSET FINANCING FOR NEW-BUILD RENEWABLE ENERGY ASSETS Q1 2004-Q1 2016 ($BN)
● The new-build financing of utility-scale renewable energy generating projects. This includes both electricity and biofuel production assets. Projects may be financed via the balance sheets of the project owners, or through mechanisms such as syndicated equity from institutional investors and project debt from banks.
6.710.5
6.88.09.6
16.1
11.815.2
16.719.318.3
30.3
20.2
27.0
29.2
33.5
27.5
37.634.9
35.8
21.0
36.233.3
29.732.0
35.9
38.7
46.3
32.4
55.6
51.5
41.9
31.2
48.7
38.3
45.1
27.2
46.5
38.9
45.4
35.4
52.7
48.751.6
41.0
62.8
46.1
49.1
34.3
Q1
Q2
Q3
Q4
Q1
Q2
Q3
Q4
Q1
Q2
Q3
Q4
Q1
Q2
Q3
Q4
Q1
Q2
Q3
Q4
Q1
Q2
Q3
Q4
Q1
Q2
Q3
Q4
Q1
Q2
Q3
Q4
Q1
Q2
Q3
Q4
Q1
Q2
Q3
Q4
Q1
Q2
Q3
Q4
Q1
Q2
Q3
Q4
Q1
2004 2005 2006 2007 2008 2009 2010 2011 2012 2013 2014 2015 '16
Four quarter running average

28
Source: Bloomberg New Energy Finance
19 April 2016
TOP ASSET FINANCE TRANSACTIONS OF THE QUARTER Q1 2016
Project name Country Sector Type of transaction Capacity Value
Hornsea Project One Offshore Wind Farm United Kingdom Wind Equity 1200MW na
East Anglia One Offshore Wind Farm United Kingdom Wind Equity 714MW na
Fosen Wind Farm Portfolio Norway Wind Equity 1001MW $1278m
Burbo Bank Offshore Wind Farm Extension United Kingdom Wind Equity 258MW na
China Pingmei ShenmaEnergy Pingdingshan RuzhouLingtouzhen PV Plant I
China Solar Debt 350MW $417m

QUARTERLY TRENDS IN CLEAN ENERGY: FUNDS IN CIRCULATION

30
Note: Total values include estimates for undisclosed deals. Excludes spending for digital energy and energy storage projects (reported in annual statistics only). Source: Bloomberg New Energy Finance
19 April 2016
FUNDS IN CIRCULATION IN CLEAN ENERGY Q1 2004-Q4 2015 ($BN)
● Global secondary market acquisition transactions. This shows non-new investment in the clean energy industry through corporate M&A, private equity buy-outs and public market investor exits, as well as the refinancing or acquisition of renewable assets.
2.93.31.6
4.04.5
8.47.1
12.6
8.5
11.1
5.7
14.2
9.5
14.6
18.6
22.0
17.9
11.2
14.0
18.9
12.3
17.715.8
20.2
16.8
11.5
13.6
20.0
12.1
17.7
30.7
20.2
19.2
15.1
12.0
25.2
21.8
16.617.3
15.4
17.5
24.4
19.8
32.1
26.4
21.6
17.8
30.730.3
Q1
Q2
Q3
Q4
Q1
Q2
Q3
Q4
Q1
Q2
Q3
Q4
Q1
Q2
Q3
Q4
Q1
Q2
Q3
Q4
Q1
Q2
Q3
Q4
Q1
Q2
Q3
Q4
Q1
Q2
Q3
Q4
Q1
Q2
Q3
Q4
Q1
Q2
Q3
Q4
Q1
Q2
Q3
Q4
Q1
Q2
Q3
Q4
Q1
2004 2005 2006 2007 2008 2009 2010 2011 2012 2013 2014 2015 '16Four quarter running average

31
Source: Bloomberg New Energy Finance
19 April 2016
TOP TRANSACTIONS FOR FUNDS IN CIRCULATION Q1 2016
Organisation Country Sector Type of transaction Acquirer Value
Pacific Hydro Pty Ltd Australia Wind Equity (company) State Power Investment $2108m
Isagen SA ESP Colombia Wind PE - Buy-out / corpspinoff
Brookfield Renewable Energy Partners $1980m
EEW Energy from Waste GmbH Germany Biomass &
Waste Equity (company) Beijing Enterprises Holdings $1563m
Renovalia Energy SA Spain Solar PE - Buy-out / corpspinoff Cerberus Capital $1119m*
Acciona Windpower SA Spain Wind Equity (company) Nordex $864m
*Value based on an estimate of approximately EUR1bn ($1.19bn) made by elEconomista.es on 16th October 2015

32
1.11.00.92.11.4
5.5
2.04.54.2
3.52.8
3.73.84.8
7.1
9.4
7.3
3.0
5.2
3.4
5.4
3.0
6.2
8.27.3
3.64.6
6.3
3.3
7.4
16.5
8.7
5.4
3.02.23.1
6.9
4.04.5
2.4
6.5
3.2 4.83.3
12.0
3.42.3
4.1
6.5
Q1
Q2
Q3
Q4
Q1
Q2
Q3
Q4
Q1
Q2
Q3
Q4
Q1
Q2
Q3
Q4
Q1
Q2
Q3
Q4
Q1
Q2
Q3
Q4
Q1
Q2
Q3
Q4
Q1
Q2
Q3
Q4
Q1
Q2
Q3
Q4
Q1
Q2
Q3
Q4
Q1
Q2
Q3
Q4
Q1
Q2
Q3
Q4
Q1
2004 2005 2006 2007 2008 2009 2010 2011 2012 2013 2014 2015 '16
Four quarter running average
Note: Total values include estimates for undisclosed deals Source: Bloomberg New Energy Finance
19 April 2016
CORPORATE M&A TRANSACTIONS IN CLEAN ENERGY Q1 2004-Q1 2016 ($BN)
● Global mergers and acquisitions of companies that are primarily involved in the clean energy industry according to BNEF exposure ratings.

33
Note: Total values include estimates for undisclosed deals Source: Bloomberg New Energy Finance
19 April 2016
RENEWABLE ENERGY ASSET ACQUISITIONS & REFINANCING Q1 2004-Q1 2016 ($BN)
● Global acquisitions or refinancing's of utility-scale (1MW+) renewable energy generating assets.
1.41.70.7
1.51.81.52.8
6.5
4.04.1
2.4
9.0
3.1
6.9
9.810.9
9.9
5.96.9
13.8
6.7
12.7
8.7 9.7
8.17.1
7.79.47.7
9.7
12.7
10.4
12.711.0
9.0
21.0
14.5
9.8
12.0
12.3
10.1
19.5
13.8
27.8
10.7
18.0
15.4
25.3
20.1
Q1
Q2
Q3
Q4
Q1
Q2
Q3
Q4
Q1
Q2
Q3
Q4
Q1
Q2
Q3
Q4
Q1
Q2
Q3
Q4
Q1
Q2
Q3
Q4
Q1
Q2
Q3
Q4
Q1
Q2
Q3
Q4
Q1
Q2
Q3
Q4
Q1
Q2
Q3
Q4
Q1
Q2
Q3
Q4
Q1
Q2
Q3
Q4
Q1
2004 2005 2006 2007 2008 2009 2010 2011 2012 2013 2014 2015 '16Four quarter running average

CLEAN ENERGY INDEXES

35
0
100
200
300
400
500
Jan 03 Jan 05 Jan 07 Jan 09 Jan 11 Jan 13 Jan 15
19 April 2016
Note: Values as of 14 April 2016; NASDAQ and S&P 500 rebased to 100 on 1 Jan 2003 Source: Bloomberg New Energy Finance
NEX CLEAN ENERGY INDEX2003–16 YTD
● The WilderHill New Energy Global Innovation Index (NEX) is a modified dollar-weighted index of publicly traded companies active in renewable and low-carbon energy, and which stand to benefit from responses to climate change and energy security concerns. The majority of index members are quoted outside the US.

3619 April 2016
Note: Values as of 14 April 2016; NASDAQ and S&P 500 rebased to 100 on 1 Jan 2011 Source: Bloomberg New Energy Finance
NEX CLEAN ENERGY INDEX2012–16 YTD
40
60
80
100
120
140
160
180
200
Jan 12 Jul 12 Jan 13 Jul 13 Jan 14 Jul 14 Jan 15 Jul 15 Jan 16 Jul 16

3719 April 2016
Note: Values as of 14 April 2016; NASDAQ and S&P 500 rebased to 100 on 1 Jan 2011 Source: Bloomberg New Energy Finance
NEX CLEAN ENERGY INDEX2013–16 YTD
40
60
80
100
120
140
160
180
200
Jan 13 Jul 13 Jan 14 Jul 14 Jan 15 Jul 15 Jan 16 Jul 16

3819 April 2016
Note: Values as of 14 April 2016; NASDAQ and S&P 500 rebased to 100 on 1 Jan 2011 Source: Bloomberg New Energy Finance
NEX CLEAN ENERGY INDEX2014–16 YTD
80
90
100
110
120
130
Jan 14 Apr 14 Jul 14 Oct 14 Jan 15 Apr 15 Jul 15 Oct 15 Jan 16 Apr 16

39
Note: Values as of 14 April 2016; NASDAQ and S&P 500 rebased to 1,000 on 30 December 2005 Source: Bloomberg New Energy Finance
19 April 2016
NYSE BNEF REGIONAL CLEAN ENERGY INDEXES2006-16 YTD
0
500
1,000
1,500
2,000
2,500
3,000
Jan 06 Jan 07 Jan 08 Jan 09 Jan 10 Jan 11 Jan 12 Jan 13 Jan 14 Jan 15 Jan 16
NYSE BloombergAmericas Clean EnergyIndex
NYSE Bloomberg AsiaPacific Clean EnergyIndex
NYSE BloombergEurope, Middle East &Africa Clean EnergyIndex
MSCI World & Emerging

40
Note: Values as of 14 April 2016; NASDAQ and S&P 500 rebased to 1,000 on 30 December 2005 Source: Bloomberg New Energy Finance
19 April 2016
NYSE GLOBAL CLEAN ENERGY SECTOR INDEXES2006-16 YTD
0
500
1,000
1,500
2,000
2,500
3,000
3,500
4,000
Jan 06 Jan 07 Jan 08 Jan 09 Jan 10 Jan 11 Jan 12 Jan 13 Jan 14 Jan 15 Jan 16
NYSE Bloomberg GlobalWind Energy Index
NYSE Bloomberg GlobalSolar Energy Index
NYSE Bloomberg GlobalEnergy Smart TechnologiesIndex
MSCI World & Emerging

RENEWABLE ENERGY CAPACITY INVESTMENT

42
Source: Bloomberg New Energy Finance
19 April 2016
RENEWABLE ENERGY CAPACITY INVESTMENT EXCLUDING LARGE HYDRO 2004-15 ($BN)
$40bn
$63bn
$94bn
$124bn
$158bn$154bn
$215bn
$257bn$243bn
$212bn
$249bn
$267bn
2004 2005 2006 2007 2008 2009 2010 2011 2012 2013 2014 2015
MarineGeothermalSmall hydroBiomass & WasteBiofuelsSolarWind
● Total annual investment into new build renewable energy generating assets (excluding large hydro). This includes large and small scale project finance.
Note: Total values include estimates for undisclosed deals.

43
Source: Bloomberg New Energy Finance
19 April 2016
RENEWABLE ENERGY CAPACITY INVESTMENT INCLUDING LARGE HYDRO 2004-15 ($BN)
● Total annual investment into new build renewable energy generating assets (including large hydro). This includes large and small scale project finance.
Note: Total values include estimates for undisclosed deals.
$73bn
$96bn
$147bn
$177bn
$211bn
$187bn
$259bn
$290bn$276bn
$245bn
$295bn$309bn
2004 2005 2006 2007 2008 2009 2010 2011 2012 2013 2014 2015
Large hydroMarineGeothermalSmall hydroBiomass & WasteBiofuelsSolarWind

44
This publication is the copyright of Bloomberg New Energy Finance. No portion of this document may be photocopied, reproduced, scanned into an electronic system or transmitted, forwarded or distributed in any way without prior consent of Bloomberg New Energy Finance.The information contained in this publication is derived from carefully selected sources we believe are reasonable. We do not guarantee its accuracy or completeness and nothing in this document shall be construed to be a representation of such a guarantee. Any opinions expressed reflect the current judgment of the author of the relevant article or features, and does not necessarily reflect the opinion of Bloomberg New Energy Finance, Bloomberg Finance L.P., Bloomberg L.P. or any of their affiliates ("Bloomberg"). The opinions presented are subject to change without notice. Bloomberg accepts no responsibility for any liability arising from use of this document or its contents. Nothing herein shall constitute or be construed as an offering of financial instruments, or as investment advice or recommendations by Bloomberg of an investment strategy or whether or not to "buy," "sell" or "hold" an investment.
COPYRIGHT AND DISCLAIMER
19 April 2016

Unique analysis, tools and data for decision-makers driving change in the energy system
MARKETS Renewable EnergyEnergy Smart TechnologiesAdvanced TransportGas Carbon and RECs
SERVICESAmericas ServiceAsia Pacific ServiceEMEA ServiceApplied Research Events and Workshops Noemi Glickman
Marketing & Communications [email protected] +44 (0)20 7392 0575