Embed Size (px)
Citation preview

BERENBERG EQUITY RESEARCH
Global Technology
Nemesis: a source of harm or ruin?
Adnaan Ahmad
Analyst
+44 20 3207 7851
Jean Beaubois
Specialist Sales
+44 20 3207 7835
21 May 2013
Technology Hardware
Daud Khan
Analyst
+44 20 3465 2638
daud.khan @berenberg.com
Ali Khwaja
Analyst
+44 20 3207 7852
Tammy Qiu
Analyst
+44 20 3465 2673
Sebastian Grabert
Analyst
+44 20 3207 7834

For our disclosures in respect of section 34b of the German Securities Trading Act (Wertpapierhandelsgesetz – WpHG) and our disclaimer please see the end of this document. Please note that the use of this research report is subject to the conditions and restrictions set forth in the disclosures and the disclaimer at the end of this document.

3
Table of contents
Nemesis: a source of harm or ruin? 4
ARM has more legs 16
What is working 19
ARM 19
Infineon 20
Samsung Electronics 21
Apple 22
Qualcomm 23
Imagination 24
HTC 25
Foxconn International 26
Hon Hai 27
Juniper 28
Motorola Solutions 29
Foxconn Technology 30
What is not working 31
Ericsson 31
STMicro 32
BlackBerry 33
Nokia 34
Alcatel-Lucent 35
ZTE 36
TPK 37
Catcher 38
MediaTek 39
Cisco 40
Price targets and valuation 41
Disclosures in respect of section 34b of the German Securities Trading Act (Wertpapierhandelsgesetz – WpHG) 42
Contacts: Investment Banking 48
Global Technology Technology Hardware
4
Nemesis: a source of harm or ruin?
Since we initiated on the sector in January 2010, we have talked about the battle between the Apple and Google (Android) ecosystems in the post-PC era. To date, this battle has primarily been along classical tech hardware business and financial models: come out with a good device and sell it at as high an ASP as possible to try to be profitable. Amazon disturbed this business model somewhat with its Kindle Fire launch in late 2011 and Google (with its Nexus line) has used a similar strategy on occasions. However, we see the next 12 to 18 months as a potential watershed for the classical hardware profits business model as Google, Amazon and potentially Microsoft and others introduce smartphones and tablets with a “hardware at cost or a loss” strategy.
The issue here, in our view, is that if any of these “platform vendors” are successful with large consumer uptake, which admittedly has not been the case to date, then this will put a major strain on the margin dynamics of the hardware industry. We think Google’s “X” project (new smartphones and potentially tablets), coupled with the possibility of an Amazon smartphone, should be “front and centre” in investors’ minds when thinking about hardware industry margin structure in the mid-term, as these platform vendors can leverage their existing advertising, content and e-commerce financing models to offer high-end smartphone quality at up to 50% cheaper than equivalent devices from Apple, Samsung and the traditional hardware industry. Good for consumers, but also positive for telcos as they will be able to substantially lower their current subsidy levels on high-end devices.
We remain convinced that competition among traditional vendors, feature creep, the shift to lower-priced devices, slower industry growth and the potential of new platform players as described in this note will put pressure on smartphone industry margins. We keep our bearish structural views on Apple, Samsung, HTC, Nokia, BlackBerry and ZTE.
We also keep our negative stance on the infrastructure and networking segment. Yes, it has been the wrong call in the last six months; and yes, 2013 may be a positive spending cycle primarily driven by the US and Europe. But the cycle, in our opinion, will be overpowered at some point in the next 12 months by the structural headwinds that face these industries. Ericsson, ZTE, Huawei, NSN, Alcatel-Lucent, Samsung and now potentially vendors such as Cisco will hit the space from a small cell/WiFi angle. This, coupled with telecoms companies’ continued contradictory spending behaviour, should lead to further industry restructuring, exits and consolidation, in our view. Capacity needs to come out of the industry, we believe.
Rating system: Absolute
21 May 2013
Adnaan Ahmad Analyst +44 20 3207 7851 [email protected]
Jean Beaubois Specialist Sales +44 20 3207 7835 [email protected]
ARM Holdings plc BuyClosing price: GBP 10.96 PT: GBP 13.50
(Old: GBP 11.50)
20/05/2013 London
Infineon Technologies AG HoldClosing price: EUR 6.46 PT: EUR 6.00
20/05/2013 XETRA
Cisco Systems Inc SellClosing price: USD 24.24 PT: USD 16.00
(Old: USD 14.00)17/05/2013 NASDAQ
Ericsson SellClosing price: SEK 79.40 PT: SEK 60.0020/05/2013 Stockholm
TPK Holding Co Ltd SellClosing price: TWD 597.00 PT: TWD 400.0020/05/2013 Taiwan
Qualcomm Inc SellClosing price: USD 66.61 PT: USD 50.00
17/05/2013 NASDAQ
Samsung Electronics Co Ltd SellClosing price: KRW 1,497,000 PT: KRW 1,250,000
20/05/2013 Korea Stock Exchange
Apple Inc SellClosing price: USD 433.26 PT: USD 360.00
17/05/2013 NASDAQ
STMicroelectronics NV SellClosing price: EUR 7.52 PT: EUR 4.00
20/05/2013 Paris
Juniper Networks Inc SellClosing price: USD 17.61 PT: USD 14.00
17/05/2013 New York
Alcatel-Lucent SellClosing price: EUR 1.23 PT: EUR 0.70
20/05/2013 Paris
ZTE Corp SellClosing price: HKD 13.34 PT: HKD 8.50
20/05/2013 Hong Kong
MediaTek Inc SellClosing price: TWD 378.50 PT: TWD 210.00
20/05/2013 Taiwan
Imagination Technologies Group SellClosing price: GBp 337 PT: GBp 250
(Old: GBp 360)
20/05/2013 London
Catcher Technology Co Ltd SellClosing price: TWD 162.00 PT: TWD 115.00
20/05/2013 Taiwan
Foxconn Technology Co Ltd SellClosing price: TWD 80.40 PT: TWD 70.00
20/05/2013 Taiwan
Motorola Solutions Inc SellClosing price: USD 57.84 PT: USD 40.00
17/05/2013 NASDAQ
BlackBerry SellClosing price: USD 14.62 PT: USD 5.00
17/05/2013 NASDAQ
Hon Hai Precision Ind Co Ltd SellClosing price: TWD 77.10 PT: TWD 66.00
20/05/2013 Taiwan
Foxconn International Holdings SellClosing price: HKD 3.22 PT: HKD 2.50
20/05/2013 Hong Kong
Nokia Oyj SellClosing price: EUR 2.93 PT: EUR 1.50
20/05/2013 Helsinki
HTC Corporation SellClosing price: TWD 292.00 PT: TWD 150.00
20/05/2013 Taiwan

Global Technology Technology Hardware
5
ARM Holdings therefore remains our only Buy-rated stock. Royalty rate inflation and end-market diversification remain the core tenets to our thesis here, and we raise our price target to £13.50.
In this note, we discuss the potential for platform players to turn the hardware business model on its head by using “hardware at cost or a loss” strategies aggressively to gain share in smartphones and tablets. Platform players continue to face challenges – such as distribution, core expertise and product innovation cycles – but we think it is important to highlight the threat of such strategies, especially to the smartphone industry and its margin structure given the upcoming launch of Google “X” products in the next six to 12 months.
Finally, given our negative stance on all but one stock in our coverage universe on an absolute basis, we continue to highlight certain pair trades (see table below) and note that to date they have performed well. In this report we also assess, as always, what is working and what is not from a stock perspective. Our detailed updated models for each company are available on request.
Pair trades return between inception and 16/05/2013
Pair trades-return between inception and 16/05/2013
Long Short Return
QCOM MTK -11.1%
IFX STM -16.7%
ERIC ZTE -5.7%
Samsung HTC -8.9%
ARM IMG 45.8%
TPK FIH -2.5%
AAPL Samsung 3.5%
Nokia HTC 0.4%
CSCO ALU 6.1%
ERIC JNPR 10.2%
Source: Bloomberg data

Global Technology Technology Hardware
6
Berenberg versus consensus estimates
Source: Berenberg estimates, Bloomberg for consensus
Change in EPS estimates
Source: Berenberg estimates, Company data
Companies Berenberg Est. Consensus Delta Berenberg Est. Consensus Delta
Nokia -0.01 0.00 -348% 0.08 0.11 -20%
Ericsson 4.84 4.84 0% 5.26 5.87 -10%
Alcatel Lucent -0.26 -0.14 -86% -0.03 0.02 -227%
Apple 40.93 39.75 3% 39.79 44.03 -10%
BlackBerry* -0.35 0.37 -195% -0.61 0.02 -3884%
Infineon 0.23 0.21 8% 0.31 0.38 -19%
STMicro -0.02 0.06 -136% 0.29 0.41 -29%
ARM 0.22 0.20 12% 0.29 0.25 15%
HTC 8.86 14.61 -39% 11.79 19.67 -40%
ZTE -0.20 0.58 -134% -0.13 0.73 -117%
Motorola Solution 3.50 3.62 -3% 3.71 4.19 -11%
Cisco 2.02 2.01 0% 1.97 2.12 -7%
Juniper 1.06 1.14 -6% 1.07 1.29 -17%
Qualcomm 4.39 4.54 -3% 4.65 4.90 -5%
Mediatek 16.71 18.17 -8% 17.00 23.27 -27%
Catcher 16.70 16.11 4% 14.23 15.85 -10%
Hon Hai 7.32 8.08 -9% 6.91 9.04 -24%
TPK Holdings 52.70 52.07 1% 52.10 56.87 -8%
Foxconn Technology 6.58 7.06 -7% 6.74 7.47 -10%
Foxconn International Holding -0.01 0.00 -123% -0.01 0.02 -185%
Imagination 8.32 9.90 -16% 8.87 13.80 -36%
Samsung Electronics 234,787 212,535 10% 203,535 238,006 -14%
* for FY 2014 and 2015
2013 EPS 2014 EPS
NEW OLD NEW OLD
1 ARM Holdings (GB£) 0.22 0.22 0.29 0.27
2 Qualcomm (US$) 4.39 4.33 4.65 4.73
3 Apple (US$) 40.93 42.28 39.79 44.98
4 Alcatel Lucent (€) -0.26 -0.09 -0.03 0.03
5 ZTE (HK$) -0.20 -0.24 -0.13 -0.59
6 Ericsson (SEK) 4.84 4.65 5.26 4.98
7 Infineon (€) 0.23 0.17 0.31 0.35
8 HTC (NT$) 8.86 8.86 11.79 7.88
9 Motorola Solutions(US$) 3.50 3.62 3.71 3.98
10 Juniper (US$) 1.06 1.09 1.07 1.25
11 STMicro (€) -0.02 0.06 0.29 0.11
12 BlackBerry* (US$) -0.35 -0.66 -0.61 -0.59
13 Cisco (US$) 2.02 2.02 1.97 2.07
14 Mediatek (NT$) 16.71 11.91 17.00 11.62
15 Nokia (€) -0.01 0.01 0.08 0.05
16 Catcher (NT$) 16.70 13.17 14.23 13.31
17 Hon Hai (NT$) 7.32 8.13 6.91 6.56
18 TPK Holdings (NT$) 52.70 50.69 52.10 52.10
19 Foxconn Technology (NT$) 6.58 6.76 6.74 6.87
20 Foxconn International Holding (US$) -0.01 -0.01 -0.01 -0.01
21 Imagination (GBP) 8.32 12.47 8.87 15.03
22 Samsung (KRW) 234,787 199,442 203,535 187,517
* for FY 2014 and 2015
2013 EPS 2014 EPS

Global Technology Technology Hardware
7
Stock selection: order of preference
*All prices as of COB 16 May on the relevant home exchange Source: Berenberg estimates, Company data
1 ARM Holdings (£) Buy To 13.5 11.0 23% 55.1 Royalty rate to increase given Cortex platform mix
Smartphone/tablet volumes drive PD royalties
1.1 From 11.5 Expansion into Networking and Server markets
1.2 Intel becomes irrelevant
2 Infineon (€) Hold 6.0 6.4 -7% 30.9 Pure macro play dependent on Eurozone situation
2.1 Quality end market exposure with secular growth
2.2 Qimonda overhang persists
3 Cisco ($) Sell To 16.0 23.9 -33% 11.9 Gross margins to come under mid-term pressure given
mix and price competition
3.1 From 14.0 Huawei now has 20k Enterprise employees - focus on
emerging markets and Europe initially
3.24 Ericsson (SEK) Sell 60.0 81.4 -26% 16.8 Margin improvements baked into stock but at what
revenue growth?
4.1 LTE cycle could be cannibalised by WiFi investment
mid-term. Chinese vendors to get lion's share of China
4G deals4.25 TPK (TWD) Sell 400.0 610.0 -34% 11.7
5.1
6 Qualcomm ($) Sell 50.0 65.6 -24% 14.5 TAM for chips less than what analysts believe given
captive market (AAPL, Samsung and Huawei)
6.1 Mediatek aggressive at low-end
6.2 BRCM, NVDA, Intel et al fight-back for share
7 Samsung (KRW) Sell 1250000 1508000 -17% 7.1 Galaxy "S4" could go through iPhone 5 moment
7.1 Shift to mid- and low-end impacts margin structure
7.2 Phone business 60%+ of op profits - rest of business
cannot make up slack
8 Apple ($) Sell 360.0 434.6 -17% 10.9 iPhone at 60%+ of op profit facing growth and margin
pressure
8.1 iPad growth cannot make up for shortfall of iPhone
margin pressure
8.2 New areas: iWatch + iTV impacted by law of large
numbers
9 STMicro (€) Sell 4.0 7.2 -45% 116.5 MEMS technology could face comp pressure from
InvenSense
9.1 Spread in too many end markets with customers under
pressure (Nokia/HP) exposure
9.210 Juniper ($) Sell 14.0 17.8 -21% 15.7 Increased competition in Edge routing from mobile
## Need to invest in Enterprise impacting margin
structure
## Gross margins have downward bias on price and mix
11 Alcatel Lucent (€) Sell 0.7 1.2 -42% n/a
12 ZTE (HKD) Sell 8.5 13.6 -38% 23.6 Margin pressure in handset business from Chinese
OEMs such as Huawei## TD-LTE capex growth already in price
13 MediaTek (TWD) Sell 210.0 374.0 -44% 20.6 3G in China an opportunity but also a threat from
Qualcomm on price
## 2G competition tough: Spreadtrum, RDA both coming
out with smartphone products
##14 Imagination(£) Sell To 2.5 3.3 -24% 33.3 Move to dual and multi core GPUs positive for royalty
rate
## From 3.6 Apple position is stable for the foreseeable future
## Competition from Nvidia, QCOM, ARM, BRCM and
Vivante holds back major market share shift
15 Catcher (TWD) Sell 115.0 161.5 -29% 10.0 Potential MacBook share loss to Foxconn Tech
HTC, RIMM and Dell exposure a concern
## Not concerned in short term on light metal casing
##16 Foxconn Tech Sell 70.0 81.3 -14% 11.5 Apple casing opportunity is positive
## (TWD) But 60% of revenues from Nintendo
## Do not see games console market as structural grower
17 Motorola Solutions ($) Sell 40.0 57.5 -30% 15.9
##
##18 BBRY ($) Sell 5.0 14.7 -66% 39.6 Increase in competitive intensity in US market
## New BB10 platform not a game-changer
## Services revenues to come under attack
19 Hon Hai (NT$) Sell 66.0 78.7 -16% 9.7 45% of revenues from Apple and over 75% of Hon
Hai's growth from Apple
## Apple won't subsidise forever
## Apple concentration a double-edged sword
20 Foxconn Intl Sell 2.5 3.3 -24% n/a Headwinds for Nokia, Motorola and Sony
## (HKD) Nokia may outsource more assembly to Foxconn but
that is in price
##21 Nokia (€) Sell 1.5 2.9 -48% 970.0 NSN in harvest mode a positive
## Samsung + Android (China Inc) big threat to
## Nokia's mid-to-low-end emerging market position
22 HTC (TWD) Sell 150.0 290.0 -48% 19.8 "One" Series will only provide short-term relief
## Samsung, Apple into mid-range smartphones
HTC margins will be under pressure
## New markets at an investment cost; eg China
Buys - 16
Holds - 8
Sells - 6
Buys - 7
Holds - 3
Sells - 4
Buys - 19
Holds - 7
Sells - 21
Buys - 9
Holds - 9
Sells - 15
Buys - 8
Holds - 7
Sells - 5
Buys - 15
Holds - 9
Sells - 4
Buys - 2
Holds - 12
Sells - 8
Buys - 9
Holds - 11
Sells - 2
Government business to face challenges given catch-up
spend fall-off in next 12 months. Enterprise business
under pressure given retail capex concerns
Buys - 8
Holds - 12
Sells - 21
Buys - 8
Holds - 14
Sells - 2
Buys - 13
Holds - 21
Sells - 5
Buys - 7
Holds - 12
Sells - 10
IP business strong but competition intensifying
Cost savings will be given back in pricing
Buys - 13
Holds - 14
Sells - 7
Buys - 19
Holds - 5
Sells - 4
Buys - 51
Holds - 14
Sells - 3
P/E 2013E Consensus Investment thesis
Buys - 13
Holds - 11
Sells - 6
Buys - 18
Holds - 12
Sells - 6
Buys - 38
Holds - 9
Sells - 4
Buys - 22
Holds - 9
Sells - 5
Buys - 23
Holds - 4
Sells - 5
In-cell technology should replace glass on glass in mid-
term. Apple (55% of TPK revs) is likely to go down this
path in the next 18 months
Buys - 43
Holds - 4
Sells - 2
Buys - 49
Holds - 0
Sells - 2
% Implied
upside/
downside
Company Rating PT Price*

Global Technology Technology Hardware
8
Nemesis: a source of harm or ruin?
Nemesis: “A source of harm or ruin”; “an opponent that cannot be beaten or overcome”. The Free Dictionary.
First, since we initiated on the sector in January 2010, we have talked about the battle between the Apple and Google (Android) ecosystems in the post-PC era. To date, this battle has primarily been along classical tech hardware business and financial models: come out with a good device and sell it at as high an ASP as possible to try to be profitable. Amazon disturbed this business model somewhat with its Kindle Fire launch in late 2011 and Google (with its Nexus line) has used a similar strategy on occasions. However, we see the next 12 to 18 months as a potential watershed for the classical hardware profits (thin margins) business model as Google, Amazon and potentially Microsoft and others introduce smartphones and tablets with a “hardware at cost or a loss” strategy.
Historically, on occasions, hardware vendors have used their strong profitability with these products to “subsidise” services businesses. For example, Nokia had operating margins in the 20% range for its handset business and tried unsuccessfully to create ecosystems (Club Nokia/OVI); these proved to be loss-making. Even Apple’s Services businesses (App Store and iTunes) have only 5% margin structures. Samsung is trying to do that today by investing its “super-normal” margins in smartphones into software and services. On the other hand, Amazon initially made between a $30-50 loss on each Kindle Fire it sold (ie on the hardware) in Q4 2011, but its model was to make that money back – and then some – through subscription, services and content. Google made losses on some of its Nexus products, but that was to propel the wider Android market into an accelerated product introduction and development mode. And more recently, we think that Microsoft has been and will “subsidise” its “Surface” and “Surface Pro” efforts to push Windows 8 concepts into the mainstream. The issue here, in our view, is that if any of these “platform vendors” are successful with large consumer uptake, which admittedly has not been the case to date, then this will put a major strain on the margin dynamics of the hardware industry. We think Google’s “X” project (new smartphones and potentially tablets), coupled with the possibility of an Amazon smartphone, should be “front and centre” in investors’ minds when thinking about hardware industry margin structure.
Second, given that the bill of material on high-end smartphones (such as a Samsung Galaxy S4 or an iPhone5) is in the $250-300 range, if Google, for instance, prices its “X” device at near cost, then that will be 50% cheaper than the equivalent high-end device. This is obviously good news for the consumer, but also very good news for telcos as they will be able to substantially lower their current subsidy levels on high-end devices. In this scenario, Apple and Samsung could obviously stick to their existing pricing structure and hope that their brand and/or ecosystem will deflect consumers from churning, but the likely outcome, in our view, would be to lower their respective prices and, at the same time, beef up cost (marketing to offset operator advertising of the lower-priced Google “X” as well as

Global Technology Technology Hardware
9
accelerate new product development). This is the issue that confronts hardware-centric vendors – how do you compete against companies that (given their business models) can offer hardware for free? Nokia, LG Electronics, BlackBerry, Sony Mobile, HTC, China Inc and Japan Inc are all struggling to make decent profits/returns in the smartphone business. The same is true in the PC space for Dell, HP, Acer, Asus, Toshiba and Sony. And in the tablet (hybrid/convertible) segment, both groups are also at best operating on razor-thin margins. The exceptions are obviously Apple and Samsung, which between them account for more than 100% of smartphone and tablet industry profits today. At the same time, though, given their generous margins (we estimate that Apple makes ~30-35% operating margins in its iPhone business and Samsung just posted Q1 2013 margins of ~20% for its IM division, which houses its smartphones), they both have the most to lose.
PC and handset vendor margin structures in 2012
Source: Company data, Berenberg estimates
Third, the business and financial models of hardware companies and these platform companies are very different. Google’s business model is predicated on amassing advertising revenues based around its technological advantage in search, whereas Facebook’s is centred on leveraging its social network platform. Similarly, Amazon’s model is e-commerce revenues and razor-thin margins. Microsoft’s model is licensing Office and OS purchases of Windows by hardware OEMs. The important point here is that each of these vendors can leverage their “existing” profitable platforms into the hardware space. If we look at history, Microsoft was ploughing investment into its Xbox hardware and this division was losing money hand over fist between 2005 and 2008, with -20% to -30% operating margins. But
Gross Margin Operating Margin
Nokia (Devices & Services) 21.3% -4.5%
LG Electronics (Mobile) n/a 0.2%
BlackBerry (Hardware) 1.0% -8.0%
HTC 26.0% 7.0%
ZTE (Handset Business) 16.8% 5.0%
Sony (Mobile & Products) n/a -7.9%
TCL Communications 17.4% 0.0%
Toshiba (Electronics Division) n/a 6.8%
Dell (PC ) n/a 3.2%
HP (Consumer & Products) n/a 4.7%
Acer 10.1% 0.2%
Asus 13.6% 4.9%

Global Technology Technology Hardware
10
Microsoft, with its deep pockets, persisted – which will be the case again in tablet and potentially smartphone hardware, in our view. In addition, Amazon selling a Kindle Fire at cost or at low single-digit margins is: a) around the corporate average margin structure; and b) a way to incentivise the hardware user to buy more products digitally from Amazon. In other words, these platform vendors want to drive software, services, content and subscription sales. Hardware vendors do not have that luxury. Even Apple, with ~8-10% of revenues from digital content (App Store and iTunes) will need to change tack if these platform vendors are successful with their “hardware at cost or a loss” strategies. A final interesting anecdote is that Motorola Mobility currently has negative margins; hence potentially selling new Google-inspired hardware at near-cost could actually be a positive boost to overall group margin structure!
Platform players have deep pockets to pursue “hardware at cost/a loss” strategy
Source: Company data 2012
Fourth, the platform we worry about the most is Google. According to an article in the Wall Street Journal (21 December 2012), Google’s CEO, Larry Page, has told the Motorola team to “think big” and aspire to reach the scale of Samsung’s mobile business; and promised a significant marketing budget for the unit. In the past 18 months, the Motorola products that have been launched have all been Motorola-inspired. In the next six to 12 months, we think hardware products that come out of Motorola will be Google-designed and a branded Google experience.
Commentary from Google’s earnings call in April also points to some new products. Page said: “In today’s multi-screen world, the opportunities are endless. Think about your device. Battery life is a challenge for most people. You shouldn’t need to carry around a charger with you to make it through the day. If your kids spill their drink on your tablet, the screen shouldn’t die. And when you drop your phone, it shouldn’t shatter. There is real potential to invent new and better experiences, ones that are much faster and more intuitive. So having just seen some of those upcoming products myself, I’m really excited about the potential there.” We think that these remarks
Platform Players have deep pockets to pursue "hardware at a cost/loss" strategy
Amazon Google Microsoft Facebook
($)m
Revenue 61,093 50,175 73,723 5,089
Gross Margin 25% 59% 76% 73%
EBIT 676 12,760 28,496 538
SG&A 9,723 9,988 21,426 1,788
R&D 4,564 6,793 9,811 1,399
FCF 395 13,346 29,321 377
Net Cash 7,063 44,020 51,096 7,270
Source: Company Data
Global Technology Technology Hardware
11
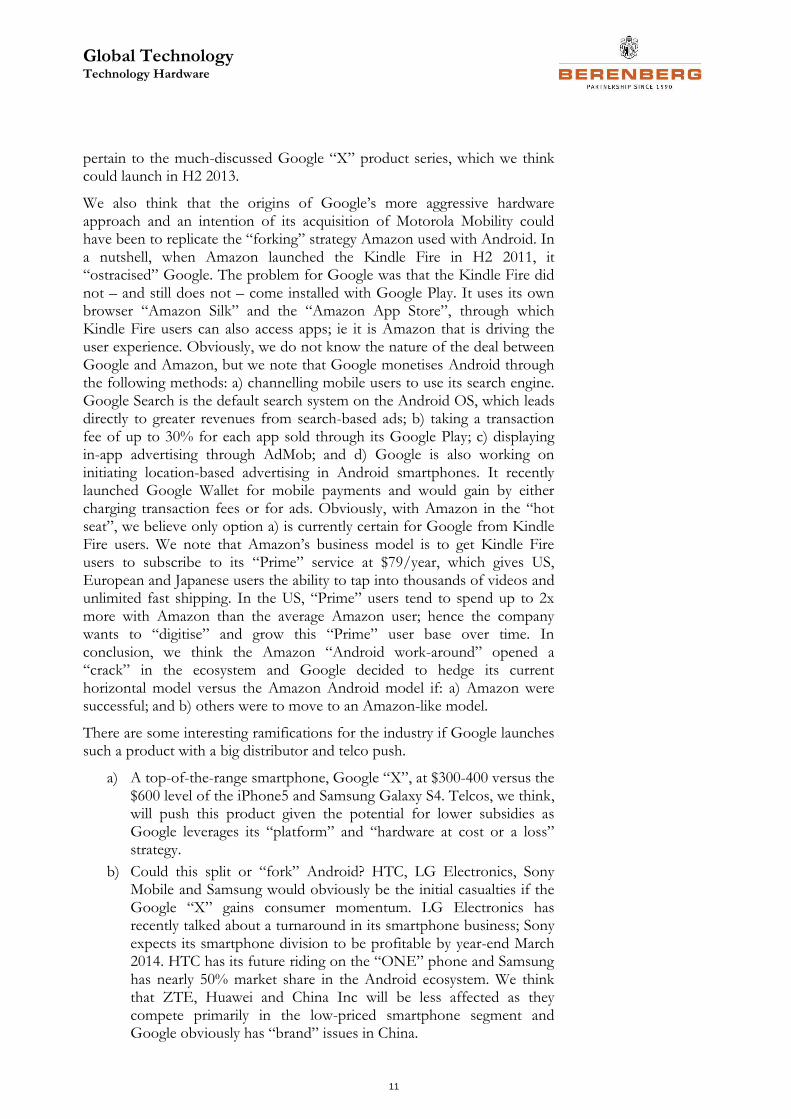
pertain to the much-discussed Google “X” product series, which we think could launch in H2 2013.
We also think that the origins of Google’s more aggressive hardware approach and an intention of its acquisition of Motorola Mobility could have been to replicate the “forking” strategy Amazon used with Android. In a nutshell, when Amazon launched the Kindle Fire in H2 2011, it “ostracised” Google. The problem for Google was that the Kindle Fire did not – and still does not – come installed with Google Play. It uses its own browser “Amazon Silk” and the “Amazon App Store”, through which Kindle Fire users can also access apps; ie it is Amazon that is driving the user experience. Obviously, we do not know the nature of the deal between Google and Amazon, but we note that Google monetises Android through the following methods: a) channelling mobile users to use its search engine. Google Search is the default search system on the Android OS, which leads directly to greater revenues from search-based ads; b) taking a transaction fee of up to 30% for each app sold through its Google Play; c) displaying in-app advertising through AdMob; and d) Google is also working on initiating location-based advertising in Android smartphones. It recently launched Google Wallet for mobile payments and would gain by either charging transaction fees or for ads. Obviously, with Amazon in the “hot seat”, we believe only option a) is currently certain for Google from Kindle Fire users. We note that Amazon’s business model is to get Kindle Fire users to subscribe to its “Prime” service at $79/year, which gives US, European and Japanese users the ability to tap into thousands of videos and unlimited fast shipping. In the US, “Prime” users tend to spend up to 2x more with Amazon than the average Amazon user; hence the company wants to “digitise” and grow this “Prime” user base over time. In conclusion, we think the Amazon “Android work-around” opened a “crack” in the ecosystem and Google decided to hedge its current horizontal model versus the Amazon Android model if: a) Amazon were successful; and b) others were to move to an Amazon-like model.
There are some interesting ramifications for the industry if Google launches such a product with a big distributor and telco push.
a) A top-of-the-range smartphone, Google “X”, at $300-400 versus the $600 level of the iPhone5 and Samsung Galaxy S4. Telcos, we think, will push this product given the potential for lower subsidies as Google leverages its “platform” and “hardware at cost or a loss” strategy.
b) Could this split or “fork” Android? HTC, LG Electronics, Sony Mobile and Samsung would obviously be the initial casualties if the Google “X” gains consumer momentum. LG Electronics has recently talked about a turnaround in its smartphone business; Sony expects its smartphone division to be profitable by year-end March 2014. HTC has its future riding on the “ONE” phone and Samsung has nearly 50% market share in the Android ecosystem. We think that ZTE, Huawei and China Inc will be less affected as they compete primarily in the low-priced smartphone segment and Google obviously has “brand” issues in China.

Global Technology Technology Hardware
12
c) Samsung would clearly be a major casualty given the business model difference as well as its high-end smartphone market share. Samsung is obviously in an interesting situation as it commands 50%+ share of Android smartphones and hence Google does need Samsung to continue to succeed in the short term. Interestingly, though, Samsung has upped the ante on software and services initiatives as well as publicly talking up its “hedged” OS strategy: Tizen and Microsoft. However, both of these are essentially starting from scratch, and if Samsung tries to “fork” Android like Amazon, how will it gain critical mass in content, services and subscription? Ultimately, Samsung is a very good hardware company; shifting to become a “platform” company will be extremely difficult – look what happened to Nokia with its OVI venture. Another point here is that Google is ultimately the key-holder to Android: Samsung has absolutely no control of the evolution of the platform (and hence its attractiveness to developers) and Google Play (and hence its attractiveness to end-customers).
Smartphone market share development by operating system
Source: IDC
2008 2009 2010 2011 2012
Android 0.5% 4.0% 23.3% 49.2% 68.8%
iOS 9.1% 14.5% 15.6% 18.8% 18.8%
Blackberry OS 15.6% 19.9% 16.0% 10.3% 4.5%
Symbian 48.4% 44.9% 36.4% 16.5% 3.3%
Windows Mobile 13.0% 9.3% 4.9% 1.8% 2.5%
Other 13.4% 7.4% 3.8% 3.6% 2.1%

Global Technology Technology Hardware
13
Tablet market share by operating system
Source: Gartner
Fifth is Amazon’s strategy. “We want to make money when people use our devices, not when they buy our devices,” Jeff Bezos, CEO of Amazon, said. The Kindle Fire is Amazon’s first step into the hardware world, in our view. We think that over the next 12 to 24 months, it is likely that Amazon will launch a smartphone, allowing it to leverage its platform and “hardware at cost or a loss” strategy further. As stated above, Amazon has its own “flavour” of Android and its own App store; and it is working on building an ad network through the applications it distributes. The bottom line: it is all about selling as much digital content and Amazon merchandise as possible. It has created cloud and streaming-based services for films, music and video, which it offers to customers with cloud storage and potential shopping and/or shipping discounts. We think that the key differentiator with Amazon is that it sells virtually everything, and mostly at very competitive prices. The potential for an Amazon-based smartphone has been discussed for a while but there are some pointers to suggest that it is real – smartphone screen sizes are increasing, which benefits the Amazon shopping experience. Amazon has recently hired Microsoft phone teams, the leader of which stated: “I’m building a new team going after a totally new area for Amazon. I’m hiring cloud and mobile developers and testers, program managers, and product managers.” Amazon has also acquired Liquavista (a display technology company) and a natural voice search company (think SIRI on Apple). We also know that it has been trying to gain access to wireless patents to potentially protect itself against any hostile onslaught.
Sixth, Microsoft is obviously the elephant in the room. It is very late to the game versus its platform peers, but it has shown before in the game console business that it has deep pockets and is willing to go through near-term pain for a position on the podium. Microsoft’s dabbling in hardware has been an unmitigated disaster, in our view, with the exception of the Xbox in the last few years. The “Kin”, “Slate” and “Zune” come to mind, and the “Surface” will probably go down a similar path. The more immediate issue with the “Surface” is how it “alienated” Microsoft’s historical hardware OEM partners (such as HP, Dell, Lenovo, Acer and Asus). In this instance, the “hardware at cost or a loss” strategy failed to take any volume share away
2010 2011 2012
Android 15.9% 30.7% 42.9%
iOS 83.7% 65.3% 55.8%
RIM 0.0% 0.2% 0.3%
Windows 0.0% 0.0% 0.9%
Others 0.4% 3.8% 0.0%

Global Technology Technology Hardware
14
from the traditional hardware community. The question now is does Microsoft follow a similar hardware strategy and come out with a “Surface smartphone”? We do not think that it is on the cards in the next 12 months, given: a) Microsoft needs hardware friends to garner volume and an ecosystem for Windows 8 and Windows Phone 8; b) Windows 8 is still in its infancy and there are already many user complaints on changing the OS or making it easier and less confusing; hence we think that this shift to “Windows Blue” is a priority in the near term; and c) Microsoft recently stipulated that it was not interested in building its own smartphone.
Seventh, there have been many statements about Facebook coming out with its own hardware and leveraging its social network platform and user base. We do not think that this is likely in the next 12 to 18 months given that the company needs to achieve increased usage on as wide a hardware base as possible rather than having two to three Facebook-branded smartphones. It has relationships with Apple, Microsoft, Google and BlackBerry, as well as with lower-end phones, such as Nokia’s Asha series. The mobile business is critical to Facebook’s future and its current valuation, as can be shown by the push to get “Home” on Android-based devices. Unfortunately, this initiative has not taken off and neither did Facebook’s button on HTC “Salsa” and “Cha Cha” phones in 2012.
Eighth is the position of other possible platform players. BlackBerry is obviously a niche platform currently with its own hardware, software, services and applications. As we have stated since our 2010 initiation, we just do not see how BlackBerry survives in the mid-to-long term. Similarly, Sony has hardware (smartphones, tablets, PCs, TVs), it uses Android but can “fork” it like Amazon, and it has a vast content library of music, gaming and films to leverage. The problem here is that Sony just has not been successful and is late at integrating this portfolio of assets into a powerful platform. In China, there are a few companies to be aware of that have a platform or quasi-platform approach, all based on variants of Android. Xiaomi sells high-end handsets online at ~50% discounts to its peers as it strives to make the money back with Internet/messaging services and accessory sales. It shipped over 7m handsets in 2012. Baidu, China’s Internet search giant, also uses an Android variant (Baidu Cloud) and works with TCL and Changhong to sell smartphones at RMB1,000 ($150). Sina, Alibaba and Tencent have also experimented with platform and content partnerships with hardware OEMs in the last two years but to date have not released any of their own branded devices.
Ninth, if Google, for example, is successful with a smartphone product in the next 12 months, then one definite conclusion is that volumes in smartphones may be higher than investor expectations, as demand is brought forward on the back of lower price. This is obviously good for ARM and Qualcomm’s QTL licence business. The history of consumer electronics dictates that lower-priced devices do pull mid- and high-end prices down over time. In the near term, investors may be focused on the larger pie, but they should also start thinking about how this affects Apple and Samsung mid-term. A Google platform as a competitor is a very different animal to a “horizontal” Google business model, as it surely would depress industry and hence Apple and Samsung margin structures. This is

Global Technology Technology Hardware
15
already the case with the iPad in general and the iPad mini in particular, which Apple has stated has significantly lower than corporate average margins. As smartphones proliferate into the mid- and low-end in the next two to three years, there is a natural mix impact on margins, there is a feature creep impact (ie pack in more “bells and whistles” without the offsetting price uplift), and there is the competitive aspect – traditional competition from China Inc and Samsung, but also platform competition.
And finally, what are the potential pitfalls for the platform players? Well, telcos that have launched branded devices have historically failed to gain any real traction. Distribution, brand, new product innovation and scale have been challenges for the telco community. Distribution is obviously key for platform vendors. Microsoft’s “Surface” was only distributed initially via its own retail stores (a handful) and online. And distribution may only be tied to where the platform provider has sufficient content; ie Amazon does not offer “Prime” services and content in China. Securing telco and retail backing will be critical for any push in the smartphone segment. Low-priced devices could also only attract price-conscious consumers – hence the model to leverage content, services, subscription is only justified if the consumers actually go ahead and purchase these products!
ARM Holdings plc Technology Hardware
16
ARM has more legs
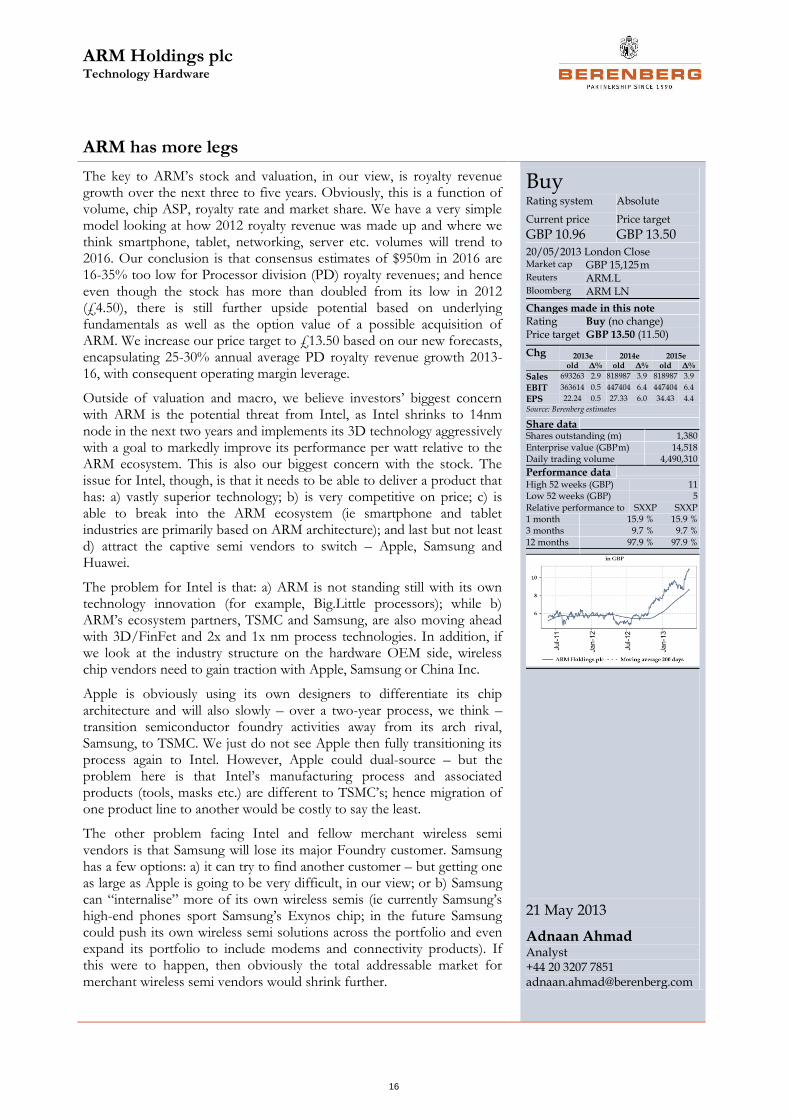
The key to ARM’s stock and valuation, in our view, is royalty revenue growth over the next three to five years. Obviously, this is a function of volume, chip ASP, royalty rate and market share. We have a very simple model looking at how 2012 royalty revenue was made up and where we think smartphone, tablet, networking, server etc. volumes will trend to 2016. Our conclusion is that consensus estimates of $950m in 2016 are 16-35% too low for Processor division (PD) royalty revenues; and hence even though the stock has more than doubled from its low in 2012 (£4.50), there is still further upside potential based on underlying fundamentals as well as the option value of a possible acquisition of ARM. We increase our price target to £13.50 based on our new forecasts, encapsulating 25-30% annual average PD royalty revenue growth 2013-16, with consequent operating margin leverage.
Outside of valuation and macro, we believe investors’ biggest concern with ARM is the potential threat from Intel, as Intel shrinks to 14nm node in the next two years and implements its 3D technology aggressively with a goal to markedly improve its performance per watt relative to the ARM ecosystem. This is also our biggest concern with the stock. The issue for Intel, though, is that it needs to be able to deliver a product that has: a) vastly superior technology; b) is very competitive on price; c) is able to break into the ARM ecosystem (ie smartphone and tablet industries are primarily based on ARM architecture); and last but not least d) attract the captive semi vendors to switch – Apple, Samsung and Huawei.
The problem for Intel is that: a) ARM is not standing still with its own technology innovation (for example, Big.Little processors); while b) ARM’s ecosystem partners, TSMC and Samsung, are also moving ahead with 3D/FinFet and 2x and 1x nm process technologies. In addition, if we look at the industry structure on the hardware OEM side, wireless chip vendors need to gain traction with Apple, Samsung or China Inc.
Apple is obviously using its own designers to differentiate its chip architecture and will also slowly – over a two-year process, we think – transition semiconductor foundry activities away from its arch rival, Samsung, to TSMC. We just do not see Apple then fully transitioning its process again to Intel. However, Apple could dual-source – but the problem here is that Intel’s manufacturing process and associated products (tools, masks etc.) are different to TSMC’s; hence migration of one product line to another would be costly to say the least.
The other problem facing Intel and fellow merchant wireless semi vendors is that Samsung will lose its major Foundry customer. Samsung has a few options: a) it can try to find another customer – but getting one as large as Apple is going to be very difficult, in our view; or b) Samsung can “internalise” more of its own wireless semis (ie currently Samsung’s high-end phones sport Samsung’s Exynos chip; in the future Samsung could push its own wireless semi solutions across the portfolio and even expand its portfolio to include modems and connectivity products). If this were to happen, then obviously the total addressable market for merchant wireless semi vendors would shrink further.
Buy Rating system
Current price
GBP 10.96
Absolute
Price target
GBP 13.50 20/05/2013 London Close Market cap GBP 15,125 m Reuters ARM.L Bloomberg ARM LN
Changes made in this note Rating Buy (no change) Price target GBP 13.50 (11.50) Chg 2013e 2014e 2015e
old Δ% old Δ% old Δ%
Sales 693263 2.9 818987 3.9 818987 3.9
EBIT 363614 0.5 447404 6.4 447404 6.4
EPS 22.24 0.5 27.33 6.0 34.43 4.4
Source: Berenberg estimates
Share data
Shares outstanding (m) 1,380 Enterprise value (GBP m) 14,518 Daily trading volume 4,490,310
Performance data
High 52 weeks (GBP) 11 Low 52 weeks (GBP) 5 Relative performance to SXXP SXXP 1 month 15.9 % 15.9 % 3 months 9.7 % 9.7 % 12 months 97.9 % 97.9 %
21 May 2013
Adnaan Ahmad Analyst +44 20 3207 7851 [email protected]
ARM Holdings plc Technology Hardware
17
China Inc mainly sources wireless semis from Qualcomm, MediaTek and Spreadtrum. Qualcomm’s margins have declined by 1,300bp in little over 18 months as Qualcomm tries to compete with MediaTek et al to grab China Inc (Huawei, ZTE, Lenovo and Chinese “white box” vendors) share with superior technology. The bottom line is that Intel’s product will have to have a “wow” factor for the captive vendors to want to make a switch, and even then price will still be a determining factor. In our models, we have Intel gaining 3% market share in smartphones and 10% in tablets primarily in the Windows ecosystem by 2016 and we think it will be extremely difficult for Intel to improve on this position without a major technological and price breakthrough. Our view remains that Intel should acquire Qualcomm’s QCT chip business to gain scale in this space and harvest its X86 platform. With the recent CEO change, however, we think it will be more of the same – namely tick-tock!
In our PD royalty model, we assume smartphone shipments increase from 700m in 2012 to nearly 2bn by 2016, with chip ASPs declining by 50% from $22 to $13. At the same time, ARM’s royalty rate should increase from 1.2% today for wireless to 2% as more Big.Little and v8 cores penetrate the base. Similarly, on tablets we assume a 120m-unit market in 2012 rising to 400m in 2016, with chip ASPs down to $13 from $22 today and royalty rates up to 2% from 1.2% today. Every 0.1% movement in ARM’s smartphone and tablet application processor royalty rate adds on $30m in PD royalties.
We also assume that ARM captures 25% of the embedded microcontroller market share by 2016 from 12% in 2012, as the market shifts to 32-bit processors away from 8-bit and 16-bit, and as proprietary solutions continue to be outsourced to ARM. For example, Renesas (leading global microcontroller vendor) has recently opened up a portion of its chip family to ARM. The volume in this market is sizable with over 20bn units shipped in 2012. The sensitivity here is that every 10% market share that ARM gains equates to $75m in PD royalties.
Similarly, we assume that ARM gains a 10% share in the networking segment by 2016 as its architecture gains sockets in data centres and infrastructure products. We think ARM can command a 2.5% royalty rate in this segment, with each chip having an ASP of around $30.
The biggest unknown in our model is the size of the machine-to-machine market. Third-party research suggests 68bn units will be shipped annually (Ericsson talked about 50bn+ in the 2015-20 timeframe). Assuming $1/chip and that ARM gets 5% market share and a 1% royalty, that is $35m in additional royalty revenue.
The bottom line is that we think ARM’s PD royalty revenue can hit between $1.1bn and $1.3bn in 2016 – 16% to 35% above the street. On the back of this, we think operating leverage is higher than the street is predicting – ARM already hit 50%+ margins in Q1 2013, and on our DCF (with an 8% WACC, 15-20% revenue growth for the next five years at the group level fading to 3% in 2022 and operating margins rising from the 50% level just posted to 65% on royalty revenue acceleration relative to licence revenues), we reach our new price target of £13.50.
ARM Holdings plc Technology Hardware
18
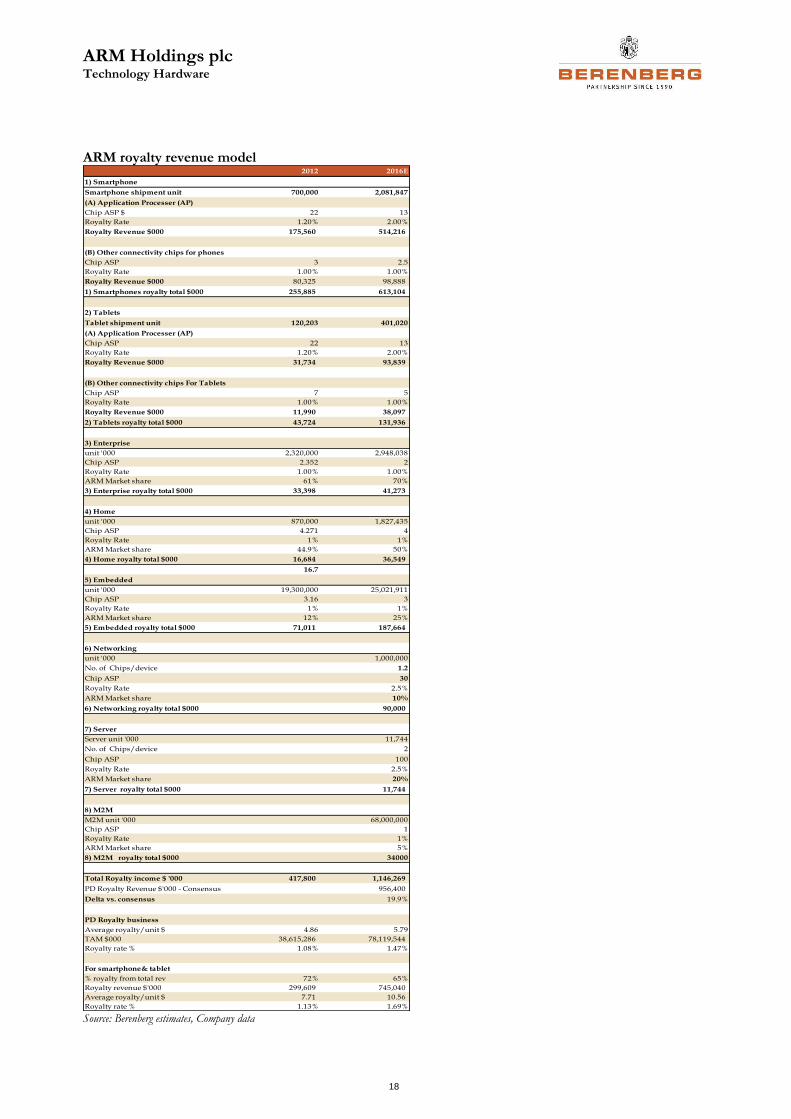
ARM royalty revenue model
Source: Berenberg estimates, Company data
2012 2016E
1) Smartphone
Smartphone shipment unit 700,000 2,081,847
(A) Application Processer (AP)
Chip ASP $ 22 13
Royalty Rate 1.20% 2.00%
Royalty Revenue $000 175,560 514,216
(B) Other connectivity chips for phones
Chip ASP 3 2.5
Royalty Rate 1.00% 1.00%
Royalty Revenue $000 80,325 98,888
1) Smartphones royalty total $000 255,885 613,104
2) Tablets
Tablet shipment unit 120,203 401,020
(A) Application Processer (AP)
Chip ASP 22 13
Royalty Rate 1.20% 2.00%
Royalty Revenue $000 31,734 93,839
(B) Other connectivity chips For Tablets
Chip ASP 7 5
Royalty Rate 1.00% 1.00%
Royalty Revenue $000 11,990 38,097
2) Tablets royalty total $000 43,724 131,936
3) Enterprise
unit '000 2,320,000 2,948,038
Chip ASP 2.352 2
Royalty Rate 1.00% 1.00%
ARM Market share 61% 70%
3) Enterprise royalty total $000 33,398 41,273
4) Home
unit '000 870,000 1,827,435
Chip ASP 4.271 4
Royalty Rate 1% 1%
ARM Market share 44.9% 50%
4) Home royalty total $000 16,684 36,549
16.7
5) Embedded
unit '000 19,300,000 25,021,911
Chip ASP 3.16 3
Royalty Rate 1% 1%
ARM Market share 12% 25%
5) Embedded royalty total $000 71,011 187,664
6) Networking
unit '000 1,000,000
No. of Chips/device 1.2
Chip ASP 30
Royalty Rate 2.5%
ARM Market share 10%
6) Networking royalty total $000 90,000
7) Server
Server unit '000 11,744
No. of Chips/device 2
Chip ASP 100
Royalty Rate 2.5%
ARM Market share 20%
7) Server royalty total $000 11,744
8) M2M
M2M unit '000 68,000,000
Chip ASP 1
Royalty Rate 1%
ARM Market share 5%
8) M2M royalty total $000 34000
Total Royalty income $ '000 417,800 1,146,269
PD Royalty Revenue $'000 - Consensus 956,400
Delta vs. consensus 19.9%
PD Royalty business
Average royalty/unit $ 4.86 5.79
TAM $000 38,615,286 78,119,544
Royalty rate % 1.08% 1.47%
For smartphone& tablet
% royalty from total rev 72% 65%
Royalty revenue $'000 299,609 745,040
Average royalty/unit $ 7.71 10.56
Royalty rate % 1.13% 1.69%
Source: Berenberg estimates,Company data

Global Technology Technology Hardware
19
What is working
ARM
Source: Berenberg estimates
Drivers 2010 2011 2012 2013E 2014E 2015E
PD (£ '000)
Licence revenues 107,613 149,300 181,100 216,129 241,935 266,129
Royalty revenues 188,065 222,200 264,300 360,229 466,452 592,465
PIPD (£ '000)
Licence revenues 26,645 31,200 33,000 34,839 36,774 37,419
Royalty revenues 28,323 30,200 35,400 40,000 43,226 45,806
Group
Revenues (£ '000) 407,290 491,826 576,800 713,132 850,968 1,006,335
Gross margins (IFRS) 94.0% 95.1% 94.8% 94.8% 95.5% 96.0%
Gross margins (ex. special items) 94.0% 95.1% 94.8% 94.8% 95.5% 96.0%
Gross margin (ex. special items ex. SBC) 93.5% 94.4% 94.5% 94.6% 95.3% 95.8%
R&D (ex. special items) 132,765 153,663 159,800 178,283 191,468 211,330
R&D (as % of sales) 32.6% 31.2% 27.7% 25.0% 22.5% 21.0%
SG&A (ex. special items) 125,330 146,481 167,700 178,283 191,468 211,330
SG&A (as % of sales) 30.8% 29.8% 29.1% 25.0% 22.5% 21.0%
Operating margin (IFRS) 26.3% 30.3% 36.1% 44.0% 49.8% 53.4%
Operating margin (ex. special items ex. SBC) 40.3% 45.1% 45.6% 51.3% 55.9% 58.6%
Operating margin (ex. special items) 26.3% 30.3% 36.1% 44.0% 49.8% 53.4%
EPS (IFRS) (pence) 6.39 8.66 11.53 18.66 25.28 32.27
EPS (ex. special items ex SBC) (pence) 9.45 12.45 14.72 22.35 28.98 35.96
EPS (ex. special items) (pence) 7.17 9.49 12.02 19.12 25.74 32.72
Other Financials
FCF (£ '000) 170,896 181,696 136,700 227,094 298,752 399,985
Capex (£ '000) 6,036 12,112 20,200 19,968 19,572 19,020
Working capital (£ '000) 31,098 11,235 (5,500) 7,260 9,387 11,715
Working capital as % of sales 7.6% 2.3% -1.0% 1.0% 1.1% 1.2%
DSO 94.7 88.8 78.8 79.0 79.0 79.0
DSI 25.0 32.5 26.4 26.0 26.0 26.0
DPO 60.3 114.2 67.7 68.0 68.0 68.0
Total assets (£ '000) 1,084,662 1,299,790 1,466,800 1,711,275 1,973,781 2,339,465
Net debt (£ '000) -275,101 -345,891 -386,300 -607,095 -836,747 -1,167,632
Source: Berenberg Bank estimates

Global Technology Technology Hardware
20
Infineon
Source: Berenberg estimates
Drivers 2010 2011 2012 2013E 2014E 2015E
Automotive
Revenues (€ m) 1,268 1,552 1,660 1,677 1,760 1,848
Operating margin (reported) 15.6% 18.0% 13.1% 9.0% 10.0% 13.0%
Industrial Power Control (IPC)
Revenues (€ m) - - 728 626 689 723
Operating margin (reported) 0.0% 0.0% 16.2% 1.5% 12.0% 14.0%
Power management & Multimarker (PMM)
Revenues (€ m) - - 929 957 1,033 1,085
Operating margin (reported) 0.0% 0.0% 15.3% 13.0% 15.0% 15.0%
Chip card and Security
Revenues (€ m) 407 428 457 443 465 489
Operating margin (reported) 5.4% 12.6% 12.3% 9.0% 10.0% 10.0%
Group
Revenues (€ m) 3,295 3,997 3,904 3,724 3,962 4,159
Gross margins (reported) 37.5% 41.4% 36.6% 33.0% 35.5% 36.0%
R&D (€ m) 399 399 455 484 515 541
R&D (as % of sales) 12.1% 10.0% 11.7% 13.0% 13.0% 13.0%
SG&A (€ m) 386 386 475 428 436 458
SG&A (as % of sales) 11.7% 9.7% 12.2% 11.5% 11.0% 11.0%
Operating margin (reported) 10.6% 18.4% 11.7% 7.4% 10.5% 11.0%
EPS (reported) (from continuing ops) 0.27 0.60 0.38 0.23 0.31 0.34
Other Financials
FCF (€ m) 650 407 (189) 122 479 490
Capex (€ m) 322 845 832 420 410 396
Working capital (€ m) 536 365 484 466 462 494
Working capital as % of sales 16.3% 9.1% 12.4% 12.5% 11.7% 11.9%
Days receivables 76 54 50 50 50 50
Days in inventory 91 79 84 84 84 84
Days payable 118 115 92 91 91 91
Total assets (€ m) 4,993 5,873 5,898 5,933 6,346 6,792
Net debt/(cash) (inc. pension liab) (€ m) (1,331) (2,387) (1,940) (2,026) (2,461) (2,907)
Source: Berenberg Bank estimates

Global Technology Technology Hardware
21
Samsung Electronics
Source: Berenberg estimates
Drivers 2010 2011 2012 2013E 2014E 2015E
Revenue(won bn)
Semiconductor 37,640 36,993 34,910 37,008 41,514 45,032
DP 29,912 29,232 33,245 33,851 34,123 36,057
IM 40,830 55,545 106,979 134,854 154,101 157,237
Digital media 57,613 59,004 48,727 46,800 49,563 52,299
Smartphones
Units in million 24 98 218 323 420 483
ASP($) 343 304 313 257 231 204
Operating Margin in %
Semiconductor 26.8% 17.0% 12.7% 18.0% 14.0% 13.0%
DP 6.7% -2.6% 9.7% 12.0% 10.0% 10.0%
IM 10.6% 14.9% 18.3% 20.0% 15.0% 12.5%
Digital media 0.8% 2.4% 5.0% 5.0% 4.0% 4.0%
Group
Group Revenues(won bn) 154,630 165,002 201,848 245,448 259,300 270,625
Gross margins 33.6% 32.0% 37.3% 39.2% 36.0% 34.0%
R&D (won bn) 9,099 9,980 11,539 14,236 14,780 14,884
R&D (as % of sales) 5.9% 6.0% 5.7% 5.8% 5.7% 5.5%
SG&A (won bn) 26,243 27,422 34,063 37,051 44,081 46,006
SG&A (as % of sales) 17.0% 16.6% 16.9% 16.7% 17.0% 17.0%
Operating margin 11.2% 9.8% 14.7% 16.3% 13.3% 11.5%
EPS 106,577 96,386 170,448 234,787 203,535 184,100
EPS - diluted 105,755 95,645 169,147 234,787 203,535 184,100
Other Financials
FCF(won bn) 2,206 150 14,994 27,358 22,008 20,864
Capex(won bn) -21,621 -21,963 -22,972 -21,400 -21,003 -20,568
Working capital (won bn) 23,369 9,989 15,491 25,747 27,975 29,137
Working capital as % of sales(won bn) 15.1% 6.1% 7.7% 10.5% 10.8% 10.8%
Days receivables 45 48 43 42 41 40
Days in inventory 48 51 51 51 51 51
Days payable 33 32 27 28 27 27
Total assets(won bn) 134,289 155,631 181,071 230,451 253,035 273,506
Net Cash (won bn) 9,643 9,037 17,914 42,871 62,112 80,472
Source: Berenberg Bank estimates

Global Technology Technology Hardware
22
Apple
Source: Company data, Berenberg estimates
Drivers 2010 2011 2012 2013E 2014E 2015E
Mac
Units ('000)
Desktops 4,627 4,669 4,656 2,891 4,200 4,250
Portables 9,035 12,066 13,502 9,613 11,762 11,234
ASP ($)
Desktops 1,340 1,379 1,297 1,206 1,146 1,089
Portables 1,248 1,272 1,272 1,226 1,202 1,189
Revenue ($m) 17,479 21,783 23,221 22,370 20,619 19,000
iPOD
Units 50,342 42,620 35,165 27,100 20,000 17,500
ASP ($) 164 175 160 166 158 142
Revenue ($m) 8,274 7,453 5,615 4,538 3,162 2,490
iPhone
Global Smartphone shipments (units m) 281 461 603 911 1200 1400
iPhone shipments (units m) 40 72 125 139 180 220
Apple's market share 14% 16% 21% 15% 15% 16%
ASP ($) 630 651 644 606 461 384
Revenue ($m) 25,179 45,998 78,692 85,154 83,232 84,527
iPhone gross margins 52.6% 52.8% 56.1% 45.0% 41.0% 36.0%
iPAD
Units 7,458 32,394 58,310 74,500 85,000 95,000
ASP ($) 665 628 556 454 432 410
Revenue ($m) 4,958 20,358 32,424 30,232 36,689 38,955
Group
Revenues ($bn) 65.2 108.2 156.5 168.1 166.7 169.7
Gross margins 39.4% 40.5% 43.9% 37.5% 35.0% 32.5%
R&D ($bn) 1.8 2.4 3.4 4.4 3.8 3.9
R&D (as % of sales) 2.7% 2.2% 2.2% 2.6% 2.3% 2.3%
SG&A ($bn) 5.5 7.6 10.0 11.1 10.8 11.0
SG&A (as % of sales) 8.5% 7.0% 6.4% 6.6% 6.5% 6.5%
Operating margin 28.2% 31.2% 35.3% 28.3% 26.2% 23.7%
EPS (non-GAAP) 16.41 29.79 47.86 40.93 39.79 38.82
Other financials
FCF ($m) 16,590 33,269 42,561 46,839 33,521 31,292
Capex ($m) 2,005 4,260 8,295 7,649 7,502 7,468
Working capital ($m) -5,454 -8,487 -9,454 -12,146 -12,765 -13,334
Working capital as % of sales -8.4% -7.8% -6.0% -7.2% -7.7% -7.9%
Days receivable 31 18 25 26 26 26
Days in inventory 10 4 3 3 3 3
Days payable 111 83 88 86 86 84
Total assets ($m) 75,183 116,371 176,064 232,268 234,860 237,323
Net debt ($m) -51,011 -81,570 -121,251 -156,824 -157,711 -158,368
Source:Company data, Berenberg Bank

Global Technology Technology Hardware
23
Qualcomm
Source: Company data, Berenberg estimates
Drivers 2010 2011 2012 2013E 2014E 2015E
Integrated Circuits
Unit shipped(m) 399 483 590 700 880 1,050
ASP($) 17 18 21 23 21 17
Revenue($m) 6,701 8,840 12,160 15,960 18,040 18,270
Technology Licensing
Handset Sales(m) 569 726 853 992 1,150 1,300
Handset ASP($) 186 207 220 220 202 190
Market size($m) 105,976 149,919 187,276 218,240 232,300 247,000
Blended royalty rate 3.5% 3.5% 3.5% 3.3% 3.2% 3.2%
Revenue($m) 3,709 5,247 6,555 7,202 7,434 7,781
Group
Revenues ($m) (GAAP) 10,981 14,958 19,121 23,782 26,124 26,701
Gross margins (GAAP) 71.0% 68.0% 64.5% 62.5% 61.0% 60.0%
R&D ($m) 2,143 2,585 3,363 4,043 4,493 4,619
R&D (as % of sales) 19.5% 17.3% 17.6% 17.0% 17.2% 17.3%
SG&A ($m) 1,262 1,511 1,860 2,117 2,351 2,403
SG&A (as % of sales) 11.5% 10.1% 9.7% 8.9% 9.0% 9.0%
Operating margin (GAAP) 29.9% 33.0% 29.7% 30.6% 29.4% 28.4%
Operating margin (adj. Non-GAAP) 40.0% 40.6% 37.1% 36.6% 34.8% 33.7%
EPS (GAAP) 1.96 2.56 3.20 3.80 4.05 4.05
EPS (adjusted non-GAAP) 2.49 3.20 3.80 4.39 4.65 4.64
Other Financials
FCF($m) 3,689 4,308 4,714 6,230 6,547 6,757
Capex($m) 426 594 1,284 1,105 1,071 1,015
Working capital($m) -2,492 -1,113 455 563 652 673
Working capital as % of sales($m) -22.7% -7.4% 2.4% 2.4% 2.5% 2.5%
Days receivables 24 16 28 28 28 28
Days in inventory 60 44 55 55 55 55
Days payable 87 40 70 70 70 70
Total assets($m) 30,572 36,422 43,012 49,696 52,228 54,490
Net Cash ($m) 16,231 19,919 26,837 32,458 34,586 36,707
Source: Berenberg Bank estimates

Global Technology Technology Hardware
24
Imagination
Source: Berenberg estimates
Drivers FY2010 FY2011 FY2012 FY2013E FY2014E FY2015E
Royalty revenues
Revenues (£m) 24 41 64 85 101 115
Licensing revenues
Revenues (£m) 23 28 34 27 30 33
Total units & ASPs
Total units 126 245 325 501 653 766
ASPs 0.19 0.17 0.20 0.17 0.16 0.15
Group
Revenues (£m) 81 98 127 140 161 179
Gross margins 69.1% 78.8% 83.5% 84.4% 84.0% 84.0%
R&D (£m) 35 45 60 75 85 95
R&D (as % of sales) 43.7% 45.6% 46.8% 53.2% 53.0% 53.0%
SG&A (£m) 10 16 18 29 34 38
SG&A (as % of sales) 12.9% 16.6% 14.5% 21.0% 21.0% 21.0%
Operating margin (reported) 12.5% 16.6% 22.2% 10.2% 10.0% 10.0%
EPS (reported) 5.99 7.47 7.93 4.44 5.00 5.56
EPS (adjusted) 7.44 10.44 11.93 8.32 8.87 9.44
Other Financials
FCF (£m) 8 (22) 17 22 23 29
Capex (£m) 1 12 12 12 12 12
Working capital (£m) 14 16 20 21 24 27
Working capital as % of sales 16.9% 16.5% 15.8% 15.3% 14.9% 14.9%
Days receivables 93 103 118 110 110 110
Days payable 174 309 458 440 440 440
Days in inventory 73 109 94 92 92 92
Total assets (£m) 81 175 213 234 262 290
Net debt/(cash) (£m) (28.9) (43.8) (60.7) (80.0) (100.2) (125.3)
Source: Berenberg Bank Estimates

Global Technology Technology Hardware
25
HTC
Source: Berenberg estimates
Drivers 2010 2011 2012 2013E 2014E 2015E
Global smartphone market (m units) 281 461 603 911 1,200 1,400
HTC market share 8.8% 9.9% 5.5% 3.5% 2.8% 2.5%
Handsets
Units shipped (m) 24.6 45.5 33.0 32.0 33.6 35.3
ASP (NT$) 11,003 10,000 8,485 7,976 7,737 7,350
Revenues (NT$ m) 270,680 455,000 280,020 255,322 260,046 259,396
Group
Revenues (NT$ m) 278,761 465,795 289,020 261,322 266,046 265,396
Gross margins 30.1% 28.3% 25.2% 22.0% 21.0% 21.0%
R&D (NT$ m) 12,940 15,961 15,490 15,679 13,302 12,474
R&D (as % of sales) 4.6% 3.4% 5.4% 6.0% 5.0% 4.7%
SG&A (NT$ m) 26,796 47,049 38,615 33,972 31,925 31,847
SG&A (as % of sales) 9.6% 10.1% 13.4% 13.0% 12.0% 12.0%
Operating margin 15.8% 14.8% 6.5% 3.0% 4.0% 4.3%
EPS 47.89 73.76 20.24 8.86 11.79 12.60
Other financials
FCF (NT$ m) 41,057 80,096 16,525 7,781 9,440 11,232
Capex (NT$ m) 4,991 8,411 6,772 6,165 5,587 5,308
Working capital (NT$ m) 24,895 15,127 (1,955) (3,918) (4,598) (4,587)
Working capital as % of sales 8.9% 3.2% -0.7% -1.5% -1.7% -1.7%
Days receivables 82 50 60 60 60 60
Days in inventory 49 31 40 40 40 40
Days payable 120 84 124 124 124 124
Total assets (NT$ m) 190,382 254,592 206,603 201,277 207,766 214,302
Net cash/(debt) (NT$ m) 75,355 90,656 55,400 58,907 61,484 65,853

Global Technology Technology Hardware
26
Foxconn International
Source: Berenberg estimates
Market share (of COGS in %) 2010 2011 2012 2013E 2014E 2015E
Nokia
FIH market share of COGS (in %) 15.6% 14.0% 12.0% 12.0% 12.0% 12.0%
Motorola
FIH market share of COGS (in %) 30.0% 27.0% 25.0% 25.0% 25.0% 25.0%
Sony Ericsson
FIH market share of COGS (in %) 20.2% 16.0% 16.0% 16.0% 16.0% 16.0%
Group
Revenues (USDm) 6,626 6,354 5,240 5,135 5,032 4,932
Gross margins 4.3% 5.3% 0.0% 4.5% 4.3% 4.0%
R&D (USDm) 220 194 173 149 146 143
R&D (as % of sales) 3.3% 3.1% 3.3% 2.9% 2.9% 2.9%
SG&A (USDm) 279 275 236 211 206 202
SG&A (as % of sales) 4.2% 4.3% 4.5% 4.1% 4.1% 4.1%
Operating margin (reported) -3.3% -2.1% -7.8% -2.5% -2.7% -3.0%
Operating margin (adj.)
EPS (basic) -0.03 -0.01 -0.04 -0.01 -0.01 -0.02
EPS (diluted) -0.03 -0.01 -0.04 -0.01 -0.01 -0.02
Other Financials
FCF (USDm) (360) 310 560 232 233 199
Capex (USDm) 254 178 42 42 41 39
Working capital (USDm) 995 805 277 309 301 293
Working capital as % of sales 15.0% 12.7% 5.3% 6.0% 6.0% 5.9%
Days receivables 91 81 79 79 79 79
Days payable 81 74 84 84 84 84
Days in inventory 43 37 24 24 24 24
Total assets (USDm) 6,017 5,612 5,088 4,758 4,919 5,073
Net debt (USDm) (762.1) (1,439.0) (2,142.2) (2,030.5) (2,360.5) (2,655.5)
Source: Berenberg Bank estimates

Global Technology Technology Hardware
27
Hon Hai
Source: Berenberg estimates
Market share (of COGS in %) 2010 2011 2012 2013E 2014E 2015E
Apple
53.1% 56.0% 60.0% 58.0% 57.0% 57.0%
HP
15.1% 15.5% 15.5% 15.5% 15.5% 15.5%
Sony
77.7% 78.0% 78.0% 78.0% 78.0% 78.0%
Group
Revenues (NT$m) 2,997,205 3,452,681 3,905,395 3,932,654 3,847,106 3,883,611
Gross margins 8.1% 7.7% 8.4% 8.2% 8.1% 8.0%
R&D (NT$m) 38,791 40,847 45,627 47,192 46,165 46,603
R&D (as % of sales) 1.3% 1.2% 1.2% 1.2% 1.2% 1.2%
SG&A (NT$m) 119,265 142,691 175,552 165,171 161,578 163,112
SG&A (as % of sales) 4.0% 4.1% 4.5% 4.2% 4.2% 4.2%
Operating margin (reported) 2.9% 2.4% 2.8% 2.8% 2.7% 2.6%
EPS (basic) 8.01 7.72 8.03 7.32 6.91 6.72
EPS (diluted) 7.75 7.44 7.79 7.10 6.70 6.52
Other Financials
FCF (NT$m) (10,260) 14,036 109,661 95,165 89,570 84,760
Capex (NT$m) 72,716 87,170 70,144 66,855 63,477 62,138
Working capital (NT$m) 234,889 308,077 344,560 347,808 339,934 340,949
Working capital as % of sales 7.8% 8.9% 8.8% 8.8% 8.8% 8.8%
Days receivables 49 50 59 59 59 59
Days payable 57 63 65 65 65 65
Days in inventory 34 44 36 36 36 36
Total assets (NT$m) 1,380,532 1,730,311 2,044,404 2,124,651 2,182,254 2,257,591
Net debt /(cash) (NT$m) (12,064) (15,671) (115,736) (200,281) (279,233) (353,376)
Source: Berenberg Bank estimates
Hon Hai market share of COGS
(in %)
Hon Hai market share of COGS
(in %)
Hon Hai market share of COGS
(in %)

Global Technology Technology Hardware
28
Juniper
Source: Berenberg estimates
Drivers 2010 2011 2012 2013E 2014E 2015E
Product
Revenues ($'000) 3,258,700 3,478,300 3,262,100 3,353,317 3,400,903 3,395,143
Gross Margin 69.6% 67.6% 65.5% 65.0% 62.0% 59.0%
Service
Revenues ($000) 834,600 902,100 1,038,200 1,117,772 1,133,634 1,192,888
Gross Margin 59.7% 54.8% 58.0% 62.0% 61.0% 61.0%
Group
Revenues ($'000) 4,093,300 4,380,400 4,300,300 4,471,089 4,534,537 4,588,031
Gross margins 68% 65% 64% 64% 62% 60%
R&D ($'000) 837,188 925,711 992,021 983,640 952,253 917,606
R&D (as % of sales) 20.5% 21.1% 23.1% 22.0% 21.0% 20.0%
SG&A ($'000) 945,970 1,071,465 1,132,267 1,108,830 1,065,616 1,055,247
SG&A (as % of sales) 23.1% 24.5% 26.3% 24.8% 23.5% 23.0%
Operating margin (GAAP) 21.1% 15.2% 7.2% 12.1% 12.0% 11.3%
Operating margin (adjusted) 24.0% 19.4% 14.3% 17.5% 17.3% 16.5%
EPS (GAAP) 1.15 0.66 0.25 0.74 0.74 0.71
EPS (adjusted) 1.32 1.07 0.79 1.06 1.07 1.04
Other Financials
FCF($'000) 492,717 918,275 293,700 467,524 502,439 564,115
Capex($'000) 185,291 266,314 348,700 344,451 340,090 339,514
Working capital($'000) 705,542 733,095 843,200 789,234 775,510 803,831
Working capital as % of sales($'000) 17.2% 16.7% 19.6% 17.7% 17.1% 17.5%
Days receivables 53 48 37 37 37 37
Days payable 79 75 46 46 46 46
Total assets($'000) 8,467,851 9,983,820 9,832,100 10,862,863 11,422,403 12,084,351
Net Cash ($'000) 2,123,491 2,378,648 1,668,600 2,540,544 3,042,980 3,607,095
Source: Berenberg Bank estimates
Global Technology Technology Hardware
29
Motorola Solutions
Source: Berenberg estimates
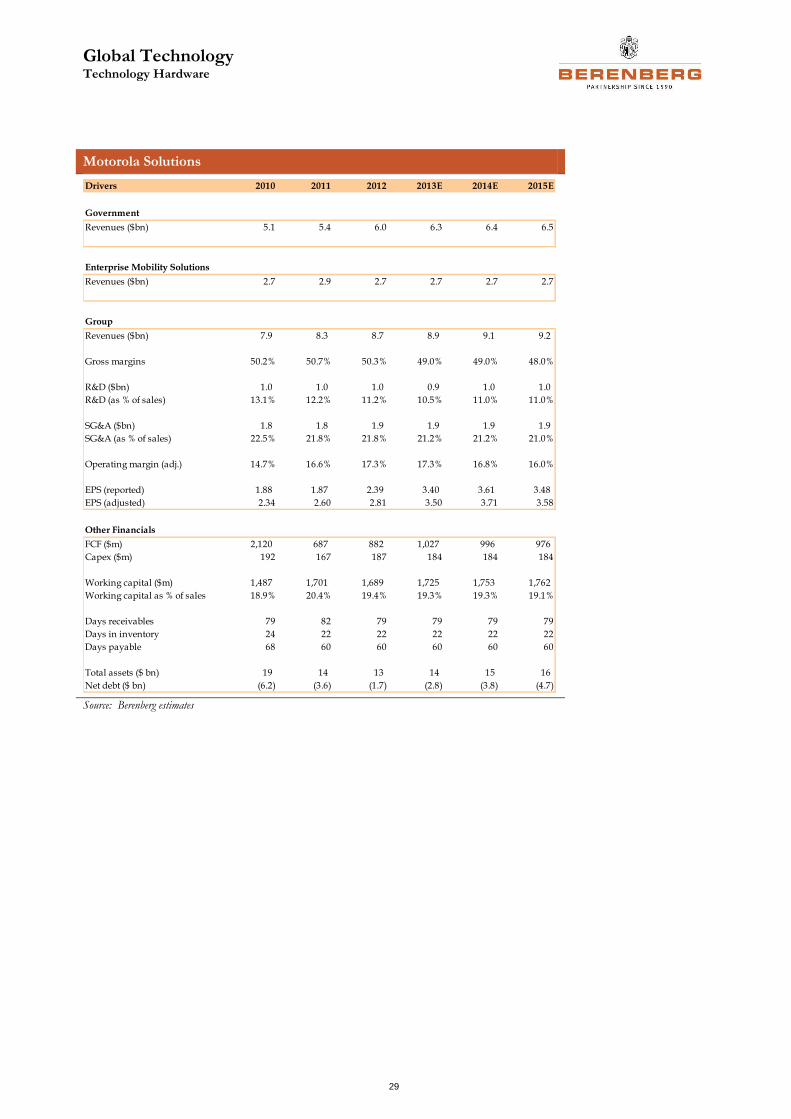
Drivers 2010 2011 2012 2013E 2014E 2015E
Government
Revenues ($bn) 5.1 5.4 6.0 6.3 6.4 6.5
Enterprise Mobility Solutions
Revenues ($bn) 2.7 2.9 2.7 2.7 2.7 2.7
Group
Revenues ($bn) 7.9 8.3 8.7 8.9 9.1 9.2
Gross margins 50.2% 50.7% 50.3% 49.0% 49.0% 48.0%
R&D ($bn) 1.0 1.0 1.0 0.9 1.0 1.0
R&D (as % of sales) 13.1% 12.2% 11.2% 10.5% 11.0% 11.0%
SG&A ($bn) 1.8 1.8 1.9 1.9 1.9 1.9
SG&A (as % of sales) 22.5% 21.8% 21.8% 21.2% 21.2% 21.0%
Operating margin (adj.) 14.7% 16.6% 17.3% 17.3% 16.8% 16.0%
EPS (reported) 1.88 1.87 2.39 3.40 3.61 3.48
EPS (adjusted) 2.34 2.60 2.81 3.50 3.71 3.58
Other Financials
FCF ($m) 2,120 687 882 1,027 996 976
Capex ($m) 192 167 187 184 184 184
Working capital ($m) 1,487 1,701 1,689 1,725 1,753 1,762
Working capital as % of sales 18.9% 20.4% 19.4% 19.3% 19.3% 19.1%
Days receivables 79 82 79 79 79 79
Days in inventory 24 22 22 22 22 22
Days payable 68 60 60 60 60 60
Total assets ($ bn) 19 14 13 14 15 16
Net debt ($ bn) (6.2) (3.6) (1.7) (2.8) (3.8) (4.7)
Source: Berenberg Bank estimates

Global Technology Technology Hardware
30
Foxconn Technology
Source: Berenberg estimates
Drivers 2010 2011 2012 2013E 2014E 2015E
Apple
Apple revenues 22,234 30,161 34,971 34,664 37,272 40,120
% of total revenues 16.3% 22.9% 26.2% 25.7% 26.2% 26.9%
Nintendo
Nintendo revenues 90,330 76,186 59,400 60,200 57,190 51,170
% of total revenues 66.1% 57.9% 44.5% 44.6% 40.1% 34.4%
Group
Revenues (NT$m) 136,724 131,498 133,617 134,895 142,499 148,935
Gross margins 10.8% 9.0% 10.5% 10.4% 10.0% 10.0%
R&D (NT$m) 1,290 1,132 1,121 1,079 1,140 1,191
R&D (as % of sales) 0.9% 0.9% 0.8% 0.8% 0.8% 0.8%
SG&A (NT$m) 4,070 3,612 3,758 3,777 3,705 3,872
SG&A (as % of sales) 3.0% 2.7% 2.8% 2.8% 2.6% 2.6%
Operating margin (reported) 6.9% 5.4% 6.8% 6.8% 6.6% 6.6%
EPS (basic) 6.85 6.84 6.78 6.58 6.74 7.03
EPS (diluted) 6.81 6.80 6.78 6.58 6.74 7.03
Other Financials
FCF (NT$m) 8,037 3,675 12,116 8,970 6,011 6,230
Capex (NT$m) 3,662 3,851 2,016 2,037 2,066 1,936
Working capital (NT$m) 14,872 17,932 17,176 17,352 18,231 19,054
Working capital as % of sales 10.9% 13.6% 12.9% 12.9% 12.8% 12.8%
Days receivables 74 95 104 104 104 104
Days payable 55 64 81 81 81 81
Days in inventory 16 14 17 17 17 17
Total assets (NT$m) 92,552 97,723 107,031 114,268 123,063 131,866
Net debt/(cash) (NT$m) (15,032) (23,472) (27,380) (34,989) (39,641) (44,511)
Source: Berenberg Bank estimates
Global Technology Technology Hardware
31
What is not working
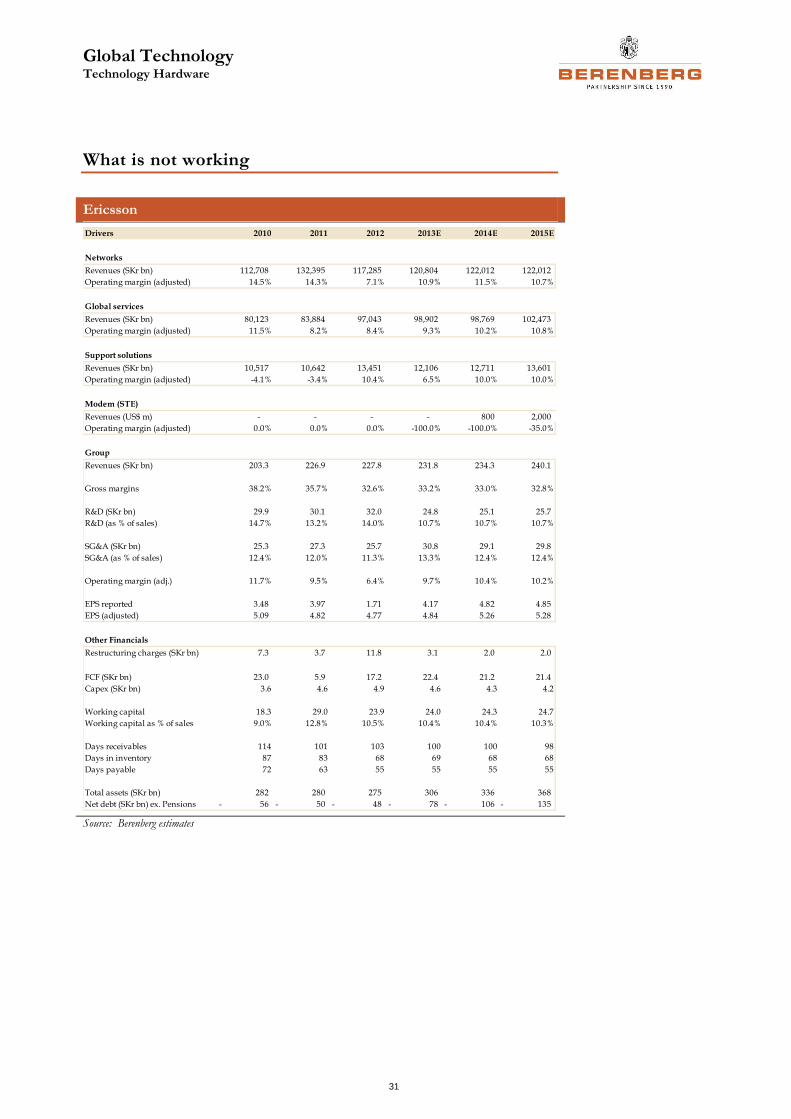
Ericsson
Source: Berenberg estimates
Drivers 2010 2011 2012 2013E 2014E 2015E
Networks
Revenues (SKr bn) 112,708 132,395 117,285 120,804 122,012 122,012
Operating margin (adjusted) 14.5% 14.3% 7.1% 10.9% 11.5% 10.7%
Global services
Revenues (SKr bn) 80,123 83,884 97,043 98,902 98,769 102,473
Operating margin (adjusted) 11.5% 8.2% 8.4% 9.3% 10.2% 10.8%
Support solutions
Revenues (SKr bn) 10,517 10,642 13,451 12,106 12,711 13,601
Operating margin (adjusted) -4.1% -3.4% 10.4% 6.5% 10.0% 10.0%
Modem (STE)
Revenues (US$ m) - - - - 800 2,000
Operating margin (adjusted) 0.0% 0.0% 0.0% -100.0% -100.0% -35.0%
Group
Revenues (SKr bn) 203.3 226.9 227.8 231.8 234.3 240.1
Gross margins 38.2% 35.7% 32.6% 33.2% 33.0% 32.8%
R&D (SKr bn) 29.9 30.1 32.0 24.8 25.1 25.7
R&D (as % of sales) 14.7% 13.2% 14.0% 10.7% 10.7% 10.7%
SG&A (SKr bn) 25.3 27.3 25.7 30.8 29.1 29.8
SG&A (as % of sales) 12.4% 12.0% 11.3% 13.3% 12.4% 12.4%
Operating margin (adj.) 11.7% 9.5% 6.4% 9.7% 10.4% 10.2%
EPS reported 3.48 3.97 1.71 4.17 4.82 4.85
EPS (adjusted) 5.09 4.82 4.77 4.84 5.26 5.28
Other Financials
Restructuring charges (SKr bn) 7.3 3.7 11.8 3.1 2.0 2.0
FCF (SKr bn) 23.0 5.9 17.2 22.4 21.2 21.4
Capex (SKr bn) 3.6 4.6 4.9 4.6 4.3 4.2
Working capital 18.3 29.0 23.9 24.0 24.3 24.7
Working capital as % of sales 9.0% 12.8% 10.5% 10.4% 10.4% 10.3%
Days receivables 114 101 103 100 100 98
Days in inventory 87 83 68 69 68 68
Days payable 72 63 55 55 55 55
Total assets (SKr bn) 282 280 275 306 336 368
Net debt (SKr bn) ex. Pensions 56- 50- 48- 78- 106- 135-
Source: Berenberg Bank estimates
Global Technology Technology Hardware
32
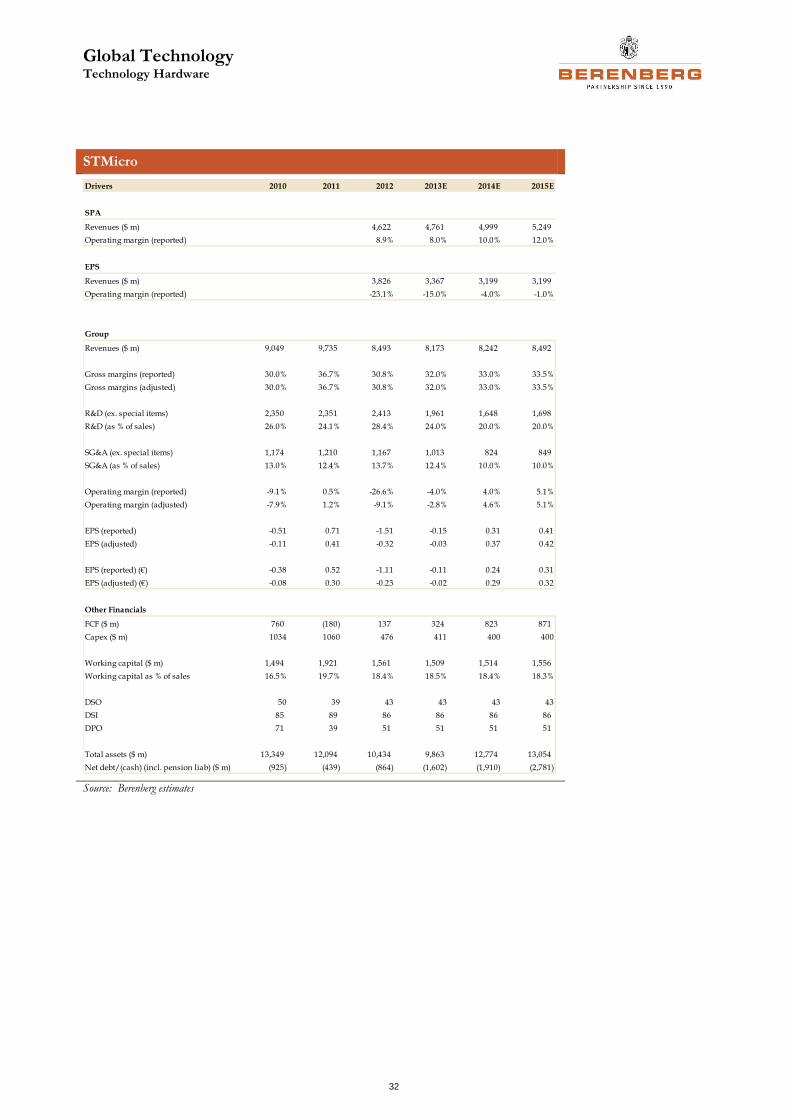
STMicro
Source: Berenberg estimates
Drivers 2010 2011 2012 2013E 2014E 2015E
SPA
Revenues ($ m) 4,622 4,761 4,999 5,249
Operating margin (reported) 8.9% 8.0% 10.0% 12.0%
EPS
Revenues ($ m) 3,826 3,367 3,199 3,199
Operating margin (reported) -23.1% -15.0% -4.0% -1.0%
Group
Revenues ($ m) 9,049 9,735 8,493 8,173 8,242 8,492
Gross margins (reported) 30.0% 36.7% 30.8% 32.0% 33.0% 33.5%
Gross margins (adjusted) 30.0% 36.7% 30.8% 32.0% 33.0% 33.5%
R&D (ex. special items) 2,350 2,351 2,413 1,961 1,648 1,698
R&D (as % of sales) 26.0% 24.1% 28.4% 24.0% 20.0% 20.0%
SG&A (ex. special items) 1,174 1,210 1,167 1,013 824 849
SG&A (as % of sales) 13.0% 12.4% 13.7% 12.4% 10.0% 10.0%
Operating margin (reported) -9.1% 0.5% -26.6% -4.0% 4.0% 5.1%
Operating margin (adjusted) -7.9% 1.2% -9.1% -2.8% 4.6% 5.1%
EPS (reported) -0.51 0.71 -1.51 -0.15 0.31 0.41
EPS (adjusted) -0.11 0.41 -0.32 -0.03 0.37 0.42
EPS (reported) (€) -0.38 0.52 -1.11 -0.11 0.24 0.31
EPS (adjusted) (€) -0.08 0.30 -0.23 -0.02 0.29 0.32
Other Financials
FCF ($ m) 760 (180) 137 324 823 871
Capex ($ m) 1034 1060 476 411 400 400
Working capital ($ m) 1,494 1,921 1,561 1,509 1,514 1,556
Working capital as % of sales 16.5% 19.7% 18.4% 18.5% 18.4% 18.3%
DSO 50 39 43 43 43 43
DSI 85 89 86 86 86 86
DPO 71 39 51 51 51 51
Total assets ($ m) 13,349 12,094 10,434 9,863 12,774 13,054
Net debt/(cash) (incl. pension liab) ($ m) (925) (439) (864) (1,602) (1,910) (2,781)
Source: Berenberg Bank estimates

Global Technology Technology Hardware
33
BlackBerry
Source: Berenberg estimates
Drivers 2011 2012 2013 2014E 2015E
CY 2010 2011 2012 2013E 2014E
Global smartphone market 281 461 603 911 1,200
(m units)
market share 18.6% 10.6% 4.7% 3.3% 2.3%
Hardware
Units shipped (m) 52.3 49.0 28.1 30.3 27.9
ASP ($) 305 282 237 268 255
Revenues ($m) 15,956 13,794 6,663 8,131 7,107
Services
Subscriber base 60,900 77,850 76,000 69,000 64,000
Net additions 19,600 16,950 -1,850 -7,000 -5,000
ARPU ($) 5.0 4.7 4.4 3.8 3.3
Revenues ($m) 3,197 4,086 4,086 3,340 2,633
Group
Revenues ($m) 19,907 18,421 11,072 12,287 10,579
Gross margins 44.3% 35.6% 31.0% 36.0% 27.0%
R&D ($m) 1,351 1,559 1,509 1,474 1,164
R&D (as % of sales) 6.8% 8.5% 13.6% 12.0% 11.0%
SG&A ($m) 2,400 2,604 2,111 2,457 1,587
SG&A (as % of sales) 12.1% 14.1% 19.1% 20.0% 15.0%
Operating margin 23.3% 8.0% -11.2% -2.0% -4.0%
EPS (reported) 6.36 2.22 -1.23 -0.35 -0.61
EPS (adjusted) 6.36 1.54 -1.87 -0.35 -0.61
Other financials
FCF ($m) 2,970 2,010 1,890 949 483
Capex ($m) 1,039 902 413 405 391
Working capital ($m) 3,741 3,345 1,892 2,174 1,807
Working capital as % of sales 18.8% 18.2% 17.1% 17.7% 17.1%
Days receivables 60 70 78 78 78
Days in inventory 20 32 29 29 28
Days payable 27 23 51 50 50
Total assets ($m) 12,875 13,731 13,165 12,936 12,367
Net cash ($m) 2,121 1,774 2,654 3,603 4,086

Global Technology Technology Hardware
34
Nokia
Source: Berenberg estimates
Drivers 2011 2012 2013E 2014E 2015E
Global handset market size 1,511 1,800 1,900 2,200 2,400
(m units)
Global smartphone market (m units) 461 603 911 1,200 1,400
Nokia Device and Services
Nokia's market share 27.6% 18.5% 14.4% 11.2% 9.4%
Units shipped (m) 417 333 273 245 226
ASP (€) 56.9 47.2 49.0 49.0 46.6
Revenues (€m) 23,943 15,686 13,374 12,036 10,520
Operating margin (adjusted) 6.6% -4.5% 0.5% 1.0% 1.0%
NSN
Revenues (€m) 14,041 13,779 13,300 13,300 13,300
Operating margin (adjusted) 1.6% 5.6% 6.0% 6.0% 3.0%
Location & Commerce
Revenues (€m) 1,050 1,104 850 900 950
Operating margin (adjusted) 19.4% 13.9% -1.0% 2.0% 10.0%
Group
Revenues (€ bn) 38.7 30.2 27.5 26.2 24.8
Gross margins (adjusted) 29.4% 28.0% 29.0% 27.0% 25.0%
R&D (adjusted) (€bn) 5.2 4.4 4.0 3.1 2.7
R&D (as % of sales) 13.4% 14.6% 14.5% 12.0% 11.0%
SG&A (adjusted) (€ bn) 4.4 3.9 3.3 2.9 2.7
SG&A (as % of sales) 11.5% 12.8% 12.0% 11.0% 11.0%
Operating margin (IFRS) -2.7% -7.6% 0.3% 1.7% 0.6%
Operating margin (adjusted) 4.7% 0.4% 2.5% 4.0% 3.0%
EPS (IFRS) 0.15- 1.14- 0.07- 0.00- 0.05-
EPS (adjusted) 0.29 0.17- 0.01- 0.08 0.05
Other Financials
FCF (€bn) 0.54 (0.82) (0.75) 0.51 0.27
Capex (€m) 597 461 330 315 297
Working capital (€bn) 4.0 2.7 2.8 2.7 2.5
Working capital as % of sales 10.3% 8.9% 10.4% 10.2% 9.9%
Days receivable 67 66 66 66 66
Days in inventory 31 26 31 31 31
Days payable 73 73 72 72 72
Total assets (€bn) 36.2 29.9 29.4 28.1 27.4
Net debt (€bn) (5.8) (3.8) (3.7) (3.6) (3.5)
Source: Berenberg Bank estimates

Global Technology Technology Hardware
35
Alcatel-Lucent
Source: Berenberg estimates
Drivers 2010 2011 2012 2013E 2014E 2015E
Network and platforms
Revenues (€mn) 11,924 11,315 10,933 10,667
Operating margin (ex. restructuring) -0.7% -1.1% -0.4% 0.4%
Focused business
Revenues (€mn) 1,236 1,298 1,363 1,431
Managed services
Revenues (€mn) 1,000 1,050 1,103 1,158
Group
Revenues (€bn) 16.00 15.33 14.45 13.66 13.40 13.26
Gross Margins (pro-forma) 34.8% 36.3% 30.1% 29.3% 28.2% 27.8%
R&D (pro-forma) (€bn) 2.5 2.4 2.3 2.3 2.0 1.9
R&D (as % of sales) 15.6% 15.4% 16.1% 16.5% 15.0% 14.0%
SG&A (pro-forma) (€bn) 2.8 2.7 2.3 2.0 1.8 1.7
SG&A (as % of sales) 17.4% 17.4% 15.7% 14.5% 13.5% 13.0%
Operating margin (pro-forma ex. restructuring) 1.8% 3.4% -1.8% -1.7% -0.3% 0.8%
EPS (pro-forma) excl restruct. pension & discont. ops. -0.07 0.49 -0.48 -0.26 -0.03 0.03
Other Financials
Free cash flow (€m) 818- 477- 679- 797- 633- 833-
Capex (€m) 692 570 582 492 472 456
Working capital (€m) 1,634 1,490 1,072 991 961 942
as % of sales 10.2% 9.7% 7.4% 7.2% 7.2% 7.1%
Days receivable 84 81 72 72 72 72
Days in inventory 80 74 70 68 70 70
Days payable 151 145 135 133 134 134
Total assets (€m) 24,876 24,203 21,354 22,477 21,803 20,916
Net debt -311 146 -118 865 1,497 2,330
Source: Berenberg Bank estimates

Global Technology Technology Hardware
36
ZTE
Source: Berenberg estimates
Drivers 2010 2011 2012 2013E 2014E 2015E
Networks
Revenues (CNY '000) 41,990 46,522 41,603 45,763 48,966 52,394
YoY growth 5.0% 10.8% -10.6% 10.0% 7.0% 7.0%
Handsets
Revenues (CNY '000) 17,927 26,934 25,839 32,299 40,373 47,640
YoY growth 37.1% 50.2% -4.1% 25.0% 25.0% 18.0%
Others
Revenues (CNY '000) 10,346 12,799 16,778 18,120 19,026 19,977
YoY growth 24.5% 23.7% 31.1% 8.0% 5.0% 5.0%
Group
Revenues (CNY '000) 70,263 86,254 84,219 96,182 108,366 120,012
Gross margins 30.8% 30.3% 22.2% 24.0% 23.0% 23.0%
R&D 7,092 8,493 8,829 9,522 10,511 11,641
R&D (as % of sales) 10.1% 9.8% 10.5% 9.9% 9.7% 9.7%
SG&A 11,414 13,385 13,790 13,465 14,088 14,401
SG&A (as % of sales) 16.2% 15.5% 16.4% 14.0% 13.0% 12.0%
Operating margin (reported) 7.2% 5.7% -0.2% 0.6% 0.7% 1.7%
Operating margin (adjusted) 3.4% 3.3% -5.5% 0.1% 0.3% 1.3%
EPS (reported) CNY 1.17 0.61 -0.84 -0.16 -0.10 0.21
EPS (adjusted) CNY 1.25 0.66 -0.77 -0.16 -0.10 0.21
EPS (reported) (HK$) 1.35 0.70 -0.96 -0.20 -0.13 0.26
EPS (adjusted) (HK$) 1.44 0.76 -0.88 -0.20 -0.13 0.26
Other Financials
FCF (CNY '000) (2,125) (5,877) (828) (139) 181 285
Capex (CNY '000) 3,067 4,065 2,378 2,308 2,276 2,220
Working capital (CNY '000) 19,668 15,135 8,082 9,813 10,756 11,912
Working capital as % of sales 28.0% 17.5% 9.6% 10.2% 9.9% 9.9%
Days receivables 172 139 114 114 114 114
Days in inventory 91 91 64 64 64 64
Days payable 192 198 165 165 165 165
Total assets (CNY '000) 85,509 105,368 107,446 110,355 114,684 119,441
Net debt (CNY '000) (1,530) 1,039 (1,194) (1,055) (1,236) (1,521)
Source: Berenberg Bank estimates

Global Technology Technology Hardware
37
TPK
Source: Berenberg estimates
Drivers 2010 2011 2012 2013E 2014E 2015E
SFF touch module
Revenue from SFF touch module 14,771 17,464 12,096 13,439 13,200 12,456
LFF touch module
Revenue from LFF touch module 19,305 57,314 77,625 78,408 91,351 95,386
Touch display
Revenue from touch display 25,623 68,595 83,938 115,425 127,680 134,064
Apple market share 60.0% 55.0% 45.0% 45.0% 40.0% 40.0%
Group
Revenues (NT$m) 59,699 143,372 173,659 207,272 232,231 241,906
Gross margins 16.8% 16.9% 17.1% 16.5% 15.0% 14.7%
R&D (NT$m) 1,574 3,491 4,644 5,804 6,735 7,015
R&D (as % of sales) 2.6% 2.4% 2.7% 2.8% 2.9% 2.9%
SG&A (NT$m) 2,210 4,751 4,764 6,218 6,502 6,773
SG&A (as % of sales) 3.7% 3.3% 2.7% 3.0% 2.8% 2.8%
Operating margin (reported) 10.5% 11.4% 11.6% 10.7% 9.3% 9.0%
EPS (basic) 22.69 35.81 42.42 52.70 52.10 52.52
EPS (diluted) 21.93 35.81 42.42 52.70 52.10 52.52
Other Financials
FCF (NT$m) (4,770) (5,482) 970 3,031 4,873 6,088
Capex (NT$m) 10,711 23,458 14,944 14,509 14,166 14,031
Working capital (NT$m) 1,128 (6,370) 11,677 13,964 15,206 15,748
Working capital as % of sales 1.9% -4.4% 6.7% 6.7% 6.5% 6.5%
Days receivables 73 20 63 63 63 63
Days payable 103 80 82 82 82 82
Days in inventory 22 36 36 36 36 36
Total assets (NT$m) 41,929 92,953 131,355 155,028 177,460 194,381
Net debt /(cash) (NT$m) 1,697 12,838 (2,329) (5,356) (10,229) (16,317)
Source: Berenberg Bank estimates
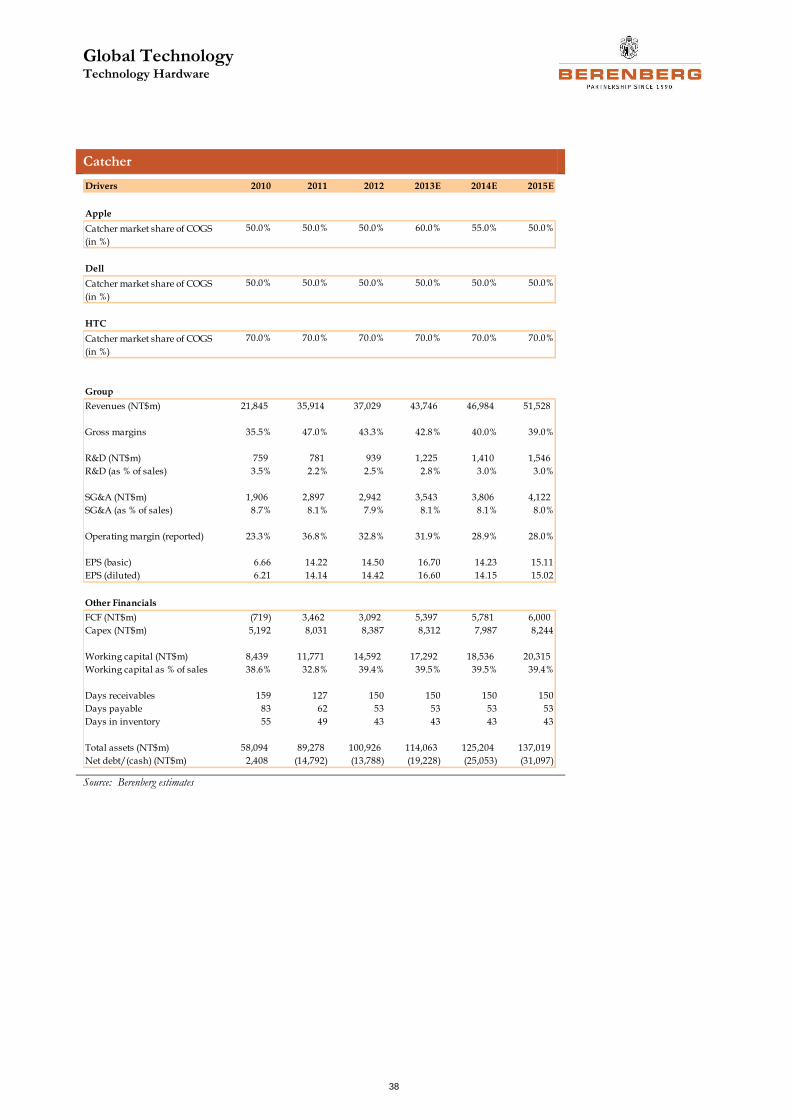
Global Technology Technology Hardware
38
Catcher
Source: Berenberg estimates
Drivers 2010 2011 2012 2013E 2014E 2015E
Apple
50.0% 50.0% 50.0% 60.0% 55.0% 50.0%
Dell
50.0% 50.0% 50.0% 50.0% 50.0% 50.0%
HTC
70.0% 70.0% 70.0% 70.0% 70.0% 70.0%
Group
Revenues (NT$m) 21,845 35,914 37,029 43,746 46,984 51,528
Gross margins 35.5% 47.0% 43.3% 42.8% 40.0% 39.0%
R&D (NT$m) 759 781 939 1,225 1,410 1,546
R&D (as % of sales) 3.5% 2.2% 2.5% 2.8% 3.0% 3.0%
SG&A (NT$m) 1,906 2,897 2,942 3,543 3,806 4,122
SG&A (as % of sales) 8.7% 8.1% 7.9% 8.1% 8.1% 8.0%
Operating margin (reported) 23.3% 36.8% 32.8% 31.9% 28.9% 28.0%
EPS (basic) 6.66 14.22 14.50 16.70 14.23 15.11
EPS (diluted) 6.21 14.14 14.42 16.60 14.15 15.02
Other Financials
FCF (NT$m) (719) 3,462 3,092 5,397 5,781 6,000
Capex (NT$m) 5,192 8,031 8,387 8,312 7,987 8,244
Working capital (NT$m) 8,439 11,771 14,592 17,292 18,536 20,315
Working capital as % of sales 38.6% 32.8% 39.4% 39.5% 39.5% 39.4%
Days receivables 159 127 150 150 150 150
Days payable 83 62 53 53 53 53
Days in inventory 55 49 43 43 43 43
Total assets (NT$m) 58,094 89,278 100,926 114,063 125,204 137,019
Net debt/(cash) (NT$m) 2,408 (14,792) (13,788) (19,228) (25,053) (31,097)
Source: Berenberg Bank estimates
Catcher market share of COGS
(in %)
Catcher market share of COGS
(in %)
Catcher market share of COGS
(in %)

Global Technology Technology Hardware
39
MediaTek
Source: Berenberg estimates
Drivers 2010 2011 2012 2013E 2014E 2015E
Group
Revenues (TW$m) (GAAP) 113,522 86,858 99,263 128,401 149,431 174,769
Gross margins (GAAP) 53.7% 45.3% 41.4% 42.5% 40.0% 38.0%
R&D (TW$m) 23,311 21,185 22,384 29,019 32,875 38,449
R&D (as % of sales) 20.5% 24.4% 22.6% 22.6% 22.0% 22.0%
SG&A (TW$m) 6,518 5,815 6,174 7,961 8,966 10,486
SG&A (as % of sales) 5.7% 6.7% 6.2% 6.2% 6.0% 6.0%
Operating margin (GAAP) 27.4% 14.2% 12.6% 13.7% 12.0% 10.0%
EPS (GAAP) 28.53 12.54 14.41 16.71 17.00 16.62
Other Financials
FCF(TW$m) 27,069 12,302 9,135 15,041 18,943 18,670
Capex(TW$m) 2,147 2,585 2,268 2,440 2,690 2,796
Working capital(TW$m) -5,236 -5,334 3,802 5,016 5,487 5,810
Working capital as % of sales(TW$m) -4.6% -6.1% 3.8% 3.9% 3.7% 3.3%
Days receivables 24 31 24 24 24 24
Days in inventory 66 72 87 87 87 87
Days payable 61 69 57 57 57 57
Total assets(TW$m) 140,293 147,746 210,243 228,622 243,970 259,824
Net Cash (TW$m) 101,474 96,359 146,402 165,138 172,337 179,019
Source: Berenberg Bank estimates
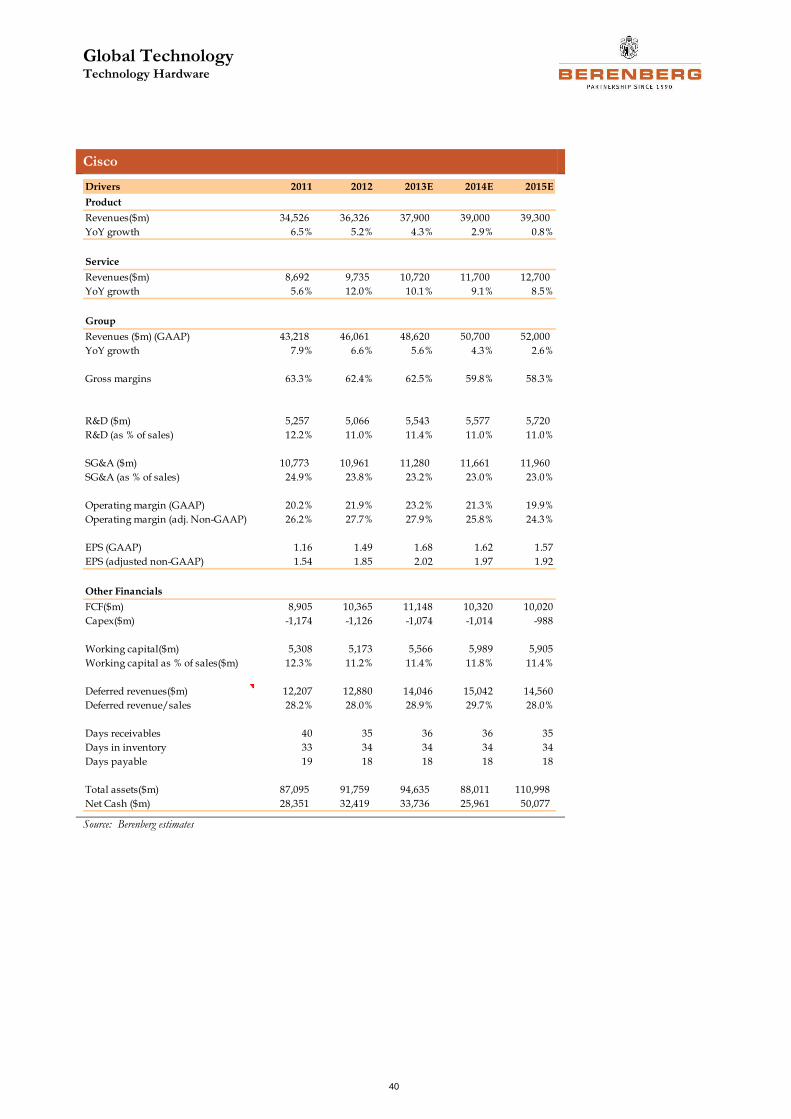
Global Technology Technology Hardware
40
Cisco
Source: Berenberg estimates
Drivers 2011 2012 2013E 2014E 2015E
Product
Revenues($m) 34,526 36,326 37,900 39,000 39,300
YoY growth 6.5% 5.2% 4.3% 2.9% 0.8%
Service
Revenues($m) 8,692 9,735 10,720 11,700 12,700
YoY growth 5.6% 12.0% 10.1% 9.1% 8.5%
Group
Revenues ($m) (GAAP) 43,218 46,061 48,620 50,700 52,000
YoY growth 7.9% 6.6% 5.6% 4.3% 2.6%
Gross margins 63.3% 62.4% 62.5% 59.8% 58.3%
R&D ($m) 5,257 5,066 5,543 5,577 5,720
R&D (as % of sales) 12.2% 11.0% 11.4% 11.0% 11.0%
SG&A ($m) 10,773 10,961 11,280 11,661 11,960
SG&A (as % of sales) 24.9% 23.8% 23.2% 23.0% 23.0%
Operating margin (GAAP) 20.2% 21.9% 23.2% 21.3% 19.9%
Operating margin (adj. Non-GAAP) 26.2% 27.7% 27.9% 25.8% 24.3%
EPS (GAAP) 1.16 1.49 1.68 1.62 1.57
EPS (adjusted non-GAAP) 1.54 1.85 2.02 1.97 1.92
Other Financials
FCF($m) 8,905 10,365 11,148 10,320 10,020
Capex($m) -1,174 -1,126 -1,074 -1,014 -988
Working capital($m) 5,308 5,173 5,566 5,989 5,905
Working capital as % of sales($m) 12.3% 11.2% 11.4% 11.8% 11.4%
Deferred revenues($m) 12,207 12,880 14,046 15,042 14,560
Deferred revenue/sales 28.2% 28.0% 28.9% 29.7% 28.0%
Days receivables 40 35 36 36 35
Days in inventory 33 34 34 34 34
Days payable 19 18 18 18 18
Total assets($m) 87,095 91,759 94,635 88,011 110,998
Net Cash ($m) 28,351 32,419 33,736 25,961 50,077
Source: Berenberg Bank estimates

Global Technology Technology Hardware
41
Price targets and valuation
On ARM, we increase our price target to £13.5 from £11.5. Our new price target is based on a DCF model assuming a 3% terminal growth rate, an 8.1% WACC and a 65% terminal EBIT margin.
On Infineon, our price target is €6.0, based on a sum-of-the-parts valuation adjusted for an €800m settlement for Qimonda.
On Cisco, we increase our price target to $16.0 from $14.0, based on an 8x P/E multiple on our FY14 EPS of $1.97.
On Ericsson, our price target is SEK60.0, based on an 11x P/E multiple on our FY14 EPS of SEK5.26.
On TPK, our price target is TWD400, based on an 8x P/E multiple on our FY14 EPS of TWD52.10.
On Qualcomm, our price target is $50, based on a sum-of-the-parts valuation.
On Samsung, our price target is KRW1,250,000, based on a 6x P/E multiple on our FY14 EPS of KRW203.54k.
On Apple, our price target is $360, based on a 9x P/E multiple on our FY14 EPS of $39.79.
On STM, our price target is €4.0, based on a sum-of-the-parts valuation adjusted for a $400m exit of the ST-Ericsson JV.
On Juniper, our price target is $14, based on a 13x P/E multiple on our 2014 EPS estimate of $1.07.
On Alcatel-Lucent, our price target is €0.7, based on a sum-of-the-parts valuation.
On ZTE, our price target is HKD8.5, based on a sum-of-the-parts valuation.
On MediaTek, our price target is TWD210, based on a 12x P/E multiple on our FY14 EPS of TWD17.0.
On Imagination, we cut our price target to £2.5 from £3.6, based on a DCF model assuming a 3% terminal growth rate, an 8.7% WACC and a 25% terminal EBIT margin.
On Catcher, our price target is TWD115, based on an 8x P/E multiple on our FY14 EPS of TWD14.23.
On Foxconn Tech, our price target is TWD70, based on a 10x P/E multiple on our FY14 EPS of TWD6.74.
On Motorola Solutions, our price target is $40, based on an 11x P/E multiple on our 2014 EPS estimate of $3.71.
On BlackBerry, our price target is $5.00, based on a sum-of-the-parts valuation.
On Hon Hai, our price target is TWD66, based on a 10x P/E multiple on our FY14 EPS of TWD6.91.
On Foxconn International, our price target is HKD2.5, based on a sum-of-the-parts valuation.
On Nokia, our price target is €1.5, based on a sum-of-the-parts valuation.
On HTC, our price target is TWD150, based on a 13x P/E multiple on our FY14 EPS of TWD11.79.

Global Technology Technology Hardware
42
Please note that the use of this research report is subject to the conditions and restrictions set forth in the “General investment-related disclosures” and the “Legal disclaimer” at the end of this document.
For analyst certification and remarks regarding foreign investors and country-specific disclosures, please refer to the respective paragraph at the end of this document.
Disclosures in respect of section 34b of the German Securities Trading Act (Wertpapierhandelsgesetz – WpHG)
Company Disclosures ARM Holdings plc no disclosures Apple Inc 5 Alcatel-Lucent no disclosures Catcher Technology Co Ltd no disclosures Cisco Systems Inc no disclosures Ericsson no disclosures Foxconn International Holdings Ltd no disclosures Foxconn Technology Co Ltd no disclosures Hon Hai Precision Ind Co Ltd no disclosures HTC Corporation no disclosures Imagination Technologies Group plc no disclosures Infineon Technologies AG 5 Juniper Networks Inc no disclosures MediaTek Inc no disclosures Motorola Solutions Inc no disclosures Nokia Oyj 5 Qualcomm Inc no disclosures BlackBerry no disclosures Samsung Electronics Co Ltd no disclosures STMicroelectronics NV no disclosures TPK Holding Co Ltd no disclosures ZTE Corp no disclosures (1) Joh. Berenberg, Gossler & Co. KG (hereinafter referred to as “the Bank”) and/or its affiliate(s) was Lead
Manager or Co-Lead Manager over the previous 12 months of a public offering of this company. (2) The Bank acts as Designated Sponsor for this company. (3) Over the previous 12 months, the Bank and/or its affiliate(s) has effected an agreement with this company
for investment banking services or received compensation or a promise to pay from this company for investment banking services.
(4) The Bank and/or its affiliate(s) holds 5% or more of the share capital of this company. (5) The Bank holds a trading position in shares of this company. (6) The Bank and/or its affiliate(s) holds a net short position of 1% or more of the share capital of this
company, calculated by methods required by German law as of the last trading day of the past month. Historical price target and rating changes for ARM Holdings plc in the last 12 months (full coverage)
Date Price target - GBP Rating Initiation of coverage
29 November 12 10.00 Buy 06 January 10
05 March 13 11.50 Buy
21 May 13 13.50 Buy
Historical price target and rating changes for Apple Inc in the last 12 months (full coverage)
Date Price target - USD Rating Initiation of coverage
04 September 12 800.00 Buy 06 January 10
05 March 13 360.00 Sell

Global Technology Technology Hardware
43
Historical price target and rating changes for Alcatel-Lucent in the last 12 months (full coverage)
Date Price target - EUR Rating Initiation of coverage
08 June 12 1.00 Sell 06 January 10
04 September 12 0.70 Sell
Historical price target and rating changes for Catcher Technology Co Ltd in the last 12 months (full coverage)
Date Price target - TWD Rating Initiation of coverage
08 June 12 180.00 Hold 09 December 11
04 September 12 150.00 Hold
05 March 13 115.00 Sell
Historical price target and rating changes for Cisco Systems Inc in the last 12 months (full coverage)
Date Price target - USD Rating Initiation of coverage
21 May 13 16.00 Sell 07 June 10
Historical price target and rating changes for Ericsson in the last 12 months (full coverage)
Date Price target - SEK Rating Initiation of coverage
08 June 12 53.00 Sell 06 January 10
29 November 12 51.00 Sell
05 March 13 60.00 Sell
Historical price target and rating changes for Foxconn International Holdings Ltd in the last 12 months (full coverage)
Date Price target - HKD Rating Initiation of coverage
08 June 12 2.50 Sell 09 December 11
04 September 12 2.00 Sell
29 November 12 3.00 Sell
05 March 13 2.50 Sell
Historical price target and rating changes for Foxconn Technology Co Ltd in the last 12 months (full coverage)
Date Price target - TWD Rating Initiation of coverage
08 June 12 85.00 Sell 09 December 11
05 March 13 70.00 Sell
Historical price target and rating changes for Hon Hai Precision Ind Co Ltd in the last 12 months (full coverage)
Date Price target - TWD Rating Initiation of coverage
08 June 12 80.00 Hold 09 December 11
05 March 13 66.00 Sell
Historical price target and rating changes for HTC Corporation in the last 12 months (full coverage)
Date Price target - TWD Rating Initiation of coverage
08 June 12 150.00 Sell 06 January 10
Historical price target and rating changes for Imagination Technologies Group plc in the last 12 months (full coverage)
Date Price target - GBp Rating Initiation of coverage
08 June 12 400.00 Sell 20 October 11
29 November 12 360.00 Sell
21 May 13 250.00 Sell

Global Technology Technology Hardware
44
Historical price target and rating changes for Infineon Technologies AG in the last 12 months (full coverage)
Date Price target - EUR Rating Initiation of coverage
08 June 12 6.50 Hold 06 January 10
04 September 12 6.00 Hold
Historical price target and rating changes for Juniper Networks Inc in the last 12 months (full coverage)
Date Price target - USD Rating Initiation of coverage
08 June 12 14.00 Sell 07 June 10
Historical price target and rating changes for MediaTek Inc in the last 12 months (full coverage)
Date Price target - TWD Rating Initiation of coverage
03 September 10
Historical price target and rating changes for Motorola Solutions Inc in the last 12 months (full coverage)
Date Price target - USD Rating Initiation of coverage
08 June 12 40.00 Sell 24 January 11
Historical price target and rating changes for Nokia Oyj in the last 12 months (full coverage)
Date Price target - EUR Rating Initiation of coverage
08 June 12 1.80 Sell 06 January 10
04 September 12 1.50 Sell
Historical price target and rating changes for Qualcomm Inc in the last 12 months (full coverage)
Date Price target - USD Rating Initiation of coverage
08 June 12 50.00 Sell 03 September 10
Historical price target and rating changes for BlackBerry in the last 12 months (full coverage)
Date Price target - USD Rating Initiation of coverage
08 June 12 7.00 Sell 06 January 10
04 September 12 5.00 Sell
Historical price target and rating changes for Samsung Electronics Co Ltd in the last 12 months (full coverage)
Date Price target - KRW Rating Initiation of coverage
08 June 12 1450000.00 Buy 08 June 12
29 November 12 1650000.00 Buy
05 March 13 1250000.00 Sell
Historical price target and rating changes for STMicroelectronics NV in the last 12 months (full coverage)
Date Price target - EUR Rating Initiation of coverage
08 June 12 3.50 Sell 06 January 10
05 March 13 4.00 Sell
Historical price target and rating changes for TPK Holding Co Ltd in the last 12 months (full coverage)
Date Price target - TWD Rating Initiation of coverage
08 June 12 360.00 Sell 09 December 11
04 September 12 320.00 Sell
05 March 13 400.00 Sell

Global Technology Technology Hardware
45
Historical price target and rating changes for ZTE Corp in the last 12 months (full coverage)
Date Price target - HKD Rating Initiation of coverage
08 June 12 13.00 Sell 06 January 10
04 September 12 8.50 Sell
Berenberg distribution of ratings and in proportion to investment banking services
Buy 41.78 % 53.13 % Sell 19.01 % 9.38 % Hold 39.21 % 37.50 %
Valuation basis/rating key
The recommendations for companies analysed by the Bank’s equity research department are either made on an absolute basis (“absolute rating system”) or relative to the sector (“relative rating system“), which is clearly stated in the financial analysis. For both absolute and relative rating system, the three-step rating key “Buy”, “Hold” and “Sell” is applied. For a detailed explanation of our rating system, please refer to our website at
http://www.berenberg.de/research.html?&L=1
NB: During periods of high market, sector or stock volatility, or in special situations, the rating system criteria as described on our website may be breached temporarily.
Competent supervisory authority
Bundesanstalt für Finanzdienstleistungsaufsicht -BaFin- (Federal Financial Supervisory Authority), Graurheindorfer Straße 108, 53117 Bonn and Marie-Curie-Str. 24-28, 60439 Frankfurt am Main, Germany.
General investment-related disclosures Joh. Berenberg, Gossler & Co. KG (hereinafter referred to as „the Bank“) has made every effort to carefully research all information contained in this financial analysis. The information on which the financial analysis is based has been obtained from sources which we believe to be reliable such as, for example, Thomson Reuters, Bloomberg and the relevant specialised press as well as the company which is the subject of this financial analysis. Only that part of the research note is made available to the issuer (who is the subject of this analysis) which is necessary to properly reconcile with the facts. Should this result in considerable changes a reference is made in the research note.
Opinions expressed in this financial analysis are our current opinions as of the issuing date indicated on this document. The companies analysed by the Bank are divided into two groups: those under “full coverage” (regular updates provided); and those under “screening coverage” (updates provided as and when required at irregular intervals).
The functional job title of the person/s responsible for the recommendations contained in this report is “Equity Research Analyst” unless otherwise stated on the cover.
The following internet link provides further remarks on our financial analyses: http://www.berenberg.de/research.html?&L=1&no_cache=1
Legal disclaimer This document has been prepared by Joh. Berenberg, Gossler & Co. KG (hereinafter referred to as „the Bank“). This document does not claim completeness regarding all the information on the stocks, stock markets or developments referred to in it. On no account should the document be regarded as a substitute for the recipient procuring information for himself/herself or exercising his/her own judgements.

Global Technology Technology Hardware
46
The document has been produced for information purposes for institutional clients or market professionals. Private customers, into whose possession this document comes, should discuss possible investment decisions with their customer service officer as differing views and opinions may exist with regard to the stocks referred to in this document.
This document is not a solicitation or an offer to buy or sell the mentioned stock.
The document may include certain descriptions, statements, estimates, and conclusions underlining potential market and company development. These reflect assumptions, which may turn out to be incorrect. The Bank and/or its employees accept no liability whatsoever for any direct or consequential loss or damages of any kind arising out of the use of this document or any part of its content.
The Bank and/or its employees may hold, buy or sell positions in any securities mentioned in this document, derivatives thereon or related financial products. The Bank and/or its employees may underwrite issues for any securities mentioned in this document, derivatives thereon or related financial products or seek to perform capital market or underwriting services.
Analyst certification I, Adnaan Ahmad, hereby certify that all of the views expressed in this report accurately reflect my personal views about any and all of the subject securities or issuers discussed herein.
In addition, I hereby certify that no part of my compensation was, is, or will be, directly or indirectly related to the specific recommendations or views expressed in this research report, nor is it tied to any specific investment banking transaction performed by the Bank or its affiliates.
Remarks regarding foreign investors The preparation of this document is subject to regulation by German law. The distribution of this document in other jurisdictions may be restricted by law, and persons into whose possession this document comes should inform themselves about, and observe, any such restrictions.
United Kingdom This document is meant exclusively for institutional investors and market professionals, but not for private customers. It is not for distribution to or the use of private investors or private customers.
United States of America This document has been prepared exclusively by the Bank. Although Berenberg Capital Markets LLC, an affiliate of the Bank and registered US broker-dealer, distributes this document to certain customers, Berenberg Capital Markets LLC does not provide input into its contents, nor does this document constitute research of Berenberg Capital Markets LLC. In addition, this document is meant exclusively for institutional investors and market professionals, but not for private customers. It is not for distribution to or the use of private investors or private customers.
This document is classified as objective for the purposes of FINRA rules. Please contact Berenberg Capital Markets LLC (+1 617.292.8200), if you require additional information.

Global Technology Technology Hardware
47
Third-party research disclosures
Company Disclosures ARM Holdings plc no disclosures Apple Inc no disclosures Alcatel-Lucent no disclosures Catcher Technology Co Ltd no disclosures Cisco Systems Inc no disclosures Ericsson no disclosures Foxconn International Holdings Ltd no disclosures Foxconn Technology Co Ltd no disclosures Hon Hai Precision Ind Co Ltd no disclosures HTC Corporation no disclosures Imagination Technologies Group plc no disclosures Infineon Technologies AG no disclosures Juniper Networks Inc no disclosures MediaTek Inc no disclosures Motorola Solutions Inc no disclosures Nokia Oyj no disclosures Qualcomm Inc no disclosures BlackBerry no disclosures Samsung Electronics Co Ltd no disclosures STMicroelectronics NV no disclosures TPK Holding Co Ltd no disclosures ZTE Corp no disclosures (1) Berenberg Capital Markets LLC owned 1% or more of the outstanding shares of any class of the subject
company by the end of the prior month.* (2) Over the previous 12 months, Berenberg Capital Markets LLC has managed or co-managed any public
offering for the subject company.* (3) Berenberg Capital Markets LLC is making a market in the subject securities at the time of the report. (4) Berenberg Capital Markets LLC received compensation for investment banking services in the past 12 months,
or expects to receive such compensation in the next 3 months.* (5) There is another potential conflict of interest of the analyst or Berenberg Capital Markets LLC, of which the
analyst knows or has reason to know at the time of publication of this research report.
* For disclosures regarding affiliates of Berenberg Capital Markets LLC please refer to the ‘Disclosures in respect of section 34b of the German Securities Trading Act (Wertpapierhandelsgesetz – WpHG)’ section above.
Copyright The Bank reserves all the rights in this document. No part of the document or its content may be rewritten, copied, photocopied or duplicated in any form by any means or redistributed without the Bank’s prior written consent.
© May 2013 Joh. Berenberg, Gossler & Co. KG

Global Technology Technology Hardware
48
Contacts: Investment Banking
Equity Research E-mail: [email protected]; Internet www.berenberg.de
BANKS ECONOMICS MID-CAP GENERAL
Nick Anderson +44 (0) 20 3207 7838 Dr. Holger Schmieding +44 (0) 20 3207 7889 Gunnar Cohrs +44 (0) 20 3207 7894
James Chappell +44 (0) 20 3207 7844 Dr. Christian Schulz +44 (0) 20 3207 7878 Bjoern Lippe +44 (0) 20 3207 7845
Andrew Lowe +44 (0) 20 3465 2743 Robert Wood +44 (0) 20 3207 7822 Anna Patrice +44 (0) 20 3207 7863
Eoin Mullany +44 (0) 20 3207 7854 Alexandra Schlegel +44 (0) 20 3207 7896
Eleni Papoula +44 (0) 20 3465 2741 FOOD MANUFACTURING Stanislaus von Thurn und Taxis +44 (0) 20 3465 2631
Michelle Wilson +44 (0) 20 3465 2663 Fintan Ryan +44 (0) 20 3465 2748
Andrew Steele +44 (0) 20 3207 7926 REAL ESTATE
BEVERAGES James Targett +44 (0) 20 3207 7873 Kai Klose +44 (0) 20 3207 7888
Philip Morrisey +44 (0) 20 3207 7892 Estelle Weingrod +44 (0) 20 3207 7931
Josh Puddle +44 (0) 20 3207 7881 GENERAL RETAIL & LUXURY GOODS
Bassel Choughari +44 (0) 20 3465 2675 TECHNOLOGY
BUSINESS SERVICES John Guy +44 (0) 20 3465 2674 Adnaan Ahmad +44 (0) 20 3207 7851
William Foggon +44 (0) 20 3207 7882 Sebastian Grabert +44 (0) 20 3207 7834
Simon Mezzanotte +44 (0) 20 3207 7917 HEALTHCARE Daud Khan +44 (0) 20 3465 2638
Arash Roshan Zamir +44 (0) 20 3465 2636 Scott Bardo +44 (0) 20 3207 7869 Ali Khwaja +44 (0) 20 3207 7852
Konrad Zomer +44 (0) 20 3207 7920 Alistair Campbell +44 (0) 20 3207 7876 Tammy Qiu +44 (0) 20 3465 2673
Charles Cooper +44 (0) 20 3465 2637
CAPITAL GOODS Louise Hinds +44 (0) 20 3465 2747 TELECOMMUNICATIONS
Frederik Bitter +44 (0) 20 3207 7916 Adrian Howd +44 (0) 20 3207 7874 Wassil El Hebil +44 (0) 20 3207 7862
Benjamin Glaeser +44 (0) 20 3207 7918 Tom Jones +44 (0) 20 3207 7877 Usman Ghazi +44 (0) 20 3207 7824
William Mackie +44 (0) 20 3207 7837 Stuart Gordon +44 (0) 20 3207 7858
Margaret Paxton +44 (0) 20 3207 7934 HOUSEHOLD & PERSONAL CARE Laura Janssens +44 (0) 20 3465 2639
Alexander Virgo +44 (0) 20 3207 7856 Jade Barkett +44 (0) 20 3207 7937 Paul Marsch +44 (0) 20 3207 7857
Felix Wienen +44 (0) 20 3207 7915 Seth Peterson +44 (0) 20 3207 7891 Barry Zeitoune +44 (0) 20 3207 7859
CHEMICALS INSURANCE TOBACCO
Asad Farid +44 (0) 20 3207 7932 Tom Carstairs +44 (0) 20 3207 7823 Erik Bloomquist +44 (0) 20 3207 7870
John Philipp Klein +44 (0) 20 3207 7930 Peter Eliot +44 (0) 20 3207 7880 Kate Kalashnikova +44 (0) 20 3465 2665
Jaideep Pandya +44 (0) 20 3207 7890 Kai Mueller +44 (0) 20 3465 2681
Matthew Preston +44 (0) 20 3207 7913 UTILITIES
CONSTRUCTION Sami Taipalus +44 (0) 20 3207 7866 Robert Chantry +44 (0) 20 3207 7861
Chris Moore +44 (0) 20 3465 2737 Andrew Fisher +44 (0) 20 3207 7937
Robert Muir +44 (0) 20 3207 7860 MEDIA Oliver Salvesen +44 (0) 20 3207 7818
Michael Watts +44 (0) 20 3207 7928 Robert Berg +44 (0) 20 3465 2680 Lawson Steele +44 (0) 20 3207 7887
Emma Coulby +44 (0) 20 3207 7821
DIVERSIFIED FINANCIALS Laura Janssens +44 (0) 20 3465 2639
Pras Jeyanandhan +44 (0) 20 3207 7899 Sarah Simon +44 (0) 20 3207 7830
SalesSpecialist Sales Sales E-mail: [email protected]; Internet www.berenberg.de
BANKS LONDON BENELUX
Iro Papadopoulou +44 (0) 20 3207 7924 John von Berenberg-Consbruch +44 (0) 20 3207 7805 Miel Bakker (London) +44 (0) 20 3207 7808
Matt Chawner +44 (0) 20 3207 7847 Susette Mantzel (Hamburg) +49 (0) 40 350 60 694
CONSUMER Toby Flaux +44 (0) 20 3465 2745 Alexander Wace (London) +44 (0) 20 3465 2670
Rupert Trotter +44 (0) 20 3207 7815 Sean Heath +44 (0) 20 3465 2742
David Hogg +44 (0) 20 3465 2628 SCANDINAVIA
INSURANCE Zubin Hubner +44 (0) 20 3207 7885 Ronald Bernette (London) +44 (0) 20 3207 7828
Trevor Moss +44 (0) 20 3207 7893 Ben Hutton +44 (0) 20 3207 7804 Marco Weiss (Hamburg) +49 (0) 40 350 60 719
James Matthews +44 (0) 20 3207 7807
HEALTHCARE David Mortlock +44 (0) 20 3207 7850
Frazer Hall +44 (0) 20 3207 7875 Peter Nichols +44 (0) 20 3207 7810 Sales Trading
Richard Payman +44 (0) 20 3207 7825 HAMBURG
TECHNOLOGY George Smibert +44 (0) 20 3207 7911 Paul Dontenwill +49 (0) 40 350 60 563
Jean Beaubois +44 (0) 20 3207 7835 Anita Surana +44 (0) 20 3207 7855 Christian Endras +49 (0) 40 350 60 359
Paul Walker +44 (0) 20 3465 2632 Gregor Labahn +49 (0) 40 350 60 571
UTILITIES Chris McKeand +49 (0) 40 350 60 798
Benita Barretto +44 (0) 20 3207 7829 FRANKFURT Fin Schaffer +49 (0) 40 350 60 596
Michael Brauburger +49 (0) 69 91 30 90 741 Lars Schwartau +49 (0) 40 350 60 450
INDUSTRIALS Nina Buechs +49 (0) 69 91 30 90 735 Marvin Schweden +49 (0) 40 350 60 576
Chris Armstrong +44 (0) 20 3207 7809 André Grosskurth +49 (0) 69 91 30 90 734 Tim Storm +49 (0) 40 350 60 415
Kaj Alftan +44 (0) 20 3207 7879 Boris Koegel +49 (0) 69 91 30 90 740 Philipp Wiechmann +49 (0) 40 350 60 346
Joerg Wenzel +49 (0) 69 91 30 90 743
CRM LONDON
LONDON PARIS Stewart Cook +44 (0) 20 3465 2752
Greg Swallow +44 (0) 20 3207 7833 Christophe Choquart +33 (0) 1 5844 9508 Simon Messman +44 (0) 20 3465 2754
Laura Cooper +44 (0) 20 3207 7806 Dalila Farigoule +33 (0) 1 5844 9510 Stephen O'Donohoe +44 (0) 20 3465 2753
Clémence La Clavière-Peyraud +33 (0) 1 5844 9521
CORPORATE ACCESS Olivier Thibert +33 (0) 1 5844 9512 PARIS
LONDON Sylvain Granjoux +33 (0) 1 5844 9509
Patricia Nehring +44 (0) 20 3207 7811 ZURICH
Stephan Hofer +41 (0) 44 283 2029
EVENTS Carsten Kinder +41 (0) 44 283 2024 Sovereign Wealth Funds
LONDON Gianni Lavigna +41 (0) 44 283 2038 LONDON
Natalie Meech +44 (0) 20 3207 7831 Benjamin Stillfried +41 (0) 44 283 2033 Max von Doetinchem +44 (0) 20 3207 7826
Charlotte Kilby +44 (0) 20 3207 7832
Charlotte Reeves +44 (0) 20 3465 2671
Hannah Whitehead +44 (0) 20 3207 7922
US Sales E-mail: [email protected]
BERENBERG CAPITAL MARKETS LLC
Member FINRA & SIPC Andrew Holder +1 (617) 292 8222 Kelleigh Faldi +1 (617) 292 8288
Colin Andrade +1 (617) 292 8230 Kieran O'Sullivan +1 (617) 292 8292
Cathal Carroll +1 (646) 445 7206 Emily Mouret +1 (646) 445 7204
Burr Clark +1 (617) 292 8282 Jonathan Saxon +1 (646) 445 7202
Julie Doherty +1 (617) 292 8228

49