Embed Size (px)
Citation preview

Global Staffing Industry
www.panopticanalytics.com

Agenda
Executive SummaryStaffing industry overviewStaffing industry overviewEmployment market overview by country and segmentKey industry drivers and their historical performanceAssessment of maturity of staffing industryResponse to recession and financial shocksCompetitive landscapeForecast Emerging markets for staffing industryEmerging markets for staffing industry
AppendixTypes of Agency contractsTemporary Agency legislative changes and their impacts
www.panopticanalytics.com | 2

Executive Summary
The global staffing industry includes services such as temporary and agency work, permanent recruitment and support services. This is a fragmented industry with approx. 67,500 employment agencies with more than 120,000 branches and staff estimated at 728 000 This industry generated revenue of 228 bEUR in 2006 and has grown by 19% from 191and staff estimated at 728,000. This industry generated revenue of 228 bEUR in 2006 and has grown by 19% from 191 bEUR in 2005.Overall, the industry has low entry barriers as huge investments and complex legal compliances are not required to set up a staffing agency. However, some end customer segments and countries do have specific regulatory requirements which may act as barriers to entry.Europe had the largest market share with an estimated 97 bEUR in total revenue in 2006 representing 43% of theEurope had the largest market share with an estimated 97 bEUR in total revenue in 2006 representing 43% of the global staffing industry. In 2006, within Europe, UK was the largest market accounting for 38% of the revenue, followed by France with 21%, Germany with 9% and The Netherlands with 9%.Temporary and agency work contributes approximately 90% to the revenue of the European staffing industry, whereas the balance 10% of revenue comes from permanent staffing. European workforce is shifting from long-term employment towards temporary or contract employment largely due to globalization, technological changes and shift from low to high kill d j bskilled jobs.
Legislative environment for agency employment in Denmark, Ireland, UK and Sweden is more liberal than in France, Italy, Portugal and Spain where the government has certain restrictions on the use of agency employment. Collective bargaining between temporary agency work (TAW) organizations and trade unions is present in all European countries except in UK, Ireland, Greece and Portugal. Legislative environment and collective bargaining have a strong effect on the development of agency employment. p g y p yHistorically, there has been a positive effect from lifting restrictions on agency employment in both Germany and UK with Germany showing a impressive CAGR of 17.0% from 2002 to 2006 in comparison with UK which had a CAGR of 4.4% from 2003 to 2006. Collective agreement between TAW organizations and trade unions in The Netherlands has boosted the number of agency workers leading to a CAGR of 14.8% from 2004 to 2006. Overall, lifting restrictions on TAW has benefited the industry by providing flexibility and competitiveness to tackle economic fluctuations. The number of agency employees is estimated to grow at an CAGR of 8 8% from 2007 to 2012 provided the restrictions on certain
www.panopticanalytics.com | 3
of agency employees is estimated to grow at an CAGR of 8.8% from 2007 to 2012, provided the restrictions on certain industry segments such as construction are lifted.The penetration of temporary agency workers in Germany is only 1.3% compared to 2.4% in France and 4.5% in UK indicating that Germany is one of the most promising markets in Europe.

Agenda
Executive SummaryStaffing industry overviewStaffing industry overviewEmployment market overview by country and segmentKey industry drivers and their historical performanceAssessment of maturity of staffing industryResponse to recession and financial shocksCompetitive landscapeForecast Emerging markets for staffing industryEmerging markets for staffing industry
AppendixTypes of Agency contractsTemporary Agency legislative changes and their impacts
www.panopticanalytics.com | 4
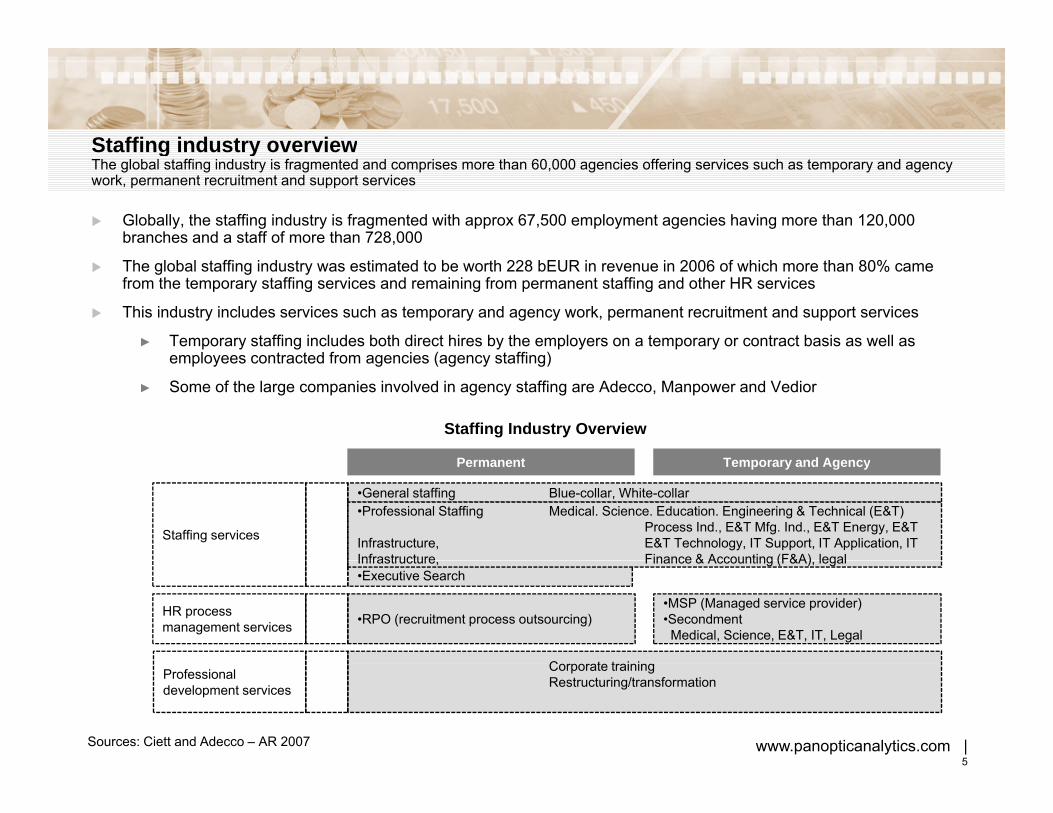
Staffing industry overviewStaffing industry overviewThe global staffing industry is fragmented and comprises more than 60,000 agencies offering services such as temporary and agency work, permanent recruitment and support services
Globally, the staffing industry is fragmented with approx 67,500 employment agencies having more than 120,000 branches and a staff of more than 728,000
The global staffing industry was estimated to be worth 228 bEUR in revenue in 2006 of which more than 80% came from the temporary staffing services and remaining from permanent staffing and other HR services
This industry includes services such as temporary and agency work, permanent recruitment and support services
► Temporary staffing includes both direct hires by the employers on a temporary or contract basis as well as employees contracted from agencies (agency staffing)employees contracted from agencies (agency staffing)
► Some of the large companies involved in agency staffing are Adecco, Manpower and Vedior
P t T d A
Staffing Industry Overview
Permanent Temporary and Agency
•General staffing Blue-collar, White-collar•Professional Staffing Medical. Science. Education. Engineering & Technical (E&T)
Process Ind., E&T Mfg. Ind., E&T Energy, E&T Infrastructure, E&T Technology, IT Support, IT Application, IT Infrastructure Finance & Accounting (F&A) legal
Staffing services
•Executive SearchInfrastructure, Finance & Accounting (F&A), legal
C t t i i
•RPO (recruitment process outsourcing)•MSP (Managed service provider)•Secondment Medical, Science, E&T, IT, Legal
HR process management services
www.panopticanalytics.com | 5
Corporate trainingRestructuring/transformationProfessional
development services
Sources: Ciett and Adecco – AR 2007

Revenue model of temporary and permanent staffingTemporary staffing contributes approx 90% to the revenue of the European staffing industry, whereas the remaining 10% of revenuecomes from permanent staffing. The higher revenue for temporary staffing is due to the fact that the entire amount received from the employer is recognized as revenue for temporary staffing companies
Revenue model for temporary staffingIn temporary staffing, the employer may work directly with th t t t t ff ith
Revenue model for permanent staffing► In permanent staffing an employee is hired on the
ll t b i b ththe contractors or temporary staff or with an agency (agency staffing)► In direct temporary staffing, the employer pays salary
directly to employees not on its payroll► In agency staffing, the agencies employ people and
provide their services to an employer
company payroll on a permanent basis by the employer and the agency helps, for a fixed fee, only in personnel search. This fixed fee which is normally 15-20% of the salary, is revenue for an agency
► The employer pays salary directly to employees – The employer pays an agreed contractual
amount to the agency– The agency then pays salary to its workers
employed on its payroll– The entire amount received from the employer is
recognized as revenue for temporary staffing
employed on their payroll► The gross profit margin for permanent staffing
varies in between 90 to 95%*
recognized as revenue for temporary staffing companies
► The gross profit margin for temporary staffing varies in between 20 to 25%*
EmployerEmployer
Employer paysa fixed fee
Employer paysthe salaryAgencyEmployer pays
the salary
Employer paysthe contract amount
A th l
www.panopticanalytics.com | 6
Agency EmployeeEmployeeEmployee
Agency pays the salary
* Based on the annual reports of Michael Page and SThree plc

Market size and growthMarket size and growthRevenue of the global staffing industry has grown at a CAGR of 6.5% between 1996 and 2006 despite the recession experienced in 2002-03 and was estimated to be worth 228 bEUR in 2006
The global staffing industry was estimated to be worth 228 bEUR in revenue in 2006 representing an increase of 19% over 191 bEUR in 2005. The industry grew at a CAGR of 6.5% during 1999 to 2006
US was the largest country with 38% share or an estimated 87 bEUR in total revenue in 2006, followed by UK (16%) and Japan (11%). US staffing industry grew at a CAGR of 3% during 1999 to 2006
Europe was the largest region with 43% share or an estimated 97 bEUR in total revenue in 2006. European staffing industry grew at a CAGR of 7.4% during 1999 to 2006
Japan was the third largest country for staffing industry with 11% share or an estimated 25 bEUR in total revenue inJapan was the third largest country for staffing industry with 11% share or an estimated 25 bEUR in total revenue in 2006. Japan is the most fragmented market with more than 30,000 agencies
Australian staffing industry had 4% or an estimated 9.12 bEUR share of the total revenue in 2006. Recruitment services accounts for 44% of the total Australian staffing industries revenue
Global Revenue growth
200
Distribution of global revenue in 2006
NL 4%RoW, 13%
100
150
200
in b
EU
R
Economic recession
US, 38%
J 11%
FR, 9%
NL, 4%
UK, 16%
DE, 5%
www.panopticanalytics.com | 7
501996 1998 1999 2002 2003 2004 2005 2006
Sources: Ciett, Eurociett and American staffing association
Japan, 11%Australia, 4%
U , 6%
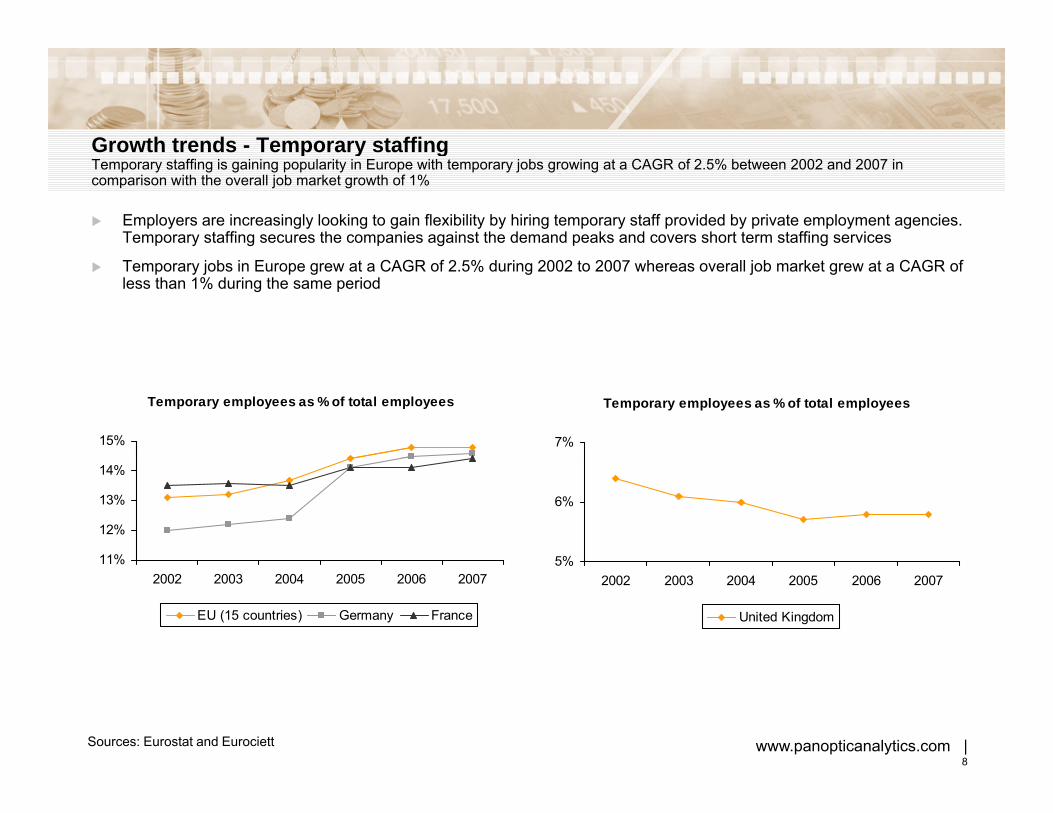
Growth trends - Temporary staffingGrowth trends Temporary staffingTemporary staffing is gaining popularity in Europe with temporary jobs growing at a CAGR of 2.5% between 2002 and 2007 in comparison with the overall job market growth of 1%
Employers are increasingly looking to gain flexibility by hiring temporary staff provided by private employment agencies. Temporary staffing secures the companies against the demand peaks and covers short term staffing services
Temporary jobs in Europe grew at a CAGR of 2.5% during 2002 to 2007 whereas overall job market grew at a CAGR of less than 1% during the same period
Temporary employees as % of total employees
7%
Temporary employees as % of total employees
15%
5%
6%
11%
12%
13%
14%
5%2002 2003 2004 2005 2006 2007
United Kingdom
11%2002 2003 2004 2005 2006 2007
EU (15 countries) Germany France
www.panopticanalytics.com | 8
Sources: Eurostat and Eurociett
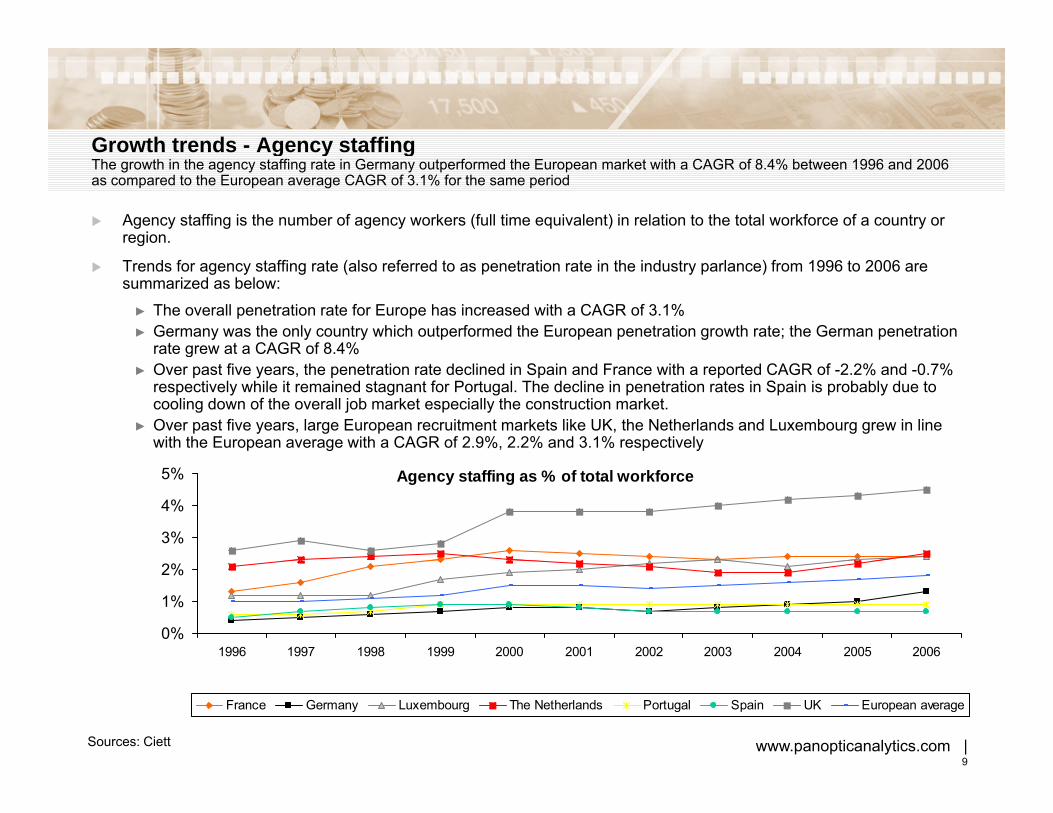
Growth trends - Agency staffingGrowth trends Agency staffingThe growth in the agency staffing rate in Germany outperformed the European market with a CAGR of 8.4% between 1996 and 2006 as compared to the European average CAGR of 3.1% for the same period
Agency staffing is the number of agency workers (full time equivalent) in relation to the total workforce of a country or region.
Trends for agency staffing rate (also referred to as penetration rate in the industry parlance) from 1996 to 2006 are summarized as below:
► The overall penetration rate for Europe has increased with a CAGR of 3.1%► Germany was the only country which outperformed the European penetration growth rate; the German penetration
rate grew at a CAGR of 8.4%g► Over past five years, the penetration rate declined in Spain and France with a reported CAGR of -2.2% and -0.7%
respectively while it remained stagnant for Portugal. The decline in penetration rates in Spain is probably due to cooling down of the overall job market especially the construction market.
► Over past five years, large European recruitment markets like UK, the Netherlands and Luxembourg grew in line with the European average with a CAGR of 2.9%, 2.2% and 3.1% respectively
Agency staffing as % of total workforce
3%
4%
5%
0%
1%
2%
1996 1997 1998 1999 2000 2001 2002 2003 2004 2005 2006
www.panopticanalytics.com | 9
Sources: Ciett
France Germany Luxembourg The Netherlands Portugal Spain UK European average

Agenda
Executive SummaryStaffing industry overviewStaffing industry overviewEmployment market overview by country and segmentKey industry drivers and their historical performanceAssessment of maturity of staffing industryResponse to recession and financial shocksCompetitive landscapeForecast Emerging markets for staffing industryEmerging markets for staffing industry
AppendixTypes of Agency contractsTemporary Agency legislative changes and their impacts
www.panopticanalytics.com | 10
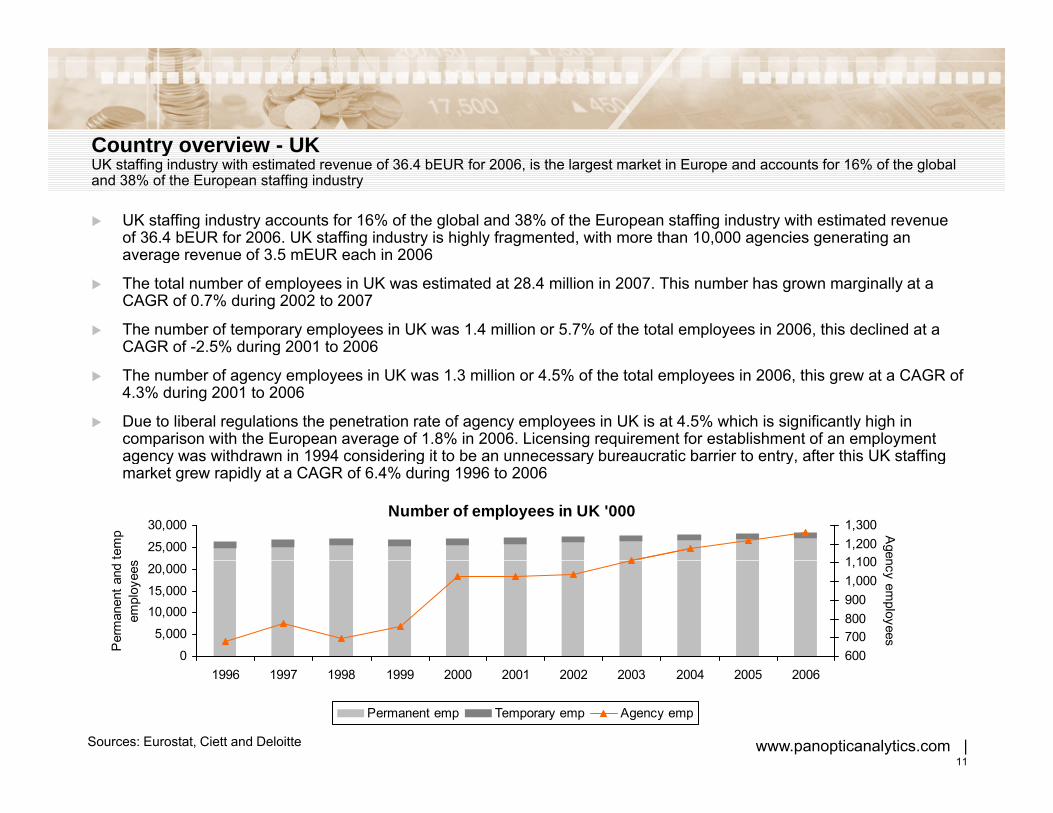
Country overview - UKCountry overview UKUK staffing industry with estimated revenue of 36.4 bEUR for 2006, is the largest market in Europe and accounts for 16% of the global and 38% of the European staffing industry
UK staffing industry accounts for 16% of the global and 38% of the European staffing industry with estimated revenue of 36.4 bEUR for 2006. UK staffing industry is highly fragmented, with more than 10,000 agencies generating an average revenue of 3 5 mEUR each in 2006average revenue of 3.5 mEUR each in 2006
The total number of employees in UK was estimated at 28.4 million in 2007. This number has grown marginally at a CAGR of 0.7% during 2002 to 2007
The number of temporary employees in UK was 1.4 million or 5.7% of the total employees in 2006, this declined at a CAGR of -2.5% during 2001 to 2006
The number of agency employees in UK was 1.3 million or 4.5% of the total employees in 2006, this grew at a CAGR of 4.3% during 2001 to 2006
Due to liberal regulations the penetration rate of agency employees in UK is at 4.5% which is significantly high in comparison with the European average of 1.8% in 2006. Licensing requirement for establishment of an employment agency was withdrawn in 1994 considering it to be an unnecessary bureaucratic barrier to entry after this UK staffingagency was withdrawn in 1994 considering it to be an unnecessary bureaucratic barrier to entry, after this UK staffing market grew rapidly at a CAGR of 6.4% during 1996 to 2006
Number of employees in UK '000
25,000
30,000
tem
p s 1 100
1,2001,300 A
gen
0
5,000
10,00015,000
20,000
Per
man
ent a
nd
empl
oyee
s
6007008009001,0001,100 ncy em
ployees
www.panopticanalytics.com | 11
Sources: Eurostat, Ciett and Deloitte
1996 1997 1998 1999 2000 2001 2002 2003 2004 2005 2006
Permanent emp Temporary emp Agency emp

Distribution of temporary agency assignments by occupation for 2005Distribution of temporary agency assignments by occupation for 2005Low skilled workers form a dominant part of the temporary agency staff in France, Germany and Spain
United Kingdom
Clerical
Germany FranceLow-skilled
lOthers
Clerical
EngineeringNursing
Others Low-skilled Othersmanual
Clerical
Managerial
g g
ManagerialFinancial
Computing or IT
HotelMetal
workersElectricians
Administration
Skilled manual
Italy
Skilled
Not specified
Spain
Low-skilled
Generic
Not specifiedCatering,
protection & sales
Administration
www.panopticanalytics.com | 12
Sources: Working Lives Research InstituteNote: This is result of a primary survey with different categories for different regions
AdministrationClericalElectriciansOthers

Sector wise total and temporary employees for UK from 2000 to 2006
Total employees in UK in '000
5000
10000
15000
20000
0
5000
2000 2001 2002 2003 2004 2005 2006
Agriculture Industry Services
Temporary employees in UK in '000
1000
1500
0
500
1000
2000 2001 2002 2003 2004* 2005 2006
*Break up for agriculture not availableSources: Eurostat and BLS
Agriculture Industry Services
www.panopticanalytics.com | 13
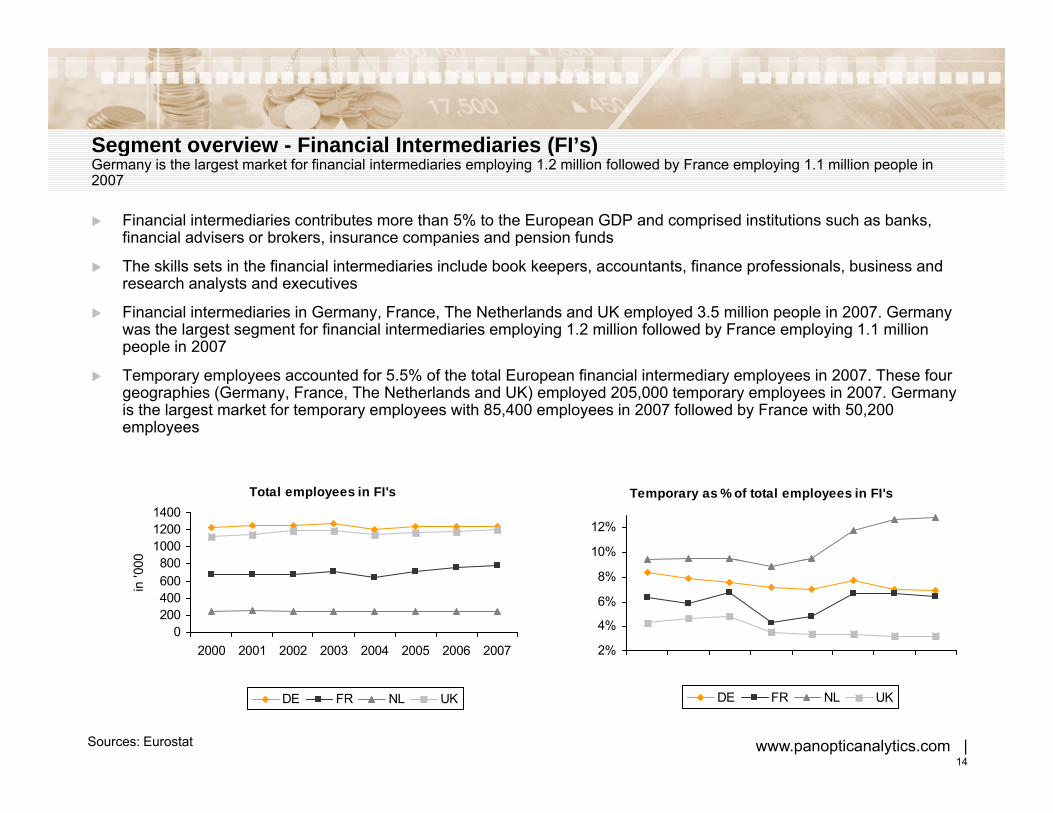
Segment overview - Financial Intermediaries (FI’s)Segment overview Financial Intermediaries (FI s)Germany is the largest market for financial intermediaries employing 1.2 million followed by France employing 1.1 million people in 2007
Financial intermediaries contributes more than 5% to the European GDP and comprised institutions such as banks, financial advisers or brokers, insurance companies and pension funds
The skills sets in the financial intermediaries include book keepers, accountants, finance professionals, business and research analysts and executives
Financial intermediaries in Germany, France, The Netherlands and UK employed 3.5 million people in 2007. Germany was the largest segment for financial intermediaries employing 1.2 million followed by France employing 1.1 million people in 2007
Temporary employees accounted for 5.5% of the total European financial intermediary employees in 2007. These four geographies (Germany, France, The Netherlands and UK) employed 205,000 temporary employees in 2007. Germany is the largest market for temporary employees with 85,400 employees in 2007 followed by France with 50,200 employees
Total employees in FI's
800100012001400
0
Temporary as % of total employees in FI's
10%
12%
0200400600800
2000 2001 2002 2003 2004 2005 2006 2007
in '0
0
2%
4%
6%
8%
www.panopticanalytics.com | 14
Sources: Eurostat
DE FR NL UK DE FR NL UK

Agenda
Executive SummaryStaffing industry overviewStaffing industry overviewEmployment market overview by country and segmentKey industry drivers and their historical performanceAssessment of maturity of staffing industryResponse to recession and financial shocksCompetitive landscapeForecast Emerging markets for staffing industryEmerging markets for staffing industry
AppendixTypes of Agency contractsTemporary Agency legislative changes and their impacts
www.panopticanalytics.com | 15

Drivers affecting the staffing industry
Some of the drivers affecting the staffing industry are:
► Industry growth rate► Industry growth rate
► Employment levels
► Regulatory environment
► Real GDP growth rate
► Changing labor force behavior
► Job Vacancies
It should be noted that the industry shows the highest correlation with the GDP growth rate. Other variables such as employment levels, industry growth rate and job vacancies are each affected by the GDP growth rate.
The other factor affecting the staffing industry is the change in regulatory environment of an industry or a geography and the change in behavior of the labor force.
www.panopticanalytics.com | 16
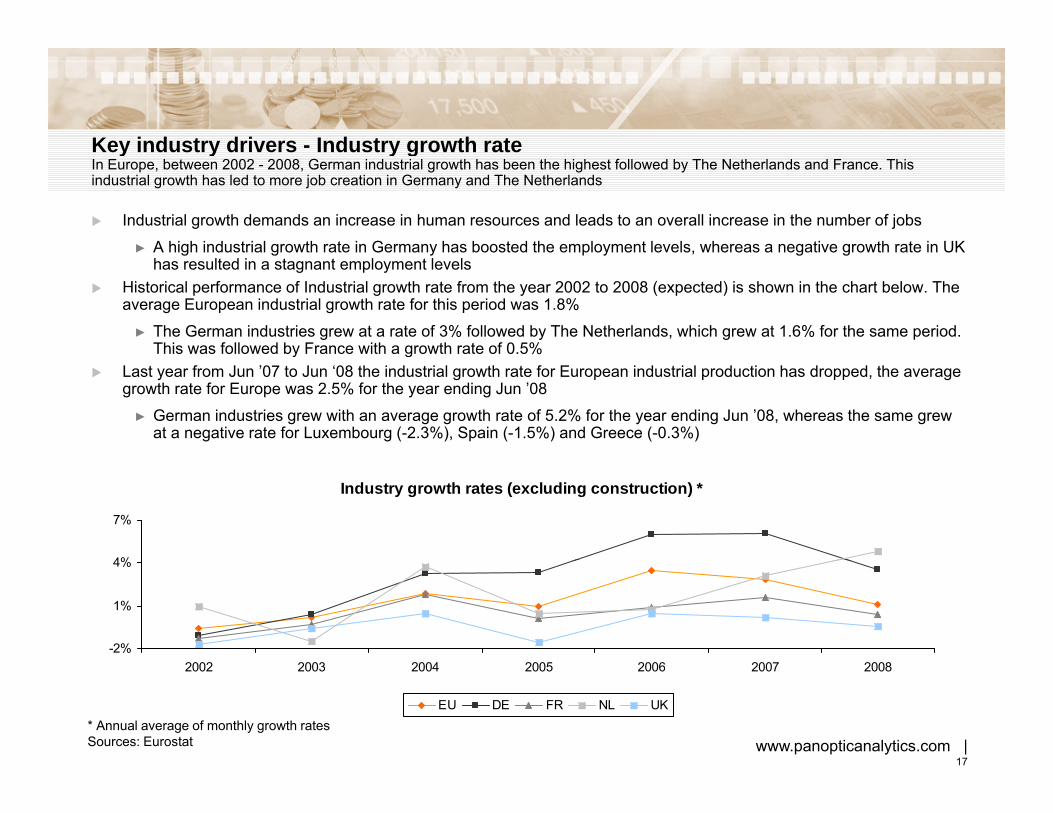
Key industry drivers - Industry growth rateKey industry drivers Industry growth rateIn Europe, between 2002 - 2008, German industrial growth has been the highest followed by The Netherlands and France. This industrial growth has led to more job creation in Germany and The Netherlands
Industrial growth demands an increase in human resources and leads to an overall increase in the number of jobs
► A high industrial growth rate in Germany has boosted the employment levels, whereas a negative growth rate in UK g g y p y , g ghas resulted in a stagnant employment levels
Historical performance of Industrial growth rate from the year 2002 to 2008 (expected) is shown in the chart below. The average European industrial growth rate for this period was 1.8%
► The German industries grew at a rate of 3% followed by The Netherlands, which grew at 1.6% for the same period. This was followed by France with a growth rate of 0.5%y g
Last year from Jun ’07 to Jun ‘08 the industrial growth rate for European industrial production has dropped, the average growth rate for Europe was 2.5% for the year ending Jun ’08
► German industries grew with an average growth rate of 5.2% for the year ending Jun ’08, whereas the same grew at a negative rate for Luxembourg (-2.3%), Spain (-1.5%) and Greece (-0.3%)
Industry growth rates (excluding construction) *
4%
7%
-2%
1%
4%
2002 2003 2004 2005 2006 2007 2008
www.panopticanalytics.com | 17
2002 2003 2004 2005 2006 2007 2008
EU DE FR NL UK
Sources: Eurostat* Annual average of monthly growth rates
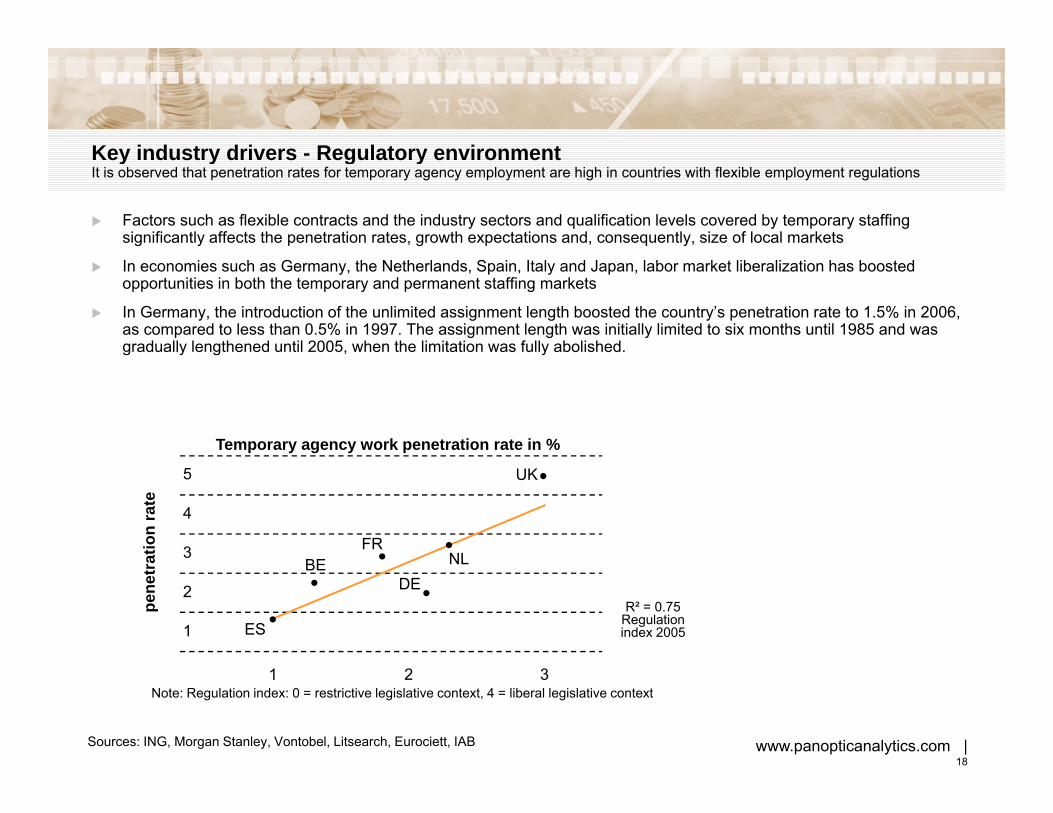
Key industry drivers Regulatory environmentKey industry drivers - Regulatory environmentIt is observed that penetration rates for temporary agency employment are high in countries with flexible employment regulations
Factors such as flexible contracts and the industry sectors and qualification levels covered by temporary staffing significantly affects the penetration rates, growth expectations and, consequently, size of local markets
In economies such as Germany, the Netherlands, Spain, Italy and Japan, labor market liberalization has boosted opportunities in both the temporary and permanent staffing markets
In Germany, the introduction of the unlimited assignment length boosted the country’s penetration rate to 1.5% in 2006, as compared to less than 0.5% in 1997. The assignment length was initially limited to six months until 1985 and was gradually lengthened until 2005, when the limitation was fully abolished.
Temporary agency work penetration rate in %
5
4
3BE
FRNL
UK
atio
n ra
te
2
1 ES
BEDE
NL
R² = 0.75Regulationindex 2005
pene
tra
Sources: ING, Morgan Stanley, Vontobel, Litsearch, Eurociett, IAB
1 2 3Note: Regulation index: 0 = restrictive legislative context, 4 = liberal legislative context
www.panopticanalytics.com | 18

Agenda
Executive SummaryStaffing industry overviewStaffing industry overviewEmployment market overview by country and segmentKey industry drivers and their historical performanceAssessment of maturity of staffing industryResponse to recession and financial shocksCompetitive landscapeForecast Emerging markets for staffing industryEmerging markets for staffing industry
AppendixTypes of Agency contractsTemporary Agency legislative changes and their impacts
www.panopticanalytics.com | 19
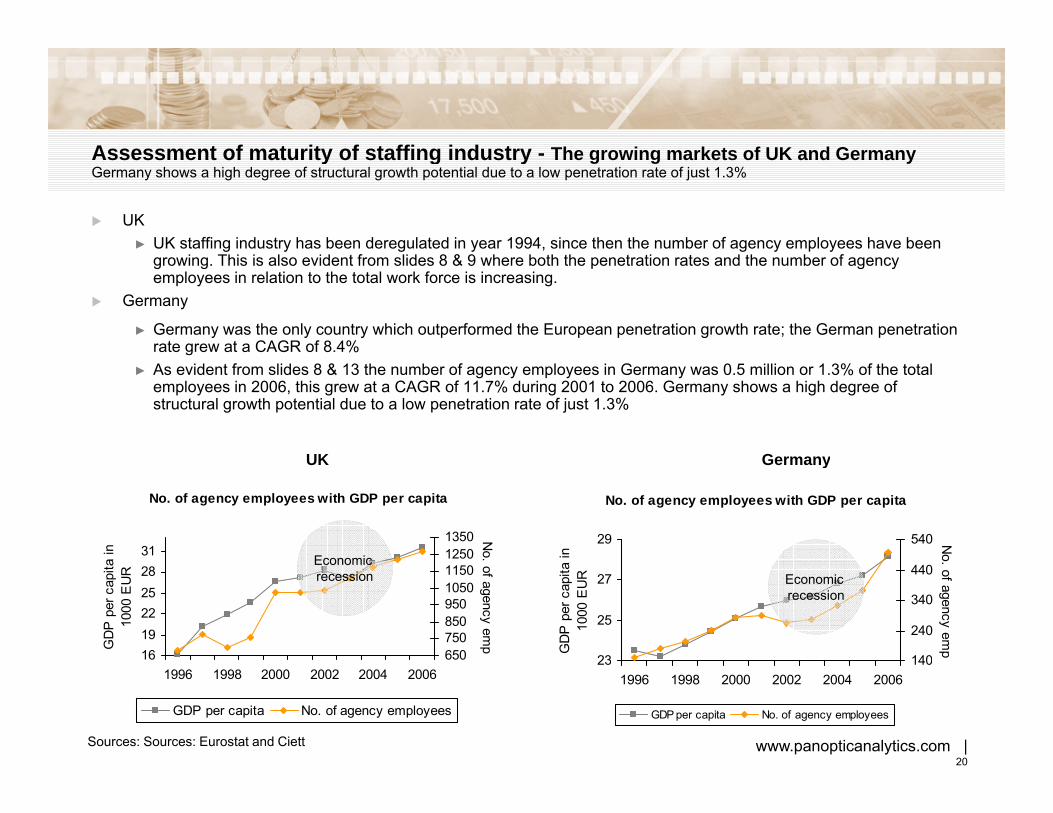
Assessment of maturity of staffing industry The growing markets of UK and GermanyAssessment of maturity of staffing industry - The growing markets of UK and GermanyGermany shows a high degree of structural growth potential due to a low penetration rate of just 1.3%
UK► UK staffing industry has been deregulated in year 1994, since then the number of agency employees have been
growing. This is also evident from slides 8 & 9 where both the penetration rates and the number of agency employees in relation to the total work force is increasing.
Germany
► Germany was the only country which outperformed the European penetration growth rate; the German penetration rate grew at a CAGR of 8.4%
► As evident from slides 8 & 13 the number of agency employees in Germany was 0.5 million or 1.3% of the total employees in 2006, this grew at a CAGR of 11.7% during 2001 to 2006. Germany shows a high degree of structural growth potential due to a low penetration rate of just 1.3%
GermanyUK
No. of agency employees with GDP per capita
31
a in
12501350 N
o.
No. of agency employees with GDP per capita
29
in 540 N
o
GermanyUK
Economic
1619222528
GD
P p
er c
apita
1000
EU
R
65075085095010501150
of agency emp
23
25
27G
DP
per
cap
ita
1000
EU
R
140
240
340
440
o. of agency emp
Economic recession
Economic recession
1996 1998 2000 2002 2004 2006
GDP per capita No. of agency employees
www.panopticanalytics.com | 20
231996 1998 2000 2002 2004 2006
140
GDP per capita No. of agency employees
Sources: Sources: Eurostat and Ciett

Assessment of maturity of staffing industry - France and the NetherlandsAssessment of maturity of staffing industry France and the NetherlandsDespite stringent labor laws and less flexibility, France had a penetration rate of 2.4% in the staffing industry in 2006 which was higher than the European average of 1.8%
France and The Netherlands
Th t ti t i th t ffi i d t i b th F (2 4%) d Th N th l d (2 5%) t d t b► The penetration rate in the staffing industry in both France (2.4%) and The Netherlands (2.5%) were reported to be higher than the European average (1.8%) in 2006
► While this penetration rate has been declining modestly in France (approx -2%) it has been growing in line with the European average in The Netherlands (approx 2%)
► It should be noted that France has stringent labor laws and less flexibility in hiring and firing the employees. The
The NetherlandsFrance
g y g g p yNetherlands, however, is relatively more liberal.
No. of agency employees with GDP per capita
27
29
a in
591N
o.
No. of agency employees with GDP per capita
32in 220 N
o
The NetherlandsFrance
Economic recession
19
21
23
25
27
GD
P p
er c
apita
1000
EU
R
291
391
491
591 . of agency emp
20
23
26
29
32G
DP
per
cap
ita
1000
EU
R
140
160
180
200
. of agency emp
recession
Economic recession
1996 1998 2000 2002 2004 2006
GDP per capita No. of agency employees
www.panopticanalytics.com | 21
1996 1998 2000 2002 2004 2006
GDP per capita No. of agency employees
Sources: Sources: Eurostat and Ciett

Effect of financial shocks on the employment industry 9/11Effect of financial shocks on the employment industry - 9/11The economic effects of the terrorist attacks were sharp but short-lived and had largely disappeared by the end of 2002
US economy had started slowing down in early 2001 due to the dot-com bubble burst; 9/11 attack provided the final trigger for the decline due to which the real GDP growth hit its bottom in Q3 2001. The downturn, with its subsequent loss of jobs began in May 2001 and continued beyond Dec 2002loss of jobs, began in May 2001 and continued beyond Dec 2002The industrial production in US fell to 1.1% in Sep 2001 and to just 0.6% in Oct 2001. The unemployment rate rose to 5.0% in Sep 2001 and to 5.4% in Oct 2001. GDP data for Q3 2001 revealed that the economy contracted at an annualized rate of 1.0%There were 225,000 jobs lost between early 2001 and the second half of 2003. Many of the high-paying jobs in finance, technology and professional services that were lost immediately after the attacks had not been recovered until the endtechnology and professional services that were lost immediately after the attacks had not been recovered until the end of 2002Between Sep 2001 and Mar 2002 there were 462 extended mass layoffs that were directly or indirectly attributable to the attacks. Approx 130,000 employees lost their jobs in these layoffs, with 9 out of 10 relieved within 2 months of the attack. The airline industry was the most hit, with a 20% job cut across the board post 9/11. Many immigrants, especially those from Arab and Muslim background, became victims of ethnic discrimination andMany immigrants, especially those from Arab and Muslim background, became victims of ethnic discrimination and hate, due to which there was a decline in the number of Asians employed in USThe employment market recovered and started picking up momentum from Q3 2003 and grew at a CAGR of 1.5% from 2003 to 2007
USA: Real GDP growth comparison with Employment growth8% 6400
d
2%
0%
2%
4%
6%
520054005600580060006200
Asi
ans
empl
oyed
9/11 attack
www.panopticanalytics.com | 22
-2%2001 Q1 2001 Q2 2001 Q3 2001 Q4 2002 Q1 2002 Q2 2002 Q3 2002 Q4 2003 Q1 2003 Q2 2003 Q3 2003 Q4
5200
Real GDP growth Employment growth Asians employed
Sources: BEA and BLS

Agenda
Executive SummaryStaffing industry overviewStaffing industry overviewEmployment market overview by country and segmentKey industry drivers and their historical performanceAssessment of maturity of staffing industryResponse to recession and financial shocksCompetitive landscapeForecast Emerging markets for staffing industryEmerging markets for staffing industry
AppendixTypes of Agency contractsTemporary Agency legislative changes and their impacts
www.panopticanalytics.com | 23
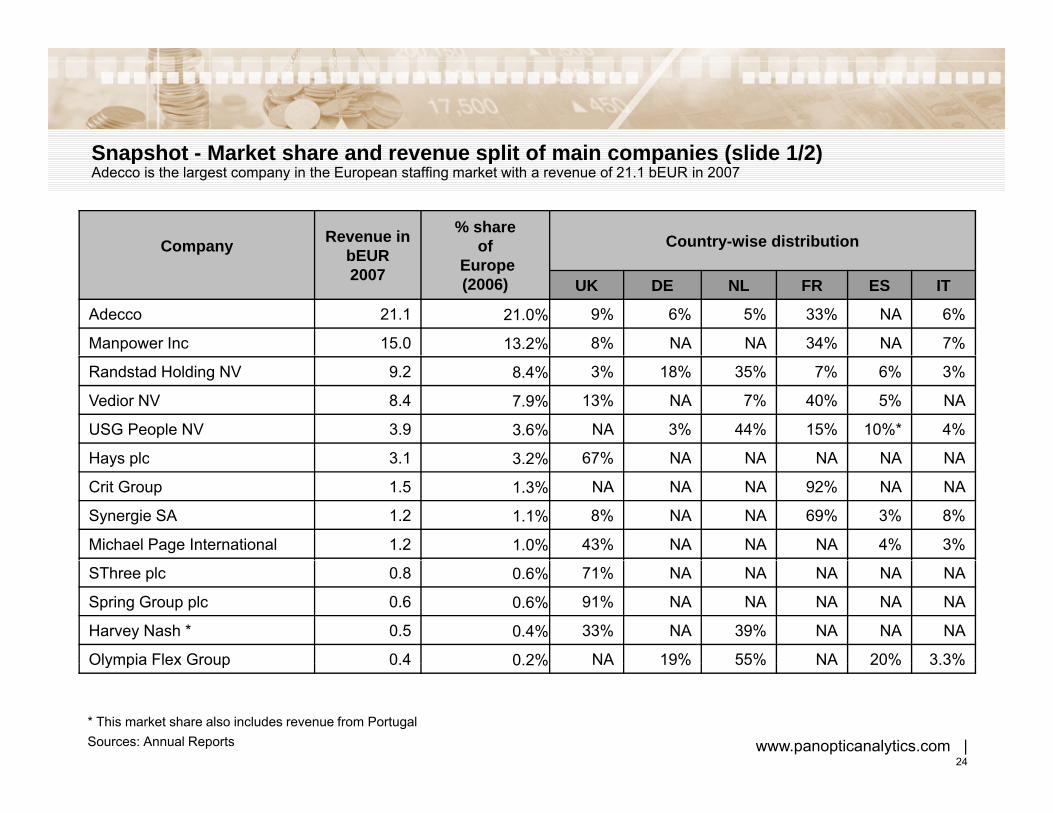
Snapshot Market share and revenue split of main companies (slide 1/2)Snapshot - Market share and revenue split of main companies (slide 1/2)Adecco is the largest company in the European staffing market with a revenue of 21.1 bEUR in 2007
Company Revenue in bEUR
% share of Country-wise distributionp y bEUR
2007 Europe (2006) UK DE NL FR ES IT
Adecco 21.1 21.0% 9% 6% 5% 33% NA 6%
Manpower Inc 15.0 13.2% 8% NA NA 34% NA 7%
Randstad Holding NV 9.2 8.4% 3% 18% 35% 7% 6% 3%
Vedior NV 8.4 7.9% 13% NA 7% 40% 5% NA
USG People NV 3.9 3.6% NA 3% 44% 15% 10%* 4%
Hays plc 3 1 3 2% 67% NA NA NA NA NAHays plc 3.1 3.2% 67% NA NA NA NA NA
Crit Group 1.5 1.3% NA NA NA 92% NA NA
Synergie SA 1.2 1.1% 8% NA NA 69% 3% 8%
Michael Page International 1.2 1.0% 43% NA NA NA 4% 3%
SThree plc 0.8 0.6% 71% NA NA NA NA NA
Spring Group plc 0.6 0.6% 91% NA NA NA NA NA
Harvey Nash * 0.5 0.4% 33% NA 39% NA NA NA
Olympia Flex Group 0 4 0 2% NA 19% 55% NA 20% 3 3%Olympia Flex Group 0.4 0.2% NA 19% 55% NA 20% 3.3%
Sources: Annual Reports* This market share also includes revenue from Portugal
www.panopticanalytics.com | 24
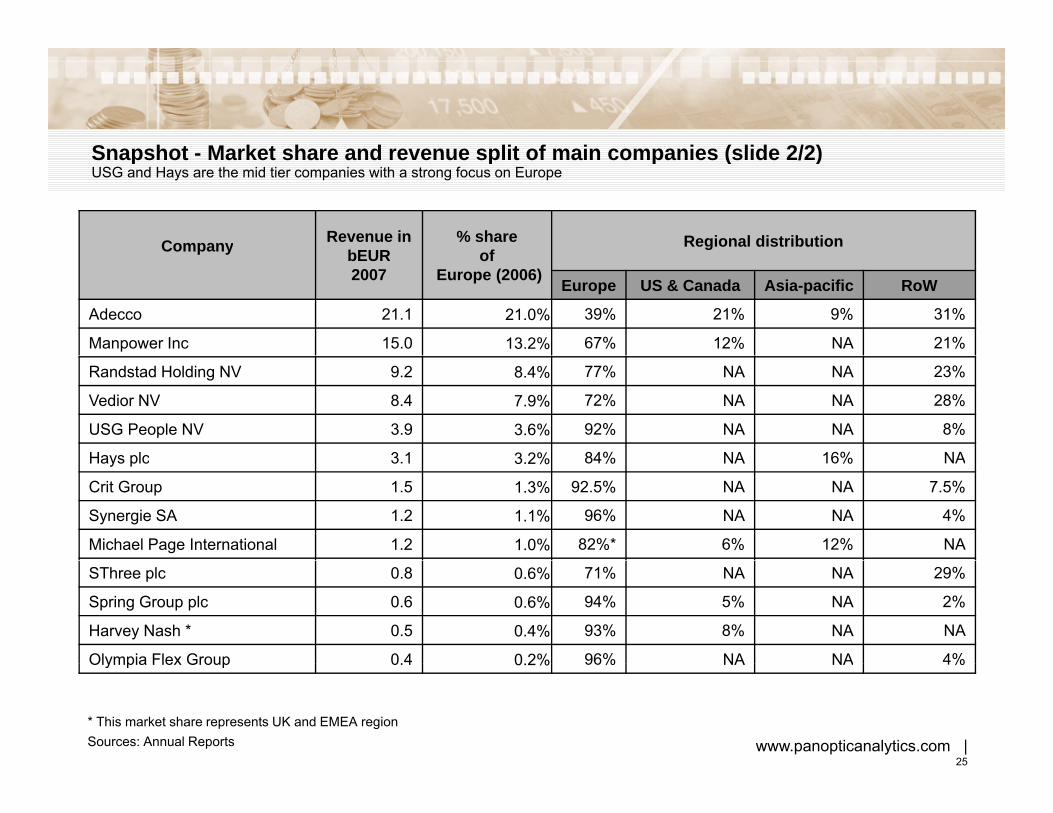
Snapshot Market share and revenue split of main companies (slide 2/2)Snapshot - Market share and revenue split of main companies (slide 2/2)USG and Hays are the mid tier companies with a strong focus on Europe
Company Revenue in bEUR
% share of
Regional distributionp y bEUR2007
ofEurope (2006) Europe US & Canada Asia-pacific RoW
Adecco 21.1 21.0% 39% 21% 9% 31%
Manpower Inc 15.0 13.2% 67% 12% NA 21%
Randstad Holding NV 9.2 8.4% 77% NA NA 23%
Vedior NV 8.4 7.9% 72% NA NA 28%
USG People NV 3.9 3.6% 92% NA NA 8%
Hays plc 3 1 3 2% 84% NA 16% NAHays plc 3.1 3.2% 84% NA 16% NA
Crit Group 1.5 1.3% 92.5% NA NA 7.5%
Synergie SA 1.2 1.1% 96% NA NA 4%
Michael Page International 1.2 1.0% 82%* 6% 12% NA
SThree plc 0.8 0.6% 71% NA NA 29%
Spring Group plc 0.6 0.6% 94% 5% NA 2%
Harvey Nash * 0.5 0.4% 93% 8% NA NA
Olympia Flex Group 0 4 0 2% 96% NA NA 4%Olympia Flex Group 0.4 0.2% 96% NA NA 4%
Sources: Annual Reports* This market share represents UK and EMEA region
www.panopticanalytics.com | 25

H1 2008 performance of main companiesp pMichael Page International had the highest gross margin of 58.5% in H1 2008 as more than 40% of the revenue is generated frompermanent placement
Revenue (in
% Increase/
Operating Income
% Increase/
Net Income
(i%
Increase/Gross Margin
(i %)Company
(bEUR)
Increase/ Decrease
over H1 2007
(in mEUR)Increase/ Decrease
over H1 2007
(in mEUR)
Increase/ Decrease
over H1 2007
(in %)
H1 2008 H1 2008 H1 2008 H1 2008 H1 2007
Adecco 10.2 -0.4% 509.0 -0.6% 349.0 -1.7% 18.7% 19.1%Adecco 10.2 0.4% 509.0 0.6% 349.0 1.7% 18.7% 19.1%
Manpower Inc 8.3 18.0% 248.0 -10.8% 133.7 -16.8% 18.8% 19.1%
Randstad Holding NV 5.6 28.8% 247.9 8.7% 171.3 1.6% 21.4% 21.9%
USG People NV 2.0 7.8% 105.2 0.3% 60.8 -4.6% 24.7% 24.8%
Hays Plc* 1.9 19.7% 211.4 26.5% 150.1 5.3% 18.0% 18.0%
Crit Group 0.7 6.7% 32.0 -17.1% 20.4 -10.6% 5.9% 10.4%
Synergie SA 0.6 7.8% 34.3 -11.0% 20.1 -16.3% 11.0% 10.8%
Michael Page International 0 7 26 3% 124 5 21 6% 86 3 24 2% 58 5% 57 2%Michael Page International 0.7 26.3% 124.5 21.6% 86.3 24.2% 58.5% 57.2%
SThree Plc 0.4 22.9% 32.9 14.4% 22.0 13.7% 34.7% 34.3%
Spring Group Plc 0.4 31.4% 4.8 110.2% 3.6 21.3% 13.6% 12.3%
Harvey Nash** NA 41.0% NA NA NA NA NA NA
Sources: Interim reports for H1 2008
*Gross margin figures are the Temporary margin figures for the years ended Jun 30, 2008 and Jun 30, 2007
www.panopticanalytics.com | 26
Olympia Flex Group 0.2 -0.2% 5.2 -17.3% 1.5 -52.7% 17.2% 14.7%
**The Company will publish its interim results for H1 2008 on Sep 30, 2008. The % changes are for Q1 2008 for which absolute figures were not provided

Company profiles
Adecco
R d t d H ldi NV (i l di V di )Randstad Holding NV (including Vedior)
Michael Page International
SThree PLC
Synergie SA
USG People NV
Spring Group PLC
Olympia Flex Group
Harvey Nash
Hays plc
Crit Group
Manpower
www.panopticanalytics.com | 27

Adecco (Ticker: ADEN - Swiss Stock Exchange)
Key Figures for 2007► Revenue 21.1 bEUR► Net Income 735 mEUR► Net Income 735 mEUR► Employees 37,000► Fee Earners 700,000
Revenue – temporary vs. permanent► Temporary 20.7 bEUR (98.2%)► Permanent 387 mEUR (1.8%)
Market share against EU► 21% in the year 2006 which grew from 20.3% in 2005
Strengths► World’s largest staffing company► Ability to consolidate the industry
Weaknesses► Dependency on the industrial workforce
Top 5 ShareholdersJacobs Holding 22.62%Adecco SA 7.85%Foriel-Destezet Philippe 5.37%
Key sectors
Others
Key geographies
Recent M&A transactionsDate Target Price (mEUR)18-Jun-07 Tuja (Germany) 800
ppTempleton Investment Counsel 5.25%Harris Associates LP 5.02%
Industrial
Office
EngineeringFinance & Legal
IT
France
USA & C dIberia
Others
18-Jun-07 Tuja (Germany) 8009-Jan-06 DIS (Germany) 68329-Apr-05 Humangroup (Spain) 5125-Jan-05 Altedia 112
www.panopticanalytics.com | 28
Sources: Annual Report 2007, Swiss Stock Exchange, Reuters as on Sep 04, 2008
OfficeUSA & Canada Italy Japan
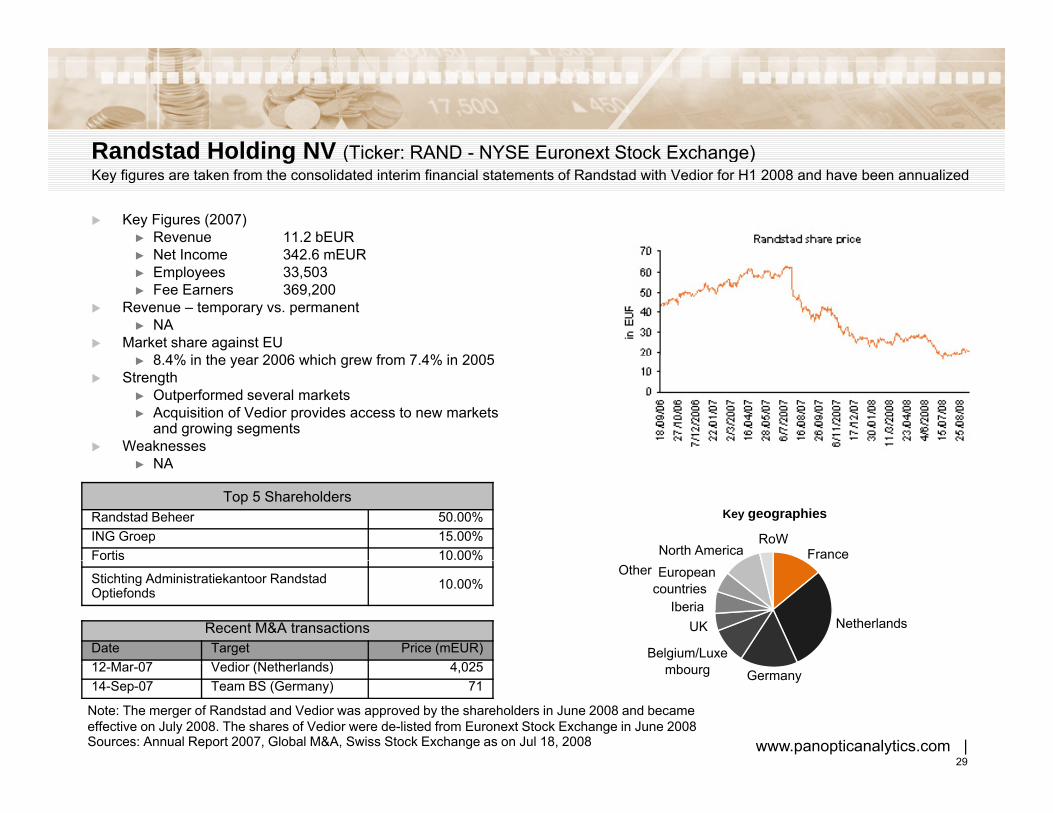
Randstad Holding NV (Ticker: RAND NYSE Euronext Stock Exchange)Randstad Holding NV (Ticker: RAND - NYSE Euronext Stock Exchange)Key figures are taken from the consolidated interim financial statements of Randstad with Vedior for H1 2008 and have been annualized
Key Figures (2007)► Revenue 11.2 bEUR► Net Income 342 6 mEUR► Net Income 342.6 mEUR► Employees 33,503► Fee Earners 369,200
Revenue – temporary vs. permanent► NA
Market share against EU8 4% i th 2006 hi h f 7 4% i 2005► 8.4% in the year 2006 which grew from 7.4% in 2005
Strength► Outperformed several markets► Acquisition of Vedior provides access to new markets
and growing segmentsWeaknesses
NA► NA
Top 5 ShareholdersRandstad Beheer 50.00%ING Groep 15.00%Fortis 10.00% FranceNorth America
RoW
Key geographies
Stichting Administratiekantoor Randstad Optiefonds
10.00%
Recent M&A transactionsDate Target Price (mEUR)12 M 07 V di (N th l d ) 4 025
Netherlands
Other European countries
Belgium/Luxe
UKIberia
www.panopticanalytics.com | 29
12-Mar-07 Vedior (Netherlands) 4,02514-Sep-07 Team BS (Germany) 71
Sources: Annual Report 2007, Global M&A, Swiss Stock Exchange as on Jul 18, 2008
Note: The merger of Randstad and Vedior was approved by the shareholders in June 2008 and became effective on July 2008. The shares of Vedior were de-listed from Euronext Stock Exchange in June 2008
mbourg Germany
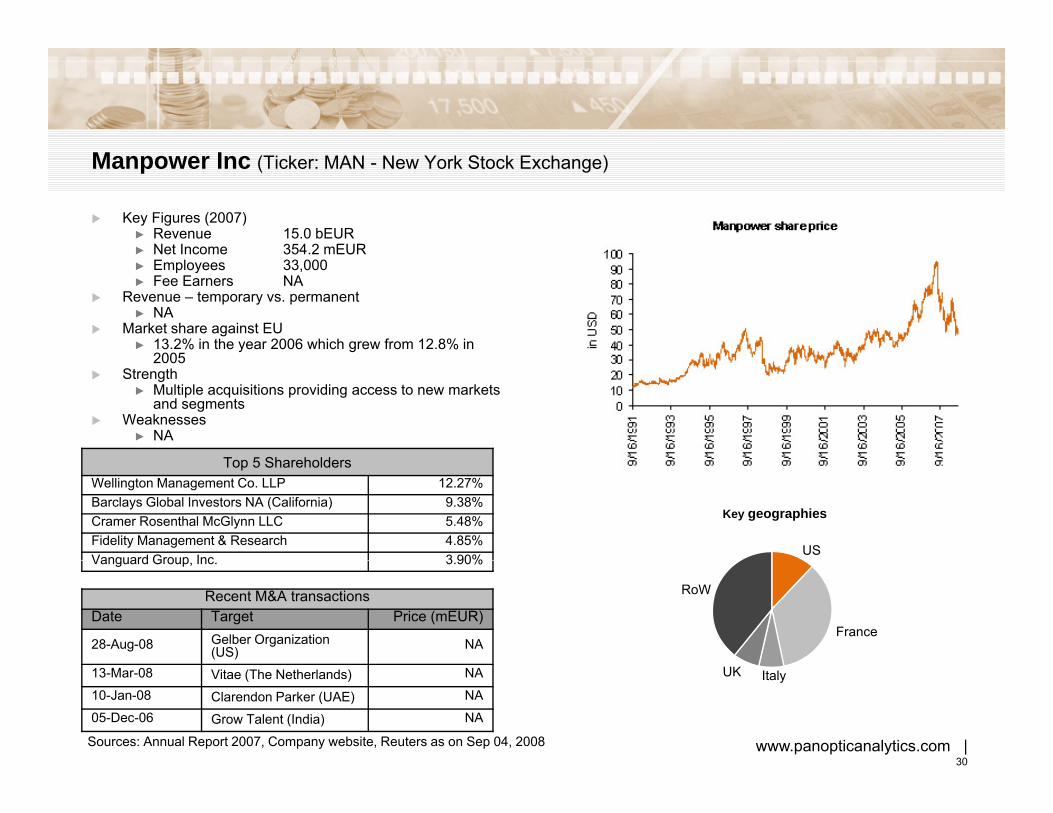
Key Figures (2007)► Revenue 15.0 bEUR► Net Income 354.2 mEUR
Manpower Inc (Ticker: MAN - New York Stock Exchange)
► Net Income 354.2 mEUR► Employees 33,000► Fee Earners NA
Revenue – temporary vs. permanent► NA
Market share against EU► 13.2% in the year 2006 which grew from 12.8% in
20052005Strength► Multiple acquisitions providing access to new markets
and segmentsWeaknesses► NA
T 5 Sh h ldTop 5 ShareholdersWellington Management Co. LLP 12.27%Barclays Global Investors NA (California) 9.38%Cramer Rosenthal McGlynn LLC 5.48%Fidelity Management & Research 4.85%Vanguard Group Inc 3 90%
US
Key geographies
Vanguard Group, Inc. 3.90%
Recent M&A transactionsDate Target Price (mEUR)
28-Aug-08 Gelber Organization (US) NA
France
RoW
13-Mar-08 Vitae (The Netherlands) NA
10-Jan-08 Clarendon Parker (UAE) NA
05-Dec-06 Grow Talent (India) NA
Sources: Annual Report 2007, Company website, Reuters as on Sep 04, 2008 www.panopticanalytics.com | 30
ItalyUK

Scope for market consolidationScope for market consolidationStaffing industry in UK is the most fragmented and offers great scope for market consolidation
Industry revenues (bEUR, 2005) Total = 74.719 0 6 4 3 4 3 0 8 9 34 0
Scope for 80
100%Others
RandstadSynergie
USGPeopleCrit
19.0
Oth
ers
OlympiaAB
Manpower
6.4
Oth
ers
3.4
Oth
ers
3.0 8.9 34.0
Oth
ers
Oth
ers
Scope for market consolidation
pGlobal agencies
40
60Vedior
Manpower
ManpowerAdecco
Vedior
USGPeople
Manpower
stad
VediorAuto Vision
Scope for market consolidation
Scope for Global agencies
Vedi
or
Vedi
orpl
eA
decc
o
20
40
Adecco
Ran
dsta
d
Ran
dsA
decc
o
ZAGTujaHays
ManpowerPersona service
Adecco
Randstad
MPSVedior
ManpowerHays
RandstadUS
G P
eop
Ran
dsta
d
0Fr Nl Be Sp Ger
Randstad
UKAdecco
Share ofConcentrated market dominated
by large global playersVery fragmented marketFragmented
market with
R
www.panopticanalytics.com | 31
Sources: Van Lanschot bankers, Deutsche Bank, Kepler, Credit Suisse, National Federation StatisticsNote: revenues only for TAW activities in Belgium and Germany
by large global players market with local players

Barriers to entry for the Staffing IndustryBarriers to entry for the Staffing IndustryStaffing industry is characterized by low barriers to entry which does pose a challenge to the industry
Overall, staffing industry has low entry barriers as huge investments and complex legal compliances are not required to set up a staffing agency. However, some end customer segments and countries do have specific regulatory requirements which may act as barriers in particular casesrequirements which may act as barriers in particular cases
Industry wide barriers
► In countries such as France, trade unions have the power of collective bargaining which works as a barrier for new companies supplying agency employees
► Germany and Spain are countries with strong regulations for agency staffing In both Germany and Spain agency► Germany and Spain are countries with strong regulations for agency staffing. In both Germany and Spain, agency employee is not allowed to work in the construction industry
Company specific barriers
► Brand name: Employers are eager to know if the agency has a strong brand name and can attract the right candidates
► Financial strength: An agency’s financial strength is of great importance, as an agency who can withstand financial setbacks is in a better position to provide uninterrupted service
► Size: A firm with a large recruitment team is able to generate more resume traffic and handle multiple assignments. In addition, size influences, the reach and access to the global marketplace which is important to succeed
www.panopticanalytics.com | 32
Sources: Annual Reports

Agenda
Executive SummaryStaffing industry overviewStaffing industry overviewEmployment market overview by country and segmentKey industry drivers and their historical performanceAssessment of maturity of staffing industryResponse to recession and financial shocksCompetitive landscapeForecast Emerging markets for staffing industryEmerging markets for staffing industry
AppendixTypes of Agency contractsTemporary Agency legislative changes and their impacts
www.panopticanalytics.com | 33

Forecast - Possible impact of current economic slowdown on European staffing industryForecast Possible impact of current economic slowdown on European staffing industryDue to the present slowdown in the global economy as a result of the credit crisis, Europe’s employment growth is expected to decline from 1.7% in 2007 to 0.8% in 2008, adversely affecting the staffing industry
Staffing industry is dependent on macro economic factors such as GDP growth, employment level and industry growth rate. The current economic recession has already affected all the above factors and hence impact the staffing industry
Current economic slowdown
► The credit crisis which began in 2007, has resulted in a lower and weak growth forecasts for years 2008 and 2009. Europe is expected to grow at a rate of 1.7% in 2008 and 1.5% in 2009 down from 2.7% in 2007. The slowdown in Europe is largely due to weakness in financial markets, slowdown in USA and increasing commodity prices.
Impact on overall employmentImpact on overall employment
► Europe’s employment growth is expected to be halved this year to 0.8% in 2008 and 0.5% in 2009 down from 1.7% in 2007. Considering these growth rates, Europe is expected to create only 3 million new jobs in 2008 to 2009 as compared to 7.5 million in 2006 to 2007
Impact on staffing industryp g y
► The top three European staffing companies, Adecco, Randstad and Vedior are expecting an adverse effect of global downturn on the staffing industry. The geographical development as seen by the large staffing companies is as follows:
– US and Canada: weak due to credit crisis
– Europe and Japan: moderate
– Middle East, Asia, Central and Eastern Europe: strong
www.panopticanalytics.com | 34
Sources: EUROPA and Annual reports