Embed Size (px)
Citation preview
© Copyright 2016 RISI, Inc. | Proprietary Information
Global OCC Market Outlook
Hannah ZhaoSenior Economist, Recovered Paper
International Containerboard Conference
November 2016

Global OCC MarketOCC Import/Export Prices
0
50
100
150
200
250
300
2007 2008 2009 2010 2011 2012 2013 2014 2015 2016
US
Do
llars
per
To
nn
e
OCC US West Export (FAS)
OCC N. German Export (FAS)
OCC China Import (CIF)
OCC N. German Export in Euros
© Copyright 2016 RISI, Inc. | Proprietary Information 2

Global OCC MarketDomestic OCC Prices
0
400
800
1,200
1,600
2,000
2,400
0
40
80
120
160
200
240
2006 2007 2008 2009 2010 2011 2012 2013 2014 2015 2016
US Avg. (US$/Tonne) (L) German Avg. (Euro/Tonne) (L)
China Domestic OCC (RMB/Tonne) (R) Brazil Avg. (Real/tonne) (R)
© Copyright 2016 RISI, Inc. | Proprietary Information 3
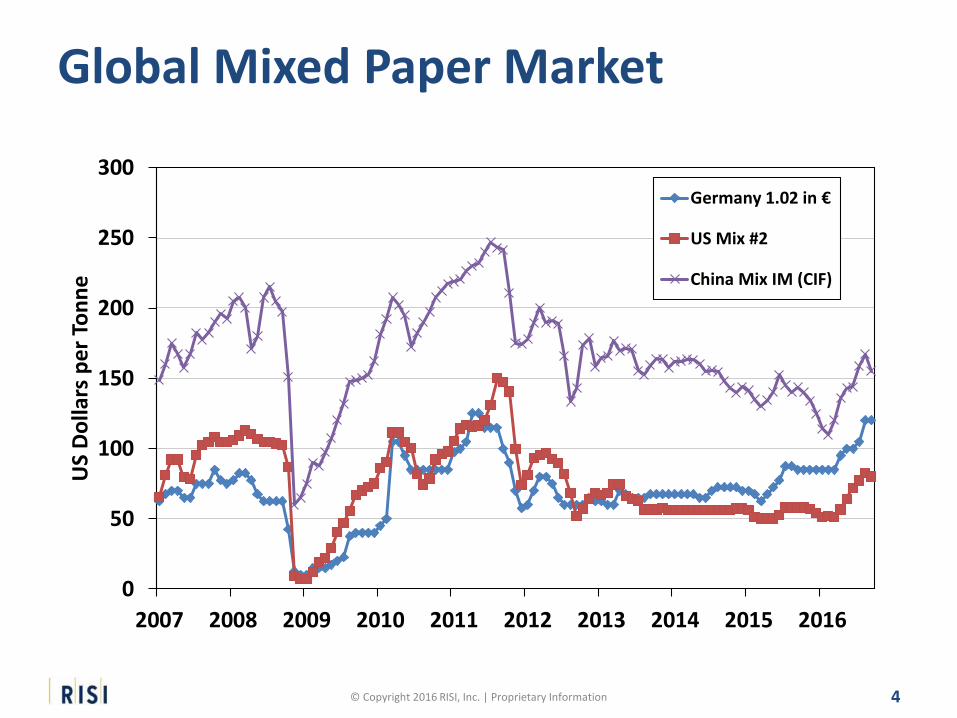
Global Mixed Paper Market
0
50
100
150
200
250
300
2007 2008 2009 2010 2011 2012 2013 2014 2015 2016
US
Do
llars
per
To
nn
e
Germany 1.02 in €
US Mix #2
China Mix IM (CIF)
© Copyright 2016 RISI, Inc. | Proprietary Information 4

Major RCP Trade Flows
2012 2014 2015
17.7 16.5
17.0 MT
9.5 8.5
9.4 MT
4.9 4.6
4.2 MT
1.8 1.7
1.7 MT
© Copyright 2016 RISI, Inc. | Proprietary Information 5

US RCP Market Domestic Demand vs. Net Exports
10%
20%
30%
40%
50%
60%
70%
0
10
20
30
40
50
60
Mil
lion
To
nn
es
Domestic Demand
Net Exports
Recovery Rate (R)
Net export
share
2000: 22%
2004: 27%
2008: 36%
2012: 41%
2014: 39%
2015: 40%
2016: ?
© Copyright 2016 RISI, Inc. | Proprietary Information 6
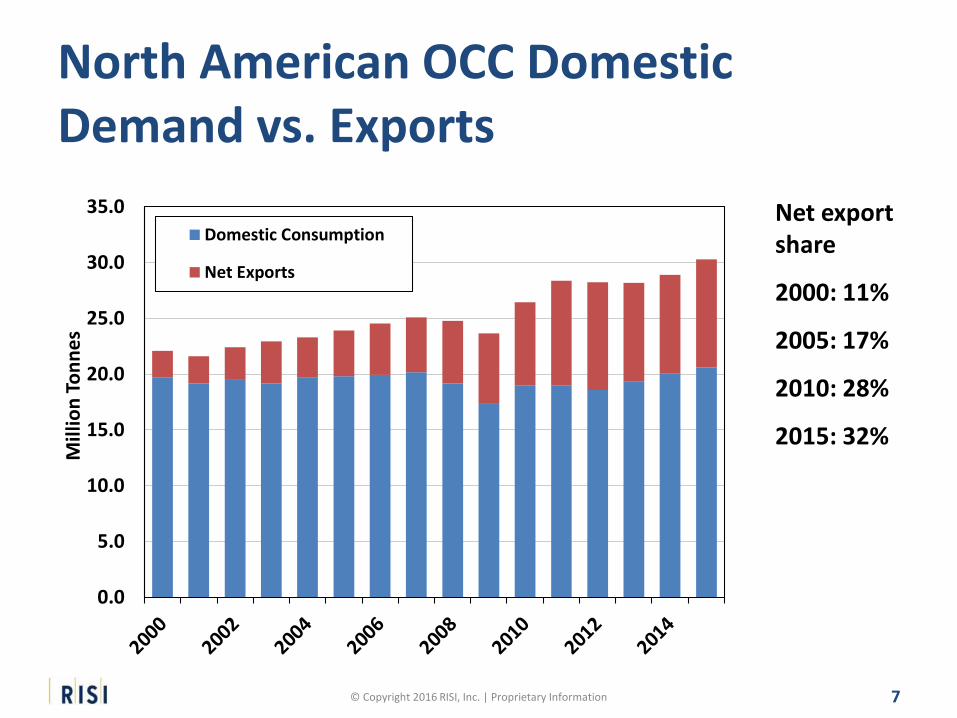
North American OCC Domestic Demand vs. Exports
7
0.0
5.0
10.0
15.0
20.0
25.0
30.0
35.0
Mill
ion
To
nn
es
Domestic Consumption
Net Exports
Net export share
2000: 11%
2005: 17%
2010: 28%
2015: 32%
© Copyright 2016 RISI, Inc. | Proprietary Information

US OCC Exports, Changing Destinations, 2016/2015
10
-40
-20
0
20
40
60
80
100
120
140
Pe
rce
nt
© Copyright 2016 RISI, Inc. | Proprietary Information
• Total US OCC net exports increased marginally by 1% in the first eight months of the year. Exports to China declined by 4%, while those to most other Asian countries increased significantly.

Chinese RCP MarketDomestic Collection vs. Imports
0.00
0.10
0.20
0.30
0.40
0.50
0.60
0
10
20
30
40
50
60
70
80
90
Mill
ion
To
nn
es
Domestic Collection Net Imports
Apparent Paper Recovery Rate Import ShareImport share
1995: 10%
2000: 20%
2005: 49%
2009: 44%
2013: 39%
2014: 36%
2015: 37%
China is still far from being self-sufficient in terms of RCP. After rebounding by 6% in 2015, Chinese imports have dropped slightly again this year.
© Copyright 2016 RISI, Inc. | Proprietary Information 9

Chinese RCP Imports
0
5
10
15
20
25
30
35
Mill
ion
To
nn
es
OCC MIX ONP Other OCC Share
2000: 27%
2005: 52%
2010: 56%
2015: 57%
MIX Share
2000: 17%
2005: 19%
2010: 18%
2015: 21%
© Copyright 2016 RISI, Inc. | Proprietary Information 10

Western European OCC Domestic Demand vs. Exports
11
0%
20%
40%
60%
80%
100%
120%
140%
0
5
10
15
20
25
30
35
Millio
n T
on
nes
Domestic Consumption Net Exports Recovery Rate Export Share
Net export share
2000: 8%
2005: 15%
2010: 22%
2013: 25%
2015: 28%
Net exports rebounded in 2014 and 2015 after falling by 6% in 2013
© Copyright 2016 RISI, Inc. | Proprietary Information

Other Asian RCP MarketsDomestic Collection vs. Imports
40%
45%
50%
55%
60%
0
10
20
30
40
Mil
lion
To
nn
es
Domestic Recovery
Net Imports
Recovery Rate
Net import share
2000: 29%
2010: 18%
2014: 19%
2015: 19%
Net imports rose continuously in 2013-2015. The import share grew again after declining last decade, driven by growing demand from India, Vietnam and other developing countries in this region.
© Copyright 2016 RISI, Inc. | Proprietary Information 12

World OCC Markets in the Future
• World OCC demand will grow in 2017-2018, but the growth rate will decelerate
Slow containerboard production growth and limited growth in RCP usage rate
Other fiber options
oUKP
• Market or integrated?
oMixed paper
• Lower cost? Quality? What’s inside mixed paper?
oNon-wood
• Will remain small?
13© Copyright 2016 RISI, Inc. | Proprietary Information

World Containerboard Production
0.70
0.72
0.74
0.76
0.78
0.80
0.82
0.84
0.86
0.88
0.90
0
20
40
60
80
100
120
140
160
180
2000 2002 2004 2006 2008 2010 2012 2014
Mill
ion
To
nn
es
VirginRecycledOCC ConsumptionUKP ConsumptionOCC Recovery Rate (R)
© Copyright 2016 RISI, Inc. | Proprietary Information 14

World Containerboard Markets • How much more recycled capacity
can be added to the global containerboard sector?
RCP usage rate
• 90% worldwide in 2014 compared to 86% in 2009
• How high can it go?
Planned new recycled containerboard lines and converted capacity from graphic paper sector
Cost
• Will current low prices for bulk grades, including OCC, be long-lasting or temporary?
15
RCP Usage Rate in Containerboard
Region 2009 2015
Western Europe
95% 96%
EasternEurope
75% 87%
China 107% 112%
Japan 95% 97%
Other Asia 107% 110%
Latin America 86% 88%
NorthAmerica
45% 48%
Oceania 75% 62%
World 86% 90%
© Copyright 2016 RISI, Inc. | Proprietary Information
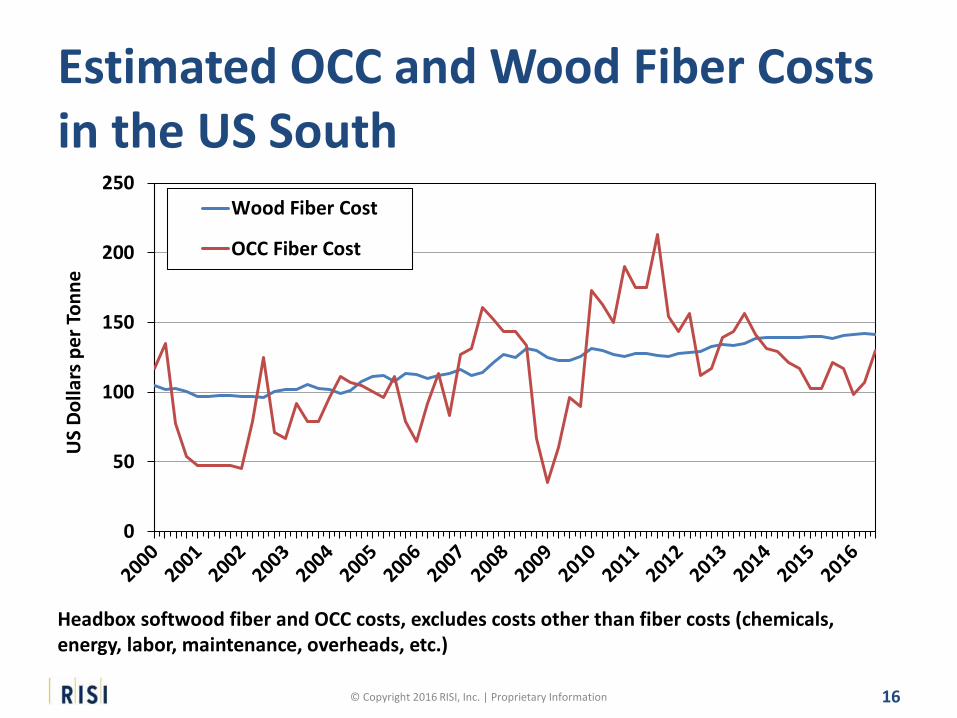
Estimated OCC and Wood Fiber Costs in the US South
0
50
100
150
200
250
US
Do
llars
pe
r To
nn
e
Wood Fiber Cost
OCC Fiber Cost
Headbox softwood fiber and OCC costs, excludes costs other than fiber costs (chemicals, energy, labor, maintenance, overheads, etc.)
© Copyright 2016 RISI, Inc. | Proprietary Information 16

World OCC Markets in the Future
• World OCC demand will grow in 2017-2018, but the growth rate will decelerate
Asia, particularly China and Other Asia, will continue to be the main driving force behind world RCP demand growth, but even Asian RCP usage growth will decelerate
17© Copyright 2016 RISI, Inc. | Proprietary Information

Capacity Expansions and Operating Rates in Asia Growth in Million Tonnes and Operating Rate (%)
18© Copyright 2016 RISI, Inc. | Proprietary Information
75.0%
77.5%
80.0%
82.5%
85.0%
87.5%
90.0%
92.5%
95.0%
97.5%
100.0%
0.0
0.5
1.0
1.5
2.0
2.5
3.0
3.5
4.0
4.5
5.0
10 11 12 13 14 15 16 17
Rest of Asia
75%
78%
80%
83%
85%
88%
90%
93%
95%
98%
100%
0.0
0.5
1.0
1.5
2.0
2.5
3.0
3.5
4.0
4.5
5.0
10 11 12 13 14 15 16 17
China
Demand Capacity Operating Rate (Right)

Chinese Containerboard Industry Was Slow to Recognize Changes in Demand
19© Copyright 2016 RISI, Inc. | Proprietary Information
Creating disruptions in the market
0.0%
2.0%
4.0%
6.0%
8.0%
10.0%
12.0%
14.0%
16.0%
18.0%
20.0%
Demand Growth
Capacity Growth

World Containerboard Production
21%
15%
5%29%
13%
6%
11%
2018
22%
16%
6%28%
12%
6%
10%
2014
N. AmericaW.EuropeJapanChinaOther AsiaL. America
2014: 154 Million Tonnes 2018: 168 Million Tonnes
© Copyright 2016 RISI, Inc. | Proprietary Information 20

World OCC Markets in the Future
• World OCC demand will grow in 2017-2018, but the growth rate will decelerate
Other developing regions, such as Eastern Europe and Latin America, will also see growing OCC demand
The developed regions, such as North America and Western Europe, will generate OCC usage growth as well
• New recycled fiber based capacity
21© Copyright 2016 RISI, Inc. | Proprietary Information

Containerboard Production by Region
22
50%
55%
60%
65%
70%
75%
80%
85%
90%
95%
100%
0
20
40
60
80
100
120
140
160
180
200
2000 2002 2004 2006 2008 2010 2012 2014 2016 2018
Mill
ion
To
nn
es
N. America W. Europe
Japan China
Other Asia L. America
Other RCP Usage Rate
© Copyright 2016 RISI, Inc. | Proprietary Information
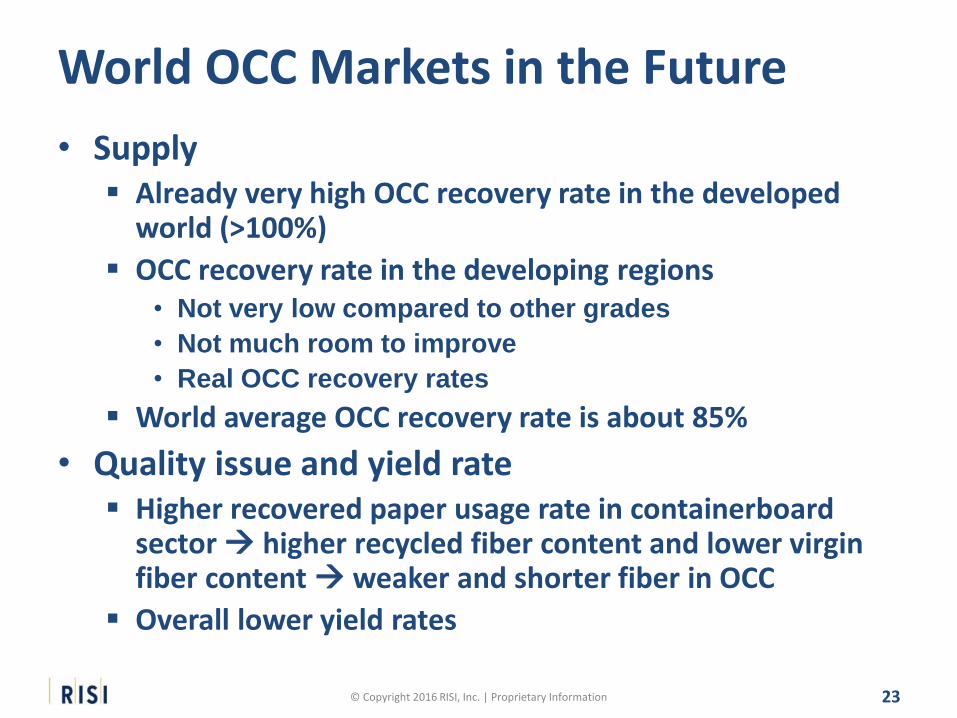
World OCC Markets in the Future
• Supply Already very high OCC recovery rate in the developed
world (>100%)
OCC recovery rate in the developing regions• Not very low compared to other grades
• Not much room to improve
• Real OCC recovery rates
World average OCC recovery rate is about 85%
• Quality issue and yield rate Higher recovered paper usage rate in containerboard
sector higher recycled fiber content and lower virgin fiber content weaker and shorter fiber in OCC
Overall lower yield rates
23© Copyright 2016 RISI, Inc. | Proprietary Information

OCC Recovery Rate by Region
0%
20%
40%
60%
80%
100%
120%
140%
2000 2002 2004 2006 2008 2010 2012 2014
N. America Other Asia W. Europe Japan
China Latin America World Average
© Copyright 2016 RISI, Inc. | Proprietary Information 24

World OCC Markets in the Future
• Upward pressure on OCC pricing
Higher OCC recovery rate will push up OCC collection costs, along with rising transportation and labor costs
Limited supply worldwide will give OCC prices more running room
• Global demand/supply imbalance
Possible fiber furnish change in some regions
Trade will remain a big part of global OCC market
• Risks
25© Copyright 2016 RISI, Inc. | Proprietary Information

OCC/UKP Market Analysis and Outlookwww.risiinfo.com/occ-ukp
Thank you!For more information:
© Copyright 2016 RISI, Inc. | Proprietary Information 26
Outlook for Global Recovered Paper Marketswww.risi.com/recoveredpaper
The China Recovered Paper Market: A Comprehensive Analysis and Outlook www.risi.com/chinarcp
World Pulp and Recovered Paper 5-Year & 15-Year Forecastswww.risi.com/WPRP5www.risi.com/WPRP15
World Recovered Paper Monitorwww.risi.com/wrpm
The information in this presentation comes from these sources unless otherwise cited