Embed Size (px)
Citation preview

Macro Strategy | 30 June 2020
Global Market Outlook
Navigating the recoveries
The gradual end of economic
lockdowns is likely to shift investor
focus to the speed and scale of the
economic recovery in H2 20 and
beyond. We remain positive on
risky assets broadly, with a slight
preference for Emerging Market
and corporate bonds over equities.
We expect Developed Market High
Yield, EM USD government and
Asia USD bonds to benefit from a
growth rebound and capped yields.
US and Asia ex-Japan equities are
likely to continue leading the
rebound, but Euro area equities
could catch up.
A significant surge in new COVID-
19 infections, US-China relations
and the US election are key risks
to the recovery. Adding gold and
derivative strategies may be a
good way to manage these risks.
Also find out...
What’s preferred: credit,
equities, or both?
What are the key events
we are watching?
How can governments
fund their deficits?
This commentary reflects the views of the Wealth Management Group of Standard Chartered Bank

Global Market Outlook 2
01 Highlights
01 Navigating the recoveries
02 Strategy
03 Investment strategy
07 Major brokers’ and investors’ views
08 Risks to long-term growth and inflation
10 How to fund the fiscal stimulus?
12 Sustainable investing post COVID-19
03 Perspectives
14 Perspectives on key client questions
16 Macro overview
04 Asset Classes
23 Bonds 48 Alternatives
30 Equity 49 Quant perspective
37 Equity sector strategy 50 Technicals
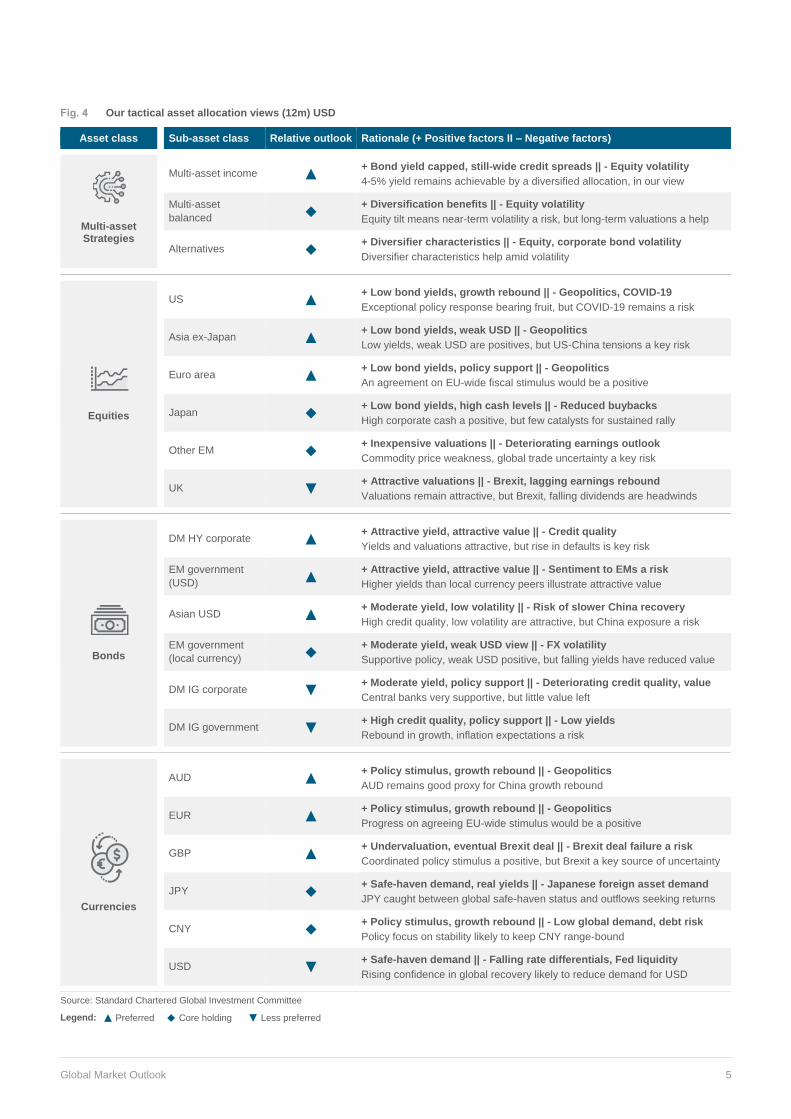
38 Equity derivatives 51 Tracking market diversity
39 Foreign exchange 52 Multi-asset allocation
05 Asset Allocation
56 Our recommended allocations
57 Asset allocation summary
06 Performance Review
58 Closed calls summary
59 Glossary
60 Market performance summary
61 Events calendar
62 Wealth management advisory publications
64 Disclosures
2 Contents

Global Market Outlook 3
IMPLICATIONS
FOR INVESTORS
• Global equities, credit and
multi-asset income
strategies are likely to
outperform government
bonds and cash over a 12-
month horizon
• Gold is likely to perform
well amid capped bond
yields, especially if
inflation, COVID-19 or
geopolitical risks rise
• Within bonds, we believe
Developed Market High
Yield, Emerging Market
USD and Asia USD bonds
are attractive
• Within equities, we have a
preference for US, Asia
ex-Japan and Euro area
equities
• We expect the USD to
weaken. The EUR, AUD
and GBP are likely to be
biggest beneficiaries
Navigating the recoveries • The world economy and financial markets are seeing recoveries at various speeds. The
gradual end of economic lockdowns in most economies is likely to shift investor focus to
the pace and scale of the economic recovery in H2 2020 and beyond. We remain positive
on risky assets broadly, with a slight preference for corporate and Emerging Market (EM)
bonds over equities.
• We expect Developed Market (DM) High Yield (HY), EM USD government and Asia USD
bonds to benefit from a growth rebound and capped yields. US and Asia ex-Japan equities
are likely to continue leading the rebound, but Euro area equities could catch up.
• A significant surge in new COVID-19 infections, deterioration in US-China relations and
the US election are key risks to the recovery. Adding exposure to gold and equity volatility
strategies may be good ways to manage these risks.
An eventful H1 20
The first half of the year was certainly eventful, having seen a pandemic, an economic
recession, numerous geopolitical flashpoints and social unrests. Equities and corporate
bonds delivered -7.2% and 3.0% returns, respectively, in H1 (to 29 June), but they also
experienced -28.3% and -8.8% peak-to-trough declines, respectively, both in Q1 20. Gold
was a big gainer, up 15.9% in H1, but the USD gained only 1.2% as the pace of gains slowed.
A preference for risky assets
Going into H2 20, we maintain our long-term (12-month) preference for equities, EM bonds,
multi-asset income strategies more broadly, and add corporate bonds to the mix. We expect
these to outperform cash, government bonds and, to a lesser extent, alternative strategies.
Three key assessments are behind our decision to retain a bullish stance, despite the rapid
rebound in risky assets over the past three months. First, equity and credit valuations relative
to government bonds look very inexpensive, suggesting they are unlikely to stand in the way
of further gains. Second, low bond yields also mean outperformance is likely even if absolute
equity and credit returns are somewhat lower than usual. Third, this stance appears consistent
with our baseline scenario that future lockdowns are unlikely to be as severe as in H1 20,
despite rising new COVID-19 cases in some markets. Meanwhile, improving economic
surprises suggest markets have increasingly accounted for the pandemic-induced recession.
2 Investment strategy

Global Market Outlook 4
Fig. 1 Economic data have stopped disappointing as
lockdowns gradually ease
Fig. 2 Equities are not universally expensive; metrics
incorporating low bond yields argue equities are cheap
Oxford lockdown stringency index (lines) vs global economic
surprise index (bars)
Global equity (MSCI AC World index) valuation metrics; current and
median levels as percentile of historical (2002-current) range
Source: Bloomberg, Standard Chartered Source: Bloomberg, FactSet, Standard Chartered
Equites or credit, or both?
When considering exposure to risky assets, we believe there
is merit in having a slight preference for credit over equities.
The Fed’s actions to cap Treasury and Investment Grade (IG)
bond yields means the gap in their yields with riskier bonds
remains wide relative to history. In our view, this is likely to
renew the ‘search for yield’ that has been very supportive of
corporate and EM bonds in the past.
Within bonds, we prefer Global HY, EM USD government and
Asia USD bonds. We also maintain a preference for multi-
asset income strategies which, as the chart illustrates, offer a
very competitive yield relative to comparable asset classes.
Fig. 3 Riskier income assets have room to outperform
Yields across major ‘income’ asset classes
Source: Bloomberg, Standard Chartered; see page 55 for the composition of
the Multi Asset Income allocation.
Of course, an improved economic growth outlook and
tentatively bottoming earnings expectations are positives for
equities as well. Current valuations should not be a hurdle if
history is a guide. As the chart illustrates, the P/E ratio is
expensive, but this is not unusual after recessions as earnings
get revised down. However, the dividend yield-to-bond yield
ratio – incorporating today’s low bond yields – appears cheap.
Regionally, we prefer the US, Asia ex-Japan and the Euro
area, with the latter offering potential for a catch-up rally if
fiscal stimulus in Europe is coordinated and centralised.
A weaker USD
We believe the USD is set to weaken over the coming 12
months. The EUR, AUD and GBP are likely to be the biggest
beneficiaries because of relative rate differentials, improved
risk appetite and relatively high USD valuations.
Generally, a weaker USD is a positive for EM assets. Within
equities, we believe, Asian EM equities are better positioned
to benefit from this. In EM bonds, modest currency gains will
likely be insufficient for local currency bonds to outperform
their USD peers given lower yields.
What could go wrong?
It is possible that the economic recovery is considerably faster
than expected. Equities would likely outperform credit in this
scenario, but risky assets are likely to broadly do well,
especially if bond yields stay low.
Conversely, a slower-than-expected recovery would arguably
lead to greater differentiation within risk assets. Higher quality
credit would likely still outperform cash and bonds, but assets
further up the risk ladder, such as equities and HY bonds, may
be at greater risk of underperformance.
In terms of downside risks, the main challenge is any renewed
COVID-19 surge in major economies. A rise in cases alone
could trigger a temporary pullback, but a return of widespread
lockdowns would pose a bigger risk.
Geopolitics remains a constant risk for markets, especially
any significant escalation in US-China tensions, such as a
break in the trade deal. US elections in November can also be
a source of short-term (three-month) volatility.
We would incorporate these risks into our strategy in two
ways: first, via gold – we see it as preferred given today’s low
bond yields, but it has also demonstrated outperformance
relative to risk assets during sharp equity drawdowns.
Second, by using any rebound in volatility to generate income.
History suggests surges in volatility can be very short-lived
and provide attractive opportunities to generate a yield.
-100
-50
0
50
100
Jan-20 Feb-20 Mar-20 Apr-20 May-20 Jun-20
Ox
ford
str
ing
en
cy in
de
x
Citi global economic surprise index China
Germany US
?
0
20
40
60
80
100
P/E ratio P/B ratio Bond yield -dividend yield (%)
Pe
rce
nti
le
LT average Current
Moreexpensive
0.0
2.0
4.0
6.0
8.0
Glo
bal H
Y
EM
US
D(g
ovt.
)
Multi-
asse
tin
co
me
EM
lo
ca
lcu
rre
ncy
(go
vt.
)
SP
X s
ell-
pu
tyie
lds
Asia
US
D
Glo
bal IG
G3
go
vt.
Cu
rre
nt
yie
ld (
%)
2
Global Market Outlook 5
Fig. 4 Our tactical asset allocation views (12m) USD
Asset class Sub-asset class Relative outlook Rationale (+ Positive factors II – Negative factors)
Multi-asset Strategies
Multi-asset income ▲
+ Bond yield capped, still-wide credit spreads || - Equity volatility
4-5% yield remains achievable by a diversified allocation, in our view
Multi-asset
balanced ◆ + Diversification benefits || - Equity volatility
Equity tilt means near-term volatility a risk, but long-term valuations a help
Alternatives ◆ + Diversifier characteristics || - Equity, corporate bond volatility
Diversifier characteristics help amid volatility
Equities
US ▲
+ Low bond yields, growth rebound || - Geopolitics, COVID-19
Exceptional policy response bearing fruit, but COVID-19 remains a risk
Asia ex-Japan ▲
+ Low bond yields, weak USD || - Geopolitics
Low yields, weak USD are positives, but US-China tensions a key risk
Euro area ▲
+ Low bond yields, policy support || - Geopolitics
An agreement on EU-wide fiscal stimulus would be a positive
Japan ◆
+ Low bond yields, high cash levels || - Reduced buybacks
High corporate cash a positive, but few catalysts for sustained rally
Other EM ◆
+ Inexpensive valuations || - Deteriorating earnings outlook
Commodity price weakness, global trade uncertainty a key risk
UK ▼
+ Attractive valuations || - Brexit, lagging earnings rebound
Valuations remain attractive, but Brexit, falling dividends are headwinds
Bonds
DM HY corporate ▲
+ Attractive yield, attractive value || - Credit quality
Yields and valuations attractive, but rise in defaults is key risk
EM government
(USD) ▲ + Attractive yield, attractive value || - Sentiment to EMs a risk
Higher yields than local currency peers illustrate attractive value
Asian USD ▲
+ Moderate yield, low volatility || - Risk of slower China recovery
High credit quality, low volatility are attractive, but China exposure a risk
EM government
(local currency) ◆ + Moderate yield, weak USD view || - FX volatility
Supportive policy, weak USD positive, but falling yields have reduced value
DM IG corporate ▼
+ Moderate yield, policy support || - Deteriorating credit quality, value
Central banks very supportive, but little value left
DM IG government ▼
+ High credit quality, policy support || - Low yields
Rebound in growth, inflation expectations a risk
Currencies
AUD ▲
+ Policy stimulus, growth rebound || - Geopolitics
AUD remains good proxy for China growth rebound
EUR ▲
+ Policy stimulus, growth rebound || - Geopolitics
Progress on agreeing EU-wide stimulus would be a positive
GBP ▲
+ Undervaluation, eventual Brexit deal || - Brexit deal failure a risk
Coordinated policy stimulus a positive, but Brexit a key source of uncertainty
JPY ◆
+ Safe-haven demand, real yields || - Japanese foreign asset demand
JPY caught between global safe-haven status and outflows seeking returns
CNY ◆
+ Policy stimulus, growth rebound || - Low global demand, debt risk
Policy focus on stability likely to keep CNY range-bound
USD ▼
+ Safe-haven demand || - Falling rate differentials, Fed liquidity
Rising confidence in global recovery likely to reduce demand for USD
Source: Standard Chartered Global Investment Committee
Legend: ▲ Preferred ◆ Core holding ▼ Less preferred
2

Global Market Outlook 6
How do we come up with our “net assessment”?
In every section of our publication, investors will find a table presenting key opposing arguments regarding the outlook as well
as our “net assessment” represented by a sliding scale like the one below.
SCB’s net assessment
[xx to outperform]
[xx to underperform]
Source: Standard Chartered Global Investment Committee
This “net assessment” is a key component of our Global Investment Committee’s process for setting expectations for key macro
developments and asset classes. It is rooted in embracing the greatest possible diversity of viewpoints and expertise and is
informed by the most effective practices that address the risks posed by conformity and collective biases.
Our process starts by curating and organising the most diverse range of macro and market views from leading research
boutiques, banks and asset management companies. In addition, we search for similar historical situations or context. We do
not impose a way of looking at economics, markets or geopolitics. Each member is asked to assess the relevance and merits of
each information he or she has been provided. Through a proprietary process developed over the last 8 years, we aggregate
these views into a GIC Net Assessment that drives our expectation.
Fig. 5 Performance of key themes since Outlook 2020
Summary of open themes below
Asset class Open date
Level 1
Gold to outperform other level 1 asset classes 13-Dec-19
Global equities to outperform other level 1 asset classes 13-Dec-19
Cash to underperform other level 1 asset classes 13-Dec-19
Bonds
EM USD government bonds to outperform global bonds 13-Dec-19
Asia USD bonds to outperform global bonds 13-Dec-19
DM IG government bonds to underperform global bonds 26-Mar-20
DM IG corporate bonds to underperform global bonds 29-Jun-20
DM HY corporate bonds to outperform global bonds 29-Jun-20
Equities
US equities to outperform global equities 13-Dec-19
Asia ex-Japan equities to outperform global equities 28-Feb-20
Euro are equities to outperform global equities 29-Jun-20
UK equities to underperform global equities 29-Jun-20
Currencies
GBP to strengthen against the USD 13-Dec-19
USD to weaken 13-Dec-19
EUR to strengthen against the USD 26-Mar-20
AUD to strengthen against the USD 26-Mar-20
Summary of performance of open themes
Absolute 2 Relative 3
Absolute 2 Relative 5
Source: Bloomberg, Standard Chartered
Performance measured from 13 December 2019 (release date of our 2020 Outlook) to 29 June 2020 or when the view was closed
Legend: - Correct call; - Missed call; NA - Not Applicable; Past performance is not an indication of future performance. There is no assurance, representation
or prediction given as to any results or returns that would actually be achieved in a transaction based on any historical data.
2
5 4 3 2 1

Global Market Outlook 7
As part of our Investment Philosophy, we strive to achieve diversity of insights by constantly monitoring a wide array of investment
views and analysis. This part of our process is what we call the Inside View, where we gather lots of research and analysis,
consider the specifics of the situation, and combine them with our analysis of historical probabilities - the Outside View – to
create scenarios for the future.
The below charts show the percentage of investment research (broker and independent) houses and asset management
companies who are Overweight, Underweight and Neutral on different asset classes.
Cash OUR VIEW Government bonds OUR VIEW
UW UW
Credit OUR VIEW Equities OUR VIEW
OW OW
Alternatives* OUR VIEW Gold OUR VIEW
N OW
Source: Standard Chartered Global Investment Committee
*Alternatives represent a combination of views on liquid and private alternative strategies, as well as real estate
0%
20%
40%
60%
80%
100%
Ja
n-1
9
Feb
-19
Mar-
19
Apr-
19
May-1
9
Ju
n-1
9
Ju
l-19
Aug
-19
Sep
-19
Oct-
19
No
v-1
9
De
c-1
9
Ja
n-2
0
Feb
-20
Mar-
20
Apr-
20
May-2
0
Ju
n-2
0
OW N UW
0%
20%
40%
60%
80%
100%
Ja
n-1
9
Feb
-19
Mar-
19
Apr-
19
May-1
9
Ju
n-1
9
Ju
l-19
Aug
-19
Sep
-19
Oct-
19
No
v-1
9
De
c-1
9
Ja
n-2
0
Feb
-20
Mar-
20
Apr-
20
May-2
0
Ju
n-2
0
OW N UW
0%
20%
40%
60%
80%
100%
Ja
n-1
9
Feb
-19
Mar-
19
Apr-
19
May-1
9
Ju
n-1
9
Ju
l-19
Aug
-19
Sep
-19
Oct-
19
No
v-1
9
De
c-1
9
Ja
n-2
0
Feb
-20
Mar-
20
Apr-
20
May-2
0
Ju
n-2
0
OW N UW
0%
20%
40%
60%
80%
100%
Ja
n-1
9
Feb
-19
Mar-
19
Apr-
19
May-1
9
Ju
n-1
9
Ju
l-19
Aug
-19
Sep
-19
Oct-
19
No
v-1
9
De
c-1
9
Ja
n-2
0
Feb
-20
Mar-
20
Apr-
20
May-2
0
Ju
n-2
0
OW N UW
0%
20%
40%
60%
80%
100%
Ja
n-1
9
Feb
-19
Mar-
19
Apr-
19
May-1
9
Ju
n-1
9
Ju
l-19
Aug
-19
Sep
-19
Oct-
19
No
v-1
9
De
c-1
9
Ja
n-2
0
Feb
-20
Mar-
20
Apr-
20
May-2
0
Ju
n-2
0
OW N UW
0%
20%
40%
60%
80%
100%
Ja
n-1
9
Feb
-19
Mar-
19
Apr-
19
May-1
9
Ju
n-1
9
Ju
l-19
Aug
-19
Sep
-19
Oct-
19
No
v-1
9
De
c-1
9
Ja
n-2
0
Feb
-20
Mar-
20
Apr-
20
May-2
0
Ju
n-2
0
OW N UW
4 Major brokers’ and investors’ views

Global Market Outlook 8
Economic activity has been set back globally by the COVID-19 pandemic, triggering the deepest recession for major economies
since the Great Depression of the late 1920s. This came on the back of below-trend economic growth and inflation that
characterised the very anaemic recovery since the financial crisis of 2008-2009. A debate has now opened about what should
be expected for growth and inflation over the next three to five years. As much as we would like to offer a definitive answer, the
reality is that the eventual outcome will depend very much on the actual evolution of a number of key drivers over the coming
years. We can, however, help frame expectations by presenting the various views on the future evolution of these key drivers.
• Current consensus expectations for global growth over the next three to five years (2.0%) indicate a weak outlook compared
to history. Any adverse evolution would be a surprise, with negative implications for credit and equity assets, while any growth
acceleration would be positive. Our Global Investment Committee’s (GIC) net assessment is slightly above consensus on US
and Euro area growth and slightly below consensus on China growth in the next 18 months.
• Meanwhile, consensus expectations for inflation over the next three to five years (2.0%) indicate a benign environment. Any
faster evolution would be a surprise with negative implications for fixed income assets. Over the next 18 months, our Global
Investment Committee’s net assessment for inflation is lower than consensus.
The economic growth outlook balance sheet
A useful way to think about the long-term economic growth potential of an economy is to define it as a function of the growth in
the labour force, capital stock and productivity.
Driver Arguments supporting stronger growth Arguments supporting weaker growth
Labour force
growth • Policymakers in major economies are taking steps to
increase the labour force participation rate (e.g. China’s
hukou reforms, Abenomics encouraging women to enter/re-
enter the workforce)
• Working age population have started on a long-term
downtrend in major economies since the mid-2010s
• If the 1918 flu pandemic is a guide, population growth rates
could decline in the aftermath of COVID-19
Capital
growth • Decoupling of global supply chains could lead to domestic
investment to replicate those supply chains closer to home
• Increasing investment in automation as a substitute for
rising wage costs
• COVID-19 has reduced businesses’ ability and willingness
to invest
• Current fiscal stimulus measures are supporting operational
and living expenses, but not investments
Productivity
growth • Incorporation of new technology and processes into newly
on-shored supply chains should support productivity
• The end of globalised, optimised global supply chains to
lead to reduced productivity growth
• Productivity growth was trending lower pre-COVID-19 crisis
Household
spending • High precautionary savings today could see a release of
pent-up demand in future in advanced economies as
lockdowns are lifted
• Chinese consumers could replace US consumers as the
global consumer-of-last-resort
• Consumers save more due to job/income losses post-crisis.
Unemployment tends to rise quickly in a crisis, but recedes
only gradually as ‘temporary’ job losses turn permanent
• Consumer confidence to remain fragile until a vaccine is
widely available
• Higher inequality lowers an economy’s aggregate
propensity to spend, since wealthier households tend to
have a higher savings rate
Corporate
spending • Timely and aggressive policy support has saved many
businesses from bankruptcy
• New wave of disinflation to lower overall cost of borrowing
for businesses
• Bail-out measures may over-burden firms with debt, leading
to their eventual insolvency once debt-servicing costs rise
• The corporate sector already had a high debt load going
into the crisis; it has limited ability to take on more debt and
is not well-positioned for deflation
• Politics may turn leftward, implying more taxation and
regulation that may depress investments
Government
spending • Policymakers have demonstrated willingness to increase
government spending after COVID-19
• Monetary authorities able to support high public debts with
very low interest rates and/or unconventional policy without
triggering bond market meltdowns (see pages 10-11)
• High public debt burdens to drain future revenue and
constrain future spending
• Risk of policymakers prematurely tightening fiscal or
monetary policy – a potential trigger is an oil price rebound
leading to higher inflation and bond yields
Trade • China-US trade war and COVID-19 prompting a move to
self-sufficiency among countries, reducing global trade
Source: Standard Chartered, various third-party perspectives
19 Risks to long-term growth and inflation

Global Market Outlook 9
The inflation outlook balance sheet
There are various frameworks used to assess an economy’s long-term inflation prospect, the most common ones being:
monetary-driven, demand-driven and cost-driven inflation.
Driver Arguments supporting lower inflation Arguments supporting higher inflation
COVID-19 is a
global public
health crisis
• Any supply shortages due to the COVID-19 pandemic
are expected to be temporary. Demand effects that
reduce consumers' ability or willingness to purchase
goods and services are far more long-lasting
• The COVID-19 pandemic crisis was triggered by a public
health crisis, instead of imbalances in the economy or
financial system. Hence, it can be a sharper, but shorter,
recession with a V-shaped recovery, triggering inflation
Monetary
policies • Monetary stimulus can no longer trigger a renewed
credit boom. This is reflected in the collapse of the
money multiplier and muted money velocity. In a falling
interest rate environment, there are fewer incentives
for commercial banks to use reserves created by
monetary stimulus for new loans and credits
• When interest rates fall to zero, the size of a central
banks’ balance sheet is less relevant to the generation
of aggregate demand
• Central banks, especially the Fed, will likely stay hyper-
accommodative to revive the economy and have become
more tolerant of inflation overshoots
• In this cycle, the financial system is in better shape and will
likely translate monetary support to higher monetary velocity
and credit creation
Fiscal policies • Many non-recurring stimulus programmes and
packages announced will have no lasting impact on
inflation
• The process of unwinding expansionary fiscal policies
can add to deflation risks
• The scope and scale of fiscal expansion, in coordination with
monetary policies, should stimulate aggregate demand, lifting
future growth and inflation
• Direct government support to firms and households could lead
to higher spending, reviving velocity of money and inflation
Trade and
globalisation • Unwinding of global value chains can take decades to
be implemented, so disinflationary pressures from
globalisation could last for a while longer
• China's growing dominance as a source of FDI for
other EMs likely to support globalisation, sustain
disinflationary pressures
• Retreating globalisation can accelerate as companies focus
on supply chain security and re-evaluate the commercial
benefits of offshoring production, while governments imposing
stricter immigration regimes could revive wage pressures
• Higher tariff rates, rising non-trade barriers can become a
global phenomenon, pushing production costs higher
Inflation
expectation • A sharp fall in oil prices can drive short-term and long-
term inflation expectations lower
• Low and stable actual inflation leads to low dispersion
in inflation expectations and acts as an anchor for
long-term expectations
• Shocks from energy prices have been shown to have minor
implications for future inflation expectations, while shocks to
food prices have a more measurable and persistent impact on
both short- and long-term inflation expectations
Savings rate • Propensity to save is likely to remain high, especially
in higher income households, capping inflation
• Greater “fear” of the unknown will impact short-term
expectations, which can then become self-
perpetuating in the long term. Hence, precautionary
savings will continue to rise post pandemic
• A faster-than-expected economic recovery would lead to
improved job market, encouraging households to spend again
and reduce precautionary savings
Political • Pressure to address income inequality likely to intensify. This
means increasing scrutiny on the role of globalised companies
and global trade, which have created disinflationary pressures
• Commitment to reduce jobless rates should be prioritised over
inflation, leading to acceptance of higher inflation
Indebtedness • One possible solution to pay off the high level of public debt is
debt monetisation. This implies monetary policy to remain
easier than economic conditions warrant, which eventually
leads to higher inflation (see pages 10-11)
Demographic • Ageing populations associated with lower structural
(potential) growth and inflation
• Ageing population in the developed world, maturing
urbanisation in China mean desired capital investment
worldwide will stay structurally weak, reviving supply-side
inflation pressures
The case of
“Japanification” • Many developed countries could follow the template of
Japan in which inflation has been stuck below 1%
despite significant fiscal and monetary easing
• This time is different for two reasons (i) the response from
policymakers this time has been faster and bigger than past
crises, preventing inflation expectations from anchoring at
lower levels; (ii) coordinated monetary and fiscal easings are
expected to be sustained, unlike in Japan, building long-term
inflation pressures
Source: Standard Chartered, various third-party perspectives

Global Market Outlook 10
Financing the growing deficit
The record spending by governments worldwide to deal with
the COVID-19 crisis has raised questions about how to
finance the spending in the coming years. How the resulting
government fiscal deficits are financed can impact returns on
a wide variety of assets, not just government bonds.
To address this, we can split economies between those
agents (households, corporates) who have a savings surplus
and those with a savings deficit. The government sits in the
middle and typically levies taxes to fund its expenditure.
These taxes can be raised via traditional measures, including
income, corporate and consumption taxes. Since the
demands on government spending are many, it typically runs
a deficit, financed by those with a savings surplus.
There are four broad ways to finance the deficit1: 1) fiscal
consolidation, 2) economic growth, 3) monetisation, and 4)
financial repression. A summary of historical examples of
each method is highlighted in Figure 8. We analyse one
example from each category in greater detail below.
Fiscal consolidation: Austerity
Governments pursue fiscal consolidation to bring a high
budget deficit back under control. This is often referred to as
austerity and is achieved by either reducing the level of
government spending or raising taxes. Pursuing austerity in a
counter-cyclical fashion, that is reducing the deficit during
times of above-trend economic growth, is generally viewed as
prudent and less painful than doing it during periods of
economic hardship. However, as the example of European
austerity between 2013 and 2019 showed, when pursued
during periods of below-trend economic growth, the impact
can lower growth potential even further.
Austerity tends to favour households and corporates with
excess savings.
Growth: Economic reforms
Economies stuck in low growth with high levels of domestic
debt can pursue economic reforms to boost growth and keep
inflation in check. Reforms can reduce barriers to entry and
promote competition, which lowers the costs of goods and
services. As inflation expectations decline, interest rates can
fall, reducing the government’s interest expenses. Higher
economic growth should also boost tax revenues, which can
reduce the budget deficit and the debt-to-GDP ratio over time.
Economic reforms also tend to be favourable to
households and corporates with excess savings.
1IMF paper: Reducing debt short of default
Fig. 6 Interest rates above the economic growth rate will drive
an exponential increase in debt to GDP over time
Source: BCA, Standard Chartered
Financial repression: Interest rates below the
economic growth rate
Financial repression involves keeping interest rates artificially
below the rate of economic growth in an economy, to try and
achieve a faster pace of growth, even at the risk of higher
inflation (to increase the denominator of the debt-to-GDP
ratio). Households and corporates with high levels of cash see
the real value of their savings decline, pushing investors to
search for higher income and/or returns in riskier assets (see
Figure 6).
This route tends to favour household and corporate
borrowers and those with exposure to financial assets.
Fig. 7 US interest costs have declined, despite a rising debt-
to-GDP ratio
Source: The Collaborative Fund, Standard Chartered
Monetisation: Modern Monetary Theory (MMT)
MMT is a form of money creation that starts from the view that
the government has a unique role to create money via
spending it and that a government borrowing in its own
currency cannot be forced to default as it can create money.
MMT tends to favour household and corporate borrowers
and those with exposure to financial assets.
0
1,000
2,000
3,000
4,000
5,000
6,000
7,000
%Time
When r is above g, the debt-to-GDP ratio will increase exponentially over time. When r stays below g, a fiscal deficit will produce a more stable debt-to-GDP ratio in the long-term.
Different levels of interest rate, r, and GDP growth rate, g
r = 3%, g = 1%
r = 1%, g = 3%
0%
20%
40%
60%
80%
100%
120%
140%
0.0
0.5
1.0
1.5
2.0
2.5
3.0
3.5
19
39
19
43
19
47
19
51
19
55
19
59
19
63
19
67
19
71
19
75
19
79
19
83
19
87
19
91
19
95
19
99
20
03
20
07
20
11
20
15
20
19
Interest as a % of GDP Debt/GDP ratio (RHS)
20 How to fund the fiscal stimulus?

Global Market Outlook 11
Fig. 8 How to fund the stimulus– an overview
Deficit Financing Policies
Brief description Pros Cons Successful Examples
Less successful examples
Fiscal
Consolidation
Future fiscal
austerity (greater
public saving)
Pursuit of deficit reduction
policies by increasing taxes or
controlling government spending.
This approach
avoids ballooning
of the public debt
Can compound
economic weakness if
growth is below trend
USA 1993-
2001
Euro area
2013-2018
Future taxation of
individuals or
corporates
A pre-emptive signal; taxes are
increased to bring deficit under
control
Reduced
government deficit
May reduce household
and corporate
willingness to spend or
invest
Singapore
(1994) /
Taiwan
(2018)
Japan
(1997) /
Greece
(2013)
Monetisation
Debt monetisation Central banks print money to
facilitate the government's ability
to pay its debts
Ability to pay the
bills in the short
term
Inflation very likely,
potentially hyper-
inflation
Zimbabwe
(2007)
Quantitative easing
or controlling the
cost of debt
servicing
Central banks’ purchases of
government and corporate bonds
from the markets with the goal of
raising money supply, lowering
bond yields and raising
investments
Can offset
deflationary risks.
Creates buyer of
last resort for
bonds
Risk of future inflation
and moral hazard
USA (2008) Japan
(2011)
Defaulting/revoking
the debt
Governments can unilaterally
decide to default on debt owed to
bond holders
Reduction in
outstanding debt
that may be at
unsustainable
levels
Can make future debt
issuance more
expensive
Germany
(1930)
Argentina
(2020 + 8
other
defaults)
Debt forgiveness Lenders can forgive loans made
to a government
Reduction in
outstanding debt
that may be at
unsustainable
levels
If debt burden is
unsustainable,
government will need to
live within its means
Africa /
Jubilee
debt
forgiveness
(2000)
Ghana
(2015)
Government
issued consols
(perpetual bonds)
Deficits funded by perpetual
bonds that have no requirement
to repay the principal
No requirement to
repay debt
This is a more
expensive form of
finance in the short term
compared to traditional
bonds
Austria
(100 year
bonds).
Consols in
US and UK
Argentina
(100 year
bonds)
Modern Monetary
Theory (MMT)
Form of money creation that
unburdens governments from
requirement to repay the liability
(cash is a government liability).
Three criteria for successful
MMT:
1) poor economic outlook and
failure of alternative policy
options
2) decline in trend growth
forecasts
3) confidence in policy makers
Where an
economic output
gap exists, MMT
could be
successful
MMT could prove to be
inflationary if there is a
loss of confidence.
Strict conditions of
applicability. Untested
only partial
examples
only partial
examples
Financial
Repression
Interest rates
below economic
growth rate
Delivering nominal economic
growth above the government's
funding cost ensures that the
debt burden in real terms
declines over time
Funding of
increased debt
burden is
sustainable
Highly dependent on
quality of government’s
investments. If achieved
by artificially keeping
interest rates below the
rate of growth, it is a
form of financial
repression
China post-
1989
India post-
1991
Growth
Economic reform Reducing the obstacles to growth
in an economy; higher growth
leads to reduced debt-GDP ratio
Positive effect on
growth in the short
term and
potentially long
term if sustained
Potential job losses as
reformed sectors
restructure and
substitute capital for
labour
UK (1980)
Germany
(2000)
Source: Standard Chartered

Global Market Outlook 12
Sustainability in a post-COVID-19 world
The COVID-19 pandemic has taken a hit on our societies and
financial markets, and many nations participated in an
unprecedented large-scale economic, social and
psychological experiment – the lockdown.
The magnitude of the impact and speed of collapse in
economic activity that resulted from this pandemic is
something unseen in our lifetime. China’s economy for
example saw a historic slump, with industrial output plunging
13.5% in January and February from a year earlier and retail
sales falling 20.5% in the first two months of the year.
With less land and air travel and factories coming to a halt, it
is estimated that 2020 will be the year with the largest single
year carbon emissions reduction. Carbon emissions in India
are estimated to have fallen by 30% in April, and in China,
carbon emissions are estimated to have been reduced by
18% between early-February and mid-March.
History tells us that when emissions have fallen sharply in the
past, as is typically the case after recessions, there is often a
sharp rebound that wipes out any short-term reduction
achieved. China’s levels of some air pollutants have already
risen back to above last year’s levels. This rebound is likely
driven by increased industrial activity – Chinese industrial
output in May grew at its strongest rate since the virus was
detected in December.
As countries begin to emerge from lockdowns and economies
are restarting, all eyes are on whether there will be a pivot to
a sustainable way forward.
The spotlight on sustainability issues
Countries have demonstrated that it is possible to reduce
carbon emissions, and many have acknowledged the
corresponding positive impact on the environment. It has,
however, also shone the spotlight on issues, such as social
inequalities and public health, which are being further
exacerbated.
The Sustainable Development Goals (SDGs) are a set of
goals set by the United Nations – as a universal call to action
to end poverty and protect the planet – to be achieved by
2030. Pre-COVID, it was estimated that there was a USD
2.5tn funding gap per year to be filled in order to achieve the
goals by 2030. The world was already falling behind in efforts
to achieve the SDGs prior to the pandemic. Now, more so than
ever, investments are needed from both the public and private
sectors to tackle environmental and societal issues in the
post-COVID world.
Signs of a sustainable way forward
The slogan “Building Back Better” brings together and
engages various parties on how we can rebuild our economy
by building a resilient one. What does “Building Back Better”
look like practically and what should investors look out for as
governments and companies build back better?
Governmental green recovery packages
As many countries have put forth, and continue to unveil, new
massive stimulus packages to cushion the economic impact
of this pandemic, governments are discussing “green
recovery packages”. An Oxford study conducted in May 2020
compared green stimulus packages with traditional stimulus
packages from the 2008 global financial crisis, and evidence
suggests that “green projects create more jobs, deliver higher
short-term returns per dollar spend and lead to increased
long-term cost savings.”
According to Bloomberg, 50 of the world’s largest economies
have committed c.USD 18bn of their pandemic measures to
stimulate lowering carbon emissions, such as in energy-
efficient buildings and sustainable farming. This amount
constitutes less than 0.2% of the stimulus packages put forth
in total by these large economies.
Included in the discussions of these stimulus packages are
government bailouts, and the EU is strongly recommending
that governments attach “green strings” to bailouts, especially
when it comes to airlines.
In Asia, we also see that, as part of the Hong Kong
government’s plan to boost economy, the Green Employment
Scheme was launched to create 500 time-limited jobs in
electric vehicle popularisation, waste reduction and recycling.
Pivoting and transformative companies
After the 2008 global financial crisis, the US put forth a
stimulus package supporting a green energy economy,
whereby, for instance, industry-leading, innovative companies
were born out of this legislation. The COVID-19 pandemic
brings hope for a more vigorous “green energy” economic
repeat of the post-2008 success stories on a larger and more
global scale.
On the one hand, operational transformations within
corporations accelerated during the pandemic as companies
have been forced to adjust and invest in technological
infrastructure. Mass working-from-home has now become a
feasible reality, and conversations continue to evolve from
“work from home” to “work from anywhere”.
23 Sustainable investing post COVID-19

Global Market Outlook 13
Moreover, some companies have also radically pivoted from
their business models, shifting into new market lines (e.g. self-
driving cars for food deliveries, fitness companies shifting
workouts to online, and many more).
On the other hand, firms are also taking the transformation
deep to the core. For example, a large global food producing
firm will propose at their upcoming annual general meeting
(AGM) to become the first-ever listed company to have
“business with a purpose” written in their articles of
association. This will oblige the company to focus on long-
term objectives in the social, societal and environmental
fields.
Continued growing interest in sustainable
investing
In our recent “Standard Chartered Sustainable Investing
Review 2020” survey, we found that despite recent pandemic
disruptions, the interest in sustainable investment continues
to grow. Over the next three years, 43% of investors in Asia
said they are considering allocating 5-15% of their funds in
sustainable investments with 8% looking to place more than
25%.
Conducted during the time of COVID-19, we find that the
pandemic has raised awareness of sustainable issues in
many ways and the top sustainable investment goals that
investors are interested in are those that offer hope of building
resilience against future crises.
Recent research suggests that the higher correlation between
Environmental, Social and Governance (ESG) attributes and
traditional attributes, such as quality and low volatility, indicate
greater resilience during a downturn.
Driven by both investor interest in sustainability and research
indicating the benefit of ESG integration in the investment
process, the inflow of assets in sustainable funds in Q1 20
was USD 45.6bn. This is compared to an outflow of USD
384.7bn in the overall fund universe.
The pandemic has left nobody unscathed. Economic
uncertainty and disruptions will be on the rise. The post-
COVID-19 world will be shaped by how governments,
companies and investors choose to respond, and whether we
choose to invest in a better future. The amount of investments
needed to address world environmental and social issues is
rather large, and investors, now more than ever, have an
opportunity to play a meaningful role in using their capital to
contribute towards sustainable development.
Fig. 9 Key changes in SDGs that sustainable investors find most motivating
HNW and affluent investors in Asia, who have made a sustainable investment, have redirected their priorities – with “no poverty and “climate
action” ranking high in 2020
Source: Standard Chartered, “Standard Chartered Sustainable Investing Review 2020” survey
2019 2020
Asia
Good Health &
Well-being
Climate
Action
No
Poverty
Climate
Action
Singapore
Affordable &
Clean Energy
Climate
Action
No
Poverty
Responsible Innovation &
Infrastructure
UAE
Responsible Consumption
& Production
Sustainable Cities
and Communities
Affordable &
Clean Energy
Peace, Justice and
Strong Institutions
Hong Kong
Quality
Education
Good Health &
Well-being
No
Poverty
Climate
Action
UK
Good Health &
Well-being
No
Poverty
Affordable &
Clean Energy
Good Health &
Well-being
Global
Good Health &
Well-being
Affordable &
Clean Energy
Good Health &
Well-being
Affordable &
Clean Energy

Global Market Outlook 14
Equity, credit or both?
The pressure on investors to move up the risk spectrum to earn income and/or
achieve returns has rarely been higher, with major government bond yields hovering
around 0% and DM central banks considering negative rates or a form of yield curve
control. This opens a debate about whether investors should raise their risk profile
via equities or credit (i.e. corporate bonds and EM bonds)? Our own assessment of
the various arguments suggests a slight preference for credit over equities, though
both are likely to outperform cash and bonds from here.
Both credit and equities are procyclical assets. The surge in equity markets has
pushed the equity earnings yield-credit yield gap to the lowest level since 2010. This
leads us to view credit as more attractively priced relative to equities, especially since
HY and EM USD credit spreads also remain high (i.e. inexpensive) relative to history.
While equity valuations look expensive on a forward P/E ratio basis, this is unlikely
to hinder further gains on its own. In addition, the fear of “TINA” (There Is No
Alternative) in a zero or negative interest rate environment and any positive
development on a vaccine/cure for COVID-19, could well drive valuations higher.
Fig. 10 Credit tends to outperform equities in the early phase of a recovery
12-month rolling total returns of US HY bonds against US equities
Source: Bloomberg, Standard Chartered; shaded sections mark US recessions
In our view, it appears less likely for equities to outperform credit, given the economic
uncertainties in the absence of a COVID-19 cure or vaccine. Credit could easily eke
out decent single-digit total returns, with some yield premium compression and with
downside limited by policy support. Equities, in contrast, would require more
sentiment/macro surprises to outperform. Additionally, US-China tensions and US
elections are risks as well.
Fig. 11 Is it more attractive to take risk exposure via equities or credit?
Equities to outperform credit Credit to outperform equities
More symmetrical return distribution compared to credit, which has a
fatter downside tail risk during risk-off
Higher return-to-volatility ratio through the cycle, benefits from Fed
buying corporate bonds and Congress policies (guaranteeing loans)
Benefits from low interest rates that in turn support a lower discount
rate and higher equity valuation multiples
Management taking balance sheet-friendly actions, reducing
investments, buybacks and dividends to benefit credit
Benefits from stronger growth and earnings outlook Offers diversification due to lower volatility and correlation to equities
SCB’s net assessment
Equity to
outperform
Credit to
outperform
Source: Standard Chartered Global Investment Committee
-30%
-10%
10%
30%
50%
2000 2002 2004 2006 2008 2010 2012 2014 2016 2018 2020
12
m r
oll
ing
re
turn
s
dif
fere
nc
e
Credit outperforms
Equities outperform
3 Perspectives on key client questions
5 4 3 2 1

Global Market Outlook 15
What are we watching?
We are watching several signposts that inform our investment
framework to determine the current state of affairs as major
economies relax lockdowns. Here we discuss some of them:
Risk of a second COVID-19 wave as economies reopen
As we go to print, new cases of COVID-19 infections are set
to exceed 10m globally. The US trend has flattened slightly,
but new daily cases are rising and have passed April’s peak.
A pronounced rise in second wave remains a risk, but we are
less convinced it will lead to a similar scale of lockdown as the
first wave (which would undermine the pace of the recovery).
Elsewhere, new cases are still rising in EMs (Brazil, India) and
are likely to create an ongoing risk to these markets.
High frequency data point to revival in growth momentum
Mobility trends in the US (especially northeast), Italy, France
and Germany have improved markedly as lockdowns are
progressively relaxed. US consumer spending posted a sharp
18% m/m growth and new homes sales rose 17% m/m in May.
Even in China, which recently re-imposed localised economic
restrictions, activity data has continued to improve. Sentiment
has also picked up, as is evident in the US Regional Fed
surveys and Europe’s ZEW survey moving higher in June.
Improving economic outlook is reflected in a rise in the 12-
month forward consensus global earnings growth estimates
to +1.4%, from -1.8% in end-May.
Fiscal support expected to extend
The US Congress is expected to approve another round of stimulus, with the upcoming exhaustion of business funds secured through Paycheck Protection plan and expiration of the extra USD 600/week jobless benefit by end-July.
Fig. 12 Major governments are expected to continue
extending support to the economy in response to the pandemic
Fiscal support as % of GDP announced so far
Source: IMF, Standard Chartered as of 12 June 2020
*Some estimates for China’s fiscal response reach as high as ~12% of GDP
Policymakers know that failure to act would pose significant
downside risks to the growth outlook. In Europe, policymakers
pledged to agree on the EU recovery fund package by 17 July.
Execution risks remain, with opposition from some members.
Geopolitical risks rising as US election approaches
Rising US-China tensions, as Joe Biden widens his lead over
Trump, is another risk. The US’s targeting of tariffs on the UK,
Europe and Canada is a reminder of geopolitical risks, which
investors will increasingly focus on as US elections draw near.
Overall constructive outlook, with some risks
Loose monetary conditions and growing fiscal policy support
are expected to support the recovery. We believe any
correction in risk assets will be an opportunity to add to our
preferred assets. Strong data and any COVID-19 vaccine or
cure are upside catalysts, while a resurgence of the pandemic
and US-China tensions are key risks to our constructive view.
Fig. 13 Matrix of market stresses, responses and impact on markets as a result of the COVID-19 pandemic
Valuations have come a full circle from expensive, to cheap, to expensive as sentiment improved on economic reopening. Strong rebound in
oil prices on expectations of a resumption in economic activity has buoyed asset prices
Sources of potential market volatility
Valuation Levels
US-China Tensions
US Politics
Consumption
Trade and supply chain ?
COVID-19 Pandemic
Oil Shock
Black Swan ?
Policy Responses
Measures to Contain Virus
Success at Containing Virus
Monetary Policy
Fiscal Policy
Market Reaction
Sentiment
Liquidity
Credit Risk
2020/21 Earnings Expectations
Valuation Levels
Source: Standard Chartered
Legend: Improved Neutral Worse
0
5
10
15
20
25
30
35
Germany Japan Brazil India US China*
Fis
ca
l s
tim
ulu
s
res
po
ns
e, %
of
GD
P
Budgetary Non-budgetary

Global Market Outlook 16
Key themes
Our Global Investment Committee (GIC) expects the world economy to return to growth in Q3 20 after a short-but-deep
contraction in H1 20. Governments are under pressure to reduce near-record unemployment, leading them to ease lockdowns
even as new COVID-19 cases continue to rise in some regions. We expect unprecedented monetary and fiscal stimulus to
support the recovery. China, the first to emerge from lockdowns, is likely to return to its pre-pandemic output levels by H2 20,
while the US and Euro area are likely to recover lost output by end-2021 or early 2022. We expect high unemployment and
growing disinflation pressure to lead policymakers to expand fiscal and monetary stimulus. The key risks to this outlook are a
resurgence of the pandemic and increased US-China tensions in the run-up to a closely-fought US Presidential election.
Key chart
Fig. 14 We expect China GDP to return to pre-crisis level this year; US, Euro area to take longer
GIC’s expectations for GDP levels in US, Euro area & China vs consensus; Index: 100 = end-2019 GDP
Growing pressure on governments
to ease lockdowns and the
unprecedented scale and pace of
fiscal/monetary stimulus lead us to
believe that the global economy
will bounce back in H2 20 and
expand further in 2021
Source: Standard Chartered Wealth Management Global Investment Committee (GIC); Bloomberg
US US to return to growth in Q3 20 after a deep-but-short recession in H1 20 amid unprecedented stimulus
measures; Fed likely to keep rates at record low for at least a year; policy uncertainty before November elections
is a key risk
● Growth ○ Inflation ○ Benchmark rates ● Fiscal deficit
Euro area Euro area to bounce back to growth in Q3 20 after a deep-but-short recession in H1 20 as governments end
years of austerity to implement fiscal stimulus and the ECB plans unlimited debt purchases. We expect more
stimulus to support growth; a planned regional fiscal stimulus package funded by shared debt would be a positive
surprise
● Growth ○ Inflation ○ Benchmark rates ● Fiscal deficit
China China, the first major economy to ease lockdowns, returned to growth in Q2 20 after a rare contraction in Q1 20.
We expect growing credit stimulus and targeted policies to further boost infrastructure spending and consumption
● Growth ○ Inflation ○ Benchmark rates ● Fiscal deficit
Japan
Japan to see a gradual recovery in H2 20 after a prolonged contraction following last year’s sales tax hike and this
year’s pandemic. Weak global trade to dampen outlook, although record fiscal stimulus is likely to limit damage
◐ Growth ○ Inflation ○ Benchmark rates ● Fiscal deficit
UK
UK, the last of the major economies to ease lockdowns, to return to growth in H2 20 amid record low interest
rates and significant fiscal stimulus; uncertainty over post-Brexit trade talks to undermine business investment
outlook
● Growth ○ Inflation ○ Benchmark rates ● Fiscal deficit
Source: Standard Chartered Global Investment Committee views over the next 12 months (12m)
Legend: ○ Weaker/easier in 12m | ◐ Neutral | ● Stronger/higher in 12m
80
90
100
110
US Euroarea
China
End 2019 GIC end 2020 GDP level GIC end 2021 GDP level Consensus Forecast
4 Macro overview – at a glance

Global Market Outlook 17
Record stimulus to support recovery in H2 20
• Net assessment: We expect the US economy to return to growth in Q3 after a recession in H1 as states relax lockdowns.
Renewed hiring, record household savings, targeted stimulus and record-low borrowing costs are likely to lift consumption.
• The unprecedented scale and pace of fiscal and monetary stimulus and robust fundamentals before the pandemic raise the
probability that economic output will return to pre-pandemic levels by end-2021.
• We expect the Fed to keep the benchmark interest rate at the record low of 0-0.25% for at least another year amid
disinflationary pressures to support lending, especially to small businesses. We also expect the government to add to its USD
3trn fiscal stimulus to support states and households, encourage businesses to rehire and prevent bankruptcies.
• Risks: 1) continued rise in infections in the south and/or resurgence of pandemic in the north, which could lead to renewed
shutdowns; 2) policy uncertainty (US-China tensions) ahead of the November election; 3) stimulus not reaching targets or
other policy mistakes, leading to elevated joblessness, weaker-than-expected consumption and corporate bankruptcies.
Fig. 15 How soon will the US economy recover from COVID-19 recession?
Arguments supporting stronger growth Arguments supporting weaker growth
Lockdown fatigue is leading governments to lift restrictions sooner
than expected; renewed hirings likely to revive consumption
High unemployment rate risks dampening outlook for consumption,
especially if the pace of post-pandemic rehiring is slow
Fundamentals were robust pre-crisis (limited signs of demand/supply
or financial excess); record household savings to boost consumption
Economy was slowing before pandemic, with manufacturing and
export-oriented businesses hurt by more than a year of trade war
Prolonged near-zero Fed rates, more targeted credit, fiscal stimulus
for households and small businesses to turbo-charge recovery
Exogenous shock could morph into credit crisis if the virus keeps
spreading, forcing the government to resume economic lockdowns
Oil’s H1 20 price drop is a tax cut for consumers; pandemic shock,
deglobalisation to boost healthcare and technology investments
Policy mistakes, such as early withdrawal of stimulus, or geopolitical
uncertainty (eg. US-China tensions) ahead of November elections
SCB’s net assessment for next 12 months
accelerate
significantly
decelerate
significantly
Source: Standard Chartered Global Investment Committee; * GIC estimates
Fig. 16 Record fiscal/monetary stimulus to support recovery
Fed balance sheet and US fiscal balance as % of GDP
Source: Bloomberg, Standard Chartered
Fig. 17 Consumption likely to rise as the job market improves
US initial jobless claims and US retail sales
Source: Bloomberg, Standard Chartered
-20
-10
0
10
20
30
40
May-07 Aug-10 Nov-13 Feb-17 May-20
% o
f G
DP
Federal Reserve balance sheet US federal budget deficit
-25
-10
5
20
35
50
0
1,000
2,000
3,000
4,000
5,000
6,000
Jun-07 Sep-10 Dec-13 Mar-17 Jun-20
% y
/y
00
0s
Initial jobless claims 4-week moving average
Adjusted retail & food services sales (RHS)
4 US
Turning around
2020 growth* -4.2%
2021 growth* 3.5%
Policy rate 0.25%
5 4 3 2 1

Global Market Outlook 18
COVID-19 Recovery Fund could be a gamechanger
• Net assessment: We expect the Euro area to return to growth in H2 20 based on survey indicators and high-frequency
mobility data. Government stimulus and record-low borrowing costs should aid the recovery, although our Global Investment
Committee assesses it is likely to take another six quarters for the region’s GDP to return to pre-crisis levels.
• For investors, the main focus is on a proposed EUR 750bn COVID-19 recovery plan that will be funded through debt shared
by all 27 EU members, a first for the region. There is a growing likelihood that strong Franco-German support for the plan
could help overcome opposition from some members who are against giving grants to individual members (they prefer loans)
or permanently share the region’s debt. A breakthrough at the EU leaders’ meeting in July would be an important step.
• The ECB’s continued policy support through the expansion of its Pandemic Emergency Purchase Programme (PEPP) by
EUR 600bn, with a pledge to do more, is likely to support liquidity and the growth recovery. National governments, led by
Germany, have reversed a decade of austerity policies and are boosting fiscal support to prop up jobs and consumption.
• Risks: 1) Second COVID-19 wave; 2) Failure to agree on EU Recovery Fund; 3) Failure to achieve a Brexit deal with the UK
Fig. 18 Can Euro area growth recover strongly from the COVID-19 recession?
Arguments supporting stronger growth Arguments supporting weaker growth
The Euro area has been successful in containing the pandemic,
which should allow members to significantly relax lockdowns
Global demand weakness and supply chain disruptions will impact
export-led manufacturing economies, such as Germany
Germany’s end of decade-long fiscal austerity and its additional EUR
130bn fiscal stimulus should provide a boost to regional demand
Fears of further job losses could continue to drive precautionary
savings, negatively impacting discretionary household spending
EUR 750bn proposal to raise common EU debt to fund grants to
weaker members could be a game changer given strong Franco-
German political support, lowering breakaway risks facing the EU
Unemployment is likely to rise further as furlough schemes are lifted
and companies reduce costs, which could weigh on consumption
ECB’s pledge of unlimited stimulus, EUR 600bn expansion of PEPP
should further boost liquidity and support growth in the near term
Continued opposition to the EUR 750bn recovery plan by members
opposed to providing grants could lead to renewed regional instability
SCB’s net assessment for next 12 months
accelerate
significantly
decelerate
significantly
Source: Standard Chartered Global Investment Committee (GIC); *GIC estimates
Fig. 19 Rebound in sentiment indicators signals H2 recovery
Sentix Euro area investor confidence vs Consumer confidence
Source: Bloomberg, Standard Chartered
Fig. 20 ECB to stay accommodative amid weak inflation
ECB balance sheet vs Eurozone core CPI (% y/y)
Source: Bloomberg, Standard Chartered
-25
-20
-15
-10
-5
0
-60
-40
-20
0
20
40
60
Jan-07 Jul-11 Jan-16 Jul-20
Ind
ex
Ind
ex
Sentix investor confidence Euro area aggregate
Consumer confidence (RHS)
0
10
20
30
40
50
0.0
0.5
1.0
1.5
2.0
2.5
Jan-07 Apr-10 Jul-13 Oct-16 Jan-20
% o
f G
DP
% y
/y
ECB balance sheet (RHS) Eurozone core CPI (% y/y)
6 Euro area
Policy progress
2020 growth* -7.3%
2021 growth* 6.0%
Policy rate -0.5%
5 4 3 2 1

Global Market Outlook 19
Policy focus on stabilising jobs and public health
• Net assessment: We expect China to be the first major economy to recover from the COVID-19 shock, with the economy
returning to growth in Q2 20 and output returning to pre-crisis levels by the end of 2020, ahead of the US and Euro area.
Rising credit stimulus targeted at infrastructure building and fiscal and monetary policy easing aimed at job creation are key
drivers.
• For the first time, China’s National People’s Congress did not set an annual growth target, citing COVID-19 uncertainties.
Instead, the government has focussed on stimulus to buffer the impact, including boosting credit growth and a special CNY
1trn tranche of government bonds for “COVID-19 control”. The IMF estimates fiscal deficit to soar to 12.1% of GDP this year.
• Focus is likely to remain on job creation, with urban unemployment around 6%. Policymakers aim to create 9 million new jobs
this year and have included job security as one of the “Six Protections”. This should help support domestic consumption.
• Risks: 1) Second pandemic wave; 2) Slower-than-expected global recovery hurting exports; 3) Renewed US-China tensions
ahead of November US Presidential elections
Fig. 21 Will China’s growth return to pre-crisis level in 2020?
Arguments supporting stronger growth Arguments supporting weaker growth
China’s early relaxation of lockdowns mean businesses have steadily
reopened, with most sectors likely to return to full capacity by Q3 20
The risk of a 2nd COVID-19 wave is an overhang on consumer and
business sentiment and new measures could slow the reopening
Policymakers are supporting households by keeping businesses
afloat and preserving jobs, instead of via direct cash handouts
Households are tending towards precautionary savings instead of
consumption on the back of job/income insecurity
Infrastructure construction has already recovered and can be
expected to accelerate in H2 on the back of targeted credit stimulus
Manufacturing capex is still contracting, and may pick up only when
final demand recovers, rather than due to credit availability
The People’s Bank of China’s new CNY 400bn loan facility can be
expected to improve credit availability to micro & small enterprises
Historically, credit flows have tended to favour large, state-linked
entities; monetary easing tends to take effect with a 2-3 quarter lag
SCB’s net assessment for next 12 months
accelerate
significantly
decelerate
significantly
Source: Standard Chartered Global Investment Committee (GIC); *GIC estimates
Fig. 22 China was the first to recover from COVID-19 shock
Business confidence indicators (PMI) for major economies
Source: Bloomberg, Standard Chartered
Fig. 23 We expect infrastructure spending to support growth
Infrastructure investment growth (% y/y, 3-month average)
Source: Bloomberg, Standard Chartered
10
20
30
40
50
60
Jan-20 Feb-20 Mar-20 Apr-20 May-20 Jun-20
Ind
ex
US Euro area UK
Japan China (Caixin)
-60%
-40%
-20%
0%
20%
40%
60%
Jan-08 Feb-11 Mar-14 Apr-17 May-20
Infr
astr
uctu
re s
pe
nd
ing
&
y/y
3m
ma
5 China
Stability first
2020 growth* 1.8%
2021 growth* 7.5%
Policy (MLF) rate 2.95%
5 4 3 2 1

Global Market Outlook 20
Global recovery to determine the pace of rebound
• Net assessment: We expect Japan’s economy to bottom in Q2 before recovering in H2 as the global economy recovers. An
earlier-than-expected lifting of the state of emergency and larger-than-expected fiscal package are positive for growth.
• However, a weak global economic environment and outlook for global trade is likely to weigh on the recovery, with exports
remaining weak. Weak corporate earnings are also likely to dampen business investment, while a rise in precautionary
household savings could also lead to a sluggish recovery in consumer demand and services spending.
• Although the scale of fiscal stimulus – almost four times the size of that after the 2008 financial crisis - is unprecedented,
stimulus effects on growth could be reduced if households and businesses increase precautionary savings. Furthermore,
issues around the speed of implementation of existing stimulus measures could limit their effectiveness.
• Risks: 1) Resurgence of COVID-19; 2) Weaker-than-expected recovery in global growth; 3) Increased precautionary savings;
4) US-China tensions hurting global trade
Fig. 24 How soon will Japan’s economy recover from the COVID-19 recession?
Arguments supporting stronger growth Arguments supporting weaker growth
Additional USD 1trn stimulus package doubles the size of fiscal
stimulus to 40% of GDP, which should support domestic demand,
prevent large-scale bankruptcies
Slowdown in business investment may intensify as corporate
earnings are set to deteriorate further
Weak inflation, a resilient labour market, cash hand-outs to support
real household income and pent-up demand to support consumption
Decelerating wage growth due to weak demand for labour could
impact consumer spending
BoJ’s pledge to buy unlimited government bonds and significantly
boost purchase of corporate bonds, commercial paper, ETFs and J-
REITs to keep borrowing costs low to support investor sentiment
Stimulus effects could be reduced if funds are saved by households
and companies, which tends to occur during economic downturns
China’s recovery in economic activity and accelerated stimulus to
partially benefit Japan’s exporters
Sluggish outlook for exports due to supply chain disruptions and
weaker demand from trading partners to remain a drag; US-China
tensions ahead of US elections could hurt global trade and sentiment
SCB’s net assessment for next 12 months
accelerate
significantly
decelerate
significantly
Source: Standard Chartered Global Investment Committee; *Bloomberg consensus estimates
Fig. 25 Weak global growth remains a headwind for Japan
Japan’s exports and machine tool orders growth
Source: Bloomberg, Standard Chartered
Fig. 26 Fiscal deficit is set to rise well above 2008-crisis levels
Japan’s annual fiscal balance (% of GDP); 2020F* is IMF forecast
Source: Bloomberg, Standard Chartered; * IMF forecast
-60
-30
0
30
60
90
120
-200
-100
0
100
200
300
Jan-07 May-10 Sep-13 Jan-17 May-20
% y
/y
% y
/y
Japan machine tool orders y/y Japan exports y/y (RHS)
-16
-14
-12
-10
-8
-6
-4
-2
0
20
20
F*
20
19
20
18
20
17
20
16
20
15
20
14
20
13
20
12
20
11
20
10
20
09
20
08
20
07
20
06
20
05
20
04
20
03
20
02
20
01
20
00
Ja
pa
n a
nn
ua
l fi
sc
al
ba
lan
ce
(%
of
GD
P)
82 Japan
Nearing the bottom
2020 growth* -4.9%
2021 growth* 2.5%
Policy rate -0.1%
5 4 3 2 1

Global Market Outlook 21
Emerging from a deep recession
• Net assessment: The UK is the last major economy to relax lockdowns, which means it is likely to bottom late in H1 20,
before returning to growth in Q3 20. We expect concerted fiscal and monetary policies to support a rebound from the deepest
economic contraction in three centuries by H2 20. However, output is likely to return to pre-pandemic levels only in 2021/22.
• The Bank of England’s record-low interest rates and increased bond purchases, combined with the biggest fiscal stimulus
since WWII targeted at small businesses and households should limit bankruptcies and revive jobs, boosting consumption.
• The end of the government’s decade-long fiscal austerity programme and a GBP 600bn infrastructure spending plan could
set the economy on a higher growth path and improve productivity over the medium-to-long-term.
• Risks: 1) 2nd pandemic wave; 2) failure to reach post-Brexit trade deal by 31 December; 3) policy mistake.
Fig. 27 Can the UK bounce back from a deep recession?
Arguments supporting stronger growth Arguments supporting weaker growth
Early, pro-active and concerted fiscal and monetary stimulus
measures should aid an economic recovery in H2 20
UK’s prolonged economic lockdown (now lifted) could lead to
elevated levels of long-term joblessness, weighing on consumption
Targeted stimulus for small businesses to limit bankruptcies, protect
jobs; record-low borrowing costs, BoE bond buying to boost liquidity
COVID-19 delayed post-Brexit talks with the EU on trade relations,
prolonging uncertainty for businesses, dampening investment
Cash grants, mortgage repayment freeze, renewed hiring, increased
healthcare spending, debt guarantees to revive consumption
Failure to reach trade deal with EU before 31 Dec. deadline could
lead to a hard-Brexit, with the UK forced to follow stiffer WTO rules
End of decade-long government austerity, GBP 600bn infrastructure
spending plan likely to lift long-term growth prospects, productivity
Policy mistake, such as early withdrawal of stimulus measures, or hit
to sentiment from possible negative BoE interest rates
SCB’s net assessment for next 12 months
accelerate
significantly
decelerate
significantly
Source: Standard Chartered Global Investment Committee; * Bloomberg consensus estimates
Fig. 28 Record stimulus targeted at households and small
businesses, renewed hiring should help revive consumption
UK retail sales
Source: Bloomberg, Standard Chartered
Fig. 29 The pandemic has delayed talks with EU on a post-
Brexit trade agreement, heightening business uncertainty
Lloyds’ business barometer for the UK
Source: Bloomberg, Standard Chartered
-20.0
-15.0
-10.0
-5.0
0.0
5.0
10.0
Jan-07 Jul-11 Jan-16 Jul-20
% y
/y
UK retail sales
-40
-20
0
20
40
60
80
Jan-07 May-10 Sep-13 Jan-17 May-20
Llo
yd
s B
an
k
bu
sin
ess b
aro
mete
r
7 UK
Focus on post-Brexit talks
2020 growth* -8.3%
2021 growth* 5.8%
Policy rate 0.1%
5 4 3 2 1

Global Market Outlook 22
Normalisation of inventories to support oil price gains
• Net assessment: We expect the WTI oil price to recover to around USD 47/bbl over the next 6-12 months if agreed global
supply cuts are effective and end-user oil demand recovers.
• WTI crude oil prices (measured by the active month futures contract) have recovered remarkably from April’s plunge. The
supply-demand picture has improved markedly as unprecedented fiscal and monetary easing have helped prop up global oil
demand expectations. Meanwhile, production cuts from OPEC+ and elsewhere have reduced storage capacity constraints.
• Supply-side factors are expected to remain supportive, with the extension of OPEC+ production cuts and increased emphasis
on member compliance. US shale oil producers remain key to rebalancing oil markets, given their ability to react quickly to
changes in oil prices. Thus, the marginal cost of production for US shale oil is likely to play a key role in determining oil prices.
• The global outlook for demand is expected to improve as economies reopen and restrictions ease. High-frequency data is
already showing signs of improvement, pointing to a broader recovery in oil product demand across various end-user markets.
This suggests a normalisation of inventory levels is likely, which should translate to a higher oil price over the next few months.
Fig. 30 Will oil prices rise over the next 6-12 months?
Arguments supporting a rise Arguments opposing a rise
Global oil demand should continue its modest recovery as
economies reopen and mobility restrictions ease
A second wave of COVID-19 infections along with renewed mobility
restrictions could derail the recovery in global oil demand
Increased fiscal and monetary stimulus globally remains a backstop
for global oil demand, partly offsetting COVID-19 shock
Investor expectations may have run ahead of a more gradual and still
highly uncertain demand recovery trajectory
Continued OPEC+ discipline and a shift towards a more calibrated
approach should cap global supply
Weaker OPEC+ discipline in maintaining production cuts as
members face rising national budget shortfalls due to lower output
Any short-term rebound in US shale production will likely be
tempered by persistent capital expenditure discipline
US shale fields, currently halted, could restart on the back of further
oil price gains and ongoing fall in breakeven cost of production
SCB’s net assessment of oil price trend in next 12 months
significant
increase
significant
decrease
Source: Standard Chartered Global Investment Committee
Fig. 31 The nascent recovery in US gasoline demand is an
encouraging sign
US DoE implied gasoline demand (mn bbl/day)
Source: Bloomberg, Standard Chartered
Fig. 32 US horizontal oil rigs – a key driver of shale oil
production – appear to have bottomed
WTI crude oil price (USD/bbl), US horizontal rigs (RHS)
Source: Bloomberg, Standard Chartered
5
6
7
8
9
10
11
Jan-17 Sep-17 May-18 Jan-19 Sep-19 May-20
mb
d
US implied gasoline demand
200
300
400
500
600
700
800
900
1000
10
20
30
40
50
60
70
80
Jan-17 Sep-17 May-18 Jan-19 Sep-19 May-20
Rig
s
US
D/b
bl
WTI crude oil US horizontal rigs
102 Crude oil (WTI)
Recovery underway
5 4 3 2 1

Global Market Outlook 23
Key themes
We view Credit (ie. bonds that offer a yield premium over government bonds) as a preferred holding, despite the stellar returns
seen over the past three months. While the pace of gains are likely to be slow, historically, Credit has delivered superior risk-
adjusted returns in recovery phases of the business cycle owing to falling volatility and improving credit fundamentals following
more bondholder-friendly actions. Rates (ie. government bonds) are less preferred given the low yields on offer, especially in
DMs.
DM HY bonds are a preferred holding as the increase in oil prices and the attractive yield on offer should help them outperform
over the next 12 months. EM USD government and Asia USD bonds remain preferred holdings as we continue to like their
attractive yields and diversification value, and high credit quality and superior volatility-adjusted returns, respectively.
Key chart
Fig. 33 Credit offer an attractive risk-reward trade-off and generally outperforms rates during an
economic recovery phase
Left chart: Current yield and 30-
day volatility
Right chart: Total returns of
various bond asset classes 12
months after equity market
bottom during GFC
Source: Citigroup, J.P. Morgan, Barclays, Bloomberg, Standard Chartered. As of 23 June 2020.
Pre
fere
nce o
rder
DM HY corporate
▽ ◇ ▲
We view DM HY bonds as a preferred holding as their attractive yield and somewhat cheap valuations
should help them outperform. Higher-than-expected defaults is the key risk.
● Attractive yield ● Valuation vs govt bonds ○ Credit fundamentals
EM USD government
▽ ◇ ▲ ▲
EM USD government bonds are a preferred holding, owing to their attractive yield and valuations. A
sharp deterioration in EM risk sentiment is a risk for EM bonds.
● Valuation vs govt bonds ◐ Macro factors ● Rates policy
Asia USD
▽ ◇ ▲
We view Asia USD bonds as a preferred holding given their relatively high credit quality, moderate yield
and defensive characteristics. A slower-than-expected recovery in China is a risk.
● Credit fundamentals ◐ Macro factors ● Valuation vs govt bonds
EM local currency
▽ ◆ △
EM local currency bonds are a core holding as their reasonable yield, supportive EM central bank policies
and our expectation of EM FX strength are balanced by higher volatility and less attractive valuations.
● FX outlook ◐ Macro factors ◐ Rates policy
DM IG corporate
▼ ◇ △ △
We view the asset class as less preferred. In our assessment, the supportive central bank policies and
reasonable valuations are offset by the deterioration in credit fundamentals and better value elsewhere.
◐ Valuation vs govt bonds ○ Credit fundamentals ◐ Macro factors
DM IG government
▼ ◇ △
DM IG government bonds are less preferred. Their high credit quality and supportive central bank policy
are offset by the low yields they offer. A renewed growth slowdown is an upside risk for this asset class.
● Rates policy ◐ Macro factors ○ Valuation
Source: Standard Chartered
Legend: ▲ Most preferred | ▼ Less preferred | ◆ Core holding | ○ Not supportive | ◐ Neutral | ● Supportive | ▭ Key driver
EM USD sov ereigns
EM LC sov ereigns
DM HY corporates
Asia USD
DM IG corporates
DM IG sov ereigns0
2
4
6
8
0 2 4 6 8 10
Yie
ld (
%)
30d volatility (%)
0
10
20
30
40
50
60
70
The great recession
%
DM HY corp EM USD gov Asia USD DM IG corp EM LCY gov DM IG gov
Bonds | Equity | FX | Alternatives | Multi-Asset
5 Bonds – at a glance

Global Market Outlook 24
Attractive yields and improving economic fundamentals should lead to lower yield premiums
• Net assessment: We view DM HY bonds as attractive relative to other bonds from a yield, valuation and risk perspective,
and score them as “preferred” on a 12-month horizon.
• While their yield premiums have declined sharply since their March peak, DM HY bonds remain significantly higher than their
historical average. A renewed search for yield should also help their yield premiums decline further, leading to capital gains
in addition to the attractive 7.0% yield on offer. The gradual economic reopening of the US and Europe and easy central bank
policies are supportive as they reduce risks of additional credit stress, in our assessment.
• Our assessment recognises that higher-than-expected default rates and new infection waves remain key risks to our view.
Fig. 34 Will DM HY corporate bonds outperform?
Arguments supporting outperformance Arguments supporting underperformance
Attractive yield of nearly 7.0%, higher than most other bond asset
classes.
Sharp slowdown in corporate earnings and increase in funding costs
for weaker borrowers have led to an increase in default rates. Default
rates could climb close to double-digits over the next 6-12 months.
Our base case of a global recovery in H2 20 should support the
asset class and lead to lower yield premiums (and higher bond
price). Bondholder-friendly corporate actions likely to be supportive.
Current yield premiums are pricing in a high single-digit default rate.
Yield premiums may rise if defaults exceed market expectations or if
recovery rates remain below their historical average.
Supportive policies from the Fed and ECB. While they are not
directly buying HY bonds, the ETF purchases have helped sentiment
and reduced borrowing costs.
Credit quality continues to deteriorate as leverage is likely to
increase. Rating downgrades continue to outpace upgrades.
Increase in oil prices has helped ease the stress on energy sector.
Our expectation of higher oil prices is supportive for the asset class.
SCB’s net assessment
outperform
other bonds
underperform
other bonds
Source: Standard Chartered Global Investment Committee
Fig. 35 Slower pace of rating downgrades going forward to
support HY bonds
Quarterly rating upgrades and downgrades for US HY bonds by
S&P, Moody’s and Fitch
Source: Bloomberg, Standard Chartered
Fig. 36 Increase in oil prices has helped energy sector bonds
rally sharply over the past few months
US HY bonds and US HY energy sector bond yield premiums over
US Treasuries and the gap between the two
Source: Bloomberg, Standard Chartered
-1,200
-1,000
-800
-600
-400
-200
0
200
2019 Q3 2019 Q4 2020 Q1 QTD
Nu
mb
er
of ra
tin
g a
cti
on
s
Moody's S&P Fitch
0
200
400
600
800
1,000
1,200
1,400
0
500
1,000
1,500
2,000
2,500
Jan-19 Jul-19 Jan-20 Jul-20
Spre
ad
dif
fere
nc
e (
bps
)
Sp
read
(b
ps)
Spread difference (RHS) HY energy US HY corp
Bonds | Equity | FX | Alternatives | Multi-Asset
CREDIT
2 Developed Market High Yield
corporate bonds
Preferred Holding – Attractive yield on offer
Current yield 7.0%
Spread over UST 6.6%
Average credit BB-
5 4 3 2 1

Global Market Outlook 25
EM USD bonds offer geographical diversification and cheap valuations
• Net assessment: We view EM USD government bonds as attractive relative to other bonds from a yield, valuation and
diversification perspective and score them as “preferred” on a 12-month time horizon.
• The asset class offers cheap valuations and geographical diversification which, in our assessment, offsets the high number
of new COVID-19 cases in a few major EMs. Additionally, vulnerability indicators show that, on average, EM countries are
better placed to withstand external shocks than during previous crises. Higher commodity prices should also be a support.
• An increase in defaults or debt restructuring, or failure by key EM countries to control COVID-19 are key risks to our view.
Fig. 37 Will EM USD government bonds outperform?
Arguments supporting outperformance Arguments supporting underperformance
Yield premiums (a measure of valuation) are substantially higher
than historical average. We expect yield premiums to decline
meaningfully.
High likelihood of elevated defaults or debt restructuring by weaker
EM countries, similar to the recent experience with Argentina,
Lebanon and Ecuador.
Currently offer a higher yield than EM local currency government
bonds, despite not being subject to FX volatility.
Slower-than-expected recovery in DMs could hurt EM prospects,
especially in the manufacturing sector.
Offer geographical diversification with exposure to over 70 countries,
reducing potential vulnerability to an individual country.
Potential for increase in supply from EM HY issuers once the
markets open up for them.
Increase in commodity prices, as more governments provide
infrastructure stimulus, is a positive, as EM countries are net
commodity exporters. Aggregate external vulnerability is lower than
past crises.
SCB’s net assessment
outperform
other bonds
underperform
other bonds
Source: Standard Chartered Global Investment Committee
Fig. 38 EM USD government bonds offer attractive yield
premiums compared to their history
JP Morgan EMBI Global Diversified Index yield premium
Source: Bloomberg, Standard Chartered
Fig. 39 EM USD government bonds offer diversified exposure
to over 70 countries
JP Morgan EMBI Global Diversified bond index composition
Source: Bloomberg, Standard Chartered
2
4
6
8
10
Jan-08 Jul-10 Jan-13 Jul-15 Jan-18 Jul-20
%
EM USD bond yield premium Mean yield premium
Af rica12%
Asia19%
Europe20%
Latin America
31%
Middle East18%
Bonds | Equity | FX | Alternatives | Multi-Asset
CREDIT
2 Emerging Market USD
government bonds
Preferred holding – Diversification and cheap valuation
Current yield 5.5%
Spread over UST 4.8%
Average credit BBB-
5 4 3 2 1

Global Market Outlook 26
Asia USD bonds offer strong fundamentals and lower volatility
• Net assessment: We view Asia USD bonds as attractive relative to other bonds from a valuation, credit quality and low
volatility perspective and score them as “preferred” on a 12-month horizon.
• We like their high credit quality and relatively attractive valuations. While Asia USD bonds may offer lower absolute return
than some other bonds, their low volatility characteristic results in an attractive risk-reward, in our assessment. Asia USD
bonds also look attractive relative to US corporates given they have lagged over the past few months’ rally. Within Asia, we
prefer HY bonds to IG owing to the attractive yield and the strong rebound in property sales in China.
• High exposure to China and HK is a positive and a negative. They are further along the economic recovery path, but country
concentration is a risk. A slower-than-expected regional recovery and re-escalation in US-China tensions are also risks.
Fig. 40 Will Asia USD bonds outperform?
Arguments supporting outperformance Arguments supporting underperformance
Asia USD bonds offer high average credit quality of BBB+, despite
having a mix of both IG and HY bonds.
A rise in default expectations, especially bonds in the industrial
sector, might negatively affect investor sentiment and reduce
demand.
High exposure to Chinese and HK issuers (over 55% of the universe)
is a positive, given that they are further along the path of economic
normalisation, after the virus-induced lockdowns.
South Asian economies taking longer-than-expected to recover from
the virus related-slowdown.
Valuations look attractive relative to their own history, even after
adjusting for a potentially modest increase in default rates. On a
relative basis, they are cheap versus US corporate bonds.
Further escalation in US-China tensions and geopolitical tensions
around the South China Sea could dampen investor sentiment.
Supply is broadly in line with last year. Regional demand has been
strong and could be further supported, should the CNY depreciate.
SCB’s net assessment
outperform
other bonds
underperform
other bonds
Source: Standard Chartered Global Investment Committee
Fig. 41 Asia USD bonds have delivered better returns at lower
volatility as compared to other major EM bond asset classes
Total return of Asia USD, EM USD government and EM local
currency bonds since 2013
Source: Bloomberg, Standard Chartered
Fig. 42 Asian HY bonds offer an attractive pick-up over IG-
rated bonds
Asia IG and Asia HY bond yield premiums and their difference
Source: Bloomberg, Standard Chartered
-30%
-20%
-10%
0%
10%
20%
30%
40%
50%
Jan-13 Jul-14 Jan-16 Jul-17 Jan-19 Jul-20
Asia USD EM USD sov EM LCY sov
0
100
200
300
400
500
600
700
800
900
0
200
400
600
800
1,000
1,200
Jan-15 Nov-16 Sep-18 Jul-20
Spre
ad d
iffe
rence (bps)
Sp
read
(b
ps)
HY-IG spread (RHS) Asian IG Asian HY
Bonds | Equity | FX | Alternatives | Multi-Asset
CREDIT
2 Asia USD bonds
Preferred holding – A reliable asset class
Current yield 3.6%
Spread over UST 3.0%
Average credit BBB+
5 4 3 2 1

Global Market Outlook 27
Moderate yield, limited easing room and higher volatility lead to moderate risk-reward
• Net assessment: We score EM Local Currency (LC) bonds as a “core holding” from a valuation, FX view and risk perspective
on a 12-month horizon.
• Easy central bank policy combined with potential currency gains, given our bearish USD view and cheap EM FX valuations,
mean the bonds could offer high single-digit returns. The surge in COVID-19 cases in key EM countries, such as Brazil and
Russia, has dampened the prospects of a swift rebound in EM growth. On the downside, this could mean additional supply
of bonds; but, it also means central banks are likely to remain accommodative.
• FX volatility and a limited potential to cut rates in many EM countries are key risks.
Fig. 43 Will EM LC government bonds outperform?
Arguments supporting outperformance Arguments supporting underperformance
EM central banks are likely to maintain easy monetary policies with
inflation likely to remain low, reducing the pressure on central banks
to raise rates.
Slower growth in key EM countries, such as Brazil and India, which
are struggling to control the spread of the virus.
Our expectation for a weaker USD should lead to stronger EM
currencies. Historically, currency returns have been a big driver of
EM LC bonds’ total USD-denominated returns.
Given the significant YTD easing, there is limited room for further
rate cuts, which could reduce the potential for capital gains.
EM FX remains cheap from a long-term valuation perspective. They offer a lower yield than EM USD government bonds, despite
being exposed to currency volatility
SCB’s net assessment
outperform
other bonds
underperform
other bonds
Source: Standard Chartered Global Investment Committee
Fig. 44 EM local currency bonds offer a significantly lower
yield than EM USD government bonds, despite being exposed
to FX volatility
Difference between EM local currency and EM USD government
bond yields
Source: Bloomberg, Standard Chartered
Fig. 45 Markets believe that EM central banks have only
limited room to cut rates further
Market implied rate changes over the next one-year for major EM
countries
Source: Bloomberg, Standard Chartered
-3
-2
-1
0
1
2
Dec-09 Jun-13 Dec-16 Jun-20
Yie
ld %
EM LCY - EM USD 10y average
-2
-1
0
1
2
Brazil Thailand Poland China South
Africa
India Mexico
%
Bonds | Equity | FX | Alternatives | Multi-Asset
RATES
2 Emerging Market Local Currency
government bonds
Core holding – Reasonable yield, but higher volatility
Current yield 4.7%
Spread over UST NA
Average credit BBB+
5 4 3 2 1

Global Market Outlook 28
Supportive central bank policies, but less attractive valuations and supply concerns
• Net assessment: We view DM IG corporate bonds as unattractive from a yield, valuation and risk perspective, and score
them as “least preferred” on a 12-month horizon.
• Following the nearly 20% rally in US Investment Corporate bonds since the March lows, we believe the easy gains are behind
us. The Fed and ECB corporate bond purchase programmes remain supportive and the decline in hedging costs makes the
asset class more attractive for foreign investors. However, we believe the yield premiums have priced in a lot of good news,
leaving limited room for further decline, and credit fundamentals are likely to deteriorate.
• Further significant falls in Treasury yields or an overshoot on the back of strong Fed support are risks to our view.
Fig. 46 Will DM IG corporate bonds outperform?
Arguments supporting outperformance Arguments supporting underperformance
Fed and ECB corporate bond purchases are highly supportive of the
asset class. Additionally, expectation of low interest rates is a
positive, given the high interest rate sensitivity of the asset class.
Significant decline in yield premiums and nearly 20% gain in US IG
corporate bonds since March mean easy gains are likely behind us.
Limited room for further reduction in yield premiums.
The decline in USD-hedging costs makes US IG-corporate bonds
very attractive to European and Japanese buyers.
The supply of US IG corporate bonds is running at nearly double the
pace of last year.
Fed bond buying programme incentivises companies to protect their
IG ratings, by taking bondholder-friendly actions.
Subdued earnings and greater borrowing to lead to further
deterioration of credit fundamentals, as leverage increases.
Our expectation of a modest increase in US Treasury yields could
offset the modest spread compression, reducing potential returns.
SCB’s net assessment
outperform
other bonds
underperform
other bonds
Source: Standard Chartered Global Investment Committee
Fig. 47 The strong recent rally means that US IG corporate
bond yield premiums are now close to historical medians
Credit spread (yield premiums) for US IG corporate bond index
Source: Bloomberg, Standard Chartered
Fig. 48 US IG corporate bond market has seen extremely
strong new issuance, nearly twice that of last year
YTD issuance in US IG corporate bond market by year
Source: Bloomberg, Standard Chartered
0.00
0.50
1.00
1.50
2.00
2.50
3.00
3.50
4.00
Jan-10 Jan-12 Jan-14 Jan-16 Jan-18 Jan-20
%
US IG corporate bond yield premium Median
0
200
400
600
800
1,000
1,200
2015 2016 2017 2018 2019 2020
Am
ou
nt
issu
ed
(U
SD
bn
)
From 1-Jan to 24-Jun
Bonds | Equity | FX | Alternatives | Multi-Asset
CREDIT
2 Developed Market Investment
Grade corporate bonds
Less preferred – Pause after the break-neck rally
Current yield 1.8%
Spread over UST 1.5%
Average credit A-
5 4 3 2 1

Global Market Outlook 29
Global growth recovery and low yields to cap upside despite easy central bank policy
• Net assessment: We view DM IG government bonds as unattractive from a yield, valuation and risk perspective, and score
them as “least preferred” on a 12-month horizon. We also expect the 10-year US Treasury yields to rise slightly into the
0.75%-1.0% range over the next 12 months and favour a moderate maturity profile of around five to seven years.
• We expect central bank policies globally to remain easy for the next 12 to 18 months and for Quantitative Easing (QE)
purchases to help keep yields capped. However, our expectations of a growth rebound and an increase in inflation are likely
to put some upward pressure on yields. This, combined with the low absolute yield and high interest rate sensitivity, leads us
to view the risk-reward as unattractive.
• A significant fall in government bond yields following growth disappointment or strong central bank action is a risk to our view.
Fig. 49 Will DM IG government bonds outperform?
Arguments supporting outperformance Arguments supporting underperformance
Major central banks are likely to maintain extremely easy policies for
the foreseeable future. The Fed has indicated that it does not plan to
hike rates until at least end of 2022.
Near-term inflation and long-term inflation expectations to rise as
growth picks up and owing to the increase in oil prices. Higher
inflation expectations likely to push yields higher.
The risk of a second wave of infections and uncertainty about the
global recovery to help the demand for high quality bonds.
Our expectation of global growth recovery in H2 20 to reduce the
demand for government bonds, in favour of risky assets.
QE buying from major central banks to absorb the additional supply
due to fiscal stimulus measures. Potential Yield Curve Control (YCC)
in the US could cap long-term yields.
The low absolute yield on offer and the expected limits to how low
yields can go mean that DM IG government bonds are less effective
than historically as a hedge for exposure to risky assets.
Valuations appear expensive relative to fundamental drivers
SCB’s net assessment
outperform
other bonds
underperform
other bonds
Source: Standard Chartered Global Investment Committee
Fig. 50 Expectation of zero-bound rates in the US likely to
help keep US government bond yields capped
10y US Treasury yield and 12m forward Fed Fund Future implied
rate
Source: Bloomberg, Standard Chartered
Fig. 51 Low or negative yields across most major countries
reduce the risk-reward offered by DM IG government bonds
Black indicates positive yield, grey indicates negative yield
2y 3y 5y 7y 10y 30y
United States
Germany
France
Italy
Spain
United Kingdom
Japan
Switzerland
Source: Bloomberg, Standard Chartered
-0.5
0
0.5
1
1.5
2
0.0
0.5
1.0
1.5
2.0
2.5
Jun-19 Sep-19 Dec-19 Mar-20 Jun-20
%
%
10y treasury Fed fund future 12m implied rate (RHS)
Bonds | Equity | FX | Alternatives | Multi-Asset
RATES
2 Developed Market Investment
Grade government bonds
Less preferred – Low absolute yields
Current yield 0.4%
Spread over UST 0.2%
Average credit AA
5 4 3 2 1

Global Market Outlook 30
Key themes
Global equities have moved swiftly back into bull market territory with global equities up almost 40% from the March low.
Optimism that the policy response will ensure a sharp, short recession has driven expectations that global earnings will recover
swiftly into 2021. The current consensus forecast is for -19% growth in global earnings.
Investors are concerned over expensive valuations in global equity markets, which are trading on a 2020 P/E ratio of 21x. While
these concerns are understandable, we note that high valuations reflect the collapse in 2020 earnings expectations. Based on
the recovery in 2021 earnings, market valuations are 17x. Relative to government bonds, equities still look cheap.
US, Asia ex-Japan and Euro area equities are all ranked as preferred, with little to distinguish their relative performance outlook,
in our opinion. Earnings forecasts and lead indicators for growth are recovering sharply in all three regions.
Key chart
Fig. 52 Global equities are attractively valued relative to government bonds
MSCI All-Country World dividend yield less global weighted average benchmark bond yields
Global equities are expensive on
an earnings basis, but are
attractively valued relative to bonds
Global equity dividend yield has
increased while global weighted
average benchmark bond yields
have fallen. This has made equities
more attractive relative to bonds
Source: MSCI, Bloomberg, Standard Chartered; as of 23 June 2020
Pre
fere
nce o
rder
US equities
▽ ◇ ▲ ▲
US is a preferred holding. Low bond yields are supportive of growth and lead indicators are already starting
to react to the exceptional policy response. Earnings are expected to rebound 30% in 2021, in our view.
● Bond yields ◐ Fund flows ○ Geopolitics
Asia ex-Japan equities
▽ ◇ ▲
Asia ex-Japan is also a preferred holding. Lower bond yields, in combination with a weaker USD, should
support the region in H2 20. Both China onshore and offshore are preferred within the region.
● Bond yields ● Fund flows ○ Geopolitics
Euro area equities
▽ ◇ ▲
Euro area is also a preferred holding. Measures implemented by the ECB are starting to have a positive
effect on loan growth in the region. This is supportive of investment and, eventually, a recovery in earnings.
● Bond yields ● Fund flows ◐ Geopolitics
Japan equities
▽ ◆ △
Japan is a core holding. Cash levels among corporates are the second highest across the five regions in
our universe. The BoJ’s plans to increase purchases of exchange-traded funds is supportive.
● Bond yields ◐ Fund flows ◐ Geopolitics
EM ex-Asia equities
▽ ◆ △
EM ex-Asia is a core holding. A recovery in global growth in 2021 should help support the commodity-
heavy EM-ex Asia index. Bonds yields are supportive, but we are monitoring COVID-19 infection rates.
● Bond yields ◐ Fund flows ◐ Geopolitics
UK equities
▼ ◇ △
UK is less preferred. UK equities have dramatically underperformed global equities YTD. While the market
is emerging from the downturn, Brexit negotiation uncertainty looms large on investors’ radar.
◐ Bond yields ◐ Fund flows ○ Geopolitics
Source: Standard Chartered Global Investment Committee
Legend: ▲ Most preferred | ▼ Less preferred | ◆ Core holding | ○ Not supportive | ◐ Neutral | ● Supportive | ▭ Key driver
-2.0
-1.0
0.0
1.0
2.0
Jun-13 Mar-15 Dec-16 Sep-18 Jun-20
Div
ide
nd
yie
ld g
ap
(%
)
Equities cheap
Equities expensive
Bonds | Equity | FX | Alternatives | Multi-Asset
6 Equity – at a glance

Global Market Outlook 31
US equities are supported by expectations of a swift recovery in earnings in 2020
• Net assessment: We view US equities as attractive relative to global equities from an earnings growth and low bond yield
perspective and score them as “preferred” on a 12-month horizon.
• Our Global Investment Committee (GIC) expects US earnings to contract 21% in 2020, but rebound by an impressive 30%
in 2021. This implies that earnings should return to 2019 levels by 2021. Trading at 24x 2020 earnings, US equities are
expensive. Nevertheless, we believe the profile of the earnings recovery justifies the premium investors pay to gain exposure
to the market. Alternative valuation metrics are more supportive.
• President Trump’s stance on China as we approach the US election in November and a possible nationwide second wave of
COVID-19 infections are risks for investors.
Fig. 53 Will US equities outperform?
Arguments supporting outperformance Arguments supporting underperformance
Alternative valuations measures, including peak earnings, money
supply and bond yields, highlight the market is not as expensive as
indicators such as the P/E ratio suggest.
The market is focused on lower interest rates as supporting a higher
present value of future profits. However, if lower interest rates signal
weaker long-term growth, the outlook may not be as positive.
Earnings revision breadth (ratio of companies guiding earnings
higher relative to lower) has increased significantly, which is
supporting the US market rally.
Corporate margins have fallen from 11.3% at the cycle peak to 9.8%
currently. During the Global Financial Crisis, the low was 6.9%. As
such, there is a risk margins have further to fall.
Earnings can take up to 3-4 years to return to prior peak. However,
analysts currently forecast a return to 2019 earnings in 2021. While
unusual, such a swift recovery has occurred in prior cycles.
There is a disconnect between the ratio of earnings upgrades to
downgrades by analysts and the 13-week S&P 500 performance.
The last time this occurred was in 1998 during the Russian debt
default. Unless the ratio reverses, the market could fall.
The PMI is below 50, but rising. Historically this has been a
supportive factor for the market, in particular, cyclical sectors.
Measures of market euphoria are at extreme levels. This can be
viewed as a contrarian signal as it may prompt institutional investors
to reduce net exposure to equities.
SCB’s net assessment
outperform other
equity regions
underperform
other equity regions
Source: Standard Chartered Global Investment Committee; *2020 GIC estimates
Fig. 54 S&P 500 performance 12 months after a low in
earnings
S&P500 performance
Source: Macrotrends.com, Standard Chartered
Fig. 55 S&P 500 earnings growth expectations are recovering
Consensus S&P500 12-months ahead earnings growth expectations
Source: FactSet, Standard Chartered
-20 -10 0 10 20 30 40
1949
1953
1958
1961
1970
1975
1983
1985
1992
2002
2009
2016
%
-10
-5
0
5
10
15
20
Jun-13 Mar-15 Dec-16 Sep-18 Jun-20
EP
S g
row
th (
%)
MSCI US at 0.9% 12m fwd EPSg Mean
Bonds | Equity | FX | Alternatives | Multi-Asset
2 US equities
Preferred holding – expensive, but growthy
Earnings growth* -21%
P/E ratio 24x
Dividend yield 1.9%
5 4 3 2 1

Global Market Outlook 32
Asia ex-Japan equities are resilient
• Net assessment: We view Asia ex-Japan equities as attractive relative to global equities from a growth, policy stimulus and
positioning perspective and score them as “preferred” on a 12-month horizon.
• Our views are moderately more positive than consensus. Asia ex-Japan’s index performance has a positive correlation with
the global tech sector. A cyclical recovery, in conjunction with rising 5G-induced demand, is constructive for Asia ex-Japan’s
equities. Foreign funds have low positioning in the region. A weaker USD could induce fund flows into the region and would
be supportive for Asia ex-Japan index performance.
• Optimistic valuations and possibility of downside earnings revisions are risks to our view.
Fig. 56 Will Asia ex-Japan equities outperform?
Arguments supporting outperformance Arguments supporting underperformance
Further stimulus measures in the region would be constructive for
equities. China has room for further RRR cuts
Valuations for the region have already priced in an optimistic outlook
of global economic growth
Asia ex-Japan corporates have the highest cash position compared
to other regions; this makes Asia ex-Japan equities resilient in times
of global financial stress
Possible downside earnings revisions in H2 20 are negative for share
price performance
Containment measures have been effective with declining new
COVID-19 cases in North Asia
Escalating US-China trade tensions and rising geopolitical tensions
could lead to volatile market performance
Foreign investors have low allocation to Asia ex-Japan equities after
large fund outflows in H1 20
Chinese household unwillingness to spend could undermine the
efficacy of stimulus measures
SCB’s net assessment
outperform other
equity regions
underperform
other equity regions
Source: Standard Chartered Global Investment Committee; *12m forward FactSet consensus estimate
Fig. 57 Asia ex-Japan’s equities ride on recovery of the tech
sector
MSCI Asia ex-Japan index performance and Philadelphia stock
exchange semiconductor index
Source: FactSet, Standard Chartered
Fig. 58 A weaker USD environment could induce fund flows
into Asia ex-Japan equities
MSCI Asia ex-Japan’s index and ADXY Index
Source: FactSet, Standard Chartered
400
450
500
550
600
650
700
750
800
400
700
1,000
1,300
1,600
1,900
2,200
Nov-15 Jan-17 Mar-18 May-19 Jul-20
Ind
ex
Ind
ex
Semiconductor index (SOX index) MSCI AxJ (RHS)
60
80
100
120
140
160
180
20060
70
80
90
100
110
120
130
Dec-99 Oct-06 Aug-13 Jun-20
Ind
ex (
De
c-9
9 =
100)
Ind
ex,
invert
ed
ADXY index (inverted) AxJ index relative to AC World (RHS)
Bonds | Equity | FX | Alternatives | Multi-Asset
2 Asia ex-Japan equities
Preferred holding – to benefit from H2 20 tech demand
Earnings growth* -0.5%
P/E ratio 17x
Dividend yield 2.4%
5 4 3 2 1

Global Market Outlook 33
Earnings expected to rebound in 2021
• Net assessment: We view Euro area equities as attractive relative to global equities from an earnings growth, policy stimulus
and low bond yield perspective and score them as “preferred” on a 12-month horizon.
• The GIC’s view is for 2020 earnings to fall -30% followed by a rebound of +30% in 2021, which is consistent with consensus.
This should encourage investors to look through the 2020 weakness towards the recovery in 2021. Monetary and fiscal
stimulus measures should underpin a recovery for Euro area equities. In particular, the concept of a Euro area Recovery
Fund could reduce perceived political risks and lead to a positive re-rating of Euro area equities. The Euro area’s dividend
yield remains attractive relative to low bond yields, despite dividends having been reduced by over 20%.
• A slower-than-expected recovery and the region’s relatively low exposure to the technology sector are risks to our view.
Fig. 59 Will Euro area equities outperform?
Arguments supporting outperformance Arguments supporting underperformance
A Euro area recovery fund points to greater fiscal union, which would
strengthen the Euro area currency union and improve sentiment
The slowdown in activity due to COVID-19 containment measures
will pressure corporate earnings
Pace of earnings downgrades has decelerated with an earnings
rebound expected for 2021
The decline in oil prices will impact energy sector earnings and
dividends
Easy monetary policy with fiscal stimulus could boost growth,
including ECB supportive measures for Euro area banks
Lower technology sector exposure than other regions may contribute
to continued underperformance
Euro area equities have significant cyclical and EM exposure, which
benefit from the strong stimulus measures globally
Euro area equities have seen heavy outflows YTD
SCB’s net assessment
outperform other
equity regions
underperform
other equity regions
Source: Standard Chartered Global Investment Committee; *2020 GIC estimates
Fig. 60 Earnings are expected to rebound in 2021 after a sharp
decline in 2020
Consensus EPS growth in Euro area equities for 2020 and 2021
Source: FactSet, MSCI, Standard Chartered
Fig. 61 Euro area dividend yield continues to look relatively
attractive, despite a decline of over 20% in expected dividends
Euro area equities’ dividend yield less Euro area bond yield
Source: FactSet, MSCI, Standard Chartered
-40
-30
-20
-10
0
10
20
30
40
50
Jan-20 Feb-20 Mar-20 Apr-20 May-20 Jun-20
EP
S g
row
th (
%)
2020 2021
0.0
1.0
2.0
3.0
4.0
5.0
Dec-08 Oct-12 Aug-16 Jun-20
%
Euro area - yield gap Mean
Equities cheap
Equities expensive
Bonds | Equity | FX | Alternatives | Multi-Asset
2 Euro area equities
Preferred holding – stimulus measures support a recovery
Earnings growth* -30%
P/E ratio 21x
Dividend yield 2.9%
5 4 3 2 1

Global Market Outlook 34
Japanese equities have rebounded and priced in positives
• Net assessment: We view Japan equities as a “core holding” relative to global equities from a valuations and balance sheet
fundamentals perspective on a 12-month horizon.
• The GIC’s view is for 2020 earnings to fall 15% followed by a rebound of 30% in 2021, which is consistent with consensus.
The recent rebound in Japanese equities has raised their valuations, with positives priced in, but we see limited catalysts for
a sustainable rally. After rising steadily in the last few years, Japanese corporate buybacks have started to drop amid
economic uncertainty. Reduced share buyback activities could slow down momentum for Japan equities. However, Japanese
corporates’ high cash position compared to other regions provides a buffer, making Japanese corporates more resilient to
global financial stress.
• Downward revisions to earnings in 2020, which are currently forecast to contract less than other regions and weak global
growth are risks.
Fig. 62 Will Japanese equities outperform?
Arguments supporting outperformance Arguments supporting underperformance
Japanese equities offer high cyclical exposures and could benefit
more from a global recovery
After steadily rising since 2015, share buyback activities are to fall
this year amid uncertain corporate earnings
The BoJ’s plans to double ETF purchases in 2020 is constructive for
Japanese equities
Earnings disappointment and downward earnings revisions in 2020
are negative for share price performance
The high cash position provides a buffer for Japanese corporates to
weather financial stress
Falling domestic industrial production suggests risk of equity market
correction
Japanese equities are heavily under-owned after large fund outflows
in the last three years. Recently, foreign investors have started to
add exposure
Japanese earnings that are highly dependent on exports are
vulnerable to JPY movement
SCB’s net assessment
outperform other
equity regions
underperform
other equity regions
Source: Standard Chartered Global Investment Committee; *2020 GIC estimates
Fig. 63 Japanese corporate buybacks have dropped in times
of economic uncertainty
Japanese equities’ corporate buybacks
Source: FactSet, MSCI, Standard Chartered
Fig. 64 Cash as a percentage of market cap is high in Japan
MSCI Japan’s cash level vs other regions
Source: FactSet, Standard Chartered
0.0
1.0
2.0
3.0
4.0
5.0
6.0
7.0
8.0
2014 2015 2016 2017 2018 2019 2020
JP
Y t
rn
Q1 Q2 Q3 Q4
0
5
10
15
20
25
30
AxJ Japan World Europe ex-UK Uk US
%
Bonds | Equity | FX | Alternatives | Multi-Asset
2 Japan equities
Core holding – reduced buybacks
Earnings growth* -15%
P/E ratio 20x
Dividend yield 2.4%
5 4 3 2 1

Global Market Outlook 35
China equities to benefit from rising fund flows
• Net assessment: We view China equities as attractive relative to Asia ex-Japan equities from a policy, positioning and flows
perspective and score them as “preferred” on a 12-month horizon.
• Rising northbound and southbound flows via Stock Connect have supported China equities despite market volatility. Foreign
investors have been adding exposure to China onshore equities from its low positioning, while Chinese investors have been
buying China offshore equities on dips. Monetary easing measures have improved liquidity, and further easing is likely to be
supportive for China equities. The secondary listings of the Chinese ADRs could be the driver for the China offshore market
in H2 20 as the pace increases.
• Geopolitics, specifically US-China trade relations, and a second pandemic wave are risks to our view.
Fig. 65 Will China equities outperform?
Arguments supporting outperformance Arguments supporting underperformance
The secondary listings of the Chinese ADRs have improved
sentiment for China offshore equities
Geopolitical risks and escalating US-China tensions could increase
the equity risk premium
China onshore equities are less sensitive to turbulence in global
financial markets given the limited linkages to global fund flow
China households’ unwillingness to spend could constrain the
efficacy of the stimulus measures
Robust northbound and southbound inflows via Stock Connect have
been the drivers for China onshore and offshore markets
Concerns over a second wave of COVID-19 outbreak could dampen
market sentiment
EM funds remain lightly positioned in China onshore equities; could
see room for increase
Falling exports could drag economic growth but the impact could be
mitigated by growing domestic consumption
SCB’s net assessment
outperform
other equity
regions
onshore offshore
underperform
other equity
regions
Source: Standard Chartered Global Investment Committee;. *12m forward FactSet consensus estimate
Fig. 66 Rising southbound flow despite market volatility
Fund flows via Stock Connect scheme
Source: FactSet, Standard Chartered
Fig. 67 China credit growth highly correlated to onshore
domestic equities
Shanghai Composite index performance and total social financing
y/y movement
Source: FactSet, Standard Chartered
0
20
40
60
80
100
120
140
Nov-14 Apr-16 Sep-17 Feb-19 Jul-20
US
D b
n
SH/HK Southbound SH/HK Northbound
SZ/HK Southbound SZ/HK Northbound -50%
0%
50%
100%
150%
200%
2,500
3,000
3,500
4,000
4,500
5,000
Jan-15 Sep-17 May-20
y/y
%
Ind
ex
Shanghai Stock Exchange Composite Index TSF y/y % (RHS)
Bonds | Equity | FX | Alternatives | Multi-Asset
2 China equities
China equities preferred – liquidity easing
Earnings growth* 4.3%
P/E ratio 15x
Dividend yield 1.8%
5 4 3 2 1

Global Market Outlook 36
Low valuations insufficient for outperformance
• Net assessment: We view UK equities as a “less preferred holding” relative to global equities from an earnings recovery,
sector exposure and geopolitical risk perspective on a 12-month horizon.
• UK equities’ valuation discount to global equities is wider than the historical average; the discount has been widening since
the Brexit referendum and may persist due to a tepid earnings recovery and uncertainty over the Brexit path. UK earnings
are also expected to rebound in 2021 after a sharp decline in 2020, but this rebound is expected by consensus and the GIC
to lag the US and the Euro area, implying that UK equities are likely to underperform.
• A rapid resolution to Brexit uncertainty and a pick-up in foreign fund inflows are risks to our view.
Fig. 68 Will UK equities outperform?
Arguments supporting outperformance Arguments supporting underperformance
UK equities’ valuation discount to global equities is wider than the
historical average
Dividends have been cut as companies adjust to lower earnings and
an uncertain economic outlook
Political risk has diminished significantly due to a strong conservative
government, which can act decisively on Brexit
Uncertainty on the final Euro area trade agreement may continue to
inhibit investment decisions and growth
Defensive sectors, such as consumer staples, healthcare and
utilities, comprise nearly one-third of UK equities
The energy sector has a significant 15% earnings contribution to UK
equities and faces pressures from still weak oil prices
Net flows into UK equities have been resilient and remain positive
year-to-date
Small exposure to the technology sector, which has been growing
strongly and supporting equities performance in other regions
SCB’s net assessment
outperform other
equity regions
underperform
other equity regions
Source: Standard Chartered Global Investment Committee; *2020 GIC estimates
Fig. 69 UK equities’ earnings rebound is expected to lag that
of the Euro area and the US
Consensus earnings expectations for the UK, the Euro area and the
US (rebased to 100 at 2019)
Source: FactSet, MSCI, Standard Chartered
Fig. 70 UK equities’ valuation discount to global equities is
wider than the historical average
Consensus 12-month forward P/E ratio for UK equities relative to
global equities
Source: FactSet, MSCI, Standard Chartered
60
70
80
90
100
110
2019 2020 2021
UK Euro area US
-25
-20
-15
-10
-5
0
5
10
Dec-08 Oct-12 Aug-16 Jun-20
Dis
co
un
t/p
rem
ium
%
Mean
Bonds | Equity | FX | Alternatives | Multi-Asset
2 UK equities
Less preferred holding – valuations are low, but tepid
Earnings growth* -35%
P/E ratio 18x
Dividend yield 3.8%
earnings and Brexit uncertainty are headwinds
5 4 3 2 1

Global Market Outlook 37
Healthcare remains preferred in US, Euro area and China
US equity sector
Healthcare – preferred holding
The US healthcare sector remains a preferred holding. The
rise in healthcare demand since the COVID-19 pandemic
should continue to support the sector, which has been
reflected by a jump in pricing power. A low interest rate
environment also typically favours the healthcare sector. The
12-month forward P/E ratio of 18x is above the long-term
average of 15x. The 7.3% consensus earnings growth
forecast for the next 12 months is slightly below the long-term
8.0% average.
Fig. 71 Europe loans from monetary financial institutions
(MFIs) to companies jumped
Cut in TLTRO and deposit rate is expected to support lending flows
Source: FactSet, Standard Chartered
Europe equity sector
Financials – preferred holding
We have upgraded the Europe financial sector to a preferred
holding. With the recent cut in the targeted longer-term
refinancing operations (TLTRO) rate to -100bps and deposit
rate to -50bps, the ECB is effectively giving banks 50bps on
every euro borrowed. This should increase bank profits and
encourage lending flows (see Figure 1). The 12-month
forward P/B ratio of 0.7x and the 4.7% dividend yield over the
next 12 months are in line with their long-term averages.
Healthcare – preferred holding
The Europe healthcare sector remains a preferred holding.
The sector is defensive and tends to outperform in a low-yield
environment. Valuations have re-rated with 12-month ahead
P/E at 18x, above the long-term average of 15x. The 6.3%
consensus earnings growth forecast over the next 12 months
is in line with the long-term average of 6.0%.
China equity sector
Healthcare – preferred holding
The China healthcare sector remains a preferred holding.
While the sector’s valuation is elevated, improved health
awareness and the rise in healthcare spending since the
COVID-19 crisis should continue to support the sector’s future
earnings growth. The 12-month ahead P/E is at 41x versus
the long-term average of 20x, while the 27% consensus
earnings growth forecast in the next 12 months is above the
long-term average of 20%.
Information technology – preferred holding
The China information technology sector remains a preferred
holding. While growth concerns could dent demand over the
near term, its prospects remain much more attractive than the
broader market, in our opinion. The adoption of technology
during the COVID-19 crisis should reinforce the long-term
structural demand for cloud services, 5G equipment and big
data analysis. The 12-month ahead P/E ratio of 25x is slightly
above the long-term average of 23x, while expected earnings
growth of 22% in the coming 12 months is below the long-term
average of 30%.
Fig. 72 Our sector views and changes since March 2020
US Euro area China
Technology Healthcare Cons. discretionary
Healthcare Utilities Technology
Industrials Financials (+) Healthcare
Cons. discretionary Industrials Cons. staples (-)
Cons. staples Cons. discretionary Utilities
Financials Cons. staples Materials
Utilities Energy (+) Industrials
Real estate Real estate Comm. services
Materials (+) Materials Real estate
Energy (+) Technology (-) Energy (+)
Comm. services (-) Comm. services (-) Financials
Source: Standard Chartered; +/- sign indicates change since March 2020
Legend: Preferred | Core holding | Less preferred
4,000
4,200
4,400
4,600
4,800
Apr-14 Apr-16 Apr-18 Apr-20
EU
R (b
n)
MFI loans to non-financial corporations
Bonds | Equity | FX | Alternatives | Multi-Asset
7 Equity sector strategy
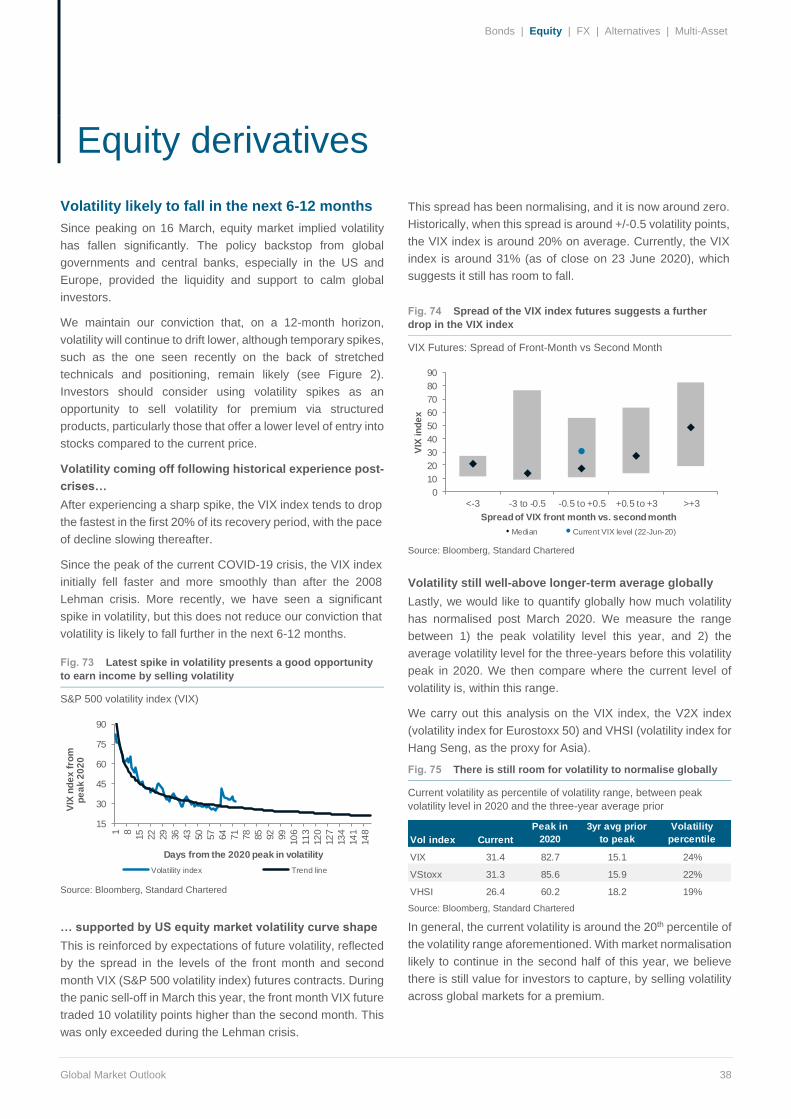
Global Market Outlook 38
Volatility likely to fall in the next 6-12 months
Since peaking on 16 March, equity market implied volatility
has fallen significantly. The policy backstop from global
governments and central banks, especially in the US and
Europe, provided the liquidity and support to calm global
investors.
We maintain our conviction that, on a 12-month horizon,
volatility will continue to drift lower, although temporary spikes,
such as the one seen recently on the back of stretched
technicals and positioning, remain likely (see Figure 2).
Investors should consider using volatility spikes as an
opportunity to sell volatility for premium via structured
products, particularly those that offer a lower level of entry into
stocks compared to the current price.
Volatility coming off following historical experience post-
crises…
After experiencing a sharp spike, the VIX index tends to drop
the fastest in the first 20% of its recovery period, with the pace
of decline slowing thereafter.
Since the peak of the current COVID-19 crisis, the VIX index
initially fell faster and more smoothly than after the 2008
Lehman crisis. More recently, we have seen a significant
spike in volatility, but this does not reduce our conviction that
volatility is likely to fall further in the next 6-12 months.
Fig. 73 Latest spike in volatility presents a good opportunity
to earn income by selling volatility
S&P 500 volatility index (VIX)
Source: Bloomberg, Standard Chartered
… supported by US equity market volatility curve shape
This is reinforced by expectations of future volatility, reflected
by the spread in the levels of the front month and second
month VIX (S&P 500 volatility index) futures contracts. During
the panic sell-off in March this year, the front month VIX future
traded 10 volatility points higher than the second month. This
was only exceeded during the Lehman crisis.
This spread has been normalising, and it is now around zero.
Historically, when this spread is around +/-0.5 volatility points,
the VIX index is around 20% on average. Currently, the VIX
index is around 31% (as of close on 23 June 2020), which
suggests it still has room to fall.
Fig. 74 Spread of the VIX index futures suggests a further
drop in the VIX index
VIX Futures: Spread of Front-Month vs Second Month
Source: Bloomberg, Standard Chartered
Volatility still well-above longer-term average globally
Lastly, we would like to quantify globally how much volatility
has normalised post March 2020. We measure the range
between 1) the peak volatility level this year, and 2) the
average volatility level for the three-years before this volatility
peak in 2020. We then compare where the current level of
volatility is, within this range.
We carry out this analysis on the VIX index, the V2X index
(volatility index for Eurostoxx 50) and VHSI (volatility index for
Hang Seng, as the proxy for Asia).
Fig. 75 There is still room for volatility to normalise globally
Current volatility as percentile of volatility range, between peak
volatility level in 2020 and the three-year average prior
Source: Bloomberg, Standard Chartered
In general, the current volatility is around the 20th percentile of
the volatility range aforementioned. With market normalisation
likely to continue in the second half of this year, we believe
there is still value for investors to capture, by selling volatility
across global markets for a premium.
15
30
45
60
75
90
1 8
15
22
29
36
43
50
57
64
71
78
85
92
99
10
6
11
3
12
0
12
7
13
4
14
1
14
8
VIX
nd
ex
fro
m
pe
ak
20
20
Days from the 2020 peak in volatility
Volatility index Trend line
0
10
20
30
40
50
60
70
80
90
<-3 -3 to -0.5 -0.5 to +0.5 +0.5 to +3 >+3
VIX
in
de
x
Spread of VIX front month vs. second month
Median Current VIX level (22-Jun-20)
Vol index Current
Peak in
2020
3yr avg prior
to peak
Volatility
percentile
VIX 31.4 82.7 15.1 24%
VStoxx 31.3 85.6 15.9 22%
VHSI 26.4 60.2 18.2 19%
w Bonds | Equity | FX | Alternatives | Multi-Asset
8 Equity derivatives

Global Market Outlook 39
Key themes
The longer-term cyclical USD uptrend that began in 2008 has likely peaked, with its downtrend expected to gain momentum
over the coming year as the global economy rebounds and US exceptionalism fades.
We expect some bumps in the road for the USD downtrend, particularly in the near term. These are likely to be driven by US
political and policy uncertainty ahead of the November election, broader geopolitical risks and the evolution of the pandemic.
We would consider such events as opportunities for medium-term investors to sell USD rallies.
We expect a 5-7% USD decline over the next 12 months, with the EUR, AUD and GBP being the primary beneficiaries. There
may be a more difficult passage for EM currencies that are sensitive to an uneven global recovery and idiosyncratic risks.
Key chart
Fig. 76 Massive USD liquidity provision should facilitate the longer-term USD bearish trend
reversal
USD index (DXY), USD monetary base, y/y (RHS, inverted)
The Fed’s unprecedented policy
response to supply the US and the
world with massive USD liquidity is
one key driver of our bearish USD
view in the medium term
Source: Bloomberg, Standard Chartered
USD (DXY)
▼ ◇ △ ▲
Narrow rate differentials, USD liquidity, twin deficits and political uncertainty tilting to a long-term USD downtrend.
○ Relative interest rates ◐ Relative growth rates ○ Flows & sentiment
EUR/USD
▽ ◇ ▲
An improved structural political foundation and rising growth/real interest rate tailwinds should strengthen the EUR.
● Relative interest rates ◐ Relative growth rates ● Flows & sentiment
GBP/USD
▽ ◇ ▲
Brexit is a strong GBP driver. We expect an eventual deal that will allow the undervalued GBP/USD to rally.
◐ Relative interest rates ◐ Relative growth rates ● Flows & sentiment
USD/CNY
▽ ◆ △
Domestic fiscal stimulus and pandemic management likely to cap USD/CNY. Geopolitical tensions an upside risk.
○ Relative interest rates ◐ Relative growth rates ○ Flows & sentiment
USD/JPY
▽ ◆ △
USD/JPY likely to be range-bound as real rates support hedging dollar assets while institutional demand for
international assets is robust.
○ Relative interest rates ◐ Relative growth rates ◐ Flows & sentiment
AUD/USD
▽ ◇ ▲
RBA policy and fiscal stimulus and a positive outlook for commodities support AUD/USD, despite geopolitical risks.
● Relative interest rates ◐ Relative growth rates ● Flows & sentiment
Source: Standard Chartered
Legend: ▲ Bullish view | ▼ Bearish view | ◆ Range view | ○ Not supportive | ◐ Neutral | ● Supportive | ▭ Key driver
-30
-10
10
30
50
7075
80
85
90
95
100
105
Jul-15 Jul-16 Jul-17 Jul-18 Jul-19 Jul-20
% (
invert
ed
)
DX
Y
DXY USD monetary base, y/y (RHS)
Bonds | Equity | FX | Alternatives | Multi-Asset
9 FX – at a glance

Global Market Outlook 40
We expect near-term range-trading to resolve with a 5-7% USD decline over 12 months
• Net assessment: We have a bearish view on the USD in the long term (12 months) and a range-bound view in the short
term (3 months) based on relative rate differentials, valuations, risk appetite and global USD liquidity.
• The expensive USD has few tailwinds given relative interest rate differentials have fallen sharply and the Fed is keen to guide
US rates low for longer while also providing ample global USD liquidity. Recovering global growth, fiscal expansion in Europe
and a more unified EU are likely to be a key driver for USD outflows.
• Heightened US-China tensions, especially ahead of the US election, and a second pandemic wave are key short-term risks.
Fig. 77 What is the USD outlook through the US election and beyond?
Arguments supporting bullish view Arguments supporting bearish view
President Trump and the Fed are aligned to support the US
economic recovery. US exceptionalism may continue if the EU
mutualised recovery package fails and EM recoveries disappoint
USD real interest rate differential advantage has fallen markedly, and
the Fed has flooded the global economy with USD liquidity. The Fed
has been proactive to implement policies that reduce USD demand
Narrow interest rate differentials may not be a key driver in a weak
global market environment where risk sentiment takes centre stage
Non-US growth and investment opportunities may drive flows away
from relatively expensive US assets and currency
US-China relations entering a higher-risk phase and escalation could
support “risk-off” USD buying. Trump’s election campaign strategy
could be a key driver of investment inflows
The long-term USD uptrend is peaking as global growth begins to
repair. As a momentum-driven and counter-cyclical currency, the
decline could accelerate as rising US twin deficits concern investors
High levels of USD debt, particularly in the economically vulnerable
EM markets, may yet drive another “dash for dollars”
Election strategies and overall political uncertainty in the US may be
a key driver of geopolitical stress. USD’s safe-haven currency status
may decline as asset managers seek more diversity
SCB’s net assessment
bullish
DXY
bearish
DXY
Source: Standard Chartered Global Investment Committee
Fig. 78 Real interest rate differentials argue for a weaker USD
DXY, DXY-weighted real interest rate differentials* (RHS)
Source: Bloomberg, Standard Chartered
*Derived from 10-year inflation-linked bonds
Fig. 79 US political uncertainty could undermine the USD
DXY, odds of democratic presidency, senate
Source: Predictit, Bloomberg, Standard Chartered
0.0
0.4
0.8
1.2
1.6
2.0
2.4
75
80
85
90
95
100
105
Jul-13 Apr-15 Jan-17 Oct-18 Jul-20
DXY DXY-weighted real interest rate differentials (RHS)
90
92
94
96
98
100
102
10425
35
45
55
65
Jan-20 Feb-20 Mar-20 Apr-20 May-20 Jun-20
DX
Y i
nd
ex (
invert
ed
)
Pre
dic
tIt
od
ds
Odds of democratic president Odds of democratic senate
DXY index (RHS)
Bonds | Equity | FX | Alternatives | Multi-Asset
2 USD (DXY)
Bearish – long-term USD downtrend is under way
5 4 3 2 1

Global Market Outlook 41
EUR/USD expected to rise to 1.19 on structural unity, fiscal expansion and attractive valuations
• Net assessment: We have a bullish view on the EUR in the long term (12 months) and a range-bound view in the short term
(3 months) based on relative rate differentials, valuations and risk appetite.
• The proposed EU recovery package, which includes mutualised debt issuance and grants to member nations, could be a
long-term, structural game-changer for the EUR. With political tail risks reduced, investment and reserve flows are expected
to drive currency appreciation as the EUR takes on a stronger role as a USD alternative. Narrowing interest rate differentials
against the US and ample global USD liquidity are expected to attract flows into the relatively underpriced EUR.
• Geopolitics and a second pandemic wave are risks.
Fig. 80 What are the key drivers for EUR/USD?
Arguments supporting bullish view Arguments supporting bearish view
Recent moves to establish a recovery package for 2021, which
includes mutualised debt issuance and distribution via grants and
loans, offers a significant structural advance for the EU if the
proposal is accepted
The European economy and the EUR are dependent on a global
growth recovery and rebound in international trade. A strong second
pandemic wave could impede the rebound of both drivers
With Germany and France now shifting to significant fiscal stimulus
as the ECB keeps borrowing costs very low and stable, the Euro
area economy is expected to rebound strongly
Despite the strong support of Germany and France, there is a risk
that some EU members will not support the proposed economic
recovery plan proposal. This could raise concerns for EU unity
Euro area assets and the EUR offer relatively attractive valuations.
Potential capital and repatriation flows should underpin the EUR
Despite strong monetary and fiscal support, the Euro area must
reverse a long-term trend of economic underperformance
Reduced tail risks for the EU periphery and the more attractive real
EUR interest rates are likely to encourage increased EUR reserves
allocation
Geopolitical risks remain from EU-China tensions, the possibility of
the Trump administration targeting EU tariffs and Brexit uncertainty
SCB’s net assessment
bullish
EUR/USD
bearish
EUR/USD
Source: Standard Chartered Global Investment Committee
Fig. 81 Fiscal policy boost drives positive EU economic data
Citi Economic Surprise index (Euro area), EUR/USD (RHS)
Source: Bloomberg, Standard Chartered
Fig. 82 Real interest rate differentials clearly EUR supportive
EUR/USD, EU-US real interest rate differential* (RHS)
Source: Bloomberg, Standard Chartered
*Derived from 10-year inflation-linked bonds
1.05
1.10
1.15
1.20
1.25
1.30
-350
-250
-150
-50
50
150
Jun-19 Oct-19 Feb-20 Jun-20
EU
R/U
SD
Ind
ex
Citi Economic Surprise Index - Eurozone EUR/USD (RHS)
-2.5
-2.0
-1.5
-1.0
-0.5
0.0
0.5
1.0
1.00
1.10
1.20
1.30
1.40
1.50
Jan-13 Jul-14 Jan-16 Jul-17 Jan-19 Jul-20
%
EU
R/U
SD
EUR/USD EU-US real rate differential* (RHS)
Bonds | Equity | FX | Alternatives | Multi-Asset
2 EUR/USD
Bullish – EUR is poised for stronger gains
5 4 3 2 1

Global Market Outlook 42
GBP/USD to rally to 1.32 as USD weakness and cheap valuation trumps Brexit fears
• Net assessment: We have a bullish expectation for the GBP in the long term (12 months) and a range-bound view in the
short term (3 months) based on valuations and the eventual resolution of Brexit challenges.
• Brexit will continue to be a key driver for GBP/USD. Both the UK and the EU will likely be motivated to compromise, and we
expect an eventual broad agreement that could be refined post-Brexit, or as a last resort, another extension of the “hard”
deadline. PM Johnson’s strong parliamentary majority is likely to be an asset as the UK negotiates a Brexit deal.
• Monetary and fiscal policy has been supportive of the economy and is likely to remain so. Within the context of a medium-
term USD downtrend, we believe that the long-lasting GBP undervaluation will allow GBP/USD to rally above 1.30.
• Brexit and a second pandemic wave are risks to our bullish long-term view.
Fig. 83 Will GBP/USD rise in 2020?
Arguments supporting bullish view Arguments supporting bearish view
A strong parliamentary majority allows the government to decide
and implement policy quickly, providing the PM with the flexibility to
act opportunistically
Brexit and a second wave of the pandemic are threats to the open UK
economy that relies on trade and capital flows to help finance a weak
current account
Monetary and fiscal policies have been deployed in tandem in the
face of COVID-19, and this is likely to continue
If the EU refuses to compromise, there is a risk that PM Johnson would
force a no-deal Brexit and work to rebuild the COVID-19 hit economy
before the expiry of his parliamentary mandate in 2024
Both the UK and EU are likely to compromise on a broad Brexit
deal that would likely require further negotiations in 2021. As a last
resort, the deadline could be extended
There is a risk that the BoE will move to negative nominal rates if the
economy does not recover. Real rates are already relatively low and
could sink further
The GBP is still significantly undervalued and will likely find support
from foreign capital inflows as the USD declines
The GBP is strongly impacted by risk sentiment. A breakdown of
technical support could see GBP/USD lower in volatile trading
SCB’s net assessment
bullish
GBP/USD
bearish
GBP/USD
Source: Standard Chartered Global Investment Committee
Fig. 84 GBP has remained undervalued post-referendum
GBP real effective exchange rate and its 10-year moving average
Source: Bloomberg, Standard Chartered
Fig. 85 GBP/USD appears to have undershot rate differentials
GBP/USD, the UK-US real interest rate differential* (RHS)
Source: Bloomberg, Standard Chartered
*Derived from 2-year inflation-linked government bonds
90
95
100
105
110
115
120
Jun-15 Aug-16 Oct-17 Dec-18 Feb-20
GBP REER 10y moving average
-6.0
-4.0
-2.0
0.0
2.0
4.0
6.0
1.10
1.30
1.50
1.70
1.90
Jan-08 Feb-11 Mar-14 Apr-17 May-20
%
GB
P/U
SD
Brexit referendum GBP/USD UK-US real rate differentia l (RHS)
Bonds | Equity | FX | Alternatives | Multi-Asset
2 GBP/USD
Bullish – optimistic for a Brexit solution (or delay)
5 4 3 2 1

Global Market Outlook 43
We expect a 6.90-7.20 range on improving fundamentals, offset by US-China tensions
• Net assessment: We have a range-bound view on the CNY in the long term (12 months) and short term (3 months) based
on relative rate differentials and policy efforts.
• Economic and social stability remains a key pillar of policy. Expansionary fiscal policy will also likely persist amid a weak
macroeconomic environment. We expect the authorities will also be highly focused on managing capital inflows and outflows
with the PBoC continuing to deploy a nuanced approach towards managing the CNY, keeping volatility in check.
• Geopolitics – specifically a rapid worsening in US-China relations and the sustainability of the “Phase One” deal signed in
January – is a key risk to our view.
Fig. 86 Will USD/CNY rise in 2020?
Arguments supporting bullish view Arguments supporting bearish view
A large second COVID-19 outbreak in China despite the authorities’
cautious approach and widespread testing could derail the ongoing
economic recovery, raising the risk of higher unemployment and
social tensions
China’s economic recovery will continue while other major DMs play
catch-up as they gradually restart their economies. The PBoC will not
prevent CNY strength if the economy improves
The PBoC has some tolerance for CNY depreciation in line with
market forces, though they will likely look to dampen volatility.
Further step-by-step monetary easing in this cycle is likely if the
economy falters
Supportive interest rate differentials can attract capital inflows – the
CNY offers a higher yield compared to the USD. The PBoC is likely
to resist a competitive devaluation and will continue to promote the
CNY as a stable regional reserve currency
US-China tensions are expected to remain elevated. Aggressive
actions involving tariff increases, cancelling the “Phase One” deal,
could increase upward pressure on USD/CNY
A longer-term shift from globalisation to regionalisation could see
more investment and reserves flowing into the CNY naturally,
particularly if CNY international trade invoicing expands
SCB’s net assessment
bullish
USD/CNY
bearish
USD/CNY
Source: Standard Chartered Global Investment Committee
Fig. 87 USD/CNY should continue trading sideways
USD/CNY (daily) with 50/100/200-day moving averages
Source: Bloomberg, Standard Chartered
Fig. 88 CNY currently offers attractive ‘carry’ over the USD
USD/CNY, 3-month Shibor-Libor differentials (%, RHS)
Source: Bloomberg, Standard Chartered
6.60
6.70
6.80
6.90
7.00
7.10
7.20
7.30
Jan-19 May-19 Sep-19 Jan-20 May-20
US
D/C
NY
USD/CNY 50dma 100dma 200dma
-0.50
0.50
1.50
2.50
3.50
4.50
5.506.00
6.20
6.40
6.60
6.80
7.00
7.20
7.40
Jan-15 Nov-16 Sep-18 Jul-20
% (
inve
rte
d)
US
D/C
NY
USD/CNY SHIBOR-LIBOR differential (RHS)
Bonds | Equity | FX | Alternatives | Multi-Asset
2 USD/CNY
Range-bound – stability still prioritised
5 4 3 2 1

Global Market Outlook 44
USD/JPY is expected to trade between 104 and 112 on two-way investment flows
• Net assessment: We have a range-bound view on the JPY in the long term (12 months) and short term (3 months) based
on relative rate differentials, flows and risk appetite.
• The JPY attracts significant safe-haven inflows at time of uncertainty due to the country’s strong net international investment
position. Real interest rate differentials are also a support. Meanwhile, JPY weakness is underpinned by its popularity as a
funding currency due to nominally low interest rates and demand from Japanese investors seeking attractive yields overseas.
We do not expect BoJ intervention unless USD/JPY falls rapidly towards 100.
• A strong second pandemic outbreak would likely trigger risk-off sentiment, leading to JPY strength. Short-term bouts of risk-
on/risk-off volatility are also possible.
Fig. 89 Will USD/JPY rise over the next 12 months?
Arguments supporting bullish view Arguments supporting bearish view
Japanese institutional and individual investors are expected to
increase demand for overseas assets. This tends to rise as USD/JPY
weakens towards the base of its expected trading range
The JPY is typically a favoured “risk-off” currency at times of
geopolitical tensions or slow global growth. Bouts of JPY strength
cannot be ruled out against the backdrop of a likely uneven global
economic recovery and uncertainty surrounding the US election
Current account deterioration could weigh on the JPY as global trade
rebounds cautiously, with additional stress possible from uncertain
Japan-China trade relations. The JPY tends to correlate with the
USD, and our bearish USD view suggests a relatively weaker JPY
Japanese investors may need to hedge significant currency
exposure and sell USD/JPY. This may become more pressing as
hedging costs are relatively low and several measures of JPY
valuations suggest the currency is undervalued against the USD
SCB’s net assessment
bullish
USD/JPY
bearish
USD/JPY
Source: Standard Chartered Global Investment Committee
Fig. 90 Demand for foreign assets rises on USD/JPY dips
USD/JPY, purchases of US securities from Japan
Source: Bloomberg, Standard Chartered
Fig. 91 Real rate differentials are likely to cap USD/JPY
USD/JPY, US-JP 10-year real interest rate differential* (RHS)
Source: Bloomberg, Standard Chartered
*Proxied by 10-year inflation-linked government bonds
40
60
80
100
120
140
90
95
100
105
110
115
120
125
Jul-14 Jan-16 Jul-17 Jan-19 Jul-20
US
D,
bn
US
D/J
PY
USD/JPY Foreign purchases of US securities by Japan(3m rolling average; RHS)
-1.0
-0.5
0.0
0.5
1.0
1.5
2.0
95
100
105
110
115
120
125
130
Jan-14 Mar-16 May-18 Jul-20
%
US
D/J
PY
USD/JPY US-JP real rate differential (RHS)
Bonds | Equity | FX | Alternatives | Multi-Asset
2 USD/JPY
Range-bound – real interest rates and flows are key
5 4 3 2 1

Global Market Outlook 45
AUD gains should proceed at a steady pace towards 0.7400
• Net assessment: We have a bullish view on the AUD in the long term (12 months) and a range-bound view in the short term
(3 months) based on valuations, relative rate differentials and risk appetite.
• With policy rates anchored across the G10 space, investor attention has turned to the debasing impact of QE policies on
currencies. The AUD is a potential winner given Australia’s shift towards fiscal policy as the main tool for providing economic
support. Australia’s external position also remains resilient given its trade and current account surplus. A strong pick-up in
global growth via demand for Australia’s commodity exports should bode well for the currency as it leverages its favourable
Terms of Trade. We expect AUD/USD to rise to around 0.7400 over the next 12 months after near-term consolidation.
• A disappointment in Chinese growth or a second global pandemic wave are risks, given the currency’s pro-risk nature and
sensitivity to global demand.
Fig. 92 Will AUD/USD rise in 2020?
Arguments supporting bullish view Arguments supporting bearish view
The AUD is well-placed to benefit from an increased emphasis on
fiscal policy given a low starting level of government debt
A further rally in the AUD could reduce the effectiveness of monetary
policy, especially given how the AUD plays a central role in
transmitting monetary policy to the domestic economy
Australia’s external position remains resilient, which should enable
the AUD to weather commodity price volatility; longer-term valuations
(adjusting for inflation) remain attractive
US-China tensions lurk in the background; renewed risk aversion
could weigh on riskier high-beta commodity currencies like the AUD
The AUD is a relative winner as the RBA has the slowest pace of
central bank balance sheet growth within the G10 space
The AUD is due for a period of near-term consolidation as the rally
may have overshot its fundamentals
The AUD remains the best proxy for a recovery in China’s growth
where the credit impulse is moving higher
SCB’s net assessment
bullish
AUD/USD
bearish
AUD/USD
Source: Standard Chartered Global Investment Committee
Fig. 93 AUD/USD has recovered alongside risk assets
AUD/USD, S&P 500 (RHS)
Source: Bloomberg, Standard Chartered
Fig. 94 Improving export prices supportive for AUD
AUD/USD, AUD Terms of Trade (RHS)
Source: Bloomberg, Standard Chartered
2,000
2,200
2,400
2,600
2,800
3,000
3,200
3,400
3,600
0.55
0.57
0.59
0.61
0.63
0.65
0.67
0.69
0.71
Jan-20 Mar-20 Apr-20 Jun-20
S&
P 5
00
AU
D/U
SD
AUD/USD S&P 500 (RHS)
-20
-10
0
10
20
30
40
50
0.55
0.65
0.75
0.85
0.95
1.05
1.15
Jul-10 Jan-13 Jul-15 Jan-18 Jul-20
%
AU
D/U
SD
AUD/USD AUD terms of trade (RHS)
Bonds | Equity | FX | Alternatives | Multi-Asset
2 AUD/USD
Bullish – increased fiscal flexibility, cheap valuations
5 4 3 2 1

Global Market Outlook 46
Positioned for broad USD weakness; US-China tensions a key risk
• Net assessment: Gradual EM FX appreciation should continue amid a recovery in global growth, easing restrictions and a
broadly weaker USD. A pick-up in US-China trade tensions and an uneven global economic rebound are risks to our view.
Fig. 95 Will Asian currencies rise in the next 6-12 months?
Arguments supporting bullish USD/Asia view Arguments supporting bearish USD/Asia view
USD/INR: Aggressive reserve accumulation by the RBI could limit
INR appreciation; renewed global growth pressures
USD/INR: Still-low oil prices are supportive of India’s balance of
payments (BoP) dynamics; foreign inflows are also expected to be
robust
SCB’s net assessment
bullish
USD/INR
bearish
USD/INR
USD/KRW: A weak trade backdrop and further equity outflows are
potential headwinds for the KRW
USD/KRW: KRW weakness priced in; improving risk sentiment and a
strong tech cycle are KRW-positive
SCB’s net assessment
bullish
USD/KRW
bearish
USD/KRW
USD/SGD: Singapore continues to face external demand headwinds;
further MAS easing should not be ruled out if the economy takes a
longer-than-expected time to recover
USD/SGD: A broadly weaker USD should gradually flow through to a
lower USD/SGD; aggressive and proactive fiscal policy should
reduce the need for a weaker SGD
SCB’s net assessment
bullish
USD/SGD
bearish
USD/SGD
USD/MYR: Further policy rate cuts by the BNM could weigh on the
MYR; the MYR also remains relatively more exposed to external
financing shocks
USD/MYR: Longer-term valuations remain attractive, which should
limit a sharp sell-off; a stronger-than-expected rebound in commodity
prices bodes well for the MYR
SCB’s net assessment
bullish
USD/MYR
bearish
USD/MYR
Source: Standard Chartered Global Investment Committee
Fig. 96 A reversal in portfolio INR flows offsets lower oil prices
Asia FX correlations to the CNH (weekly returns; 1 January 2020
onwards)
Source: Bloomberg, Standard Chartered
Fig. 97 Valuations still attractive despite recent MYR strength
USD/MYR (daily) with 50/100/200-day moving averages
Source: Bloomberg, Standard Chartered
0
0.1
0.2
0.3
0.4
0.5
0.6
0.7
0.8
0.9
SGD MYR INR PHP THB AUD
Co
rre
latio
n w
ith
CN
H
4.00
4.10
4.20
4.30
4.40
4.50
Jan-19 May-19 Sep-19 Jan-20 May-20
US
D/M
YR
USD/MYR 50dma 100dma 200dma
Bonds | Equity | FX | Alternatives | Multi-Asset
2 EM Asia FX
Turning positive as USD weakness feeds through
5 4 3 2 1
5 4 3 2 1
5 4 3 2 1
5 4 3 2 1

Global Market Outlook 47
Preferred: Looking ready to shine again
• Net assessment: We have a bullish expectation for gold in the long term (12 months) and a range-bound view in the short
term (3 months) based on real yields, risk appetite and our USD weakness view.
• Our preference for gold remains underpinned by our expectations for continued downward pressure on real (net of inflation)
yields. Given gold’s non-yielding attributes, lower real yields should keep the opportunity cost of holding the precious metal
low. A weaker USD will likely drive the next leg higher. We would add exposure to the precious metals on dips and believe
fundamentals continue to point to higher gold prices (above USD 1,850/oz) in the medium term (6-12 months).
• Significantly improved risk appetite or an unexpected rise in real yields are risks to our view.
Fig. 98 How will gold fare in the remainder of 2020?
Arguments supporting bullish view Arguments supporting bearish view
Accommodative monetary policies will continue to put downward
pressure on real (net of inflation) yields
A correction in risk assets could see liquidity needs materialise
again, weighing on gold in the short term
A recovery in inflation expectations amid increased fiscal and
monetary stimulus should weigh on real yields
Continued headwinds for the physical market as we enter a
seasonally slow period for demand
Continued investor interest and central bank buying should prop up
net demand for gold
Technical indicators suggest a pause in gold’s rally is likely given
overbought conditions
Uncertainty stemming from the ongoing COVID-19 pandemic and
US-China tensions should support safe-haven demand for gold
SCB’s net assessment
bullish
bearish
Source: Standard Chartered Global Investment Committee
Fig. 99 Accommodative monetary policies and inflation
recovery likely to maintain downward pressure on real yields*
60d gold returns vs 60d 10-year US TIPS yield change (bps)
Source: Bloomberg, Standard Chartered
*Real bond yields are proxied by US Treasury Inflation Protected securities
Fig. 100 The weaker USD-stronger gold relationship should
gradually reassert itself
Gold (USD/oz), Fed trade-weighted USD index (RHS, inverted)
Source: Bloomberg, Standard Chartered
-10
-5
0
5
10
15
20
-125 -100 -75 -50 -25 0 25 50
60
d g
old
pri
ce
re
turn
(%
)
60d change in US TIPS yield (bps)
95
100
105
110
115
120
125
130800
1000
1200
1400
1600
1800
Jan-17 Sep-17 May-18 Jan-19 Sep-19 May-20
Ind
ex
, in
ve
rte
d
US
D/o
z
Gold US Fed Trade-weighted Dollar Index (RHS)
Bonds | Equity | FX | Alternatives | Multi-Asset
2 Gold
We remain buyers on dips
5 4 3 2 1

Global Market Outlook 48
Key themes
Strategically, we see Alternative strategies as a useful addition to a traditional, long-only equities and bonds investment
allocation. Alternative strategies give exposure to sources of return that may not be directly accessible via long-only investments
in stocks and bonds. Incorporating Alternatives may, therefore, enhance the diversification of traditional allocations across a
broader set of fundamental drivers and investment opportunities. We maintain Alternatives as a core holding.
Within Alternatives, all four strategies remain core holdings. Correlations are expected to remain higher than average and market
volatility is expected to decline, which would reduce performance dispersion. In addition, risk sentiment remains fragile and trade
sizing may remain conservative until the public health situation stabilises and the economic recovery is on a firmer footing.
Key chart
Fig. 101 Global Macro provides the strongest diversification effect
Proportion of time with positive
gains when the VIX is high and
rising
Source: Bloomberg, Standard Chartered
Pre
fere
nce o
rder
Equity Hedge
▽ ◆ △ ▲
We view Equity Hedge as a core holding. Although equities are expected to trend positively, performance
dispersion may be less pronounced as inter-stock correlations and volatility decline modestly from above-
average levels.
◐ Equity dispersion ● Equity trend
Global Macro
▽ ◆ △
We regard Global Macro as a core holding. Cross-asset correlation is expected to remain above average
and volatility may decline, reducing the potential for price dispersion. Nevertheless, Global Macro remains a
useful “diversifier”, as it tends to deliver positive returns in times of significant risk aversion.
◐ Broad market trends ◐ Cross-asset dispersion ○ Cross-asset volatility
Relative Value
▽ ◆ △
We view Relative Value as a core holding. While the cost of funding for levered arbitrage trades is expected
to decline, market volatility may decline as well, thereby making it a challenge to capitalise on potential
price discrepancies.
○ Cross-asset volatility ● Credit spreads
Event Driven
▽ ◆ △
We view Event Driven as a core holding. While equities are expected to trend positively and credit spreads
to decline, we do not anticipate a meaningful pick-up in M&A activity. In our view, these are not outstanding
conditions for this strategy.
◐ M&A activity ● Equity trend ● Credit spreads
Source: Bloomberg, Standard Chartered; traffic lights denote impact of factor on potential Alternatives strategy returns
Legend: ▲ Most preferred | ▼ Less preferred | ◆ Core holding | ○ Not supportive | ◐ Neutral | ● Supportive | ▭ Key driver
0
10
20
30
40
50
60
70
Global macro Equity hedge Event driven Relative value
%
Bonds | Equity | FX | Alternatives | Multi-Asset
18 Alternatives – at a glance
Global Market Outlook 49
Turn more positive on US equity, while remain
positive on US government bonds
Our US Equity-Bond Market Risk (EBMR) model maps from
month-to-month the risk levels of US equity, and more broadly
of global equity, and of the 10-year US government bond. The
model combines two risk barometers (US Equity and the 10-
year US government bond) constructed from 11 economic
and market factors. Each barometer must take on a value
larger than 50 to signal a positive market risk outlook for its
respective asset class.
The model has stayed positive on both US equity and bond
market risks since February this year and remains so into
June 2020. This risk configuration means that the market risk
cycle would remain in Stage 2 (see Figure 2), which tends to
favour risky assets over defensive assets.
Fig. 102 EBMR’s bond barometer has weakened while its
equity barometer has strengthened since May 2020
US equity and bond market risk barometers
Source: Standard Chartered
In June, the model’s equity barometer has strengthened to 72,
from 55, as its equity momentum factors over 6- and 12-month
horizons continue to improve. Fundamental factors, such as
inflation and money supply, are little changed and remain
supportive of equities. The bond barometer has deteriorated
to 57 from a strong 86. The prior increase in the barometer
was driven by several signals, such as the deterioration in new
housing starts and a weaker equity market, which have both
improved since the peak of the COVID-19 crisis.
In our assessment, risk sentiment will continue to evolve with
the development around the COVID-19 situation and the
efficacy of monetary and fiscal easing to mitigate the
economic slowdown. Our projections of potential scenarios
indicate that the market risk cycle should remain in Stage 2
for most of the next four months.
What does it mean for the model to be in
Stage 2?
The historical performance of key asset classes since 1999
suggests risky assets perform better when in Stage 2 of the
financial market risk cycle.
Under Stage 2, global equities and alternative assets tend to
perform more strongly, followed by gold and global bonds.
Projections of the market risk cycle indicate we could move to
Stage 3 in July, but only to revert to Stage 2 thereafter.
For a detailed report of the US EBMR model, please refer to
the publication, Quant Perspective Update, dated 30th June.
Fig. 103 Scenarios over the coming months in 2020
Probability of the evolution of financial market risk cycle from current stage 2 and preferred assets under each stage
Probabilities of being in each stage of the US financial market risk cycle in May 2020 (last month)
Stage Jun-20 Jul-20 Aug-20 Sep-20
1 0% 0% 0% 0%
2 28% 59% 45% 77%
3 72% 38% 52% 23%
4 0% 3% 2% 0%
Probabilities of being in each stage of the US financial market risk cycle in June 2020 (this month)
Stage Jul-20 Aug-20 Sep-20 Oct-20
1 0% 0% 0% 0%
2 26% 53% 56% 77%
3 74% 43% 40% 22%
4 0% 4% 4% 2%
Source: Standard Chartered Wealth Management Global Investment Committee
0
20
40
60
80
100
May-19 Dec-19 Jul-20
EB
MR
baro
mete
rs
Equity barometer Bond barometer
Eq
uit
y b
aro
mete
r
Bond barometer
Low
ris
kH
igh r
isk
Low riskHigh risk
Stage 3Global equity is most preferred,
then gold as inflation-hedge asset
Stage 2
(Here for Jun)Global equities and
alternative assets most preferred
Gold is preferrerd over
everything else
Stage 4
Gold and global bonds are preferred
over global equities and alternative assets
Stage 1
Bonds | Equity | FX | Alternatives | Multi-Asset
12
Quant perspective US market risk model – positive on equity & government bonds

Global Market Outlook 50
S&P 500: The broad uptrend remains intact
With the S&P 500 index up 39% from its March low, it is an
opportune time to review the long-term technical bullish
outlook outlined in March. To recap, the failure of the index to
close below crucial support at 2,347 on monthly charts is a
sign that the broader uptrend remains intact.
The subsequent retracement has been more than 80% of the
February-March decline. A retracement of >60% raises the
probability that the prior trend (uptrend in this case) remains
intact, ie. the February-March decline was a correction rather
than the start of a prolonged downtrend. This is further
reinforced by the index’s rise above the 200-day moving
average. The index remains well above the long-term 200-
week moving average (now at 2,695; 12% below Monday’s
close). Notwithstanding the recent pause in the rally, the
three-month uptrend is unlikely to change while the index
holds above the mid-May low of 2,767 (9% from current
levels).
Gold: Looks set for a retest of 1,920
Two important developments have taken place since the
bullish triangle break last month (potential price objective, as
outlined last month, is 1,790). First, despite repeated tests,
XAU/USD has held above the quite strong support around
1,668. Second, the rise to a new monthly high in June
reaffirms that the medium-term trend is up – for the
continuation of an uptrend, it is vital that new highs are
registered. This indicates that the probability of a retest of the
2011 record high of 1,920 has increased. There is interim
resistance at the October 2012 high of 1,795. A brief respite
would not be surprising given overbought conditions.
However, it is more likely to be a pause, rather than a reversal,
of the rally.
Crude oil: Plenty of resistance ahead
The slide in crude oil has paused, but it is too soon to conclude
that the multi-year downward pressure is over. On continuous
futures contract charts, oil’s failure to sustain below the major
trendline support from 2009 is an encouraging sign for bulls.
But on its own, it may not be enough. Oil needs to clear crucial
resistance on a horizontal trendline at 42.40 and the 200-day
moving average (now at about 44.40) for the downward
pressure from 2015 to fade.
Fig. 104 S&P 500: The broad uptrend remains intact
S&P 500, daily chart with the 200-day moving average
Source: Bloomberg, Standard Chartered
Fig. 105 Gold: Looks set for a retest of USD 1,920/oz
XAU/USD, daily chart with the 200-day moving average
Source: Refinitiv Eikon, Standard Chartered
Fig. 106 Crude oil: Plenty of resistance ahead
Crude oil continuous futures contract, weekly chart
Source: Refinitiv Eikon, Standard Chartered
2000
2200
2400
2600
2800
3000
3200
3400
3600
Dec-19 Jan-20 Mar-20 Apr-20 Jun-20 Jul-20
Ind
ex
S&P 500 Index 200-Day MA
2767
1,400
1,500
1,600
1,700
1,800
Feb-20 Apr-20 Jun-20
US
D/o
z
Gold 200DMA
10
20
30
40
50
60
70
80
90
Jan-16 Jul-17 Jan-19 Jul-20
US
D/b
bl
WTI 200WMA
Bonds | Equity | FX | Alternatives | Multi-Asset
10 Technicals

Global Market Outlook 51
About our market diversity indicators
Our market diversity indicators help to identify areas where shorter-term market trends could break or reverse due to a
reduction in the breadth of market participant types at any given time. Effectively, the indicator tries to quantify to what extent
a tug-of-war is going on between different types of investors with different objectives and/or time horizons. When market
diversity declines, it means that one type of investor is generally dominating price movements. This can create an
environment whereby something happens to reduce the dominant investors’ ability or appetite to continue buying or selling,
and this leads to a sharp reversal in the recent trend.
Where is diversity falling or rising this month?
Market diversity across asset classes initially narrowed before
subsequently rebounding as the rallies in risk assets took a
pause near the end of June. An average of above 1.25 in our
market diversity indicator (fractal dimension) for equity, bond
and currency markets, suggests a broad reversal in these
markets is currently less likely to be driven by poor liquidity
conditions.
Fig. 107 Market diversity across asset classes rebounded
Average fractal dimension within each asset class as on 25 June
2020
Source: Standard Chartered
Fig. 108 Percentage of assets with low diversity declined
Percentage of assets with fractal dimension <1.25 for each asset
class as on 25 June 2020
Source: Standard Chartered
For equities, our indicator suggests none of the major markets
we track are currently at high risk of a downward reversal.
However, the diversity level in Asia ex-Japan equity market is
the lowest, driven by its strong returns since May.
For bonds, our indicator suggests watching out for two out of
the six bond indices we track as their liquidity conditions look
stretched. These are Asian USD bonds and DM IG corporate
bonds.
Meanwhile, the lower diversity in currencies since May has
coincided with a weaker USD and a risk asset rally. Among
these currencies, the AUD and the IDR have the lowest
diversity as their appreciation against the USD may be
overdone.
Fig. 109 Assets with market diversity below the cut-off level of
1.25
Level 1 Diversity Direction since May
HFRX Global Hedge Fund ○
Bond
FTSE DM IG Corporate Bond Index ○
JPM Asia Credit Index ○
Currencies
AUD/USD ○
USD/IDR ○
Source: Bloomberg, Standard Chartered; data as on 25 June 2020
Legend: ○Very low ◐Low ●Moderate/high
1.1
1.3
1.5
1.7
1.9
2.1
Jan-20 Feb-20 Mar-20 Apr-20 May-20 Jun-20
Ind
ex
Equity Bonds Currencies
0%
20%
40%
60%
80%
100%
Jan-20 Feb-20 Mar-20 Apr-20 May-20 Jun-20
Equity Bonds Currencies
Bonds | Equity | FX | Alternatives | Multi-Asset
11 Tracking market diversity

Global Market Outlook 52
Key themes
Much has happened since our last review three months ago. As multiple countries around the globe have gone from complete
economic lockdown to a gradual reopening, asset prices have experienced an almost V-shaped recovery from crisis levels. This
is reflected in the returns (simulated) of our Asia-focused balanced and global multi-asset income allocations, which added
19.2% and 20.0% respectively since March lows and -2.3% and -5.9% respectively since 2020 annual outlook publication.
Looking forward, while potential headwinds from slower economic growth, earnings disappointment and rising trade and
geopolitical tensions remain concerns, risk assets (both income-generating and total-return-focussed) are likely to be supported
by the coordination of monetary and fiscal easing, a weaker USD and a recovery of commodity prices. Our proposed multi-asset
income allocation currently yields an indicative 4.8%, well within our 4.0-5.0% income target.
In the near term, we are selectively adding risk to our global/Asia-focused balanced and global multi-asset income allocations
by tilting the bond exposure toward credit while reducing the equity exposure only marginally. Within rates, we favour a moderate
average maturity profile (5-7 years). Gold remains key for downside protection. A well-diversified allocation remains the prudent
approach to navigate this period, in our assessment.
Key chart
Fig. 110 Performance comparison of Asia-focused balanced and multi-asset income allocations
Total returns (ann.) and volatility (ann.) between 2014 and 2020 as of 29 June 2020
A diversified allocation remains
the prudent investing approach
in this period
Source: Bloomberg, Standard Chartered.
The table below summarises our asset class preferences and historical average 12-month returns for global and Asia-focused
balanced and global multi-asset income allocations under different economic regimes (October 2005-May 2020).
Global growth rising and
inflation falling
Global growth rising and
inflation rising
Global growth falling
and inflation rising
Global growth falling and
inflation falling
Balanced
Most preferred:
Equity | Credit | Rates
Global: 13.4%
Asia-focused: 13.3%
Most preferred:
Equity | Credit | Alternatives
Global: 10.2%
Asia-focused: 10.2%
Most preferred:
Gold | Credit | Cash
Global: 1.7%
Asia-focused: 1.4%
Most preferred:
Credit | Rates | Gold
Global: 7.4%
Asia-focused: 7.4%
Global Multi-asset
Income
Key driver of total return:
High positive price return
Key driver of total return:
Moderately positive price
return
Key driver of total
return:
Income
Key driver of total return:
Income
Most preferred:
REITs | Dividend equities |
DM High yield | EM HC
Govt
Global MAI: 15.6%
Most preferred:
REITs | Sub-financials |
Dividend equities | EM HC
Govt
Global MAI: 9.3%
Most preferred:
REITs | Asia USD bond |
Dividend equities | DM IG
Corp
Global MAI: 0.6%
Most preferred:
EM HC Govt | DM High
yield | Dividend equities |
EM LC Govt
Global MAI: 8.0%
Source: Bloomberg, Standard Chartered Global Investment Committee.
7.0%
1.3%
8.9%
11.1%
-0.3%
11.7%
-5.9%
5.4%
1.4%
-1.3%
6.9%
13.7%
-3.1%
10.6%
-2.3%3.8%
Global multi-asset income
Asia focused balanced
5.4% 5.4%7.4%
2.6%
9.6%
5.8%
17.4%
7.8%5.8% 7.1% 7.3%
2.4%9.1%
6.6%
20.0%
7.5%
Period2014- 2020
2018 2017201620152014
Volatility of Asia focused Balanced Allocation (Ann.)
Volatility of Multi-asset Income Allocation (Ann.)
Total return of Asia focused Balanced Allocation (Ann.)
Total return of Multi-asset Income Allocation (Ann.)
2019 2020
Bonds | Equity | FX | Alternatives | Multi-Asset
12 Multi-asset allocation – at a glance
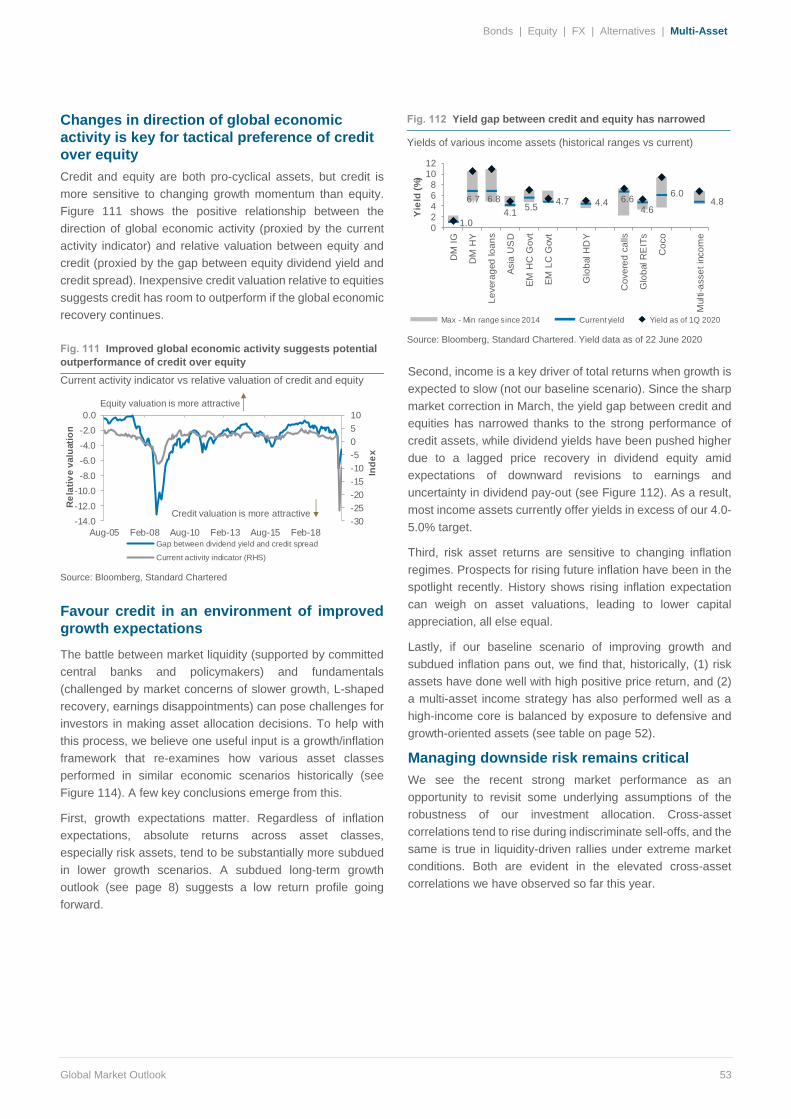
Global Market Outlook 53
Changes in direction of global economic
activity is key for tactical preference of credit
over equity
Credit and equity are both pro-cyclical assets, but credit is
more sensitive to changing growth momentum than equity.
Figure 111 shows the positive relationship between the
direction of global economic activity (proxied by the current
activity indicator) and relative valuation between equity and
credit (proxied by the gap between equity dividend yield and
credit spread). Inexpensive credit valuation relative to equities
suggests credit has room to outperform if the global economic
recovery continues.
Favour credit in an environment of improved
growth expectations
The battle between market liquidity (supported by committed
central banks and policymakers) and fundamentals
(challenged by market concerns of slower growth, L-shaped
recovery, earnings disappointments) can pose challenges for
investors in making asset allocation decisions. To help with
this process, we believe one useful input is a growth/inflation
framework that re-examines how various asset classes
performed in similar economic scenarios historically (see
Figure 114). A few key conclusions emerge from this.
First, growth expectations matter. Regardless of inflation
expectations, absolute returns across asset classes,
especially risk assets, tend to be substantially more subdued
in lower growth scenarios. A subdued long-term growth
outlook (see page 8) suggests a low return profile going
forward.
Second, income is a key driver of total returns when growth is
expected to slow (not our baseline scenario). Since the sharp
market correction in March, the yield gap between credit and
equities has narrowed thanks to the strong performance of
credit assets, while dividend yields have been pushed higher
due to a lagged price recovery in dividend equity amid
expectations of downward revisions to earnings and
uncertainty in dividend pay-out (see Figure 112). As a result,
most income assets currently offer yields in excess of our 4.0-
5.0% target.
Third, risk asset returns are sensitive to changing inflation
regimes. Prospects for rising future inflation have been in the
spotlight recently. History shows rising inflation expectation
can weigh on asset valuations, leading to lower capital
appreciation, all else equal.
Lastly, if our baseline scenario of improving growth and
subdued inflation pans out, we find that, historically, (1) risk
assets have done well with high positive price return, and (2)
a multi-asset income strategy has also performed well as a
high-income core is balanced by exposure to defensive and
growth-oriented assets (see table on page 52).
Managing downside risk remains critical
We see the recent strong market performance as an
opportunity to revisit some underlying assumptions of the
robustness of our investment allocation. Cross-asset
correlations tend to rise during indiscriminate sell-offs, and the
same is true in liquidity-driven rallies under extreme market
conditions. Both are evident in the elevated cross-asset
correlations we have observed so far this year.
Bonds | Equity | FX | Alternatives | Multi-Asset
Fig. 111 Improved global economic activity suggests potential
outperformance of credit over equity
Current activity indicator vs relative valuation of credit and equity
Source: Bloomberg, Standard Chartered
Fig. 112 Yield gap between credit and equity has narrowed
Yields of various income assets (historical ranges vs current)
Source: Bloomberg, Standard Chartered. Yield data as of 22 June 2020
-30
-25
-20
-15
-10
-5
0
5
10
-14.0
-12.0
-10.0
-8.0
-6.0
-4.0
-2.0
0.0
Aug-05 Feb-08 Aug-10 Feb-13 Aug-15 Feb-18
Ind
ex
Re
lati
ve
va
luati
on
Gap between dividend yield and credit spread
Current activity indicator (RHS)
Credit valuation is more attractive
Equity valuation is more attractive
1.0
6.7 6.8
4.15.5
4.7 4.4 6.64.6
6.04.8
02468
1012
DM
IG
DM
HY
Le
vera
ged
lo
an
s
Asia
US
D
EM
HC
Go
vt
EM
LC
Govt
Glo
bal H
DY
Co
ve
red
ca
lls
Glo
bal R
EIT
s
Co
co
Multi-
asse
t in
co
me
Yie
ld (
%)
Max - Min range since 2014 Current yield Yield as of 1Q 2020

Global Market Outlook 54
We believe this dynamic will gradually change as we slowly
embark on the path of economic recovery and normalisation.
Using this logic, we look at the gap between short-term (1
year) and long-term (5 years) correlations to identify assets
that are likely to become useful for portfolio diversification as
conditions normalise. The results in Figure 113 highlight that
a diversification opportunity is present in non-core assets,
such as sub-financials and REITs, and select credit
components. Investors could benefit from adding some of
these assets to their portfolios in the context of their
investment objectives.
Positioning our global multi-asset income
allocation (for income-focused investors)
Within our income allocation (see Figure 116), we are rotating
positions to take advantage of appealing valuation
opportunities in some income sectors that currently command
more attractive yields and offer diversification benefits (see
Figure 112). We also see grounds to tilt the bond exposure
toward credit at the expense of rates, where we prefer a
moderate average maturity profile of 5-7 years. As a result,
we raise weights in Developed Market (DM) High Yield (HY)
and Emerging Market (EM) USD government bonds and sub-
financials, while trimming allocations to high dividend yield
equities marginally and investment grade corporates. We see
the outlook for hybrid assets as constructive given the
availability of various credit facilities and buying programmes
by central banks, attractive valuations and recovering
economic activity. Importantly, history also shows that non-
core assets have offered positive price return in an improving
growth scenario (see Figure 114).
Positioning our multi-asset balanced
allocation (for total return-focused investors)
We are adding risk to both our global and Asia-focused
allocations by increasing credit exposure while reducing our
equities positioning only marginally (see Figure 118). This
also means dialling down the overall allocation to “safe haven”
assets (cash and high-quality bonds). Given the DM
government bond yield is close to an all-time low (and,
therefore, offers smaller diversification benefits), we are
reducing exposure slightly. We believe that coordinated policy
support should continue to help markets heal, improve market
liquidity and lower the risk of a credit crisis. This should, in
turn, reduce credit spreads in corporate credit. Specifically, we
add exposure to DM HY and EM USD government bonds.
Within equities, US and Euro area equities remain among our
preferred exposures.
Fig. 114 In a slowing growth environment, income is key, while changes in inflation regimes typically determine price returns
Average 12m returns of various asset classes in different economic scenarios (October 2005 to May 2020)
Source: Bloomberg, Standard Chartered. Economic scenarios are identified by BCA research data of global growth/inflation quadrants across business cycles.
Allocations used in this section are Asia-focused, Global-focused balanced and Global multi-asset income tactical allocations for a moderate risk profile.
-15%
-10%
-5%
0%
5%
10%
15%
20%
25%
30%
DM
IG
So
v
DM
IG
Co
rp
DM
HY
EM
Sov H
C
EM
So
v L
C
Asia
Corp
HC
Glo
bal H
DY
equity
Glo
bal equity
Covere
d c
alls
Pre
ferr
ed
RE
ITs
Altern
atives
Gold
GLOBAL GROWTH RISING AND INFLATION FALLING
Key driver
HIGH POSITIVEPRICE RETURN
-10%
-5%
0%
5%
10%
15%
20%
25%
30%
DM
IG
Sov
DM
IG
Corp
DM
HY
EM
Sov H
C
EM
Sov L
C
Asia
Corp
HC
Glo
bal H
DY
equ
ity
Glo
bal eq
uity
Co
vere
d c
alls
Pre
ferr
ed
RE
ITs
Altern
atives
Gold
GLOBAL GROWTH FALLING AND INFLATION RISING
Key driver
INCOMEPRICE RETURNmostly negative
-15%
-10%
-5%
0%
5%
10%
15%
20%
25%
30%
DM
IG
Sov
DM
IG
Corp
DM
HY
EM
Sov H
C
EM
Sov L
C
Asia
Corp
HC
Glo
bal H
DY
equ
ity
Glo
bal eq
uity
Co
vere
d c
alls
Pre
ferr
ed
RE
ITs
Altern
atives
Gold
GLOBAL GROWTH FALLING AND INFLATION FALLING
Key driver
INCOMEPRICE RETURNflat to negative
Income Price return
-15%
-10%
-5%
0%
5%
10%
15%
20%
25%
30%
DM
IG
Sov
DM
IG
Corp
DM
HY
EM
Sov H
C
EM
Sov L
C
Asia
Corp
HC
Glo
bal H
DY
equ
ity
Glo
bal eq
uity
Co
vere
d c
alls
Pre
ferr
ed
RE
ITs
Altern
atives
Gold
GLOBAL GROWTH RISING AND INFLATION RISING
Key driver
MODERATE POSITIVEPRICE RETURN
Bonds | Equity | FX | Alternatives | Multi-Asset
Fig. 113 Credit assets, especially hybrid components, can offer
diversification benefits
Differences between one-year and five-year correlations (weekly
data, as of June 2020)
Global REITs
Preferred CoCos Global HDY
EM USD
DM HY
DM IG Corp
Preferred -0.3 0.0
CoCos -0.2 -0.4 0.0
Global HDY -0.1 -0.4 -0.1 0.0
EM USD Govt 0.0 -0.2 -0.3 0.0 0.0
DM HY -0.1 -0.2 -0.1 0.1 0.0 0.0
DM IG Corp 0.0 -0.2 -0.4 -0.2 0.0 -0.4 0.0
DM IG Govt 0.1 -0.1 -0.3 -0.1 0.1 -0.3 0.1
Source: Bloomberg, Standard Chartered.

Global Market Outlook 55
Fig. 115 Key changes in our global multi-asset income allocation
Increase weight to:
• DM HY bonds for their attractive yield. Easy
monetary policy and search for yield should be
supportive. Higher-than-expected default rates and
downgrades remain a risk
• Sub-financials for their attractive yields; bank credit
quality remains robust and supportive
Reduce weight to:
• High dividend yield equities marginally reduced, given
less attractive yields compared to other income
components. Key risks are potential dividend
cuts/suspensions and further capital loss
• DM IG bonds to fund exposure to higher yielding
assets
Fig. 116 Our proposed multi-asset income allocation for H2 20
Fig. 117 Key changes in our multi-asset balanced allocations
Increase weight to:
• Overall bond exposure with strong tilt toward credit,
especially DM HY bonds for their attractive yields.
Easy monetary policy and search for yield should be
supportive. Higher-than-expected default rates and
downgrades remain a risk
• US and Europe ex-UK equities as the pace of
earnings downgrades for 2020 has decelerated and
earnings are expected to rebound in 2021
Reduce weight to:
• Overall equity allocation marginally to fund larger
weight in bonds
• DM IG bonds to fund higher weights to credit
components
Fig. 118 Our proposed multi-asset balanced allocation for H2 20 (moderate risk profile)
Source: Standard Chartered Global Investment Committee
Allocation figures may not sum up to 100% due to rounding effects
GLOBALMULTI-ASSET
INCOMEallocation25% Equity
25% - Global High Dividend Equity
21% Non-core7% - Covered calls
11%- Sub financials3% - Others
54% Bond
DM IG Govt - 2%DM IG Corp - 4%DM HY Corp & Senior Floating Rate Loans - 20%EM HC Govt - 12%EM LC Govt - 6%Asia USD bonds - 10%
ASIAFOCUSED
BALANCEDallocation
Cash 3%
Gold 6%
Alternatives 8%36% Equity
12% - North America 7%- Europe ex UK
1% - UK1% - Japan
11% - Asia ex Japan3% - Other EM
Bond 47%DM IG Govt - 2%DM IG Corp - 6%DM HY Corp - 9%EM HC Govt - 11%EM LC Govt - 9%Asia USD bonds - 10%
GLOBALBALANCEDallocation
3% Cash
6% Gold
8% Alternatives
36% EquityNorth America - 19%Europe ex UK - 3%UK - 1%Japan - 1%Asia ex Japan - 7%Other EM - 3%
Bond 47% 3% - DM IG Govt8% - DM IG Corp
13% - DM HY Corp9% - EM HC Govt7% - EM LC Govt
7% - Asia USD bonds
Bonds | Equity | FX | Alternatives | Multi-Asset

Global Market Outlook 56
Allocation figures may not add up to 100 due to rounding. *FX-hedged
Tailoring a multi-asset allocation to suit an individual's return expectations and appetite for risk
• We have come up with several asset class “sleeves” across major asset classes, driven by our investment views
• Our modular allocations can be used as building blocks to put together a complete multi-asset allocation
• These multi-asset allocations can be tailored to fit an individual’s unique return expectations and risk appetite
• We illustrate allocation examples for both Global and Asia-focused investors, across risk profiles
BOND
Allocation
(Asia-focused)
Higher Income
BOND
Allocation
EQUITY
Allocation
(Asia-focused)
NON-CORE
INCOME
Allocation
ALTERNATIVES
STRATEGIES
Allocation
For investors who want a
diversified allocation
across major fixed
income sectors and
regions
Asia-focused allocation
For investors who prefer
a higher income
component to capital
returns from their fixed
income exposure
Includes exposures to
Senior Floating Rate
bonds
For investors who want
a diversified allocation
across major equity
markets and regions
Asia-focused allocation
For investors who want
to diversify exposure
from traditional fixed
income and equity into
“hybrid” assets
Hybrid assets have
characteristics of both
fixed income and equity
Examples include
Covered Calls, REITs,
and sub-financials
(Preferred Shares and
CoCo bonds)
For investors who want
to increase diversification
within their allocation
Include both “substitute”
and “diversifying”
strategies
Note: Allocation figures may not add up to 100% due to rounding. *FX-hedged
DM IG Govt*5%
DM IG Corp*13%
DM HY20%
EM Govt HC24% EM Govt LC
18%
Asia USD20%
BOND (Asia-focused)
North America
33%
Europe ex-UK20%
UK3%
Japan4%
Asia ex-Japan32%
Other EM8%
EQUITY (Asia-focused)
DM IG Govt*4%
DM IG Corp*7%
DM HY & Leveraged
Loans38%
EM Govt HC22%
EM Govt LC10%
Asia USD19%
Higher IncomeBOND
Covered Calls35%
Sub financials
51%
Others14%
NON-COREINCOME
Equity Hedge29%
Relative Value26%
Event Driven26%
Global Macro19%
ALTERNATIVESSTRATEGIES
13 Our recommended allocations

Global Market Outlook 57
12-month view ASIA FOCUSED GLOBAL FOCUSED
Summary View Conservative Moderate Moderately Aggressive Aggressive Conservative Moderate
Moderately Aggressive Aggressive
Cash ▼ 10 3 1 0 10 3 1 0
Fixed Income ▲ 71 47 35 10 71 47 35 10
Equity ▲ 19 36 50 81 19 36 50 81
Gold ▲ 0 6 6 5 0 6 6 5
Alternatives ◆ 0 8 8 4 0 8 8 4
Asset class
USD Cash ▼ 10 3 1 0 10 3 1 0
DM Government
Bonds* ▼ 3 2 2 0 5 3 2 1
DM IG Corporate
Bonds* ▼ 9 6 4 1 13 8 6 2
DM HY Corporate
Bonds ▲ 14 9 7 2 20 13 10 3
EM USD Government
Bonds ▲ 17 11 8 2 13 9 6 2
EM Local Ccy
Government Bonds ◆ 13 9 6 2 10 7 5 1
Asia USD Bonds ▲ 14 10 7 2 11 7 5 1
North America
Equities ▲ 6 12 17 27 10 19 27 44
Europe ex-UK
Equities ▲ 4 7 10 16 2 3 5 8
UK Equities ▼ 1 1 1 2 1 1 1 2
Japan Equities ◆ 1 1 2 3 1 1 2 3
Asia ex-Japan
Equities ▲ 6 11 16 26 4 7 10 17
Non-Asia EM Equities ◆ 2 3 4 7 2 3 4 7
Gold ▲ 0 6 6 5 0 6 6 5
Alternatives ◆ 0 8 8 4 0 8 8 4
All figures in %. Source: Standard Chartered.
Note: (i) For small allocations we recommend investors to allocate through broader global equity/global bond solutions; (ii) Allocation figures may not sum to 100%
due to rounding effects.
*FX-hedged
Legend: ▲ Most preferred | ▼ Least preferred | ◆ Core holding
14 Asset allocation summary

Global Market Outlook 58
Fig. 119 Performance of key themes since Outlook 2019
Closed calls Open date Close date Absolute Relative
Rates/duration to underperform other level 1 asset classes 13-Dec-19 28-Feb-20
Euro area equities to outperform global equities 13-Dec-19 28-Feb-20
Developed Market (DM) IG government bonds to underperform global bonds 13-Dec-19 28-Feb-20
Emerging Market (EM) LCY government bonds to outperform global bonds 13-Dec-19 28-Feb-20
Developed Market (DM) IG corporate bonds to underperform global bonds 13-Dec-19 28-Feb-20
EUR to strengthen against the USD 13-Dec-19 28-Feb-20
Japan equities to underperform global equities 28-Feb-20 26-Mar-20
Equity Hedge to outperform other alternative strategies 13-Dec-19 26-Mar-20
Emerging Market (EM) LCY government bonds to underperform global bonds 26-Mar-20 29-Jun-20
Other Emerging Market (EM) equities to underperform global equities 26-Mar-20 29-Jun-20
CNY to strengthen against the USD 26-Mar-20 29-Jun-20
Source: Bloomberg, Standard Chartered
Performance measured from 13 December 2019 (release date of our 2020 Outlook) to 29 June 2020 or when the view was closed
Legend: - Correct call; - Missed call; NA - Not Applicable; Past performance is not an indication of future performance. There is no assurance, representation
or prediction given as to any results or returns that would actually be achieved in a transaction based on any historical data.
20 Closed calls summary

Global Market Outlook 59
Term Definition/Explanation
AUD Australian dollar
AxJ Asia ex-Japan
bbl barrels
bn billion
BoE Bank of England
BoJ Bank of Japan
bps basis point; 0.01%
CNY Chinese yuan (onshore)
CoCos Contingent Convertibles
DM Developed Market
dMA x-day moving average
DXY US dollar index
EBITDA Earnings before interest, tax, depreciation and amortization
ECB European Central Bank
EM Emerging Market
EUR European Central Bank
FOMC Federal Open Market Committee
FX Foreign Exchange
GBP British pound sterling
GICS The Global Industry Classification Standard for equities
HC Hard currency
HDY High dividend yield
HY High Yield
IG Investment Grade
INR Indian rupee
JPY Japanese yen
LCY Local currency
LTV Loan-to-value
M&A Mergers and acquisitions
m/m month-on-month
Mark-to-Market
Measure of the fair value of a particular asset; Reflection of current market levels
Term Definition/Explanation
mMA x-month moving average
mn million
Neutral rate Fed’s estimated benchmark interest rate at which real
US GDP is expected to grow at its trend rate and
inflation is expected to remain stable
OPEC Organization of the Petroleum Exporting Countries
Outside
view
A learning based on data from a class of roughly
similar previous cases
oz ounces
P/E Price-earnings
PMI Purchasing Managers’ Index
q/q quarter-on-quarter
RBA Reserve Bank of Australia
RSI Relative Strength Index
Senior
floating rate
loans
A debt financing obligation issued by a bank or similar
financial institution to a company or individual that
holds legal claim to the borrower’s assets above all
other debt obligations. Yields may vary based on
changes in benchmark interest rates
SGD Singaporean dollar
Terms of
trade (TOT)
The ratio of an index of a country’s export prices to an
index of its import prices
trn trillion
USD US dollar
VIX CBOE Volatility Index
wMA x-week moving average
y/y year-on-year
YTD Year-to-date
Understanding the terminology on our asset class preferences
Preferred Assets which the Global Investment Committee
expects to outperform the asset class benchmark
index in the next 12 months
Core Assets which the Global Investment Committee
expects to perform in line with the asset class
benchmark index in the next 12 months
Less
Preferred
Assets which the Global Investment Committee
expects to underperform the asset class benchmark
index in the next 12 months
Glossary

Global Market Outlook 60
Source: MSCI, JPMorgan, Barclays, Citigroup, Dow Jones, HFRX, FTSE, Bloomberg, Standard Chartered
*All performance shown in USD terms, unless otherwise stated
*YTD performance data from 31 December 2019 to 29 June 2020 and 1-month performance from 29 May 2020 to 29 June 2020
-0.7%
-6.5%
1.6%
1.0%
-1.2%
-3.4%
1.0%
-7.2%
0.3%
-2.2%
-2.2%
16.8%
-33.7%
11.7%
-9.2%
-46.6%
-16.3%
-20.3%
2.2%
-5.8%
-3.9%
-3.8%
2.9%
0.9%
-5.3%
-2.9%
2.8%
8.8%
4.0%
-21.6%
-9.7%
-0.8%
-9.5%
10.4%
-14.0%
1.2%
-24.2%
-34.2%
-6.5%
-0.1%
-2.4%
-7.6%
-17.0%
3.0%
-13.2%
-34.5%
-22.9%
-23.6%
-5.2%
-15.5%
-7.6%
-8.5%
-12.8%
-11.4%
-4.0%
-9.9%
-6.9%
-13.9%
-7.2%
-50% -40% -30% -20% -10% 0% 10% 20% 30%
Year to Date
-0.3%
2.0%
2.6%
1.7%
1.7%
1.4%
0.2%
-0.4%
1.3%
3.0%
1.0%
2.5%
10.2%
0.7%
6.2%
2.0%
-0.4%
1.1%
2.1%
3.0%
0.9%
1.6%
2.0%
2.7%
0.6%
3.4%
1.8%
0.2%
0.8%
2.5%
-1.5%
1.4%
3.0%
5.8%
1.7%
-1.7%
2.3%
-0.5%
0.4%
3.9%
8.5%
7.8%
6.7%
8.4%
3.0%
6.5%
1.2%
9.4%
7.8%5.0%
-0.6%
-0.6%
4.1%
3.4%
0.6%
7.2%
1.5%
0.6%
2.1%
-5% 0% 5% 10% 15%
1 month
Global Equities
Global High Divi Yield Equities
Developed Markets (DM)
Emerging Markets (EM)
US
Western Europe (Local)
Western Europe (USD)
Japan (Local)
Japan (USD)
Australia
Asia ex-Japan
Africa
Eastern Europe
Latam
Middle East
China
India
South KoreaTaiwan
Alternatives
FX (against USD)
Commodity
Bonds | Credit
Equity | Country & Region
Equity | Sector
Bonds | Sovereign
Consumer Discretionary
Consumer StaplesEnergy
Financial
Healthcare
Industrial
IT
Materials
Telecom
Utilities
Global Property Equity/REITs
DM IG Sovereign
US Sovereign
EU Sovereign
EM Sovereign Hard Currency
EM Sovereign Local Currency
Asia EM Local Currency
DM IG Corporates
DM High Yield Corporates
US High YieldEurope High Yield
Asia Hard Currency
Asia ex-Japan
AUD
EUR
GBP
JPY
SGD
Composite (All strategies)
Relative Value
Event Driven
Equity Long/Short
Macro CTAs
Diversified Commodity
Agriculture
Energy
Industrial Metal
Precious Metal
Crude OilGold
15 Market performance summary*

Global Market Outlook 61
JULY 2020
X US fiscal stimulus package
X EU Recovery Fund negotiations
01 USMCA enters into force
15 BoJ policy decision
16 ECB policy decision
18-19 G20 Finance Ministers and central bankers’ meet
29 FOMC policy decision
AUGUST 2020
05 ECB to submit rationale behind QE programme to German court
06 BoE policy decision
17-20 Democratic National Convention
24-27 Republican National Convention
SEPTEMBER 2020
X G7 meet in Washington DC, US
X China’s President Xi visits Germany for summit with EU state leaders
10 ECB policy decision
16 FOMC policy decision
15-22 UN General Assembly in New York
17 BoJ policy decision
17 BoE policy decision
29 1st US presidential election debate
OCTOBER 2020
15 2nd US presidential election debate
15-16 G20 Finance Ministers and central bankers’ meet
22 3rd US presidential election debate
29 BoJ policy decision
29 ECB policy decision
NOVEMBER 2020
03 US presidential and Congressional elections
05 FOMC policy decision
05 BoE policy decision
08-12 APEC Summit in Malaysia
21-22 G20 Summit in Saudi Arabia
DECEMBER 2020
10 ECB policy decision
16 FOMC policy decision
17 BoE policy decision
18 BoJ policy decision
31 End of Brexit transition period
JANUARY 2021
20 US presidential inauguration day
21 ECB policy decision
27 FOMC policy decision
FEBRUARY 2021
04 BoE policy decision
MARCH 2021
11 ECB policy decision
18 BoE policy decision
APRIL 2021
22 ECB policy decision
MAY 2021
06 BoE policy decision
JUNE 2021
10 ECB policy decision
24 BoE policy decision
X – Date not confirmed | ECB – European Central Bank | FOMC – Federal Open Market Committee (US) | BoJ – Bank of Japan | BoE – Bank of England
16 Events calendar

Global Market Outlook 62
ANNUAL
OUTLOOK
annually
GLOBAL
MARKET
OUTLOOK
monthly
The Annual Outlook highlights our key
investment themes for the year, the asset
classes we expect to outperform and the likely
scenarios as we move through the year.
Our monthly publication which presents the
key investment themes and asset allocation
views of the Global Investment Committee for
the next 6-12 months.
WEEKLY
MARKET
VIEW
weekly
MARKET
WATCH
ad hoc
Our weekly publication which provides an
update on recent developments in global
financial markets and their implications for our
investment views.
Market Watch focuses on major events or
market developments and their likely impact
on our investment views.
INVESTMENT
BRIEF
ad hoc
Investment Brief explains the rationale behind
our views on an asset class, incorporating the
fundamental and technical drivers.
Wealth management advisory publications
17

Global Market Outlook 63
Our experience and expertise help you navigate markets and provide actionable insights to reach your investment goals.
Alexis Calla
Chief Investment Officer
Chair of the Global Investment
Committee
Manish Jaradi
Senior Investment Strategist
Francis Lim
Senior Investment Strategist
Ajay Saratchandran
Senior Portfolio Manager
Steve Brice
Chief Investment Strategist
Audrey Goh, CFA
Senior Cross-asset Strategist
Fook Hien Yap
Senior Investment Strategist
Samuel Seah, CFA
Senior Portfolio Manager
Christian Abuide
Head
Discretionary Portfolio
Management
Daniel Lam, CFA
Senior Cross-asset Strategist
Abhilash Narayan
Senior Investment Strategist
Thursten Cheok, CFA
Senior Portfolio Strategist
Clive McDonnell
Head
Equity Investment Strategy
Rajat Bhattacharya
Senior Investment Strategist
Cedric Lam
Investment Strategist
Trang Nguyen
Portfolio Strategist
Manpreet Gill
Head
FICC Investment Strategy
Belle Chan
Senior Investment Strategist
DJ Cheong, CFA
Investment Strategist
Marco Iachini, CFA
Cross-asset Strategist
Sean Pang
Investment Strategist
The team

64
1. Figure 116 (page 55) and Figure 118 (page 55) show balanced asset and multi-asset income allocations for a moderate risk
profile only – different risk profiles may produce significantly different asset allocation results. Page 55 are only examples,
provided for general information only and they do not constitute investment advice, an offer, recommendation or solicitation.
They do not take into account the specific investment objectives, needs or risk tolerances of a particular person or class of
persons and they have not been prepared for any particular person or class of persons.
2. Contingent Convertibles are complex financial instruments and are not a suitable or appropriate investment for all investors.
This document is not an offer to sell or an invitation to buy any securities or any beneficial interests therein. Contingent convertible
securities are not intended to be sold and should not be sold to retail clients in the European Economic Area (EEA) (each as
defined in the Policy Statement on the Restrictions on the Retail Distribution of Regulatory Capital Instruments (Feedback to
CP14/23 and Final Rules) (“Policy Statement”), read together with the Product Intervention (Contingent Convertible Instruments
and Mutual Society Shares) Instrument 2015 (“Instrument”, and together with the Policy Statement, the “Permanent Marketing
Restrictions”), which were published by the United Kingdom’s Financial Conduct Authority in June 2015), other than in
circumstances that do not give rise to a contravention of the Permanent Marketing Restrictions.
Disclosures
This document is confidential and may also be privileged. If you are not the intended recipient, please destroy all copies and
notify the sender immediately. This document is being distributed for general information only and is subject to the relevant
disclaimers available at https://www.sc.com/en/regulatory-disclosures/#market-commentary-disclaimer. It is not and does not
constitute research material, independent research, an offer, recommendation or solicitation to enter into any transaction or
adopt any hedging, trading or investment strategy, in relation to any securities or other financial instruments. This document is
for general evaluation only. It does not take into account the specific investment objectives, financial situation or particular needs
of any particular person or class of persons and it has not been prepared for any particular person or class of persons. You
should not rely on any contents of this document in making any investment decisions. Before making any investment, you should
carefully read the relevant offering documents and seek independent legal, tax and regulatory advice. In particular, we
recommend you to seek advice regarding the suitability of the investment product, taking into account your specific investment
objectives, financial situation or particular needs, before you make a commitment to purchase the investment product. Opinions,
projections and estimates are solely those of SCB at the date of this document and subject to change without notice. Past
performance is not indicative of future results and no representation or warranty is made regarding future performance. Any
forecast contained herein as to likely future movements in rates or prices or likely future events or occurrences constitutes an
opinion only and is not indicative of actual future movements in rates or prices or actual future events or occurrences (as the
case may be). This document must not be forwarded or otherwise made available to any other person without the express written
consent of the Standard Chartered Group (as defined below). Standard Chartered Bank is incorporated in England with limited
liability by Royal Charter 1853 Reference Number ZC18. The Principal Office of the Company is situated in England at 1
Basinghall Avenue, London, EC2V 5DD. Standard Chartered Bank is authorised by the Prudential Regulation Authority and
regulated by the Financial Conduct Authority and Prudential Regulation Authority. Standard Chartered PLC, the ultimate parent
company of Standard Chartered Bank, together with its subsidiaries and affiliates (including each branch or representative office),
form the Standard Chartered Group. Standard Chartered Private Bank is the private banking division of Standard Chartered.
Private banking activities may be carried out internationally by different legal entities and affiliates within the Standard Chartered
Group (each an “SC Group Entity”) according to local regulatory requirements. Not all products and services are provided by all
branches, subsidiaries and affiliates within the Standard Chartered Group. Some of the SC Group Entities only act as
representatives of Standard Chartered Private Bank, and may not be able to offer products and services, or offer advice to
clients. They serve as points of contact only. ESG data has been provided by Refinitiv. Refer to
https://www.refinitiv.com/en/financial-data/company-data/esg-research-data.
Market Abuse Regulation (MAR) Disclaimer
Banking activities may be carried out internationally by different branches, subsidiaries and affiliates within the Standard
Chartered Group according to local regulatory requirements. Opinions may contain outright “buy”, “sell”, “hold” or other opinions.
The time horizon of this opinion is dependent on prevailing market conditions and there is no planned frequency for updates to
the opinion. This opinion is not independent of Standard Chartered Group’s trading strategies or positions. Standard Chartered
Group and/or its affiliates or its respective officers, directors, employee benefit programmes or employees, including persons
involved in the preparation or issuance of this document may at any time, to the extent permitted by applicable law and/or
regulation, be long or short any securities or financial instruments referred to in this document or have material interest in any
such securities or related investments. Therefore, it is possible, and you should assume, that Standard Chartered Group has a
18 Explanatory notes

65
material interest in one or more of the financial instruments mentioned herein. Please refer to https://www.sc.com/en/banking-
services/market-disclaimer.html for more detailed disclosures, including past opinions/recommendations in the last 12 months
and conflict of interests, as well as disclaimers. A covering strategist may have a financial interest in the debt or equity securities
of this company/issuer. This document must not be forwarded or otherwise made available to any other person without the
express written consent of Standard Chartered Group.
Country/Market Specific Disclosures
Botswana: This document is being distributed in Botswana by, and is attributable to, Standard Chartered Bank Botswana Limited
which is a financial institution licensed under the Section 6 of the Banking Act CAP 46.04 and is listed in the Botswana Stock
Exchange. Brunei Darussalam: This document is being distributed in Brunei Darussalam by, and is attributable to, Standard
Chartered Bank (Brunei Branch) | Registration Number RFC/61. Standard Chartered Bank is incorporated in England with limited
liability by Royal Charter 1853 Reference Number ZC18 and Standard Chartered Securities (B) Sdn Bhd, which is a limited
liability company registered with the Registry of Companies with Registration Number RC20001003 and licensed by Autoriti
Monetari Brunei Darussalam as a Capital Markets Service License Holder with License Number AMBD/R/CMU/S3-CL. China
Mainland: This document is being distributed in China by, and is attributable to, Standard Chartered Bank (China) Limited which
is mainly regulated by China Banking and Insurance Regulatory Commission (CBIRC), State Administration of Foreign Exchange
(SAFE), and People’s Bank of China (PBOC). Hong Kong: In Hong Kong, this document, except for any portion advising on or
facilitating any decision on futures contracts trading, is distributed by Standard Chartered Bank (Hong Kong) Limited (“SCBHK”),
a subsidiary of Standard Chartered PLC. SCBHK has its registered address at 32/F, Standard Chartered Bank Building, 4-4A
Des Voeux Road Central, Hong Kong and is regulated by the Hong Kong Monetary Authority and registered with the Securities
and Futures Commission (“SFC”) to carry on Type 1 (dealing in securities), Type 4 (advising on securities), Type 6 (advising on
corporate finance) and Type 9 (asset management) regulated activity under the Securities and Futures Ordinance (Cap. 571)
(“SFO”) (CE No. AJI614). The contents of this document have not been reviewed by any regulatory authority in Hong Kong and
you are advised to exercise caution in relation to any offer set out herein. If you are in doubt about any of the contents of this
document, you should obtain independent professional advice. Any product named herein may not be offered or sold in Hong
Kong by means of any document at any time other than to “professional investors” as defined in the SFO and any rules made
under that ordinance. In addition, this document may not be issued or possessed for the purposes of issue, whether in Hong
Kong or elsewhere, and any interests may not be disposed of, to any person unless such person is outside Hong Kong or is a
“professional investor” as defined in the SFO and any rules made under that ordinance, or as otherwise may be permitted by
that ordinance. In Hong Kong, Standard Chartered Private Bank is the private banking division of Standard Chartered Bank
(Hong Kong) Limited. Ghana: Standard Chartered Bank Ghana Limited accepts no liability and will not be liable for any loss or
damage arising directly or indirectly (including special, incidental or consequential loss or damage) from your use of these
documents. Past performance is not indicative of future results and no representation or warranty is made regarding future
performance. You should seek advice from a financial adviser on the suitability of an investment for you, taking into account
these factors before making a commitment to invest in an investment. To unsubscribe from receiving further updates, please
click here. Please do not reply to this email. Call our Priority Banking on 0302610750 for any questions or service queries. You
are advised not to send any confidential and/or important information to the Bank via e-mail, as the Bank makes no
representations or warranties as to the security or accuracy of any information transmitted via e-mail. The Bank shall not be
responsible for any loss or damage suffered by you arising from your decision to use e-mail to communicate with the Bank.
India: This document is being distributed in India by Standard Chartered Bank in its capacity as a distributor of mutual funds and
referrer of any other third party financial products. Standard Chartered Bank does not offer any ‘Investment Advice’ as defined
in the Securities and Exchange Board of India (Investment Advisers) Regulations, 2013 or otherwise. Services/products related
securities business offered by Standard Charted Bank are not intended for any person, who is a resident of any jurisdiction, the
laws of which imposes prohibition on soliciting the securities business in that jurisdiction without going through the registration
requirements and/or prohibit the use of any information contained in this document. Indonesia: This document is being
distributed in Indonesia by Standard Chartered Bank, Indonesia branch, which is a financial institution licensed, registered and
supervised by Otoritas Jasa Keuangan (Financial Service Authority). Jersey: In Jersey, Standard Chartered Private Bank is the
Registered Business Name of the Jersey Branch of Standard Chartered Bank. The Jersey Branch of Standard Chartered Bank
is regulated by the Jersey Financial Services Commission. Copies of the latest audited accounts of Standard Chartered Bank
are available from its principal place of business in Jersey: PO Box 80, 15 Castle Street, St Helier, Jersey JE4 8PT. Standard
Chartered Bank is incorporated in England with limited liability by Royal Charter in 1853 Reference Number ZC 18. The Principal
Office of the Company is situated in England at 1 Basinghall Avenue, London, EC2V 5DD. Standard Chartered Bank is authorised
by the Prudential Regulation Authority and regulated by the Financial Conduct Authority and Prudential Regulation Authority.
The Jersey Branch of Standard Chartered Bank is also an authorised financial services provider under license number 44946
issued by the Financial Sector Conduct Authority of the Republic of South Africa. Jersey is not part of the United Kingdom and
all business transacted with Standard Chartered Bank, Jersey Branch and other SC Group Entity outside of the United Kingdom,
are not subject to some or any of the investor protection and compensation schemes available under United Kingdom law.

66
Kenya: This document is being distributed in Kenya by, and is attributable to Standard Chartered Bank Kenya Limited.
Investment Products and Services are distributed by Standard Chartered Investment Services Limited, a wholly owned subsidiary
of Standard Chartered Bank Kenya Limited (Standard Chartered Bank/the Bank) that is licensed by the Capital Markets Authority
as a Fund Manager. Standard Chartered Bank Kenya Limited is regulated by the Central Bank of Kenya. Malaysia: This
document is being distributed in Malaysia by Standard Chartered Bank Malaysia Berhad. Recipients in Malaysia should contact
Standard Chartered Bank Malaysia Berhad in relation to any matters arising from, or in connection with, this document. Nigeria:
This document is being distributed in Nigeria by Standard Chartered Bank Nigeria Limited, a bank duly licensed and regulated
by the Central Bank of Nigeria. Pakistan: This document is being distributed in Pakistan by, and attributable to Standard
Chartered Bank (Pakistan) Limited having its registered office at PO Box 5556, I.I Chundrigar Road Karachi, which is a banking
company registered with State Bank of Pakistan under Banking Companies Ordinance 1962 and is also having licensed issued
by Securities & Exchange Commission of Pakistan for Security Advisors. Standard Chartered Bank (Pakistan) Limited acts as a
distributor of mutual funds and referrer of other third party financial products.
Singapore: This document is being distributed in Singapore by, and is attributable to, Standard Chartered Bank (Singapore)
Limited (Registration No. 201224747C/ GST Group Registration No. MR-8500053-0, “SCBSL”). Recipients in Singapore should
contact SCBSL in relation to any matters arising from, or in connection with, this document. SCBSL is an indirect wholly-owned
subsidiary of Standard Chartered Bank and is licensed to conduct banking business in Singapore under the Singapore Banking
Act, Chapter 19. Standard Chartered Private Bank is the private banking division of SCBSL. IN RELATION TO ANY SECURITY
OR SECURITIES-BASED DERIVATIVES CONTRACT REFERRED TO IN THIS DOCUMENT, THIS DOCUMENT, TOGETHER
WITH THE ISSUER DOCUMENTATION, SHALL BE DEEMED AN INFORMATION MEMORANDUM (AS DEFINED IN
SECTION 275 OF THE SECURITIES AND FUTURES ACT, CHAPTER 289 (“SFA”)). THIS DOCUMENT IS INTENDED FOR
DISTRIBUTION TO ACCREDITED INVESTORS, AS DEFINED IN SECTION 4A(1)(a) OF THE SFA, OR ON THE BASIS THAT
THE SECURITY OR SECURITIES-BASED DERIVATIVES CONTRACT MAY ONLY BE ACQUIRED AT A CONSIDERATION
OF NOT LESS THAN S$200,000 (OR ITS EQUIVALENT IN A FOREIGN CURRENCY) FOR EACH TRANSACTION. Further,
in relation to any security or securities-based derivatives contract, neither this document nor the Issuer Documentation has been
registered as a prospectus with the Monetary Authority of Singapore under the SFA. Accordingly, this document and any other
document or material in connection with the offer or sale, or invitation for subscription or purchase, of the product may not be
circulated or distributed, nor may the product be offered or sold, or be made the subject of an invitation for subscription or
purchase, whether directly or indirectly, to persons other than a relevant person pursuant to section 275(1) of the SFA, or any
person pursuant to section 275(1A) of the SFA, and in accordance with the conditions specified in section 275 of the SFA, or
pursuant to, and in accordance with the conditions of, any other applicable provision of the SFA. In relation to any collective
investment schemes referred to in this document, this document is for general information purposes only and is not an offering
document or prospectus (as defined in the SFA). This document is not, nor is it intended to be (i) an offer or solicitation of an
offer to buy or sell any capital markets product; or (ii) an advertisement of an offer or intended offer of any capital markets product.
Deposit Insurance Scheme: Singapore dollar deposits of non-bank depositors are insured by the Singapore Deposit Insurance
Corporation, for up to S$75,000 in aggregate per depositor per Scheme member by law. Foreign currency deposits, dual currency
investments, structured deposits and other investment products are not insured. Taiwan: Standard Chartered Bank (“SCB”) or
Standard Chartered Bank (Taiwan) Limited (“SCB (Taiwan)”) may be involved in the financial instruments contained herein or
other related financial instruments. The author of this document may have discussed the information contained herein with other
employees or agents of SCB or SCB (Taiwan). The author and the above-mentioned employees of SCB or SCB (Taiwan) may
have taken related actions in respect of the information involved (including communication with customers of SCB or SCB
(Taiwan) as to the information contained herein). The opinions contained in this document may change, or differ from the opinions
of employees of SCB or SCB (Taiwan). SCB and SCB (Taiwan) will not provide any notice of any changes to or differences
between the above-mentioned opinions. This document may cover companies with which SCB or SCB (Taiwan) seeks to do
business at times and issuers of financial instruments. Therefore, investors should understand that the information contained
herein may serve as specific purposes as a result of conflict of interests of SCB or SCB (Taiwan). SCB, SCB (Taiwan), the
employees (including those who have discussions with the author) or customers of SCB or SCB (Taiwan) may have an interest
in the products, related financial instruments or related derivative financial products contained herein; invest in those products at
various prices and on different market conditions; have different or conflicting interests in those products. The potential impacts
include market makers’ related activities, such as dealing, investment, acting as agents, or performing financial or consulting
services in relation to any of the products referred to in this document. UAE: DIFC - Standard Chartered Bank is incorporated in
England with limited liability by Royal Charter 1853 Reference Number ZC18.The Principal Office of the Company is situated in
England at 1 Basinghall Avenue, London, EC2V 5DD. Standard Chartered Bank is authorised by the Prudential Regulation
Authority and regulated by the Financial Conduct Authority and Prudential Regulation Authority. Standard Chartered Bank, Dubai
International Financial Centre having its offices at Dubai International Financial Centre, Building 1, Gate Precinct, P.O. Box 999,
Dubai, UAE is a branch of Standard Chartered Bank and is regulated by the Dubai Financial Services Authority (“DFSA”). This
document is intended for use only by Professional Clients and is not directed at Retail Clients as defined by the DFSA Rulebook.
In the DIFC we are authorised to provide financial services only to clients who qualify as Professional Clients and Market
Counterparties and not to Retail Clients. As a Professional Client you will not be given the higher retail client protection and
compensation rights and if you use your right to be classified as a Retail Client we will be unable to provide financial services
and products to you as we do not hold the required license to undertake such activities. For Islamic transactions, we are acting

67
under the supervision of our Shariah Supervisory Committee. Relevant information on our Shariah Supervisory Committee is
currently available on the Standard Chartered Bank website in the Islamic banking section at:
https://www.sc.com/en/banking/islamic-banking/http://www.standardchartered.com/en/banking-services/islamic-
banking/shariah-supervisory-committee.html. UAE: For residents of the UAE – Standard Chartered Bank UAE does not provide
financial analysis or consultation services in or into the UAE within the meaning of UAE Securities and Commodities Authority
Decision No. 48/r of 2008 concerning financial consultation and financial analysis. Uganda: Our Investment products and
services are distributed by Standard Chartered Bank Uganda Limited, which is licensed by the Capital Markets Authority as an
investment adviser. United Kingdom: Standard Chartered Bank (trading as Standard Chartered Private Bank) is an authorised
financial services provider (license number 45747) in terms of the South African Financial Advisory and Intermediary Services
Act, 2002. Vietnam: This document is being distributed in Vietnam by, and is attributable to, Standard Chartered Bank (Vietnam)
Limited which is mainly regulated by State Bank of Vietnam (SBV). Recipients in Vietnam should contact Standard Chartered
Bank (Vietnam) Limited for any queries regarding any content of this document. Zambia: This document is distributed by
Standard Chartered Bank Zambia Plc, a company incorporated in Zambia and registered as a commercial bank and licensed by
the Bank of Zambia under the Banking and Financial Services Act Chapter 387 of the Laws of Zambia.