Embed Size (px)
Citation preview

Global Marine Insurance ReportAstrid Seltmann

Contents
• Discovering South Korea (Astrid’s non-objective fun facts)
• Global marine insurance market
• P&I
• Offshore energy
• Cargo
• Hull
• The 2021 oracle

Discovering South Korea in Oslo, Norway(Tasting)
Photos: Astrid Seltmann

Discovering South Korea in Astrid’s bookshelf(Background knowledge)
Photo of book cover: Astrid Seltmann

Discovering Winter Olympics – Pyeongchang 2018
Medal table…and the winner is:

The closest Astrid has come to Seoul: 835 km (in 2006)
Seoul – Kyoto: 835 km
Contents
• Global marine insurance market
• P&I
• Offshore energy
• Cargo
• Hull
• The 2021 oracle

Please note & Disclaimer
Figures reflect the 2021 state of reporting.
Part of the figures are estimates and (some) figures do change retrospectively.
Data is reported to the degree possible according to the agreed IUMI definitions (see here) but may not be consistent across countries.
For comparison between years, check the latest updated ten-year premium and loss ratio data! (for IUMI members at https://iumi.com/statistics/iumi-member-statistics )
Focus of this presentation is on identifying the right market trends. Absolute figures are subject to error margins (estimates due to reporting backlog, revision of previously reported data).
All information given is of informational and non-binding character.
Figures related to the marine market’s performance reflect market averages. They do not disclose single units’ results. As with all averages, individual underwriting units may out- or underperform compared to the average.
IUMI’s aim is to provide information as available and raise consciousness for the importance of a fact-based evaluation of the risk exposure covered – and inspire everyone to do their own critical evaluation of real and seeming facts!

Marine premiums 2020 – by line of business
Total estimate 2020: 30.0 USD billion / Change 2019->2020: +6.1%NB: Exchange rate effects
23.8%
57.2%
6.8%
12.1%
2020
Global Hull
Transport/Cargo
Marine Liability
Offshore/Energy

0
2
4
6
8
10
12
14
16
18
20
2020201920182017
Absolute premiums (USD billion)
Transport/Cargo
Global Hull
Offshore/Energy
Marine Liability
Premiums & shares by line 2016-2020
Shares relative stable but increase in premium volume in 2020.
Absolute premium amount reflects combination of insured volume/ values and rates per unit.
Combination of various effects(world trade volume/ values, insurance market conditions, exchange rates).
Shares (%)
0.0%
10.0%
20.0%
30.0%
40.0%
50.0%
60.0%
70.0%
2020201920182017
Transport/Cargo
Hull
Offshore/Energy
MarineLiability

Marine premiums 2020 – by region
Total: 30.0 USD billion
47.7%
29.3%
9.3%
7.7%6.0%
2020Europe
Asia/Pacific
Latin America
North America
Other
NB: Some figures changed retrospectively, graphnot directly comparable with previous presentations.

0
2,000,000
4,000,000
6,000,000
8,000,000
10,000,000
12,000,000
14,000,000
16,000,000
18,000,000
20,000,000
2012 2013 2014 2015 2016 2017 2018 2019 2020
Europe
Asia/Pacific
Latin America
North America
Middle East
Africa
Premium (USD) by region 2010-2020reporting status as of 2021
Europe: after years of premiumdecreases, bottom seems reachedwith slight upwards trend in 2020.
Asia: increase continues.
Various influences. Market conditions, exchange rates
2020: 30.0 USD bill. 2019: 28.3 USD bill.
(underreporting in 2019)

USD Exchange rates 2005-2021Index 2005=100%, against selected currencies, as of December each year (2021 as of July)
60 %
70 %
80 %
90 %
100 %
110 %
120 %
130 %
140 %
150 %
160 %20
05
2006
2007
2008
200
9
2010
2011
2012
2013
2014
2015
2016
2017
2018
2019
2020
2021
CNY (China)
JPY (Japan)
EUR (Euro)
NOK (Norway)
GBP (UK)
Statistics in USD are influenced by exchange rates.
Diverse developments between currencies.
Premium trends may differ in local currency, particularly for cargo.

Contents
• Global marine insurance market
• P&I
• Offshore energy
• Cargo
• Hull
• The 2021 oracle

P&I International Group – IncomeGross calls 2020 (premiums) – by operational location, Source: Int. Group of P&I Clubs
62 %
29 %
6 % 3 %
UK
Nordic
Japan
US
Calls 2020:UK: 1.82 Nordic: 0.87Japan: 0.18US: 0.08Total: 2.95 (USD billion) Change: 0.04%)
44 %
19 %
16 %
12 %
6 % 3 %
BermudaUKLuxembourgNordicJapanUSby country of registration

P&I Pool claims by policy yearSource: Int. Group of P&I Clubs, claims as of 21 July 2021
$0
$500
$1,000
$1,500
$2,000
$2,500
$3,000
0
5
10
15
20
25
30
35
40
45
50
2005 2006 2007 2008 2009 2010 2011 2012 2013 2014 2015 2016 2017 2018 2019* 2020* 2021*
Tota
l C
laim
(U
S$
mil
lio
ns)
Nu
mb
er
of
Cla
ims
Total claim on Pool (*includes AAD amounts) Total claim on ELR Number of claims Actual Incidents
2019/2020: A number of severe casualties end period oflow major claims impact.
COVID-19 impact strongeron P&I than other lines (crew, passengers).
Reporting backlog: Claims for youngest yearsstill develop.
P&I complex business with high liabilities.
More information atwww.igpandi.org

Contents
• Global marine insurance market
• P&I
• Offshore energy
• Cargo
• Hull
• The 2021 oracle

Offshore energy premium 2020
UK (Lloyds), 34.0%
UK (IUA), 29.0%Mexico, 7.6%
Brazil, 6.1%
Japan, 3.7%
Malaysia, 2.9%
Nordic, 2.6% Italy, 2.5%
Egypt, 2.5%
Nigeria, 2.3%
India, 1.8% USA, 0.6%
Other, 4.3%
2020
Total estimate: 3.6 USD billion / Change 2019->2020: 8.6%

0
1,000,000
2,000,000
3,000,000
4,000,000
5,000,000
6,000,000
20
12
20
13
20
14
20
15
20
16
20
17
20
18
20
19
20
20
Other
USA
India
Egypt
Nigeria
Italy
Nordic
Malaysia
Japan
Brazil
Mexico
UK-IUA (2012)
UK-Lloyds
Willis estimated upstreampremium (ajdusted retrospectively)
Offshore energy premium 2012-2020
Strong decrease from 2014 but seems to have reached bottom.
IUMI: Premiums reported by associations. Some double-reporting
due to global nature of business.
=> Overestimation of global premium.
Willis approach: Based on Lloyds triangulation. 100% calculated by assuming Lloyd’s represents 70%.
Change in market shares not taken into account.
Underestimation of global premium
Kazakhstan and some other countries: no data available.

Average oil price per month (USD/bbl)Source: World bank commodity price data, January 2005-August 2021
0.00
20.00
40.00
60.00
80.00
100.00
120.00
140.00
160.00
20
05
M0
12
00
5M
03
20
05
M0
52
00
5M
07
20
05
M0
92
00
5M
11
20
06
M0
12
00
6M
03
20
06
M0
52
00
6M
07
20
06
M0
92
00
6M
11
20
07
M0
12
00
7M
03
20
07
M0
52
00
7M
07
20
07
M0
92
00
7M
11
20
08
M0
12
00
8M
03
20
08
M0
52
00
8M
07
20
08
M0
92
00
8M
11
20
09
M0
12
00
9M
03
20
09
M0
52
00
9M
07
20
09
M0
92
00
9M
11
20
10
M0
12
01
0M
03
20
10
M0
52
01
0M
07
20
10
M0
92
01
0M
11
20
11
M0
12
01
1M
03
20
11
M0
52
01
1M
07
20
11
M0
92
01
1M
11
20
12
M0
12
01
2M
03
20
12
M0
52
01
2M
07
20
12
M0
92
01
2M
11
20
13
M0
12
01
3M
03
20
13
M0
52
01
3M
07
20
13
M0
92
01
3M
11
20
14
M0
12
01
4M
03
20
14
M0
52
01
4M
07
20
14
M0
92
01
4M
11
20
15
M0
12
01
5M
03
20
15
M0
52
01
5M
07
20
15
M0
92
01
5M
11
20
16
M0
12
01
6M
03
20
16
M0
52
01
6M
07
20
16
M0
92
01
6M
11
20
17
M0
12
01
7M
03
20
17
M0
52
01
7M
07
20
17
M0
92
01
7M
11
20
18
M0
12
01
8M
03
20
18
M0
52
01
8M
07
20
18
M0
92
01
8M
11
20
19
M0
12
01
9M
03
20
19
M0
52
01
9M
07
20
19
M0
92
01
9M
11
20
20
M0
12
02
0M
03
20
20
M0
52
02
0M
07
20
20
M0
92
02
0M
11
20
21
M0
12
02
1M
03
20
21
M0
5
Brent
WTI
2020/2021: Extraordinary drop in 2020 followed by strong increase.

20 %
40 %
60 %
80 %
100 %
120 %
140 %
160 %
20
10
20
11
20
12
20
13
20
14
20
15
20
16
20
17
20
18
20
19
20
20
20
21
Global Offshore EnergyPremium
Oil price, Brent Crude
No. Contracted Rigs
Average Day Rates
Energy premium versus mobiles, day rates, oil priceIndex 2005=100% (mobiles, day rates, oil price as of July 2021)
2020: Oil price drops temporarily to bottom level due to oversupply. OPEC cuts.
Increasing since mid-2020.Recovery to last and initiate new activity?
Drop in oil price was followed by drop in premium.
Sources: Average Day Rates, No. Contracted Rigs: Clarksons Research, Oil Price: World Bank commodity price data, Premiums: IUMI
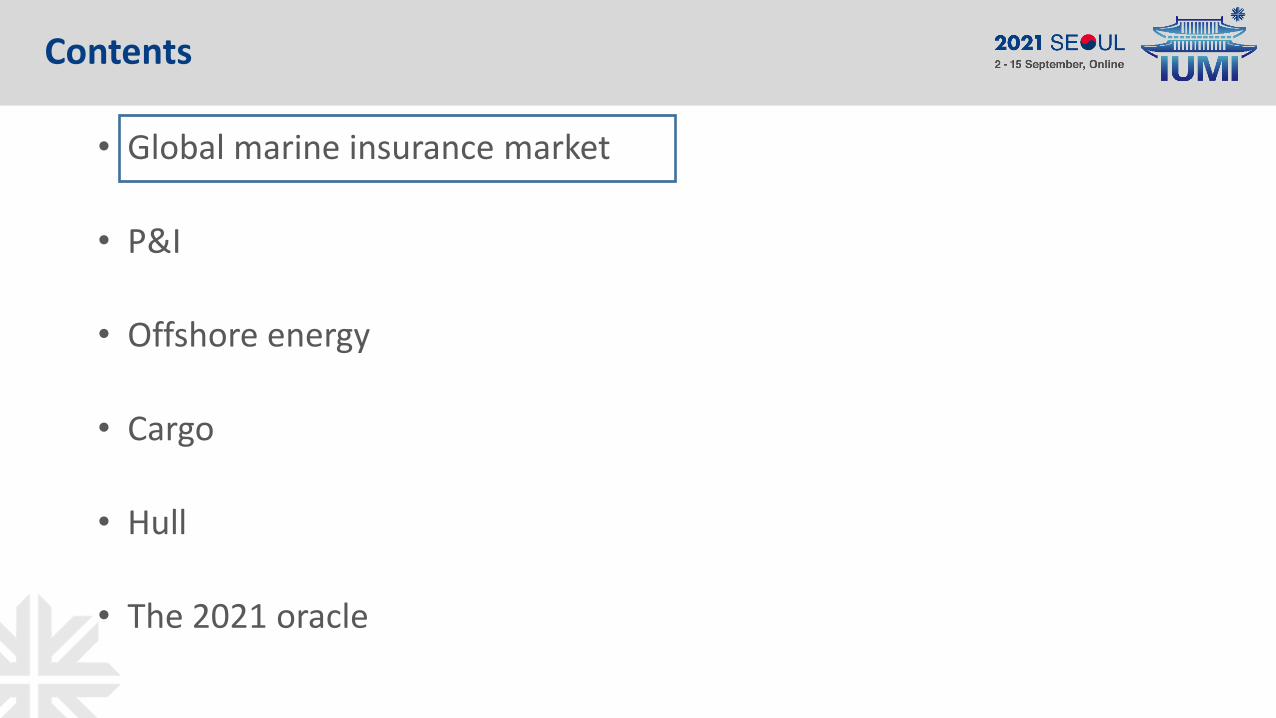
WELD Upstream Energy losses 2000-21 versus estimated Upstream premium income Source: Willis Towers Watson
Benign claims environment continues.
2020’s upstream loss record may turn out to be the lowest this century.
0
2
4
6
8
10
12
14
16
18
20
0
2
4
6
8
10
12
14
16
18
20
2000200120022003200420052006200720082009201020112012201320142015201620172018201920202021
Upstream losses excessUS$1m
estimated worldwideUpstream premium (US$)
Possible
deterioration of
2020 record
US$bnUS$bn
Source: WTW/ WTW Energy Loss Database as of June 24 2020 (figures include both insured and uninsured losses)

0%
10%
20%
30%
40%
50%
60%
2011
2012
2013
2014
2015
2016
2017
2018
2019
2020
2021
outstanding
paid 10th year
paid 9th year
paid 8th year
paid 7th year
paid 6th year
paid 5th year
paid 4th year
paid 3rd year
paid 2nd year
paid 1st year
Claims on youngest years will still develop.
Fragile balance between reduced premiums and modest claims impact.
Offshore energy gross loss ratios – Europe*Underwriting years 2011-2020, incl. liability, as of Dec. 2020, paid & outstanding as reported
* Lloyds, IUA, Nordic
NB: Data included not identical with previous year’s presentations (partly revised figures Europe; US figures excluded)

Offshore energy – Summary
• COVID-19 temporarily reduced demand for oil. Overcapacity led to strong dropin oil price but continuously rising since mid-2020.Will the upswing last and lead to an increase in activity?
• Historically 18 months time lag between improved oil price and authorisation for expenditure.
• More risk retained in recent years. Insurance capacity not equally reduced.
• Bottom in premium reduction seems to have been reached(but market capacity also on the rise again).
• Benign claims environment in recent years. Weather impact (hurricanes) reduced. 2020 hurricane Laura did not have severe impact on claims. 2021 hurricane Ida may contribute to further increase in oil price(production in Gulf of Mexico stopped before Ida hit)
• Fragile balance between reduced premiums and modest claims impact continues.
• Risks and claims potential arising from unit reactivation continue to be an issue.
Contents
• Global marine insurance market
• P&I
• Offshore energy
• Cargo
• Hull
• The 2021 oracle

39.4%
33.0%
10.1%
8.5%
6.1% 2.9%2020
Europe
Asia/Pacific
Latin America
North America
Middle East
Africa
Cargo premiums 2020 – by region
Total estimate: 17.2 USD billion / Change 2019 to 2020: 5.9%Exchange rate effects strongest on cargo premium.
NB: Some figures changed retrospectively, graphnot directly comparable with previous presentations.

Cargo premiums 2020 – by markets
Total estimate: 17.2 USD billion
Belgium1.9%
Brazil3.8%
China12.1%
France4.3%
Germany7.5%
India1.9%
Italy2.4%
Japan9.0%Mexico
2.6%Netherlands2.4%
Nordic1.5%
Russia1.6%
Singapore1.6%
Spain1.5%
UK (IUA)3.3%
UK (Lloyds)7.0%
USA7.8%
Other27.7%
2020
NB: Some figures changed retrospectively, graphnot directly comparable with previous presentations.

0
500,000
1,000,000
1,500,000
2,000,000
2,500,0002
01
2
20
13
20
14
20
15
20
16
20
17
20
18
20
19
20
20
China
Japan
USA
Germany
UK (Lloyds)
Brazil
France
UK (IUA)
India
Cargo premiums 2012-2020 – Selected markets
2014-15: strong USD «reduces» income of most countries.
China growth continues.Moderate growthin other regions.
Various influences. Global trade major driver.Exchange rate effects, other market conditions.
From 2017 several currenciesstrengthened against USD. Less strong deviations in recent years.
(underreporting in 2019)

80%
100%
120%
140%
160%
180%
200%
220%
20
05
20
06
20
07
20
08
20
09
20
10
20
11
20
12
20
13
20
14
20
15
20
16
20
17
20
18
20
19
20
20
20
21
20
22
World Trade Values (Goods) -IMF April 2021
World Trade Volume (Goods) -optimistic scenario 2020
World Trade Volume (Goods) -pessimistic scenario 2020
Global Cargo Premium
World Trade Volume (Goods) -IMF April 2021
Cargo premium versus World trade values & volumeIndex 2005=100%
COVID-19 rendered world trade forecasts uncertain.
Actual 2020 development better than optimistic IMFforecast.
Cargo premium follows world trade values.Lagged behind in recent years but upswing in 2020.
Extended risk covers and increasing risk of event losses (risk accumulation) need to be taken into account.
Source: World trade volume & values: International Monetary Fund.

Cargo loss ratios
Foto: Astrid Seltmann

Cargo – Gross* loss ratios underwriting year – Europe**Underwriting years 2011-20, as reported at 1,2,3,4,5 years, Gross premiums, paid+outstanding claims
2014, 2015, 2016: Deviation from typical pattern: extraordinary steep increase in loss ratios.
2017, 2018, 2019Return to more ‘normal’ (=flatter) development pattern.
2020 starts at a low level.
40%
50%
60%
70%
80%
1 2 3 4 5
2011
2012
2013
2014
2015
2016
2017
2018
2019
2020
* Technical break even: gross loss ratio does not exceed 100% minus the expense ratio (acquisition cost, capital cost, management expenses)**Data included from: Belgium, France, Germany, Netherlands, Italy, UK
NB: Data included changed compared to previous years’ presentations (partly revised figures Europe; no US figures included)

0%
10%
20%
30%
40%
50%
60%
70%
80%
90%
20
11
20
12
20
13
20
14
20
15
20
16
20
17
20
18
20
19
20
20
reported IBNR Estimate (10 year pattern)
Cargo – Ultimate gross* loss ratios uw year – Europe**
After a number of years with heavyevent impact, some improvementfrom 2019.
Outlier & Nat-cat event losses:2015: Tianjin port explosions2016: Hanjin, Amos-6 satellite2017: Hurricanes / Nat Cat2018: Mærsk Honam / Hurricanes2019: Fires, Golden Ray capsize2020: Nashville Tornados2021: X-Press Pearl, Ever Given (GA),
Hurricane Ida
Increasing expenses a concern.
* Technical break even: gross loss ratio does not exceed 100% minus the expense ratio (acquisition cost, capital cost, management expenses)**Data included from: Belgium, France, Germany, Netherlands, Italy, UK
NB: Data included not identical with previous year’s presentations (partly revised figures Europe; US figures excluded)

Cargo – Gross loss ratios accounting year – USGross premiums, paid claims
0.00 %
20.00 %
40.00 %
60.00 %
80.00 %
100.00 %
120.00 %
-
200,000,000.00
400,000,000.00
600,000,000.00
800,000,000.00
1,000,000,000.00
1,200,000,000.00
1,400,000,000.00
2011 2012 2013 2014 2015 2016 2017 2018 2019 2020
Gross premiums Incurred claims (paid+outstanding) Loss ratio incurred
*
* Underreporting in 2019
Superstorm Sandy
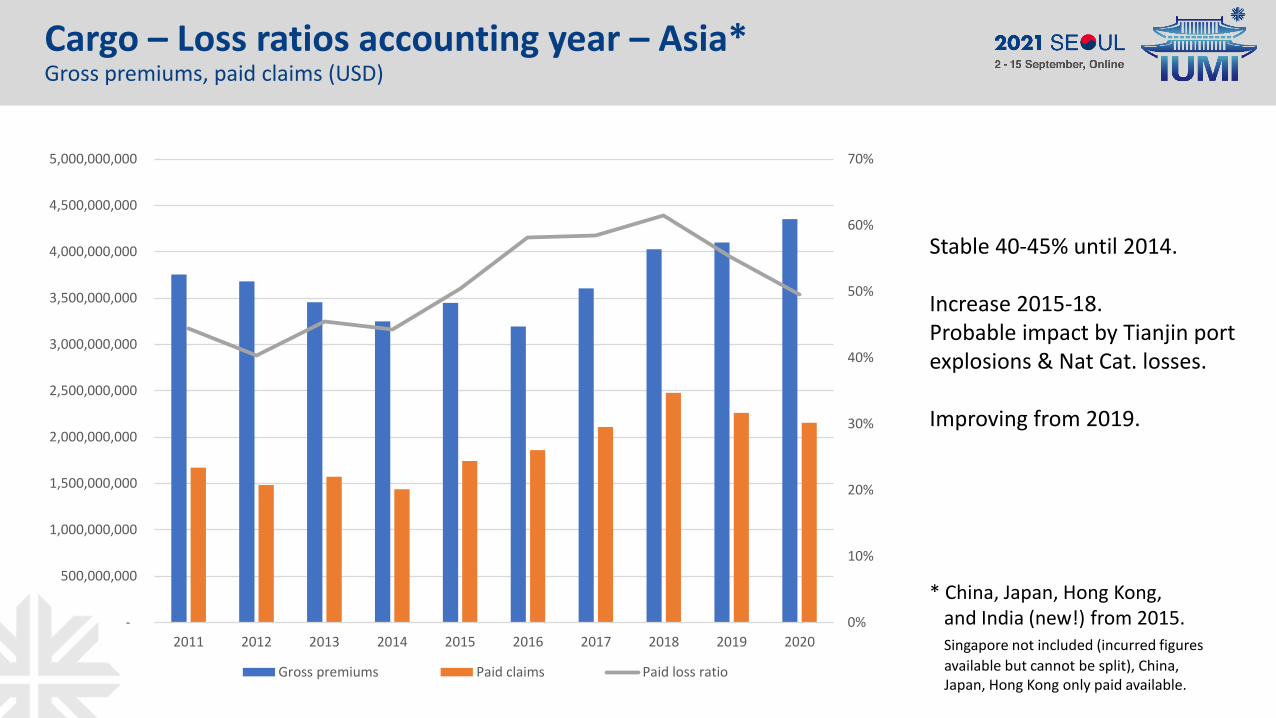
Cargo – Loss ratios accounting year – Asia* Gross premiums, paid claims (USD)
0%
10%
20%
30%
40%
50%
60%
70%
-
500,000,000
1,000,000,000
1,500,000,000
2,000,000,000
2,500,000,000
3,000,000,000
3,500,000,000
4,000,000,000
4,500,000,000
5,000,000,000
2011 2012 2013 2014 2015 2016 2017 2018 2019 2020
Gross premiums Paid claims Paid loss ratio
Stable 40-45% until 2014.
Increase 2015-18. Probable impact by Tianjin port explosions & Nat Cat. losses.
Improving from 2019.
* China, Japan, Hong Kong, and India (new!) from 2015.Singapore not included (incurred figures
available but cannot be split), China, Japan, Hong Kong only paid available.
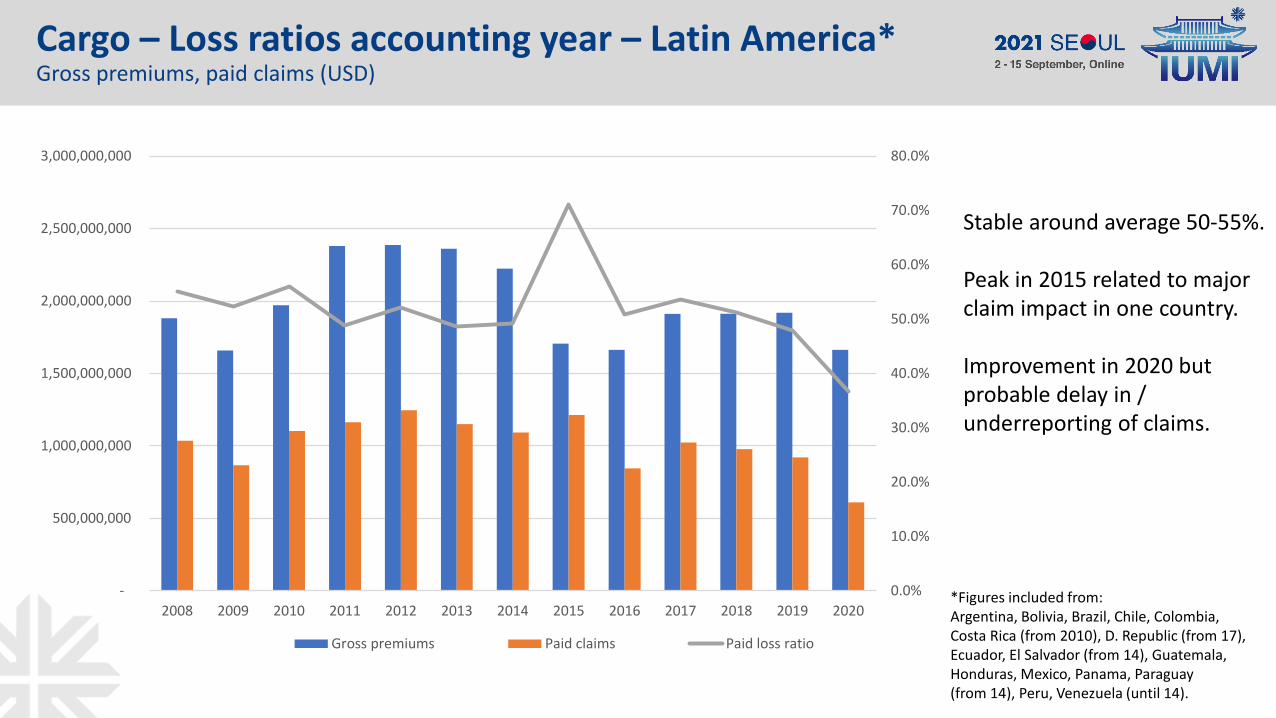
Cargo – Loss ratios accounting year – Latin America*Gross premiums, paid claims (USD)
Stable around average 50-55%.
Peak in 2015 related to major claim impact in one country.
Improvement in 2020 butprobable delay in / underreporting of claims.
*Figures included from: Argentina, Bolivia, Brazil, Chile, Colombia, Costa Rica (from 2010), D. Republic (from 17), Ecuador, El Salvador (from 14), Guatemala, Honduras, Mexico, Panama, Paraguay (from 14), Peru, Venezuela (until 14).
0.0%
10.0%
20.0%
30.0%
40.0%
50.0%
60.0%
70.0%
80.0%
-
500,000,000
1,000,000,000
1,500,000,000
2,000,000,000
2,500,000,000
3,000,000,000
2008 2009 2010 2011 2012 2013 2014 2015 2016 2017 2018 2019 2020
Gross premiums Paid claims Paid loss ratio

Cargo – Summary
• Improvements in results across markets.
• Trade growth interrupted in 2020 due to COVID-19 but catching up rapidly.
• Port congestion (delays) due to quarantine rules, backlog after blocking of Suez Canal (& general average claim), weather impact (floods Germany, China, US).
Persisting challenges:
• Fires, particularly on container vessels.
• Misdeclared cargo
• Increased value accumulation on single sites (ports, vessels).
• Covered risks increasingly stock exposure rather than transit exposure.
• Increase in severe weather conditions (wind/wave force, floods)
• Generally increased risk of large event losses (both Nat-cat and man made).
• Geopolitical tensions

Contents
• Global marine insurance market
• P&I
• Offshore energy
• Cargo
• Hull
• The 2021 oracle

Hull premiums 2020 – by region
Total estimate: 7.1 USD billion / Change 2019 to 2020: 6.0%
51.8%36.6%
5.9%4.6%
0.3%0.8% 2020
Europe
Asia/Pacific
Latin America
North America
Middle East
Africa
NB: Some figures changed retrospectively, graphnot directly comparable with previous presentations.
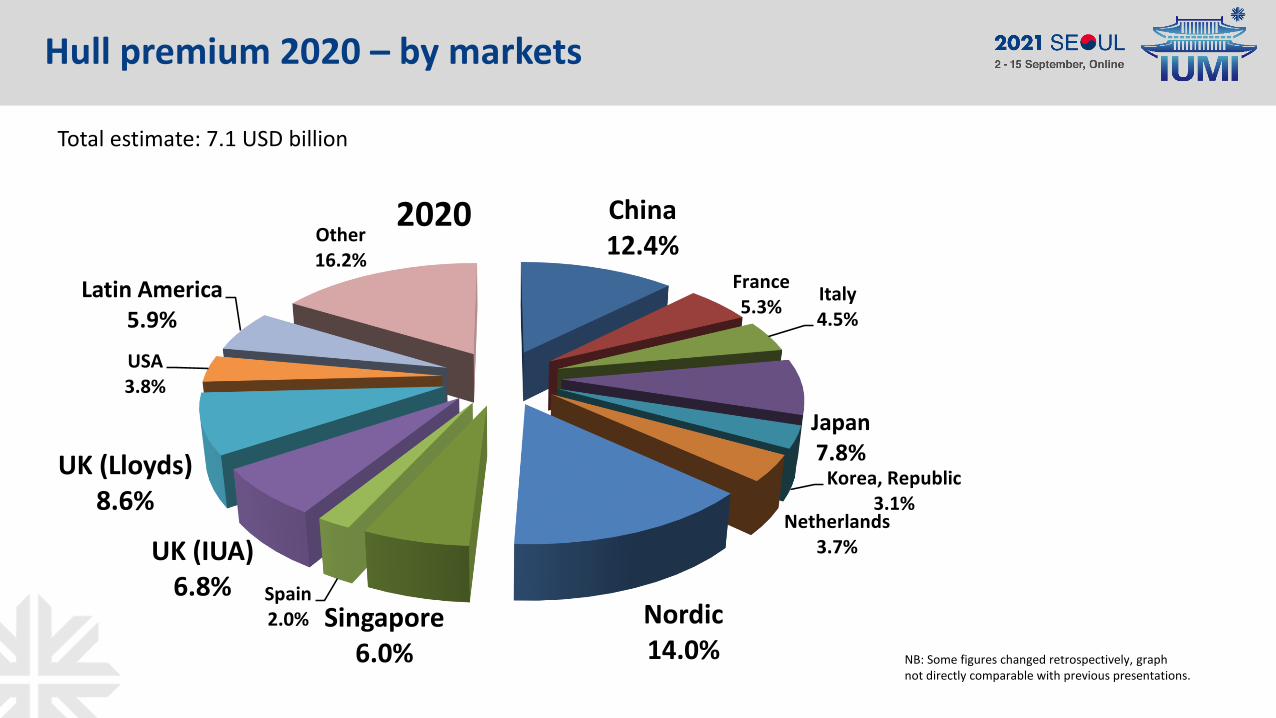
Hull premium 2020 – by markets
Total estimate: 7.1 USD billion
China12.4%
France5.3%
Italy4.5%
Japan7.8%
Korea, Republic3.1%
Netherlands3.7%
Nordic14.0%
Singapore6.0%
Spain2.0%
UK (IUA)6.8%
UK (Lloyds)8.6%
USA3.8%
Latin America5.9%
Other16.2%
2020
NB: Some figures changed retrospectively, graphnot directly comparable with previous presentations.

0
200,000
400,000
600,000
800,000
1,000,000
1,200,000
1,400,000
1,600,0002
01
2
20
13
20
14
20
15
20
16
20
17
20
18
20
19
20
20
Nordic
China
UK (Lloyds)
Japan
Singapore
UK (IUA)
Latin America
Korea, Republic of
Hull premium 2012-2020 – Selected markets
** Revised figures for all years
No comment.
Cheers!

Hull – Portfolio trends
Photo: Astrid Seltmann
Creativity neededto reduce shipping industry emissions

Average gross ton, age & vessel values
Since 2014 increasing gap between average vessel size and insured value.
Insured values on the rise.Gap started to reduce. Will development continue?
Average vessel age continues to increase (less new builds).
80 %
90 %
100 %
110 %
120 %
130 %
140 %
150 %
20
05
20
06
20
07
20
08
20
09
20
10
20
11
20
12
20
13
20
14
20
15
20
16
20
17
20
18
20
19
20
20
20
21
Averagegross ton
Average suminsured
Age
NoMISNordic Marine
Insurance Statistics

Change in insured values on renewal 2019-2021*Index, 2006 = 100%
Changes in vessel values in 2021 1st half year renewalsdiffer strongly by vessel segment.
Reflect activity/demand.
Booming container market,Supply/offshore still under influence of low oil price.
Under unchanged market conditions some value reduction expected due to aging of vessel.
NoMISNordic Marine
Insurance Statistics
-20.0 %
-15.0 %
-10.0 %
-5.0 %
0.0 %
5.0 %
10.0 %
15.0 %
20.0 %
2019 2020 2021
Bulk
Car/RoRo
Cargo
Chemical/Product
Container
Passenger
Supply/Offshore
Tank
*
* 2021: Renewals Jan.-June

Hull premium versus world fleet
World fleet continuesto grow, especially in size.
Downward trend in global hull premium and average vesselvalues came to a halt. Rising from 2019.
2012-2018 increasing gap between evolution ofworld fleet growth and hull premium/vessel values.
Slightly reducing in 2020.50 %
75 %
100 %
125 %
150 %
175 %
200 %
225 %
250 %
20
05
20
06
20
07
20
08
20
09
20
10
20
11
20
12
20
13
20
14
20
15
20
16
20
17
20
18
20
19
20
20
20
21
Gross tonnage(> 300 GT)
No. Ships (> 300 GT)
Global Marine HullPremium
Av. insured vesselvalue (Renewals &newbuilds - Cefor)
*
* as of 1st July

Hull – Claims trends
Photo: Astrid
Seltmann
May there alwaysbe enough water beneath your keel…

Hull – Claims frequency (H&M)
0.00 %
0.05 %
0.10 %
0.15 %
0.20 %
0.25 %
0.0%
5.0%
10.0%
15.0%
20.0%
25.0%
30.0%
35.0%
20
00
20
01
20
02
20
03
20
04
20
05
20
06
20
07
20
08
20
09
20
10
20
11
20
12
20
13
20
14
20
15
20
16
20
17
20
18
20
19
20
20
20
21
partial claims(< 75%SI, leftaxis)
TLO claims(>75% SI, rightaxis)
NoMISNordic Marine
Insurance Statistics
Overall claims frequencyLong-term downward trend.Extraordinary drop in 2020 (COVID-19 impact: reducedshipping activity in somesegments).
Total loss frequencyLong-term downward trend. Some increase but since2010 oscillating within lowlevel interval 0.05% - 0.1%.
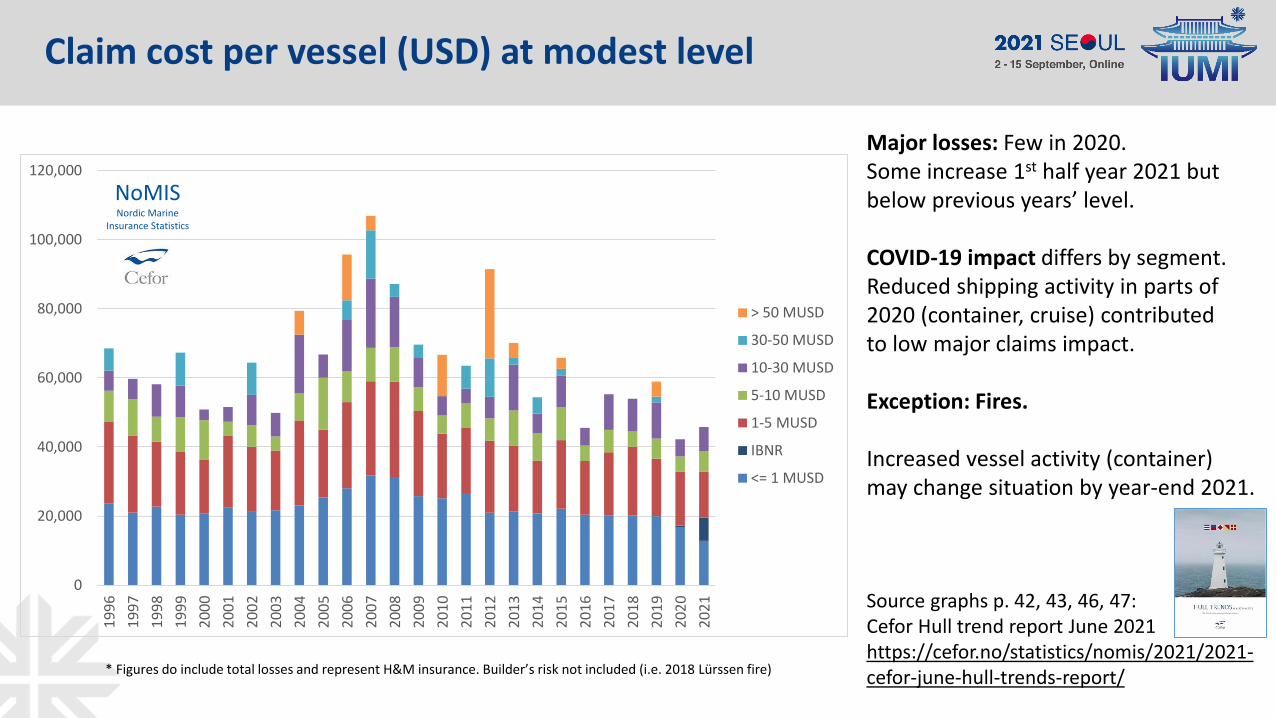
Claim cost per vessel (USD) at modest level
0
20,000
40,000
60,000
80,000
100,000
120,000
19
96
19
97
19
98
19
99
20
00
20
01
20
02
20
03
20
04
20
05
20
06
20
07
20
08
20
09
20
10
20
11
20
12
20
13
20
14
20
15
20
16
20
17
20
18
20
19
20
20
20
21
> 50 MUSD
30-50 MUSD
10-30 MUSD
5-10 MUSD
1-5 MUSD
IBNR
<= 1 MUSD
NoMISNordic Marine
Insurance Statistics
Major losses: Few in 2020. Some increase 1st half year 2021 butbelow previous years’ level.
COVID-19 impact differs by segment. Reduced shipping activity in parts of2020 (container, cruise) contributedto low major claims impact.
Exception: Fires.
Increased vessel activity (container) may change situation by year-end 2021.
Source graphs p. 42, 43, 46, 47:Cefor Hull trend report June 2021 https://cefor.no/statistics/nomis/2021/2021-cefor-june-hull-trends-report/* Figures do include total losses and represent H&M insurance. Builder’s risk not included (i.e. 2018 Lürssen fire)

Special issues of concern
Photo: Astrid Seltmann
Meeting expectedand unexpected risks.

Special issues
• Fires
• Very large vessels (Container fires, Ever Given grounding)
• Loss of containers
• Covid-19 – impact on H&M modest and differs by vessel segment.Crew/Passenger issues and delays impact other lines
• Climate change – increasing wind/wave forces, floods
• Industry targets for ESG goals / Emission reduction (propulsion, fuel types – monitor machinery claims trends)

Fire frequency: No decline despite strong drop in overall claims frequencyIndex, 2005 = 100%
40 %
60 %
80 %
100 %
120 %
140 %
160 %
20
05
20
06
20
07
20
08
20
09
20
10
20
11
20
12
20
13
20
14
20
15
20
16
20
17
20
18
20
19
20
20
20
21
Fires/Explosions
All claimsNoMISNordic Marine
Insurance Statistics

0.00 %
0.20 %
0.40 %
0.60 %
0.80 %
1.00 %
1.20 %
20
05
20
06
20
07
20
08
20
09
20
10
20
11
20
12
20
13
20
14
20
15
20
16
20
17
20
18
20
19
20
20
20
21
Vessel > 50,000 grosstons
Vessels <= 50,000gross tons
Linear (Vessel >50,000 gross tons)NoMIS
Nordic MarineInsurance Statistics
Fire frequency on large container vessels: upwards trend
More fire trends: Cefor Hull trend report June 2021: https://cefor.no/statistics/nomis/2021/2021-cefor-june-hull-trends-report/Cefor analyses with special focus::https://cefor.no/statistics/analysis-with-special-focus/

Hull – Loss ratios
Photo: Astrid Seltmann

20%
30%
40%
50%
60%
70%
80%
90%
100%
1 2 3 4 5
2011
2012
2013
2014
2015
2016
2017
2018
2019
2020
Hull – Gross* Loss ratios underwriting year – Europe Underwriting years 2011-20, as reported at 1,2,3,4,5 years, gross premiums, paid+outstanding claims
2020 starts at similar level as 2019.2019 return to flatter development (combination of reduced claims and increasing premiums).
2018: Impact of 2019 major losses (fires, other) against eroded premium base.
2016 to 2018: Few major losses, but 2017 impacted by hurricane yacht damage. Change in loss ratio pattern, strong increase 2nd year.
2014: impact from 2018 major claims(German yard fire) on long term policies
* Technical break even: gross loss ratio does not exceed 100% minus the expense ratio (acquisition cost, capital cost, management expenses)** Data included from: Belgium, France, Germany, Italy, Nordic (Cefor), UK, USA
NB: Data included changed compared to previous years’ presentations (partly revised figures Europe; US excluded)

0%
10%
20%
30%
40%
50%
60%
70%
80%
90%
100%
20
11
20
12
20
13
20
14
20
15
20
16
20
17
20
18
20
19
20
20
reported IBNR estimate (based on 10-year pattern)
Hull – Ultimate gross* loss ratios – EuropeUnderwriting years 2011-20, gross premiums, paid+outstanding claims (USD)
After years of unsustainable resultssome improvement from 2019.
Increasing premiums and low 2020 claims impact influences 2019 and 2020 underwriting years.
2014 to 2018 overcapacity, dropping vessel values, reduced activityinfluenced income negatively. Yacht damage (hurricanes) impacted2016/17.
Return to sustainable results possible?
Will return to full shipping activity in 2021 impact claims trends negatively?
2014 strong major loss impact (fire at German shipyard)
2016-17 influenced by yacht damage
(hurricanes)
*Technical break even: gross loss ratio does not exceed 100% minus the expense ratio (acquisition cost, capital cost, management expenses)** Data included from: Belgium, France, Germany, Italy, Nordic (Cefor), UK, some US data
NB: Data included changed compared to previous years’ presentations (partly revised figures Europe; no US figures included)
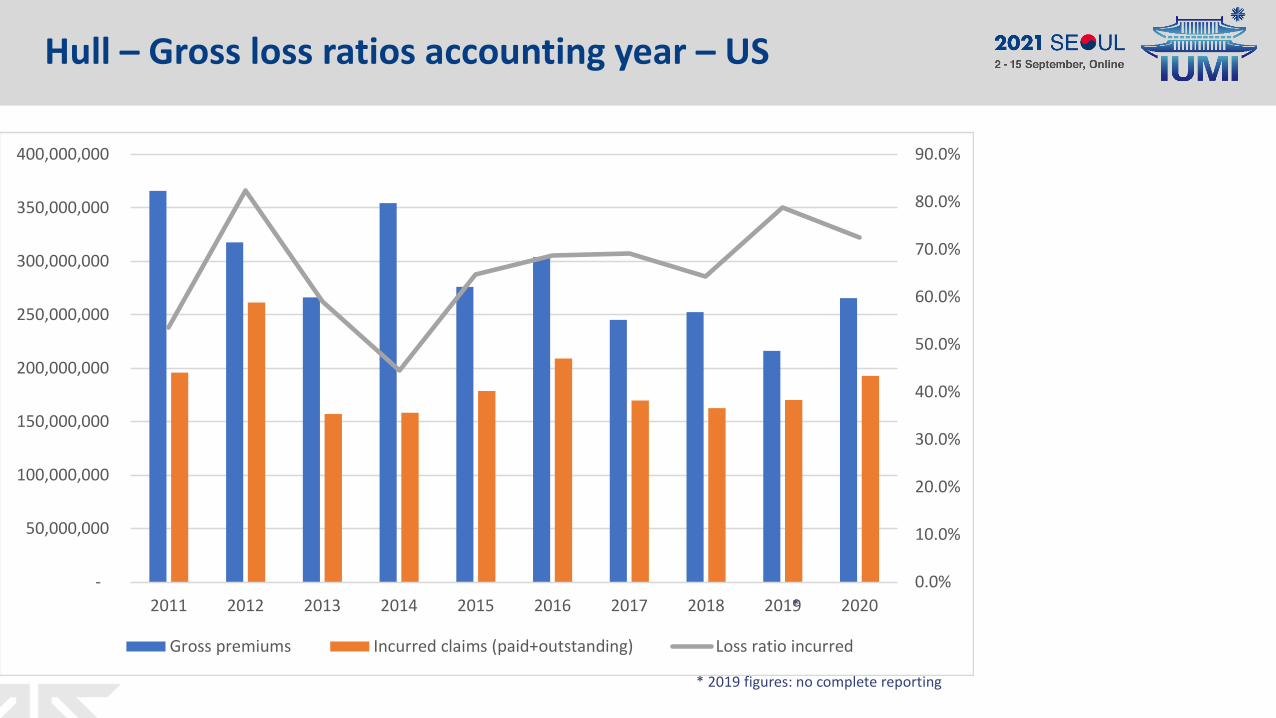
Hull – Gross loss ratios accounting year – US
0.0%
10.0%
20.0%
30.0%
40.0%
50.0%
60.0%
70.0%
80.0%
90.0%
-
50,000,000
100,000,000
150,000,000
200,000,000
250,000,000
300,000,000
350,000,000
400,000,000
2011 2012 2013 2014 2015 2016 2017 2018 2019 2020
Gross premiums Incurred claims (paid+outstanding) Loss ratio incurred
*
* 2019 figures: no complete reporting

Hull – Gross loss ratios accounting year – Asia*
0.0%
10.0%
20.0%
30.0%
40.0%
50.0%
60.0%
70.0%
80.0%
-
500,000,000
1,000,000,000
1,500,000,000
2,000,000,000
2,500,000,000
2011 2012 2013 2014 2015 2016 2017 2018 2019 2020
Gross premiums Paid claims Loss ratio - paid claims
* China, Japan, Hong Kong. India from 2015.Singapore not included. Incurred figures
available but cannot be split, for China, Japan, Hong Kong only paid available.
After an increase 2015-2017, loss ratios improve sligthly.
Relatively stable paid claims,from 2017 weighed againstincreasing premiums.
NB: accounting year: claimsattaching to uw year are paidover several accounting years.
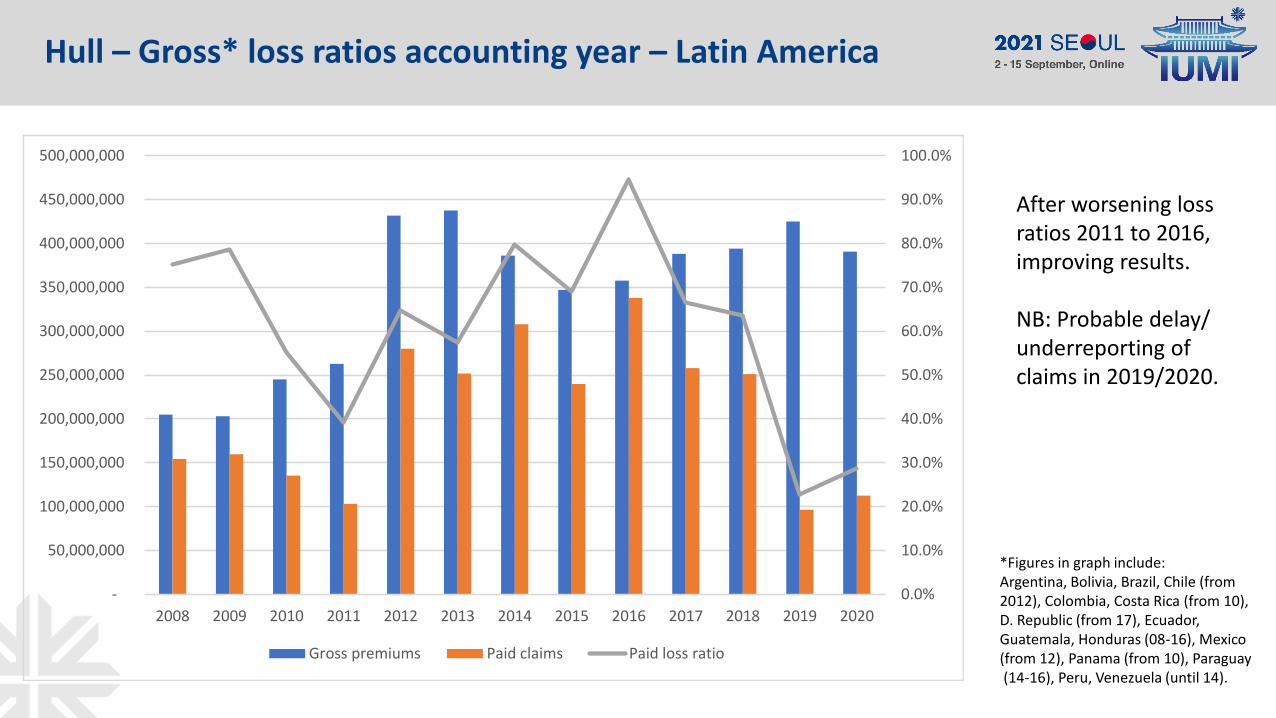
Hull – Gross* loss ratios accounting year – Latin America
0.0%
10.0%
20.0%
30.0%
40.0%
50.0%
60.0%
70.0%
80.0%
90.0%
100.0%
-
50,000,000
100,000,000
150,000,000
200,000,000
250,000,000
300,000,000
350,000,000
400,000,000
450,000,000
500,000,000
2008 2009 2010 2011 2012 2013 2014 2015 2016 2017 2018 2019 2020
Gross premiums Paid claims Paid loss ratio
After worsening loss ratios 2011 to 2016, improving results.
NB: Probable delay/underreporting of claims in 2019/2020.
*Figures in graph include: Argentina, Bolivia, Brazil, Chile (from 2012), Colombia, Costa Rica (from 10), D. Republic (from 17), Ecuador, Guatemala, Honduras (08-16), Mexico (from 12), Panama (from 10), Paraguay(14-16), Peru, Venezuela (until 14).

Hull – Summary
Exposure
• Downward trend in premium reached bottom but gap between fleet growth and premiums / values remains.
• Insured values on the rise in some segments (container), reflect demand. Supply/offshore still depressed.
• Higher single-risk exposure (with inherent risk of unprecedented
Claims
• Claims frequency and cost reduced in 2020. Some increase in 2021 but still moderate level.
• Total loss frequency: long-term positive trend. Some fluctuation but still at low level.
• Major loss impact low in 2020. Moderate rise in 2021.
• Exception: Fires. No decline in frequency. Negative impact on hull, cargo and environment (X-Press Pearl).
Results
• Improvement starting in 2019 continues into 2020. Combination of low claims impact and rising premiums.
• How will return to full shipping activity impact claims trends going forward? How do new propulsion types and fuels impact machinery claims? Will market overcapacity return? Can a sustainable balance be reached?
Contents
• Global marine insurance market
• P&I
• Offshore energy
• Cargo
• Hull
• The 2021 oracle

The 2021 Oracle – Looking into the crystal ball
Photo: Astrid
Seltmann
Photo: Astrid
Seltmann

2021 Outlook
• Global trade. Will optimistic outlook last or effect of short-term economic stimulus measures?
• COVID-19: back to normal or new measures?
• Cyber risk / Effects of increased use of digital means under pandemic
• Increasing Nat-cat impact: Wind/wave force, floods, Arctic
• Oil price: Will upswing last and initiate new activity?
• Emission reduction (new risks, potentially increased risk of machinery damage)
• Geopolitical tensions (sanctions, China-US trade war,…)
• Value accumulation (storage, vessels)
• Can cargo and hull markets recover in a sustainable way?

Reality – Complex issues to monitor
Foto: Astrid Seltmann
Foto: Astrid Seltmann
Foto: Astrid Seltmann
Foto: Astrid Seltmann
Foto: Astrid Seltmann
Foto: Astrid Seltmann
High-value risks
Oil price, fuel quality
Human factor/Qualification
Climate change/ Increase in Nat-cat
Changes in regulation (liabilities)
Fires on RoRo & Container vessels
Value accumulationArctic risks
New technology
Internet of things/complex technologies
Cyber risk
Emission reduction goals(IMO 2020 & beyond) Navigation

Contents
• Global marine insurance market
• P&I
• Offshore energy
• Cargo
• Hull
• The 2021 oracle
• A glimpse behind the scenes

Facts & Figures Committee Meeting

Life in Norway under COVID-19
Astrid’s social life Unemployed polar bear at Oslo airport
Photos: Astrid Seltmann

Enjoy the rest of the conference! ☺

Thank you!Astrid Seltmann, Analyst/Actuary
The Nordic Association of Marine [email protected]
Photo: Astrid Seltmann
Photo: Astrid Seltmann

Technical terms
Gross premium = Premium for insurance including the provision for anticipated losses (the pure premium) and for the anticipated expenses (loading), including also commission and brokerage but excluding taxes and other contributions on insurance premiums. Before deduction of any ceded reinsurance.Written premium = Complete premium due for insurance policies which start, i.e. “are written”, in a specific year (= the underwriting year of the policy). Does not give any information on actual premium payments/instalments, i.e. the cash flow.
Paid claims = Amounts the insurer has paid for known and registered claims less recoveries.
Outstanding claims reserve = Claims reserve for reported, but not yet (fully) paid claims, of which the insurer has an estimation of the total amount to be paid. Includes loss adjustment expenses = Sum of total claims estimates minus any amounts already paid for these claims.
Total claim = Paid amounts + outstanding claims reserve for all reported claims.
IBNR = ”Incurred but not reported” = additional claims reserve on top of the outstanding claims reserve, and which for claims incurred, but not yet known or registered in the insurer’s system. The necessary IBNR reserve is derived by statistical methods based on historical claims ladder statistics.
Loss ratio = Claims divided by premiums. Indicator of whether premiums are calculated correctly to match claims and other expenses.
Gross loss ratio (in this presentation) = Sum of total claims (and IBNR reserves), divided by gross written premiums
Underwriting year basis = Insurance figures are registered with the calender year in which the insurance policy starts, and to which the covered risks accordingly attach to. Example: a policy with cover period 01.07.06-30.06.07 has underwriting year 2006. Both claims occuring in 2006 and 2007 for risks attaching to this policy are thusattributed to underwriting year 2006. The underwriting year is not closed, so underwriting year figures change as long as there are payments related to policies with thisunderwriting year.
Accident year = Claims are registered with the calendar year in which an accident happens. Claims attaching to the same policy may thus be attributed to different accidentyears. Example: for the policy with cover period 01.07.06-30.06.07 a claim occuring in 2007 has accident year 2007, but underwriting year 2006. The accident year is not closed, so figures will change as long as there are claims payments related to claims occured in that accident year, e.g. a claim payment made in 2009 for an accident whichhappened in 2007 will be attributed to accident year 2007.
Accounting year (also booking year) = Insurance figures, regardless of their original source date, are booked into that year of account which is open at the time of actuallyentering the figures in the books. Contrary to the underwriting and accident year, the accounting year is closed at some point in time, usually at the end of one calendaryear, such that figures do not change any more once the accounting year is closed. These give the insurance results usually published in companies’ annual reports.