Embed Size (px)
Citation preview

Global Iron Ore and Steel ForecastUnlocking value across our portfolioEdgar Basto, Asset President Western Australia Iron Ore
21 March 2018

Disclaimer
21 March 2018
Edgar Basto: Asset President – Western Australia Iron Ore
2
Forward-looking statements
This presentation contains forward-looking statements, including statements regarding: trends in commodity prices and currency exchange rates; demand for commodities; plans, strategies and objectives of management; closure or divestment of
certain operations or facilities (including associated costs); anticipated production or construction commencement dates; capital costs and scheduling; operating costs and shortages of materials and skilled employees; anticipated productive lives of
projects, mines and facilities; provisions and contingent liabilities; tax and regulatory developments.
Forward-looking statements can be identified by the use of terminology such as ‘intend’, ‘aim’, ‘project’, ‘anticipate’, ‘estimate’, ‘plan’, ‘believe’, ‘expect’, ‘may’, ‘should’, ‘will’, ‘continue’, ‘annualised’ or similar words. These statements discuss future
expectations concerning the results of operations or financial condition, or provide other forward-looking statements.
These forward-looking statements are not guarantees or predictions of future performance, and involve known and unknown risks, uncertainties and other factors, many of which are beyond our control, and which may cause actual results to differ
materially from those expressed in the statements contained in this presentation. Readers are cautioned not to put undue reliance on forward-looking statements.
For example, future revenues from our operations, projects or mines described in this presentation will be based, in part, upon the market price of the minerals, metals or petroleum produced, which may vary significantly from current levels. These
variations, if materially adverse, may affect the timing or the feasibility of the development of a particular project, the expansion of certain facilities or mines, or the continuation of existing operations.
Other factors that may affect the actual construction or production commencement dates, costs or production output and anticipated lives of operations, mines or facilities include our ability to profitably produce and transport the minerals, petroleum
and/or metals extracted to applicable markets; the impact of foreign currency exchange rates on the market prices of the minerals, petroleum or metals we produce; activities of government authorities in some of the countries where we are exploring
or developing these projects, facilities or mines, including increases in taxes, changes in environmental and other regulations and political uncertainty; labour unrest; and other factors identified in the risk factors discussed in BHP’s filings with the US
Securities and Exchange Commission (the “SEC”) (including in Annual Reports on Form 20-F) which are available on the SEC’s website at www.sec.gov.
Except as required by applicable regulations or by law, the Group does not undertake any obligation to publicly update or review any forward-looking statements, whether as a result of new information or future events.
Past performance cannot be relied on as a guide to future performance.
Non-IFRS and other financial information
BHP results are reported under International Financial Reporting Standards (IFRS). This presentation may also include certain non-IFRS (also referred to as alternate performance measures) and other measures including Underlying attributable
profit, Underlying EBITDA (all references to EBITDA refer to Underlying EBITDA), Underlying EBIT, Adjusted effective tax rate, Controllable cash costs, Free cash flow, Gearing ratio, Net debt, Net operating assets, Operating assets free cash flow,
Principal factors that affect Underlying EBITDA, Underlying basic earnings/(loss) per share, Underlying EBITDA margin and Underlying return on capital employed (ROCE) (all references to return on capital employed refer to Underlying return on
capital employed), Underlying return on invested capital (ROIC). These measures are used internally by management to assess the performance of our business and segments, make decisions on the allocation of our resources and assess
operational management. Non-IFRS and other measures have not been subject to audit or review and should not be considered as an indication of or alternative to an IFRS measure of profitability, financial performance or liquidity.
Presentation of data
Unless specified otherwise: variance analysis relates to the relative performance of BHP and/or its operations during the December 2017 half year compared with the December 2016 half year; operations includes operated assets and non-operated
assets; data is presented on a continuing operations basis from the 2014 financial year onwards; copper equivalent production based on 2017 financial year average realised prices; references to Underlying EBITDA margin exclude third party
trading activities; data from subsidiaries are shown on a 100 per cent basis and data from equity accounted investments and other operations is presented, with the exception of net operating assets, reflecting BHP’s share; medium term refers to our
five year plan. Queensland Coal comprises the BHP Billiton Mitsubishi Alliance (BMA) asset, jointly operated with Mitsubishi, and the BHP Billiton Mitsui Coal (BMC) asset, operated by BHP. Numbers presented may not add up precisely to the totals
provided due to rounding.
No offer of securities
Nothing in this presentation should be construed as either an offer or a solicitation of an offer to buy or sell BHP securities in any jurisdiction, or be treated or relied upon as a recommendation or advice by BHP.
Reliance on third party information
The views expressed in this presentation contain information that has been derived from publicly available sources that have not been independently verified. No representation or warranty is made as to the accuracy, completeness or reliability of
the information. This presentation should not be relied upon as a recommendation or forecast by BHP.
BHP and its subsidiaries
In this presentation, the terms ‘BHP’, ‘Group’, ‘BHP Group’, ‘we’, ‘us’, ‘our’ and ‘ourselves’ are used to refer to BHP Billiton Limited, BHP Billiton Plc and, except where the context otherwise requires, their respective subsidiaries as defined in note 28
‘Subsidiaries’ in section 5.1 of BHP’s Annual Report on Form 20-F and in note 13 ‘Related undertaking of the Group’ in section 5.2 of BHP’s Annual Report on Form 20-F.

Key Themes
21 March 2018
Edgar Basto: Asset President – Western Australia Iron Ore
3
Health and safety are core values and our highest priority
Emerging Asia to drive steel demand
Our focus on safety, culture and productivity support performance
Promoting stability and driving improvement through innovation and work practices
Partnering with our communities to Think Big

Emerging Asia to drive long-term steel demand
21 March 2018
Edgar Basto: Asset President – Western Australia Iron Ore
4
Source: Platts; worldsteel; BHP analysis.
1. Emerging Asia includes India, ASEAN and other South Asian countries.
2. New integrated steel projects commissioned or being built since 2017.
Global finished steel demand growth breakdown(million tonnes finished steel)
1.7% CAGR
3.1% CAGR
Silk Road Economic
Belt
Map of new integrated steel plants2
21st Century Maritime
Silk Road
WAIO
New integrated steel mills in India and Southeast Asia
BHP Iron Ore operations

Structural reform in China drives demand for quality ore
21 March 2018
Edgar Basto: Asset President – Western Australia Iron Ore
5
Low Grade fines type has grown faster than other ore types High grade ore currently remains in high demand
Data source: Wood Mackenzie
-60
-40
-20
0
20
40
60
Jan-15 Jul-15 Jan-16 Jul-16 Jan-17 Jul-17 Jan-18
Platts 62.5% Fe Lump MB 58% Fe Fines
Delta to Platts 62% Fe Fines
(US cents/dmtu)
Data source: Platts, Metal Bulletin
0%
20%
40%
60%
80%
100%
2000 2017 2020
Low Grade(<60% Fe)
Med Grade(<65% Fe)
High Grade(>=65% Fe)
Iron Ore Supply
(% of total seaborne supply)

Unlocking value across our business
21 March 2018
Edgar Basto: Asset President – Western Australia Iron Ore
6
Port Hedland to support further productivity
• On track to 290Mtpa run rate by end of FY19
• Flow on employment and business opportunities
South Flank sustaining volumes
• Project scheduled to be submitted for Board approval mid-CY18
• If approved, MAC will become world’s largest stand-alone iron
ore mining and processing centre
-10 0 10 20 30 40Product mix (% of lump and pellets)
Improving product mix with South Flank1
(Grade, Fe %)
Peer 1
Portfolio
Peer 3
Portfolio
BHP with South Flank
production
BHP
Peer 2
Portfolio
57
59
61
63
65
Note: Bubble size
represents production100
Mt
1. BHP share. Source: Publicly available information and BHP internal analysis.
(Peer group comprises Vale, Fortescue Metals Group and Rio Tinto)
150
225
300
FY13 FY14 FY15 FY16 FY17 FY18e FY19e
4,000
5,000
6,000
Port gross loading rate (LHS) Port outflow (RHS)
Outflow(Mt)
Improvement in WAIO port outflow capacity(Tonnes per shiploader/hour)

Technology improves safety and productivity
7
Removing people from potential exposure to harmful situations
• Full truck autonomy at Jimblebar has significantly reduced safety incidents
Increasing the efficiency of resource extraction
• Leading the way with one of the world’s largest autonomous blast hole
drill fleets, enabling operations to continue despite climatic conditions
Reducing waste and variability
• Automated train scheduling powered by artificial intelligence has seen us
almost eliminate cancellations due to railway congestion
Improving safety
Increasing productivity
By 2025, our vision is to be fully integrated and highly automated from resource to market
21 March 2018
Edgar Basto: Asset President – Western Australia Iron Ore

Continuous improvement culture drives performance…
21 March 2018 8
Edgar Basto: Asset President – Western Australia Iron Ore
1. Total Recordable Injury Frequency Rate H1 FY14 v H1 FY18
2. Saleable ore annualised run rate H1 FY14 vs H1 FY18
3. FOB unit cost excluding freight and royalties H1 FY14 vs H1 FY18
4. FOB unit cost excluding freight and royalties, medium term guidance is based on exchange rate of AUD/USD 0.75
0
10
20
30
180
220
260
300
H1 FY14 H1 FY15 H1 FY16 H1 FY17 H1 FY18 FY19e
Run rate (LHS) Unit Cost (RHS)
WAIO annualised run rate(Iron ore production, Mtpa)
Q2 FY18 record run-rateFY19 exit rate
Unit cost4
(US$/t)
Medium term
<US$13/t
• 14% improvement in TRIF1
• 26% increase in production2
• 48% reduction in cost3
Frontline actively identifying improvement initiatives
~ 7,000
direct employees
Seeking to deliver
~ 3,000 initiatives
Medium term

.. and supports sustainable outcomes
21 March 2018 9
Edgar Basto: Asset President – Western Australia Iron Ore
Standardising and simplifying our systems
• Standardised worksheets and documentation
• Continuous engagement and reviewing of procedures
• Dedicated coaching to efficiently embed standardisation
Improving tooling and redesigning our work
• Streamline work sequences, tooling, pre and post work
requirements
• Removing our people from harm’s way
Reducing exposure, empowering our people and enabling an inclusive and diverse workplace
Case Study - Perth Repair Centre Radiator Overhaul
• 85% reduction in recordable injuries
• 50% reduction in task duration
• Reduction in labour cost from 112% to 76% of external vendor
costs
It has improved the culture in the workshop as a whole – not just our team” - Technician“
Now everyone disassembles consistently and we aren’t wasting time waiting for missing parts” - Supervisor“
Everyone uses the correct tools all the time and they’re always available when we need them” - Technician“
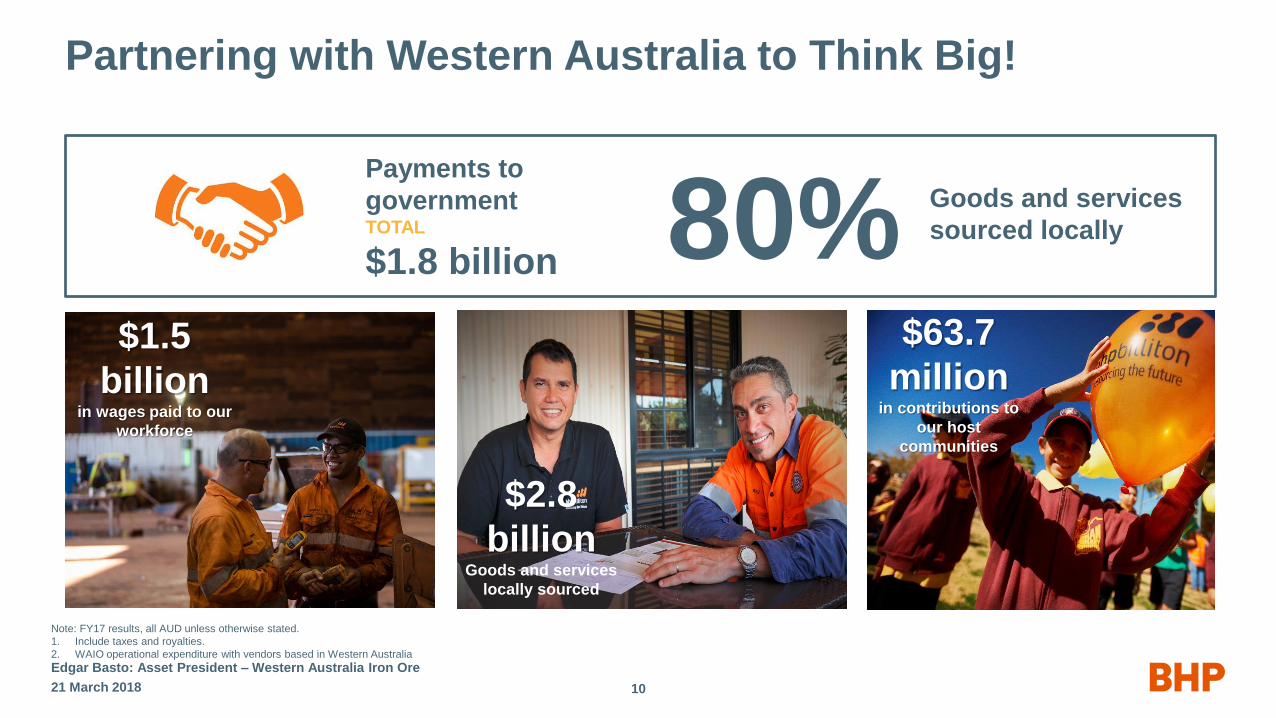
Partnering with Western Australia to Think Big!
Edgar Basto: Asset President – Western Australia Iron Ore
21 March 2018 10
Payments to
government TOTAL
$1.8 billion
$1.5
billion in wages paid to our
workforce
$63.7
million in contributions to
our host
communities
Note: FY17 results, all AUD unless otherwise stated.
1. Include taxes and royalties.
2. WAIO operational expenditure with vendors based in Western Australia
80% Goods and services
sourced locally
$2.8
billionGoods and services
locally sourced

Key Themes
21 March 2018
Edgar Basto: Asset President – Western Australia Iron Ore
11
Health and safety are core values and our highest priority
Emerging Asia to drive steel demand
Our focus on safety, culture and productivity supports performance
Promoting stability and driving improvement through innovation and work practices
Partnering with our communities to Think Big