Embed Size (px)
Citation preview
(c) AZOTH Analytics June 2017
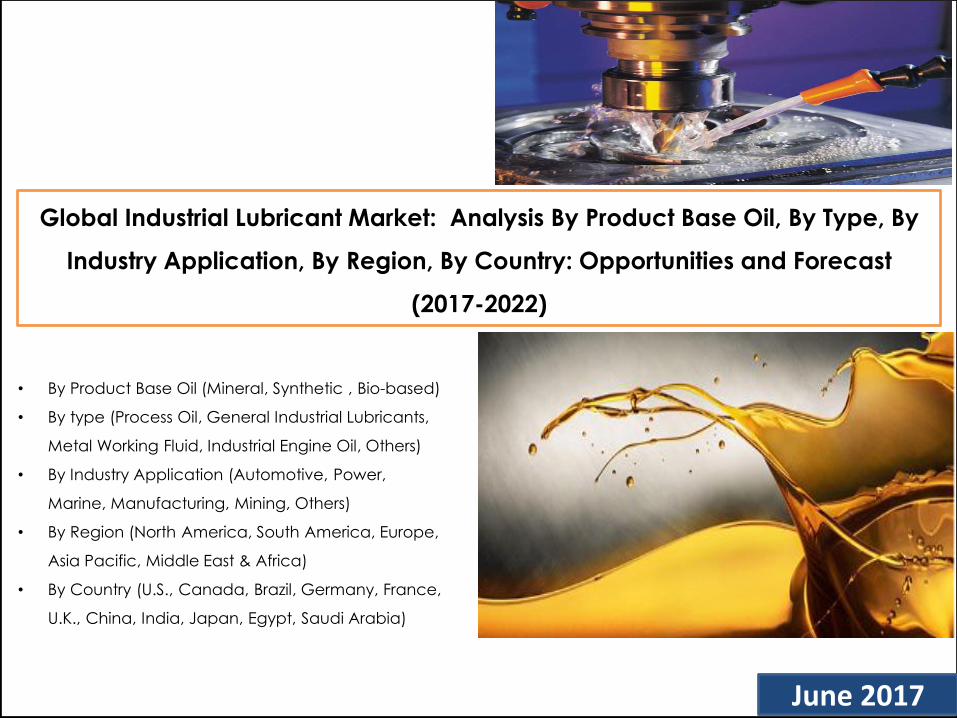
Global Industrial Lubricant Market: Analysis By Product Base Oil, By Type, By
Industry Application, By Region, By Country: Opportunities and Forecast
(2017-2022)
• By Product Base Oil (Mineral, Synthetic , Bio-based)
• By type (Process Oil, General Industrial Lubricants,
Metal Working Fluid, Industrial Engine Oil, Others)
• By Industry Application (Automotive, Power,
Marine, Manufacturing, Mining, Others)
• By Region (North America, South America, Europe,
Asia Pacific, Middle East & Africa)
• By Country (U.S., Canada, Brazil, Germany, France,
U.K., China, India, Japan, Egypt, Saudi Arabia)

(c) AZOTH Analytics 2
Global Coverage Regional Coverage
Industrial Lubricants Market- By
Value (2012-2016)
Industrial Lubricants Market – By
Value (2017-2022)
Industrial Lubricant Market, By
Product – By Value (2012-2022)
Industrial Lubricant Market, By
Type – By Value (2012-2022)
Industrial Lubricant Market, By
Application – By Value (2012-2022)
North America
South America
Europe
Asia Pacific
Middle East & Africa
Country Coverage Company Coverage
Product Benchmarking
Business Overview
Market and Regional share of
top leading Companies
Product Launches & Recent
Approvals
Merger & Acquisition
Exxon Mobil
FUCHS Group
Royal Dutch Shell
BP Global
Total Lubricants
Sinopec Limited
Renewable lubricants Inc.
Environmental Lubricants
PetroChina Company Limited
Indian Oil Corporation Limited
g
Global Coverage
Regional Coverage
Country Coverage
Scope of the Study
Segment Coverage
By Product Base Oil
By Type
By Applications
Global Industrial Lubricant Market: Analysis By Product Base Oil (Mineral, Synthetic, Bio-based), By Type (Process Oil, General Industrial Lubricants, Metal Working Fluid, Industrial Engine Oil, Others), By Industry Application (Automotive, Power, Marine, Manufacturing, Mining, Others), By Region (North America, South America, Europe, Asia Pacific, Middle East & Africa), By Country (U.S., Canada, Brazil, Germany, France, U.K., China, India, Japan, Egypt, Saudi Arabia): (2012-2022)
Region (North America, South America, Europe, APAC and Middle East & Africa)
Country (U.S., Canada, Brazil, Germany, U.K., France China, India, Japan, Egypt,
Saudi Arabia)
Global Industrial Lubricant Market – By Value (2012-2022)
Breakdown-By Product, By Type & By
Application (2012-2022) Industrial Lubricant Market – By Product,
By Value (2012-2022) Mineral Synthetic Bio-Based Industrial Lubricant Market - By Type , By
Value (2012-2022) Process Oil General industrial lubricants Metal Working Fluid Industrial Engine Oil Others Industrial Lubricants Market- By
Application, By Value (2012-2022) Automotive Manufacturing Power Mining Marine Others
Industrial Lubricants Market :
By Value (2012-22)
By Type : By Value (2012-22)
By Product : By Value (2012-22)
U.S.
Canada
Brazil
U.K.
Germany
France
China
Japan
India
Saudi Arabia
Egypt
(c) AZOTH Analytics
Table of Content
S.No Particulars Page No.
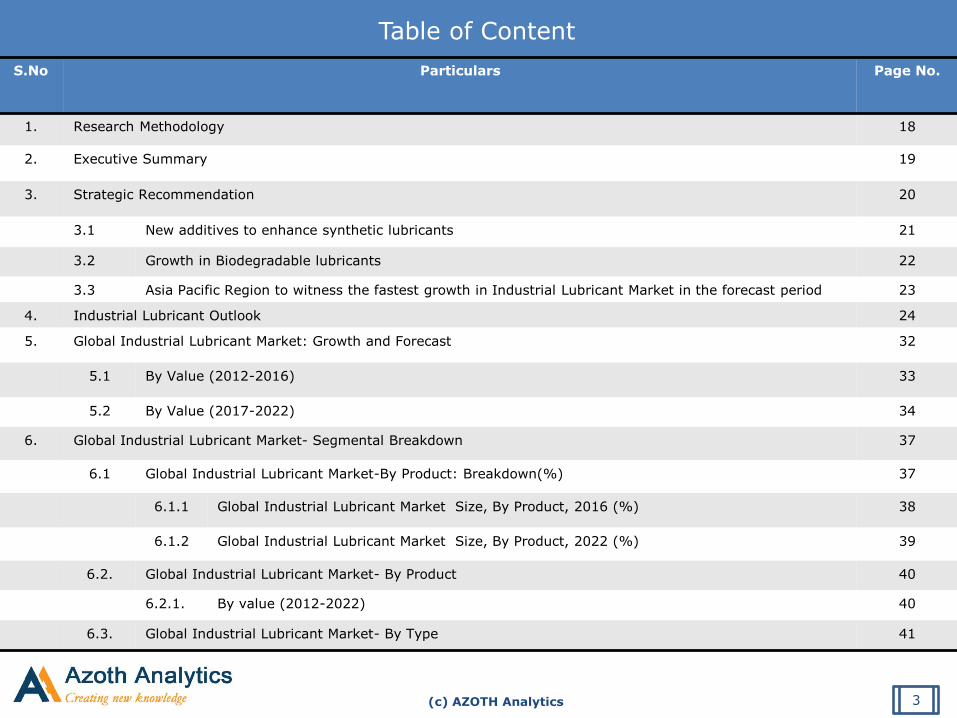
1. Research Methodology 18
2. Executive Summary 19
3. Strategic Recommendation 20
3.1 New additives to enhance synthetic lubricants 21
3.2 Growth in Biodegradable lubricants 22
3.3 Asia Pacific Region to witness the fastest growth in Industrial Lubricant Market in the forecast period 23
4. Industrial Lubricant Outlook 24
5. Global Industrial Lubricant Market: Growth and Forecast 32
5.1 By Value (2012-2016) 33
5.2 By Value (2017-2022) 34
6. Global Industrial Lubricant Market- Segmental Breakdown 37
6.1 Global Industrial Lubricant Market-By Product: Breakdown(%) 37
6.1.1 Global Industrial Lubricant Market Size, By Product, 2016 (%) 38
6.1.2 Global Industrial Lubricant Market Size, By Product, 2022 (%) 39
6.2. Global Industrial Lubricant Market- By Product 40
6.2.1. By value (2012-2022) 40
6.3. Global Industrial Lubricant Market- By Type 41
3

(c) AZOTH Analytics
Table of Content
S. No Particulars Page No.
6.3.1. By Value (2012-2022) 41
6.4 Global Industrial Lubricant Market, By Application 42
6.4.1. By Value (2012-2022) 42
7. Global Industrial Lubricant Market: Regional Analysis 43
7.1. Global Industrial Lubricant Market, By Region: Breakdown (%) 43
7.1.1 Global Industrial Lubricant Market Size, By Region, 2016 (%) 44
7.1.2 Global Industrial Lubricant Market Size, By Region, 2022 (%) 46
8. North America Industrial Lubricant Market: An Analysis 47
8.1. North America Industrial Lubricant Market Size 47
8.1.1. By Value (2012-2016) 48
8.1.2. By Value (2017-2022) 49
8.2. North America Industrial Lubricant Market: By Product 52
8.2.1. By Value (2012-2022) 52
8.3. North America Industrial Lubricant Market: By Type 53
8.3.1. By Value (2012-2022) 53
8.4. North America Industrial Lubricant Market: By Application 54
8.4.1. By Value (2012-2022) 54
4
(c) AZOTH Analytics
Table of Content
S. No Particulars Page No.
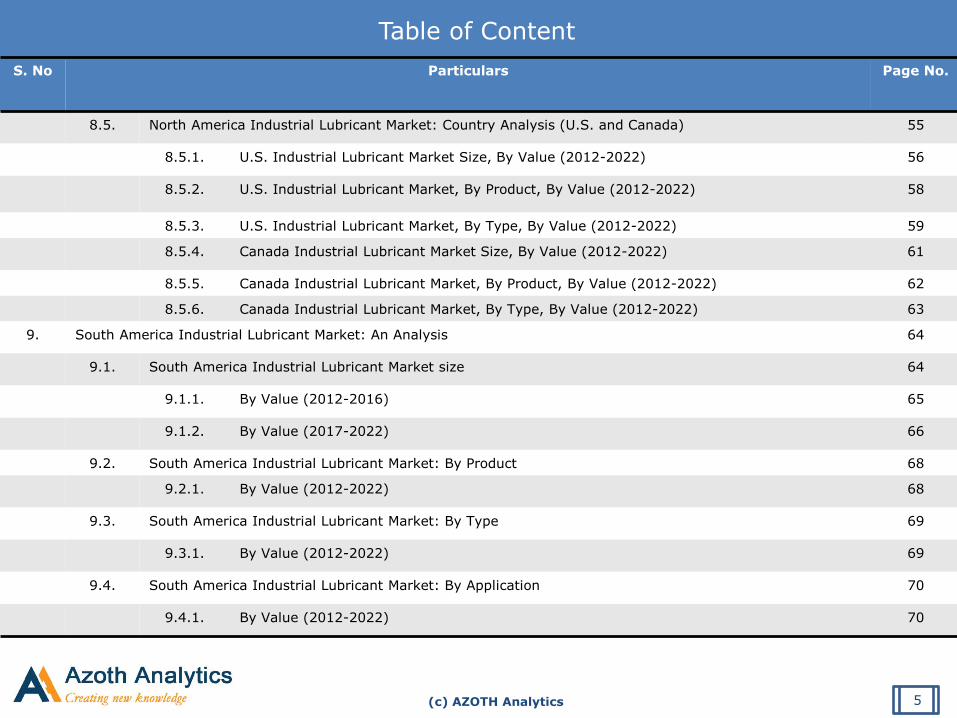
8.5. North America Industrial Lubricant Market: Country Analysis (U.S. and Canada) 55
8.5.1. U.S. Industrial Lubricant Market Size, By Value (2012-2022) 56
8.5.2. U.S. Industrial Lubricant Market, By Product, By Value (2012-2022) 58
8.5.3. U.S. Industrial Lubricant Market, By Type, By Value (2012-2022) 59
8.5.4. Canada Industrial Lubricant Market Size, By Value (2012-2022) 61
8.5.5. Canada Industrial Lubricant Market, By Product, By Value (2012-2022) 62
8.5.6. Canada Industrial Lubricant Market, By Type, By Value (2012-2022) 63
9. South America Industrial Lubricant Market: An Analysis 64
9.1. South America Industrial Lubricant Market size 64
9.1.1. By Value (2012-2016) 65
9.1.2. By Value (2017-2022) 66
9.2. South America Industrial Lubricant Market: By Product 68
9.2.1. By Value (2012-2022) 68
9.3. South America Industrial Lubricant Market: By Type 69
9.3.1. By Value (2012-2022) 69
9.4. South America Industrial Lubricant Market: By Application 70
9.4.1. By Value (2012-2022) 70
5

(c) AZOTH Analytics
Table of Content
S. No Particulars Page No.
9.5. South America Industrial Lubricant Market: Country Analysis (Brazil) 71
9.5.1. Brazil Industrial Lubricant Market Size, By Value (2012-2022) 72
9.5.2. Brazil Industrial Lubricant Market, By Product, By Value (2012-2022) 73
9.5.3. Brazil Industrial Lubricant Market, By Type, By Value (2012-2022) 74
10. Europe Industrial Lubricant Market: An Analysis 75
10.1. Europe Industrial Lubricant Market size 75
10.1.1. By Value (2012-2016) 76
10.1.2. By Value (2017-2022) 77
10.2. Europe Industrial Lubricant Market: By Product 79
10.2.1. By Value (2012-2022) 79
10.3. Europe Industrial Lubricant Market: By Type 80
10.3.1. By Value (2012-2022) 80
10.4. Europe Industrial Lubricant Market: By Application 81
10.4.1. By Value (2012-2022) 81
6

(c) AZOTH Analytics
Table of Content
S. No Particulars Page No.
10.5. Europe Industrial Lubricant Market: Country Analysis (Germany, U.K., France) 82
10.5.1. Germany Industrial Lubricant Market Size, By Value (2012-2022) 83
10.5.2. Germany Industrial Lubricant Market, By Product, By Value (2012-2022) 84
10.5.3. Germany Industrial Lubricant Market, By Type, By Value (2012-2022) 85
10.5.4. U.K. Industrial Lubricant Market Size, By Value (2012-2022) 87
10.5.5. U.K. Industrial Lubricant Market, By Product, By Value (2012-2022) 88
10.5.6. U.K. Industrial Lubricant Market, By Type, By Value (2012-2022) 89
10.5.7. France Industrial Lubricant Market Size, By Value (2012-2022) 91
10.5.8. France Industrial Lubricant Market, By Product, By Value (2012-2022) 92
10.5.9. France Industrial Lubricant Market, By Type, By Value (2012-2022) 93
11. APAC Industrial Lubricant Market: An Analysis 94
11.1. APAC Industrial Lubricant Market size 94
11.1.1. By Value (2012-2016) 95
11.1.2. By Value (2017-2022) 96
11.2. APAC Industrial Lubricant Market: By Product 99
11.2.1. By Value (2012-2022) 99
11.3. APAC Industrial Lubricant Market: By Type 100
11.3.1. By Value (2012-2022) 100
7

(c) AZOTH Analytics
Table of Content
S. No Particulars Page No.
11.4. APAC Industrial Lubricant Market: By Application 101
11.4.1. By Value (2012-2022) 101
11.5. APAC Industrial Lubricant Market: Country Analysis (China, India, Japan) 102
11.5.1. China Industrial Lubricant Market Size, By Value (2012-2022) 103
11.5.2. China Industrial Lubricant Market, By Product, By Value (2012-2022) 105
11.5.3. China Industrial Lubricant Market, By Type, By Value (2012-2022) 106
11.5.4. India Industrial Lubricant Market Size, By Value (2012-2022) 108
11.5.5. India Industrial Lubricant Market, By Product, By Value (2012-2022) 109
11.5.6. India Industrial Lubricant Market, By Type, By Value (2012-2022) 110
11.5.7. Japan Industrial Lubricant Market Size, By Value (2012-2022) 112
11.5.8. Japan Industrial Lubricant Market, By Product, By Value (2012-2022) 113
11.5.9. Japan Industrial Lubricant Market, By Product, By Value (2012-2022) 114
12. Middle East & Africa Industrial Lubricant Market: An Analysis 115
12.1. Middle East & Africa Industrial Lubricant Market size 115
12.1.1. By Value (2012-2016) 116
12.1.2. By Value (2017-2022) 117
12.2. Middle East & Africa Industrial Lubricant Market: By Product 120
8

(c) AZOTH Analytics
Table of Content
S. No Particulars Page No.
12.2.1. By Value (2012-2022) 120
12.3. Middle East & Africa Industrial Lubricant Market: By Type 121
12.3.1. By Value (2012-2022) 121
12.4. Middle East & Africa Industrial Lubricant Market: By Application 122
12.4.1. By Value (2012-2022) 122
12.5. Middle East & Africa Industrial Lubricant Market: Country Analysis (Egypt, Saudi Arabia) 123
12.5.1. Egypt Industrial Lubricant Market Size, By Value (2012-2022) 124
12.5.2. Egypt Industrial Lubricant Market, By Product, By Value (2012-2022) 125
12.5.3. Egypt Industrial Lubricant Market, By Type, By Value (2012-2022) 127
12.5.4. Saudi Arabia Industrial Lubricant Market Size, By Value (2012-2022) 129
12.5.5. Saudi Arabia Industrial Lubricant Market, By Product, By Value (2012-2022) 130
12.5.6. Saudi Arabia Industrial Lubricant Market, By Type, By Value (2012-2022) 131
13. Market Dynamics 132
13.1 Global Industrial Lubricant Market Growth Drivers 132
13.2 Global Industrial Lubricant Market Challenges 135
14. Market Trends 138
15. Porter’s Five Forces Analysis –Industrial Lubricant Market 141
16. SWOT Analysis –Industrial Lubricant Market 143
9

(c) AZOTH Analytics
Table of Content
S. No Particulars Page No.
17. Competitive Landscape 145
17.1. Global Industrial Lubricant Market- Company Share Analysis 146
17.2. Product Benchmarking of Key Industry Players in Lubricant Market, By Application 147
17.3. Product Benchmarking of Key Industry Players in Lubricant Market, By Type 148
18. Policy and Regulatory Landscape 149
19. Company Profiling 155
19.1 Exxon Mobil 156
19.2 Royal Dutch Shell Group 158
19.3 Chevron 160
19.4 BP Global 162
19.5 Fuchs Global 164
19.6 Total Lubricants 166
19.7 PetroChina 168
19.8 Sinopec 170
19.9 IDEMITSU 172
20. About Us 174
10

(c) AZOTH Analytics
List of Figures
Figure No. Figure Title Page No.
Figure 1: Global Industrial Lubricant Market Size, By Value, 2012-2016 (USD Billion) 33
Figure 2: Global Industrial Lubricant Market Size, By Value, Forecast, 2017-2022(USD Billion) 34
Figure 3: Global Automotive Production 2012-2016 (Million Units) 35
Figure 4: Global Mining Production, 2010-2014 (MMT) 36
Figure 5: Global Industrial Lubricant Market Size, By Product, 2016 (%) 38
Figure 6: Global Industrial Lubricant Market Size, By Product, 2022 (%) 39
Figure 7: Global Industrial Lubricant Market: By Product, By Value, 2012-2022 (USD Billion) 40
Figure 8: Global Industrial Lubricant Market: By Type, By Value, 2012-2022 (USD Billion) 41
Figure 9: Global Industrial Lubricant Market: By Application, By Value, 2012-2022 (USD Billion) 42
Figure 10: Global Industrial Lubricant Market Size, By Region, 2016 (%) 44
Figure 11: Region-Wise Automotive Production 2016 (Million Units) 45
Figure 12: Global Industrial Lubricant Market Size, By Region, 2022 (%) 46
Figure 13: North America Industrial Lubricant Market, By Value, 2012-2016 (USD Billion) 48
Figure 14: North America Industrial Lubricant Market, By Value, Forecast, 2017-2022 (USD Billion) 49
Figure 15: North America Automotive Production ,2012-2016 (Million Units) 50
Figure 16: North America Mining Production,2010-2014 (MMT) 50
Figure 17: North America Industrial Lubricant Market: By Product, By Value, 2012-2022 (USD Billion) 52
Figure 18: North America Industrial Lubricant Market: By Type, By Value, 2012-2022 (USD Billion) 53
Figure 19: North America Industrial Lubricant Market: By Application, By Value, 2012-2022 (USD Billion) 54
11

(c) AZOTH Analytics
List of Figures
Figure No. Figure Title Page No.
Figure 20: U.S. Industrial Lubricant Market Size, By Value, 2012-2022 (USD Billion) 56
Figure 21: United States Automotive Production, 2012-2016 (Million Units) 57
Figure 22: United States Manufacturing Units, 2012-2016 (Value, 2010=100, base year) 57
Figure 23: United States Construction Units, 2012-2016 (Value, 2010=100, base year) 57
Figure 24: U.S. Industrial Lubricant Market: By Product, By Value, 2012-2022 (USD Billion) 58
Figure 25: U.S. Industrial Lubricant Market: By Type, By Value, 2012-2022 (USD Billion) 59
Figure 26: Canada Industrial Lubricant Market Size, By Value, 2012-2022 (USD Billion) 60
Figure 27: Canada Industrial Lubricant Market: By Product, By Value, 2012-2022 (USD Billion) 61
Figure 28: Canada Industrial Lubricant Market: By Type, By Value, 2012-2022 (USD Billion) 62
Figure 29: South America Industrial Lubricant Market, By Value, 2012-2016 (USD Billion) 65
Figure 30: South America Industrial Lubricant Market, By Value, Forecast, 2017-2022 (USD Billion) 66
Figure 31: South America Industrial Lubricant Market: By Product, By Value, 2012-2022 (USD Billion) 68
Figure 32: South America Industrial Lubricant Market: By Type, By Value, 2012-2022 (USD Billion) 69
Figure 33: South America Industrial Lubricant Market: By Application, By Value, 2012-2022 (USD Billion) 70
Figure 34: Brazil Industrial Lubricant Market Size, By Value, 2012-2022 (USD Billion) 72
Figure 35: Brazil Industrial Lubricant Market: By Product, By Value, 2012-2022 (USD Billion) 73
Figure 36: Brazil Industrial Lubricant Market: By Type, By Value, 2012-2022 (USD Billion) 74
Figure 37: Europe Industrial Lubricant Market, By Value, 2012-2016 (USD Billion) 76
Figure 38: Europe Industrial Lubricant Market, By Value, Forecast, 2017-2022 (USD Billion) 77
Figure 39: Europe Industrial Lubricant Market: By Product, By Value, 2012-2022 (USD Billion) 79
12

(c) AZOTH Analytics
List of Figures
Figure No.
Figure Title Page No.
Figure 40: Europe Industrial Lubricant Market: By Type, By Value, 2012-2022 (USD Billion) 80
Figure 41: Europe Industrial Lubricant Market: By Application, By Value, 2012-2022 (USD Billion) 81
Figure 42: Germany Industrial Lubricant Market Size, By Value, 2012-2022 (USD Billion) 83
Figure 43: Germany Industrial Lubricant Market: By Product, By Value, 2012-2022 (USD Billion) 84
Figure 44: Germany Industrial Lubricant Market: By Type, By Value, 2012-2022 (USD Billion) 85
Figure 45: U.K. Industrial Lubricant Market Size, By Value, 2012-2022 (USD Billion) 87
Figure 46: U.K. Industrial Lubricant Market: By Product, By Value, 2012-2022 (USD Billion) 88
Figure 47: U.K. Industrial Lubricant Market: By Type, By Value, 2012-2022 (USD Billion) 89
Figure 48: France Industrial Lubricant Market Size, By Value, 2012-2022 (USD Billion) 91
Figure 49: France Industrial Lubricant Market: By Product, By Value, 2012-2022 (USD Billion) 92
Figure 50: France Industrial Lubricant Market: By Type, By Value, 2012-2022 (USD Billion) 93
Figure 51: APAC Industrial Lubricant Market, By Value, 2012-2016 (USD Billion) 95
Figure 52: APAC Industrial Lubricant Market, By Value, Forecast, 2017-2022 (USD Billion) 96
Figure 53: APAC Automotive Production, 2012-2016 (Million Units) 97
Figure 54: APAC Mining Production, 2012-2016 (Million Units) 97
Figure 55: APAC Industrial Lubricant Market: By Product, By Value, 2012-2022 (USD Billion) 99
Figure 56: APAC Industrial Lubricant Market: By Type, By Value, 2012-2022 (USD Billion) 100
Figure 57: APAC Industrial Lubricant Market: By Application, By Value, 2012-2022 (USD Billion) 101
Figure 58: China Industrial Lubricant Market Size, By Value, 2012-2022 (USD Billion) 103
Figure 59: China Automotive Production, 2012-2016 (Million Units) 104
Figure 60: China Industrial Lubricant Market: By Product, By Value, 2012-2022 (USD Billion) 105
13

(c) AZOTH Analytics
List of Figures
Figure No. Figure Title Page No.
Figure 61: China Industrial Lubricant Market: By Type, By Value, 2012-2022 (USD Billion) 106
Figure 62: India Industrial Lubricant Market Size, By Value, 2012-2022 (USD Billion) 108
Figure 63: India Industrial Lubricant Market: By Product, By Value, 2012-2022 (USD Billion) 109
Figure 64: India Industrial Lubricant Market: By Type, By Value, 2012-2022 (USD Billion) 110
Figure 65: Japan Industrial Lubricant Market Size, By Value, 2012-2022 (USD Billion) 112
Figure 66: Japan Industrial Lubricant Market: By Product, By Value, 2012-2022 (USD Billion) 113
Figure 67: Japan Industrial Lubricant Market: By Type, By Value, 2012-2022 (USD Billion) 114
Figure 68: Middle East and Africa Industrial Lubricant Market, By Value, 2012-2016 (USD Billion) 116
Figure 69: Middle East and Africa Industrial Lubricant Market, By Value, Forecast, 2017-2022 (USD Billion) 117
Figure 70: Production growth rate of Middle East & Africa major countries, 2015 118
Figure 71: Africa Automotive Production, 2012-2016 (Million Units) 118
Figure 72: Middle East and Africa Industrial Lubricant Market: By Product, By Value, 2012-2022 (USD Billion) 120
Figure 73: Middle East and Africa Industrial Lubricant Market: By Type, By Value, 2012-2022 (USD Billion) 121
Figure 74: Middle East and Africa Industrial Lubricant Market: By Application, By Value, 2012-2022 (USD Billion) 122
Figure 75: Egypt Industrial Lubricant Market Size, By Value, 2012-2022 (USD Billion) 124
Figure 76: Egypt Industrial Lubricant Market: By Product, By Value, 2012-2022 (USD Billion) 125
Figure 77: Egypt Industrial Lubricant Market: By Type, By Value, 2012-2022 (USD Billion) 127
Figure 78: Saudi Arabia Industrial Lubricant Market Size, By Value, 2012-2022 (USD Billion) 129
Figure 79: Saudi Arabia Industrial Lubricant Market: By Product, By Value, 2012-2022 (USD Billion) 130
Figure 80: Saudi Arabia Industrial Lubricant Market: By Type, By Value, 2012-2022 (USD Billion) 131
14

(c) AZOTH Analytics
List of Figures
Figure No. Figure Title Page No.
Figure 81: Crude Oil prices Actual and projected, Quarterly ,2015-2018 ($) 136
Figure 82: Global Lubricant Base Oil Market Size, By Company Share, 2016 (%) 146
Figure 83: ExxonMobil Lubricant Sales, 2012-2016 (USD Billion) 157
Figure 84: ExxonMobil Sales, By Operations, 2016 (%) 157
Figure 85: ExxonMobil petroleum production, By Region, 2016 (%) 157
Figure 86: Royal Dutch Shell Group Lubricant Sales, 2012-2016 (USD Billion) 159
Figure 87: Royal Dutch Shell Group Sales, By product, 2016 (%) 159
Figure 88: Royal Dutch Shell Group Sales, By Region, 2016 (%) 159
Figure 89: Chevron Downstream Sales, 2012-2016 (USD Billion) 161
Figure 90: Chevron Sales, By Product, 2016 (%) 161
Figure 91: Chevron Sales, By Region, 2016 (%) 161
Figure 92: BP Global Lubricant Sales, 2012-2016 (USD Billion) 163
Figure 93: BP Global Sales, By Product , 2016 (%) 163
Figure 94: BP Global Sales, Downstream, By Region, 2016 (%) 163
Figure 95: FUCHUS Global Lubricant Sales, 2012-2016 (USD Billion) 165
Figure 96: Fuchs Global Sales, By Industries, 2015 (%) 165
Figure 97: Fuchs Global Sales, By Region, 2016 (%) 165
Figure 98: Total Lubricants Sales, 2012-2016 (USD Billion) 167
Figure 99: Total Lubricants Sales, By Operation, 2016 (%) 167
Figure 100: Total Lubricants Sales, By Region, 2016 (%) 167
15

(c) AZOTH Analytics
List of Figures
Figure No. Figure Title Page No.
Figure 101: PetroChina Lubricant Sales, 2012-2016 (USD Billion) 169
Figure 102: PetroChina Sales, By Product , 2016 (%) 169
Figure 103: PetroChina Sales, By Region, 2015 (%) 169
Figure 104: Sinopec Lubricant Sales, 2012-2016 (USD Billion) 171
Figure 105: Sinopec Sales, By Operation, 2016 (%) 171
Figure 106: Sinopec Sales, By Region, 2016 (%) 171
Figure 107: IDEMITSU Lubricants Sales, 2012-2016 (USD Billion) 173
Figure 108: IDEMITSU Sales, By Product, 2016 (%) 173
Figure 109: IDEMITSU Sales, By Region, 2016 (%) 173
16

(c) AZOTH Analytics
List of Tables
Table No. Table Title Page No.
Table A: American Petroleum Institute (API) base oil Classification 26
Table B: Synthetic Types with their Temperature Range 139
Table C: Product Benchmarking of Key Industry Players in Industrial Lubricants, By Applications 147
Table D: Product Benchmarking of Key Industry Players in Industrial Lubricants, By Type 148
17

(c) AZOTH Analytics
Research Methodology
Research Definition
• Global Industrial Lubricant Market Report covers the study of growing lubricant market and its forecast till 2022. Global
industrial lubricant Market has been segmented in three different segments. One segment is the product base oil of
lubricants used, i.e. Mineral Oil, Synthetic Oil, Bio-based Oil ; the second segment is in terms of its Type, on the basis of
properties, i.e. Process Oil, General Lubricant Oil, Metal Working Fluid (MWF), Industrial Engine Oil and Others; third
segment is on the basis of its application, i.e. Automotive, Manufacturing, Power, Mining, Marine and Others . The
Regional as well as Countries overview of all the markets are provided.
Data Analysis and Interpretation
• Our historic market trend has been figured out by various paid databases which was further triangulated with inputs and
insights from industry experts through primary research. Back-of-the-Envelope calculation for the market estimation has
been made through proper understanding of the market as well as future business strategies of the companies involved in
the market.
Azoth Analytics has conducted quantitative as well as qualitative research to gather market insights such as market sizing, market
segmentation, recent trends and developments and competitive landscape. Our team has conducted extensive primary surveys by
reaching out industry experts across the value chain of the Global Air Quality Monitoring and Water Quality Sensors Market .
For Forecasting purpose we have accessed some of the paid databases such as Bloomberg, Reuters, Factiva, Hoovers etc.
Companies Contacted: ExxonMobil
18
Source: Azoth Analytics Estimates
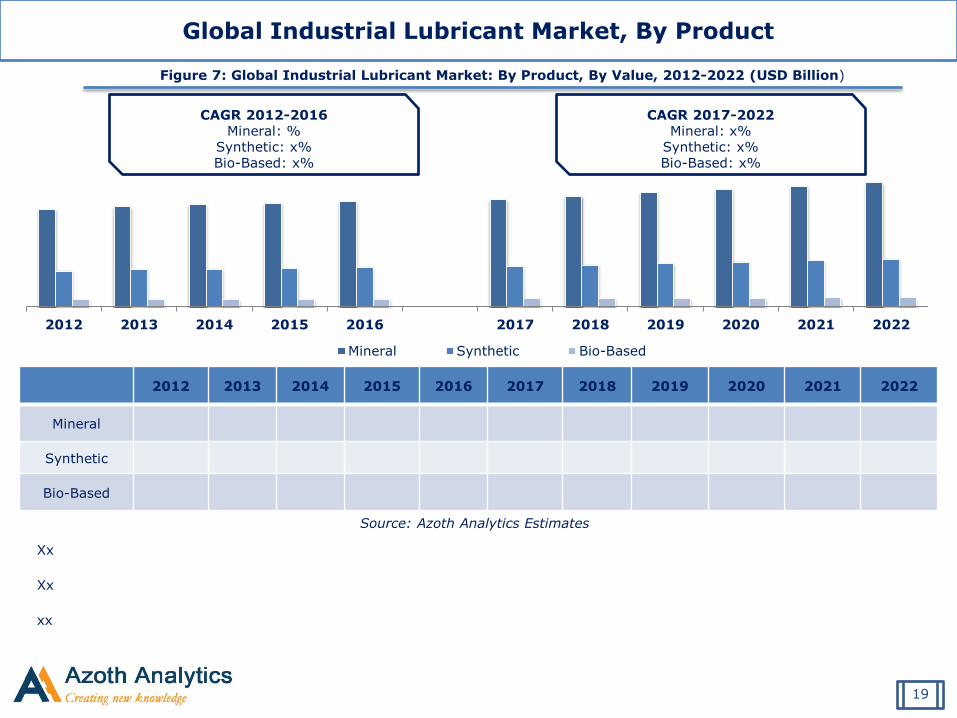
Figure 7: Global Industrial Lubricant Market: By Product, By Value, 2012-2022 (USD Billion)
CAGR 2012-2016 Mineral: %
Synthetic: x% Bio-Based: x%
Global Industrial Lubricant Market, By Product
2012 2013 2014 2015 2016 2017 2018 2019 2020 2021 2022
Mineral Synthetic Bio-Based
CAGR 2017-2022 Mineral: x%
Synthetic: x% Bio-Based: x%
2012 2013 2014 2015 2016 2017 2018 2019 2020 2021 2022
Mineral
Synthetic
Bio-Based
Xx
Xx
xx
19

Source: Azoth Analytics Estimates
Figure 8: Global Industrial Lubricant Market: By Type, By Value, 2012-2022 (USD Billion)
CAGR 2012-2016 Process oil: x %
General Industrial Oil: x% Metal Working Fluid: x % Industrial Engine Oil: x %
Global Industrial Lubricant Market, By Type
2012 2013 2014 2015 2016 2017 2018 2019 2020 2021 2022
Process Oil
General Industrial Oil
Metal Working Fluid
Industrial Engine Oil
Others
2012 2013 2014 2015 2016 2017 2018 2019 2020 2021 2022
Process Oil General Industrial Oil Metal Working Fluid Industrial Engine Oil Others
CAGR 2017-2022 Process oil: x %
General Industrial Oil: x % Metal Working Fluid: x % Industrial Engine Oil: x %
20

Source: Azoth Analytics Estimates
Figure 9: Global Industrial Lubricant Market: By Application, By Value, 2012-2022 (USD Billion)
CAGR 2012-2016 Automotive =x%
Manufacturing =x%
Power =x%
Mining =x%
Marine =x%
Global Industrial Lubricant Market, By Application
2012 2013 2014 2015 2016 2017 2018 2019 2020 2021 2022
Automotive
Manufacturing
Power
Mining
Marine
Others
2012 2013 2014 2015 2016 2017 2018 2019 2020 2021 2022
Automotive Manufacturing Power Mining Marine Others
CAGR 2017-2022 Automotive =x%
Manufacturing =x%
Power =x%
Mining =x%
Marine =x%
21

Source: Azoth Analytics Estimates
Figure 43: Germany Industrial Lubricant Market: By Product, By Value, 2012-2022 (USD Billion)
CAGR 2012-2016 Mineral: x%
Synthetic: x% Bio-Based: x%
Germany Industrial Lubricant Market, By Product
2012 2013 2014 2015 2016 2017 2018 2019 2020 2021 2022
Mineral Synthetic Bio-Based
CAGR 2017-2022 Mineral: x%
Synthetic: x% Bio-Based: x%
2012 2013 2014 2015 2016 2017 2018 2019 2020 2021 2022
Mineral
Synthetic
Bio-Based
22

Source: Azoth Analytics Estimates
Figure 44: Germany Industrial Lubricant Market: By Type, By Value, 2012-2022 (USD Billion)
Germany Industrial Lubricant Market, By Type
2012 2013 2014 2015 2016 2017 2018 2019 2020 2021 2022
Process Oil
General Industrial Oil
Metal Working Fluid
Industrial Engine Oil
Others
2012 2013 2014 2015 2016 2017 2018 2019 2020 2021 2022
Process Oil General Industrial Oil Metal Working Fluid Industrial Engine Oil Others
Process oil includes a large range of hydraulic and other machinery lubricants used in various sectors has the largest market in industrial
lubricants and will continue to grow in the future. With the growth in metal industries, Metal working fluid will be showing the highest
growth rate of 3.11% due to its property to remove heat and working in extreme operating conditions.
CAGR 2012-2016 Process oil: x%
General Industrial Oil: x% Metal Working Fluid: x% Industrial Engine Oil: x%
CAGR 2017-2022 Process oil: x%
General Industrial Oil: x% Metal Working Fluid: x% Industrial Engine Oil: x%
23

Source: Azoth Analytics Estimates
Figure 79: Saudi Arabia Industrial Lubricant Market: By Product, By Value, 2012-2022 (USD Billion)
CAGR 2012-2016 Mineral: 1.82%
Synthetic: 2.48% Bio-Based: 2.09%
Saudi Arabia Industrial Lubricant Market, By Product
Large reserves of Oil & Gas with the bulk production of petroleum products in Saudi Arabia has led to the highest share of mineral base
oil. Synthetic and bio-based market is expected to grow with the rising technology in lubricants and its need in many industries having
the major concern with environmental safety with a predicted CAGR of 3.51% and 3.38% respectively.
2012 2013 2014 2015 2016 2017 2018 2019 2020 2021 2022
Mineral Synthetic Bio-Based
CAGR 2017-2022 Mineral: 3.25%
Synthetic: 3.51% Bio-Based: 3.38%
2012 2013 2014 2015 2016 2017 2018 2019 2020 2021 2022
Mineral 2.29 2.37 2.40 2.43 2.46 2.52 2.61 2.70 2.78 2.87 2.96
Synthetic 0.85 0.88 0.90 0.91 0.94 0.96 0.99 1.03 1.07 1.10 1.14
Bio-Based 0.100 0.104 0.106 0.107 0.109 0.111 0.115 0.119 0.123 0.128 0.132
24

(c) AZOTH Analytics
About Azoth Analytics Pvt Ltd.
Azoth Analytics is a business research and analytics firm that creates in-depth research reports and provides customized research solutions and consultancy services. Verticals in which Azoth Analytics specializes include healthcare and pharmaceutical, oil and gas, retail, chemicals, automotive, FMCG, food & beverages and technology. Azoth creates comprehensive and in-depth research reports by recording, interpreting and analyzing information. Strategic market sizing and data dredging techniques include secondary research, and primary research (interviews with management personnel and industry experts).
Related Reports:
Global Offshore Wind Energy Market – Analysis By Region, By Country: Opportunities and Forecast (2016-2021)- - By Region (North
America, Europe, APAC, ROW); By Country (US, Canada, Germany, U.K., Sweden, Netherland, Belgium, Denmark,, China, Japan, South
Korea, Brazil)
United States Oil and Gas Pipeline Leak Detection System (LDS) Market (By Equipment, By Application, By Region) - An Analysis (2017
Edition)- - By Equipment (Pressure sensors, Flow meters, Fibre optic sensors, Acoustic Sensors, Others); By Application (Onshore,
Offshore), By Region (Southeast, Northeast, Western, Midwest)
Disclaimer: Azoth Analytics report information is based mainly on interviews and therefore, is subject to fluctuation. Azoth Analytics therefore, takes no responsibility for
any incorrect information supplied to us by industry experts, manufacturers or users. Azoth does not warranty the completeness of the information and data. Also, analysis
provided in the report are meant for customers’ internal use only and not for general publication or disclosure to third parties.
25