Embed Size (px)
Citation preview

Working Paper
Dr. Attiya Javid
& Asia Aman
Global Financial Crisis and Market Reactions:
Evidence form the Karachi Stock Exchange,
Pakistan.

Background of the Study
• Stock Market Volatility and impact of a good or bad news.
• Anomalies in Stock prices.
• Irrational behavior of investors which is inconsistent with the Efficient Market
Hypothesis (Fama, 1970)
• The resulting Overreaction or Underreaction.
• Local stock market and the Global financial crisis of 2008.
INTRODUCTION
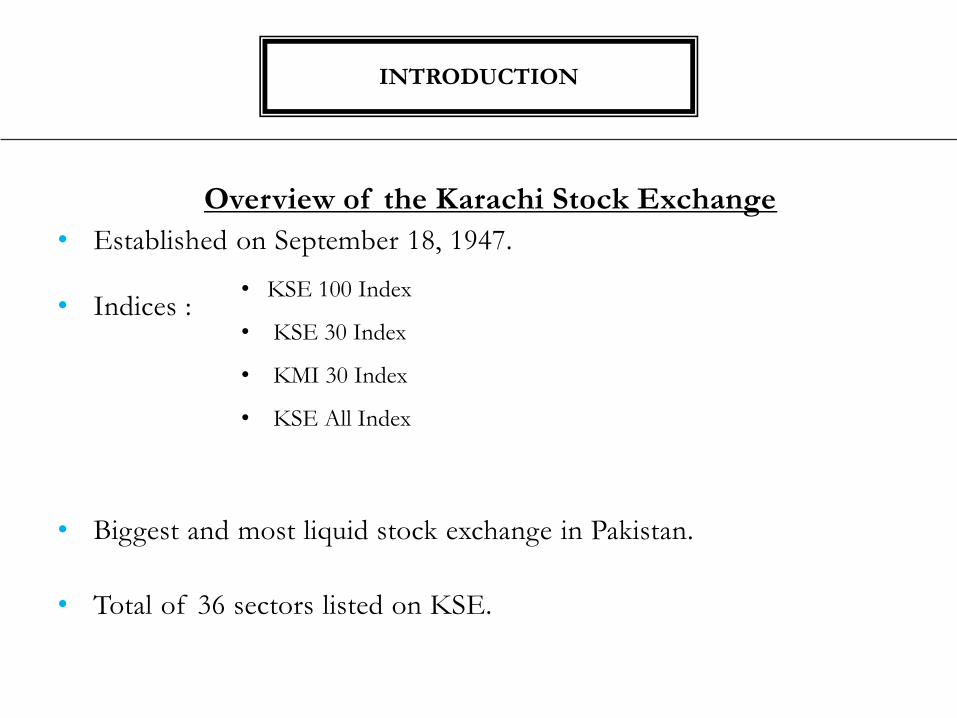
Overview of the Karachi Stock Exchange
• Established on September 18, 1947.
• Indices :
• Biggest and most liquid stock exchange in Pakistan.
• Total of 36 sectors listed on KSE.
INTRODUCTION
• KSE 100 Index
• KSE 30 Index
• KMI 30 Index
• KSE All Index
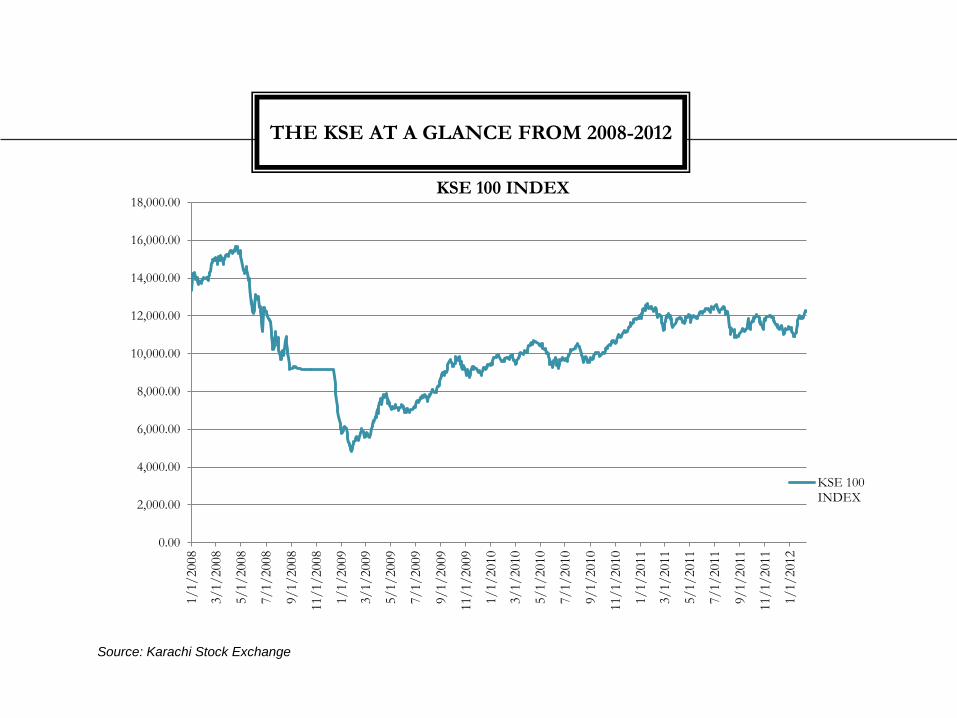
Source: Karachi Stock Exchange
THE KSE AT A GLANCE FROM 2008-2012
0.00
2,000.00
4,000.00
6,000.00
8,000.00
10,000.00
12,000.00
14,000.00
16,000.00
18,000.001/1/2008
3/1/2008
5/1/2008
7/1/2008
9/1/2008
11/1/2008
1/1/2009
3/1/2009
5/1/2009
7/1/2009
9/1/2009
11/1/2009
1/1/2010
3/1/2010
5/1/2010
7/1/2010
9/1/2010
11/1/2010
1/1/2011
3/1/2011
5/1/2011
7/1/2011
9/1/2011
11/1/2011
1/1/2012
KSE 100 INDEX
KSE 100INDEX
The Global Financial Crisis and the Emerging Economies
• the US sub-prime mortgage market crisis that surfaced August 2007.
• quickly spread around the world resulting in a huge financial meltdown.
• bankruptcies of banks and insurance firms in many countries.
• including the emerging market economies (EME)
.
PROBLEM IDENTIFICATION

• Did the investors exhibit under- reaction in the Karachi Stock Exchange
during the global financial crisis of 2008?
• Did the investors exhibit over-reaction in the Karachi Stock Exchange during
the global financial crisis of 2008?
• Did past losers significantly outperform past winners?
• Were there winner-loser reversals at the KSE 100 Index?
SIGNIFICANCE OF THE STUDY
•It is significant to understand the impact of the global financial crisis of 2008 on
the local economy which is considered among the emerging Asian economies.
•It will help to understand the overall reactionary behavior of the stock market ( both
under-reaction and over-reaction) in relevance to international financial crisis
news.
•It will help to assess the shock absorbing capability of the local market in terms
of investor reaction.
SIGNIFICANCE OF THE STUDY

The purpose of this study is also;
• to contribute to the short term stock market reaction related literature by using
daily return stock data and trading volume of Karachi Stock Exchange over the
period of September 2008 to 2009.
• to contributes to the existing literature in examining the under-reaction and over-
reaction hypothesis in an emerging market i.e. KSE, with respect to the global
financial crisis of 2008.
SCOPE OF THE STUDY

• To examine that the investors exhibited under and over-reaction in the Karachi
Stock Exchange during the global financial crisis of 2008.
• To examine whether past losers significantly outperformed past winners.
• To investigate whether there was winner-loser reversals at the KSE 100 Index
or not.
OBJECTIVE OF THE STUDY

• The Efficient Market Hypothesis (EMH):
Fama, E. (1970). Efficient capital markets: a review of theory and empirical work.
Journal of Finance, Vol. 25, pp. 383-417.
REVIEW OF RELATED
LITERATURE
1. Weak form Efficient
2. Semi-strong form Efficient
3. Strong form Efficient

• The Stock Market Anomalies:
Shiller, R. J. (1981). Do Stock Prices Move Too Much to be Justified by Subsequent
Changes in Dividends. American Economic Review, 71: 421435.
Lo, A. W. & C. MacKinlay (1988). Stock Market Prices Do Not Follow Random
Walks: Evidence from a Simple Specification Test. Review of Financial Studies, Vol.1,
41-66.
Lo, A., & MacKinlay, C. (1990). When are contrarian profits due to stock market
overreaction? Review of Financial Studies, 3(2), 175–206.
Shiller, R. (2003). From Efficient Markets Theory to Behavioral Finance, Journal of
Economic Perspectives, Vol.17, pp.83-104.
REVIEW OF RELATED
LITERATURE
Representativeness
Heuristic Overreaction
Underreaction Anchoring
Heuristic

• The Event Study Literature:
mergers and acquisitions (Jensen & Ruback, 1983)
earning announcement (Barklay & Litzenberger, 1988)
issue of new debt or equity (Myers & Mujluf, 1984)
announcements of macroeconomic variables such as trade deficit (McQueen &
Roley, 1993)
stock market crash ( Kemmna & Klock, 1992; Claessens, Djankov, Fan &
Lang,2000)
natural disaster and the insurance firms (Angbazo & Narayanan, 1996; Shelor,
Anderson & Cross, 1992; Javed, 2009).
Kothari & Warner (2005); Campbell, Lo & MacKinlay (1997) and MacKinlay
(1997).
REVIEW OF RELATED
LITERATURE

• The Stock Market Under-reaction:
Market underreaction to open market share repurchases (Ikenberry, David, Josef
Lakonishok & Vermaelen, 1995)
The equity issuing firms performed poorly as compared to non issuing firms (Kang,
Kim & Slutz, 1999)
Negative long-horizon abnormal returns following mergers (Agrawal, Jaffee &
Mandelker, 1992).
Investors focus on familiar or attention grabbing stocks (Barber & Odean, 2008)
Markets underreact to the slow release of news (Da, Gurun & Warachka, 2012)
Investors also underreact to the absence of news which itself can contain valuable
information (Gilio & Shue, 2012)
REVIEW OF RELATED
LITERATURE

• The Stock Market Over-reaction:
the earliest observation about overreaction in the capital markets (Keynes, 1964).
prices were based too little on long-term dividend paying power and too much on
current earning power (Williams, 1956).
excessive reaction to current information (Kahneman and Tversky, 1982).
extreme winners stocks subsequently underperformed the market while the extreme
losers stocks subsequently outperformed (DeBondt & Thaler ,1985).
results in favor of the overreaction hypothesis for the January effect that give
unusual returns in January (DeBondt & Thaler ,1987).
contrarian returns arise as a result of investor overreaction (Kang, Liu & Ni, 2002;
Wang, Burton & Power, 2004; Da, Liu & Schaumburg, 2010)
REVIEW OF RELATED
LITERATURE

financial and non-financial sectors have been considered to see the impact of the
same news (Kutan & Muradoglu, 2012; Ali, Ahmad & Anusakumar 2011)
the shortage of returns is compared between winner and loser portfolios
Hypothesis:
Ho: CARL = CARW
H1 : CARL < CARW (Under- reaction if magnitude 0)
where,
CARL = Cumulative Abnormal Return for Losers
CARW= Cumulative Abnormal Return for Winners
THE UNDER-REACTION
HYPOTHESIS

the excess returns are compared between winner and loser portfolios
Hypothesis:
Ho: CARL = CARW
H2: CARL > CARW (Over- reaction if magnitude > 0)
where, CARL = Cumulative Abnormal Return for Losers
CARW= Cumulative Abnormal Return for Winners
THE OVERREACTION
HYPOTHESIS

Data Collection
• Securities and Exchange
Commission of Pakistan
(SECP)
• Karachi Stock Exchange (KSE)
Sample
• KSE 100 Index
• Sept 2008 - Sept 2009
• Sectors:
Methodology
• Portfolio Formation
• Event Study Methodology
• Event Date: 15th September 2008
• Event window: + - 5 days
• Estimation window: 250 days prior to
the event for estimating CAPM. Pre
reaction is 11 days
• Post-Event window: 1, 2, 3, 4, 12, 24,
36, 52 weeks
DATA AND METHODOLOGY
• Financial
• Non Financial

a) Actual Return:
b) Expected Return:
CAPM Model
c) Abnormal Return:
d. Cumulative Abnormal Return (CAR):
e. Average Cumulative Abnormal Return (ACAR):
f. The Testing Framework: ACARloser – ACARwinner < 0
(Under-reaction ACARloser – ACARwinner > 0
(Over-reaction)
g. The Test of Significance:
DATA AND METHODOLOGY
E(Rit) = α i + β i Rmt
where, Rit = α i + β i Rmt + ɛit Rit = E(Rit) + ɛit

EMPIRICAL FINDINGS
ACAR (%) for Winner, Loser and Loser-Winner Portfolios for the Financial Sector
PORTFOLIO
FORMATION
PERIOD
HOLDING PERIOD (WEEKS)
1 2 3 4 12 24 36 52
Winner -0.14 -0.04 -0.04 -0.01 -0.01 0.06 0.07 0.04 -0.01
t-stat (-4.35) * (-1.31) (-1.15) (-0.37) (-0.30) (1.98) * (2.33) * (1.40) (-0.20)
Loser -0.13 0.01 0.01 0.01 0.005 -0.005 -0.01 -0.005 0.002
t-stat (-4.32) * (0.69) (0.84) (0.30) (0.27) (-0.27) (-0.42) (-0.26) (0.14)
Loser–
Winner -0.003 0.05 0.05 0.02 0.01 -0.06 -0.08 -0.05 0.01
t-stat (-0.09) (1.96) * (1.99) * (0.67) (0.57) (-2.15) * (-2.76) * (-1.66) (0.33)
* Statistical Significance at the 5% level

EMPIRICAL FINDINGS
-0.15
-0.10
-0.05
0.00
0.05
0.10
1 2 3 4 12 24 36 52
FORMATION PERIOD HOLDING PERIOD (WEEKS)
AC
AR
%
ACAR (%) for Winner, Loser and Loser-Winner Portfolios for the Financial Sector
Winner
Loser

EMPIRICAL FINDINGS
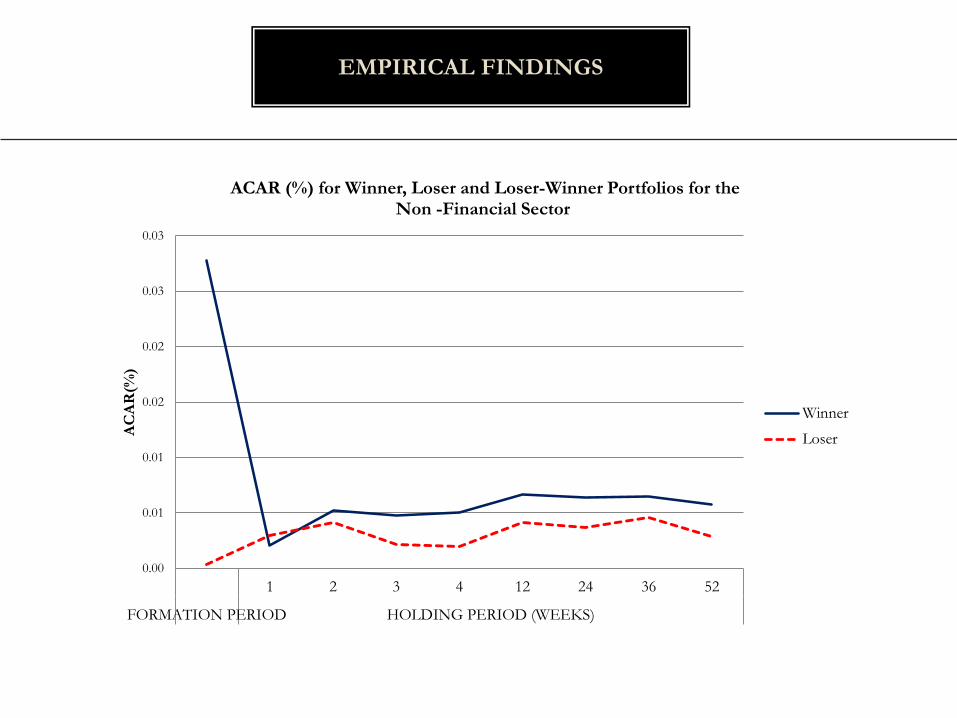
ACAR (%) for Winner, Loser and Loser-Winner Portfolios for the Non-Financial Sector
PORTFOLIO
FORMATION
PERIOD
HOLDING PERIOD (WEEKS)
1 2 3 4 12 24 36 52
Winner 0.03 0.0020 0.0052 0.0047 0.0050 0.0067 0.0064 0.0064 0.0057
t-stat (3.54) * (0.26) (0.67) (0.60) (0.64) (0.85) (0.82) (0.82) (0.73)
Loser 0.0003 0.003 0.004 0.002 0.002 0.004 0.004 0.005 0.003
t-stat (0.04) (1.09) (1.52) (0.79) (0.71) (1.51) (1.33) (1.68) (1.04)
Loser - Winner -0.03 0.001 -0.001 -0.003 -0.003 -0.003 -0.003 -0.002 -0.003
t-stat (-3.50) * (0.83) (0.85) (0.19) (0.08) (0.66) (0.51) (0.86) (0.31)
* Statistical Significance at the 5% level
EMPIRICAL FINDINGS
0.00
0.01
0.01
0.02
0.02
0.03
0.03
1 2 3 4 12 24 36 52
FORMATION PERIOD HOLDING PERIOD (WEEKS)
AC
AR
(%)
ACAR (%) for Winner, Loser and Loser-Winner Portfolios for the Non -Financial Sector
Winner
Loser

Financial Sector
•Significant over-reaction in the first four weeks followed by under-reaction
•Winner loser reversals is observed in the first four weeks.
•Loser stocks significantly outperformed the winner stock for the fist two weeks
•Acceptance of Alternate Hypothesis
Non-Financial Sector
•No signs of significant under- or over-reactions witnessed.
•No winner loser reversals are observed.
•Acceptance of Null Hypothesis
CONCLUSION

1. helpful to the local institutional as well as individual investors:
• in administering and devising a safer and securer investment strategy
especially in the time of global financial crises in the future.
• align their investment objectives with the global events to minimize the risk
of the investment
• minimizing the risk in the times of financial crises by focusing on the buy and
hold strategy.
2. advantageous for the Securities and Exchange Commission of Pakistan
(SECP) to reduce the volatility in the stock markets of Pakistan through
policy measures.
3. Results may be beneficial for the different sectors of Pakistan economy.
PRACTICAL IMPLICATIONS /
RECOMMENDATIONS

•Increase in sample size and time horizon.
•Long term under and overreaction and other biases.
•Coverage of local events and other international events like Asian Crisis.
FUTURE RESEARCH DIRECTIONS

QUERIES