Embed Size (px)
Citation preview
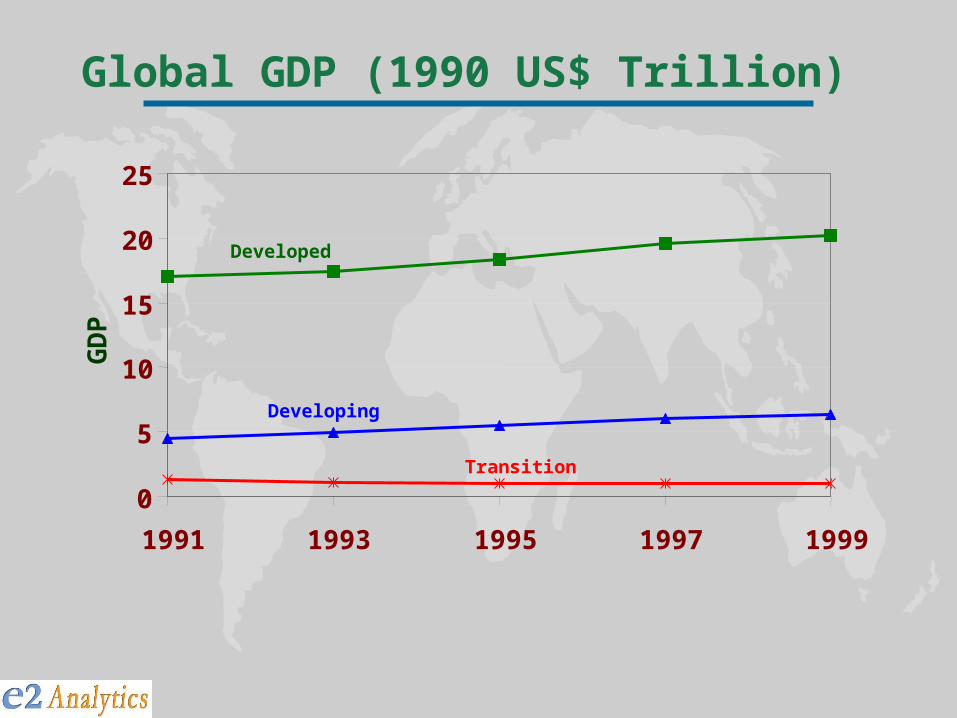
Global Economy, Energy and Environment: An Overview
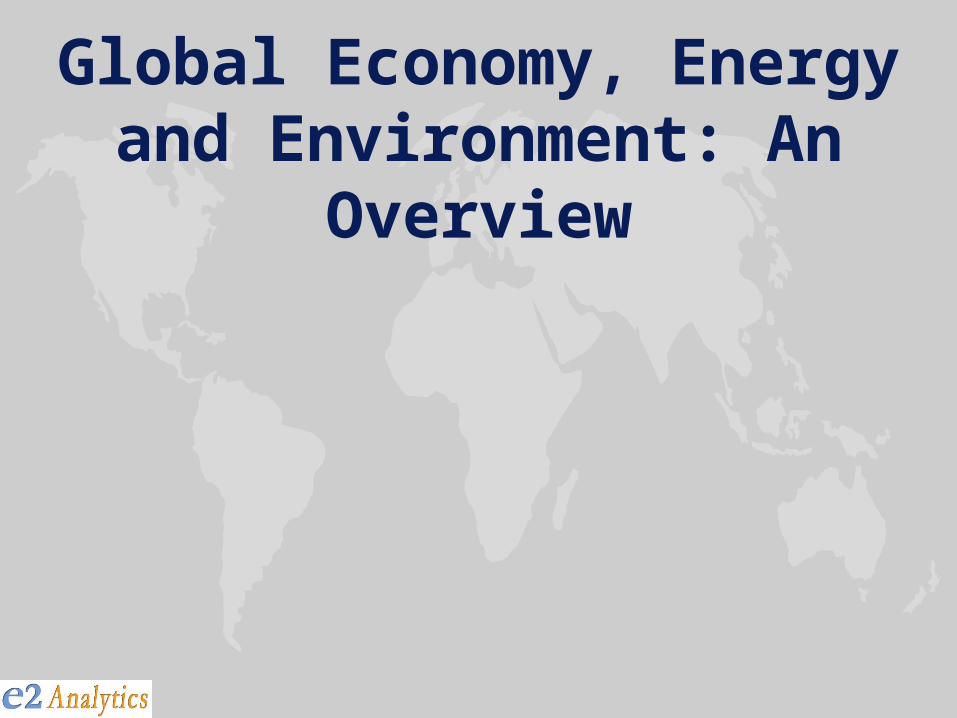
GDP (Trillion US$ 1990)
0
5
10
15
20
25
1991 1993 1995 1997 1999
GD
P
Developed
Developing
Transition
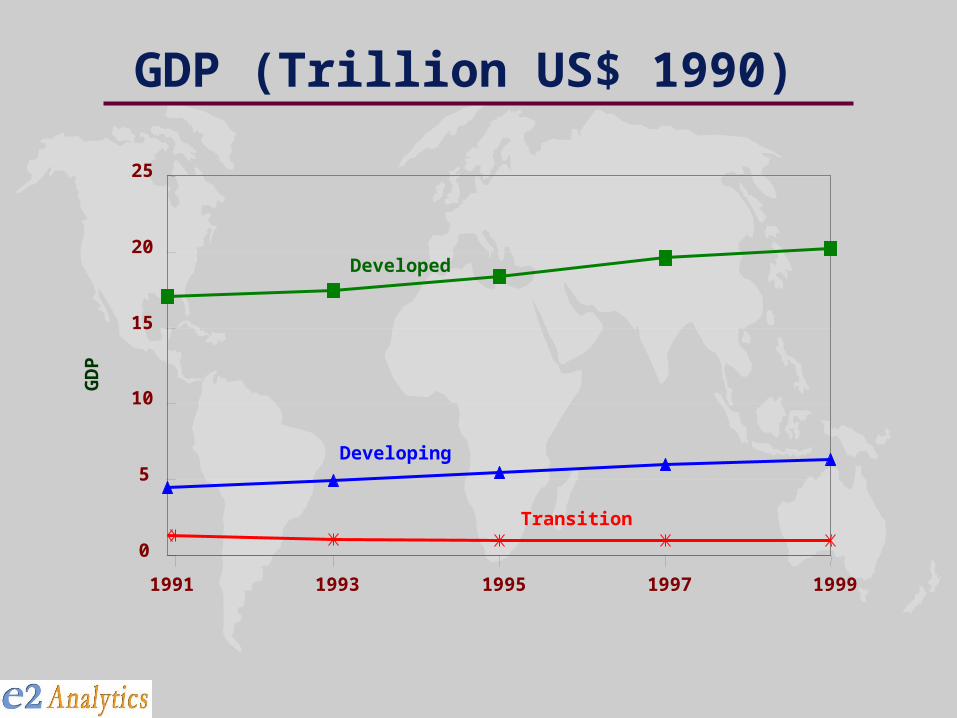
Global Population (Billion)
0
1
2
3
4
5
1991 1993 1995 1997 1999
Pop
ula
tion
Developed
Developing
Transition
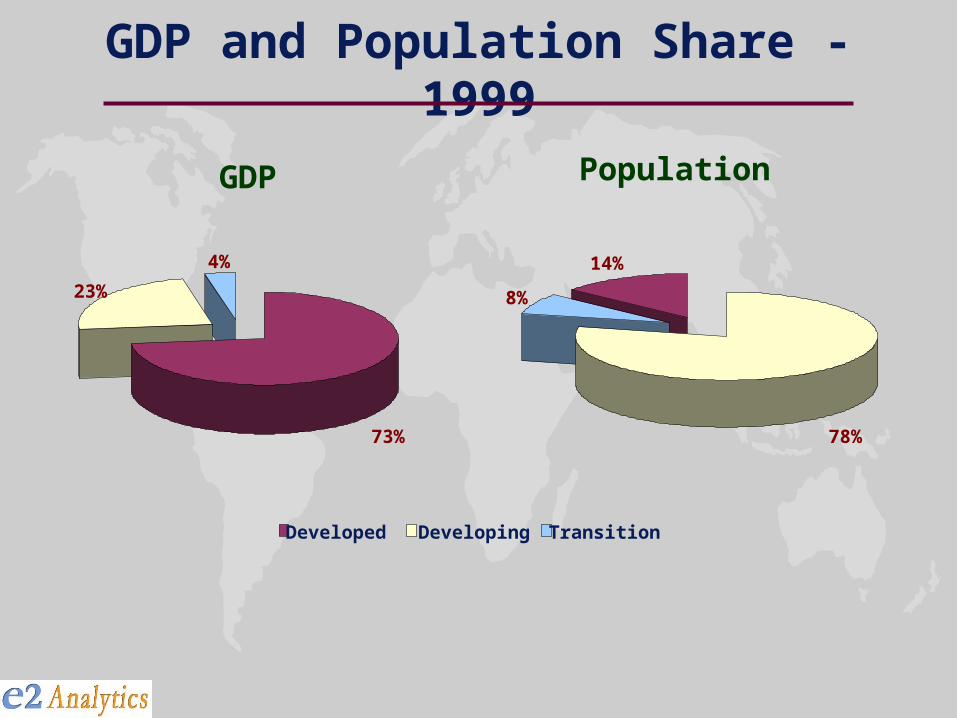
GDP and Population Share - 1999
PopulationGDP
73%
23%
4%
Developed Developing Transition
14%
78%
8%
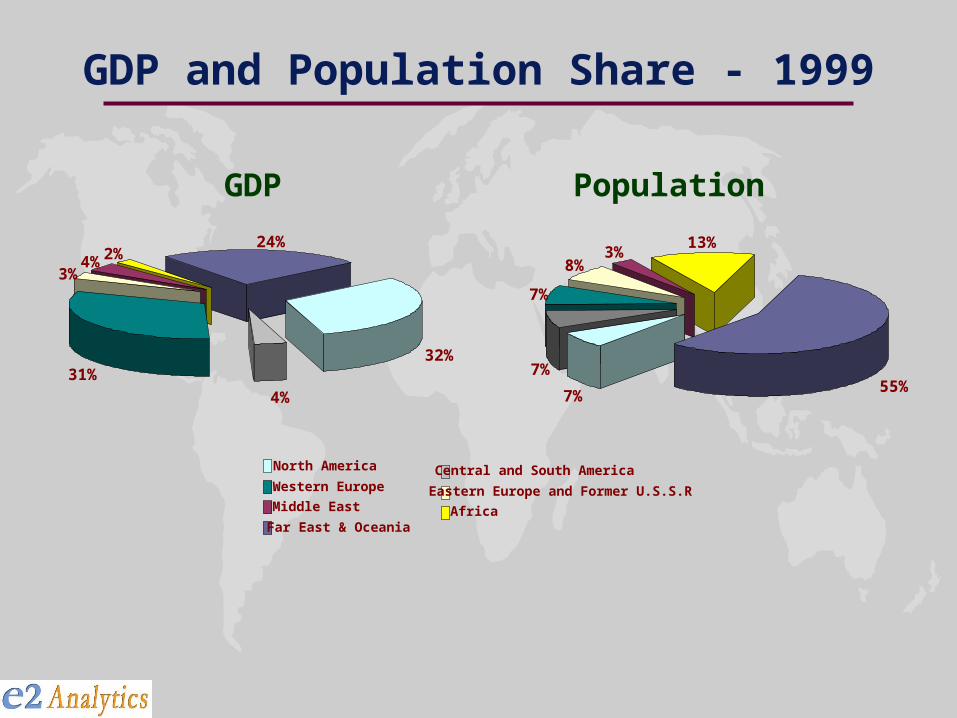
GDP and Population Share - 1999
32%
4%
31%
3%4%2%
24%
North America Central and South AmericaWestern Europe Eastern Europe and Former U.S.S.RMiddle East AfricaFar East & Oceania
7%
7%
7%
8%3%
13%
55%
PopulationGDP
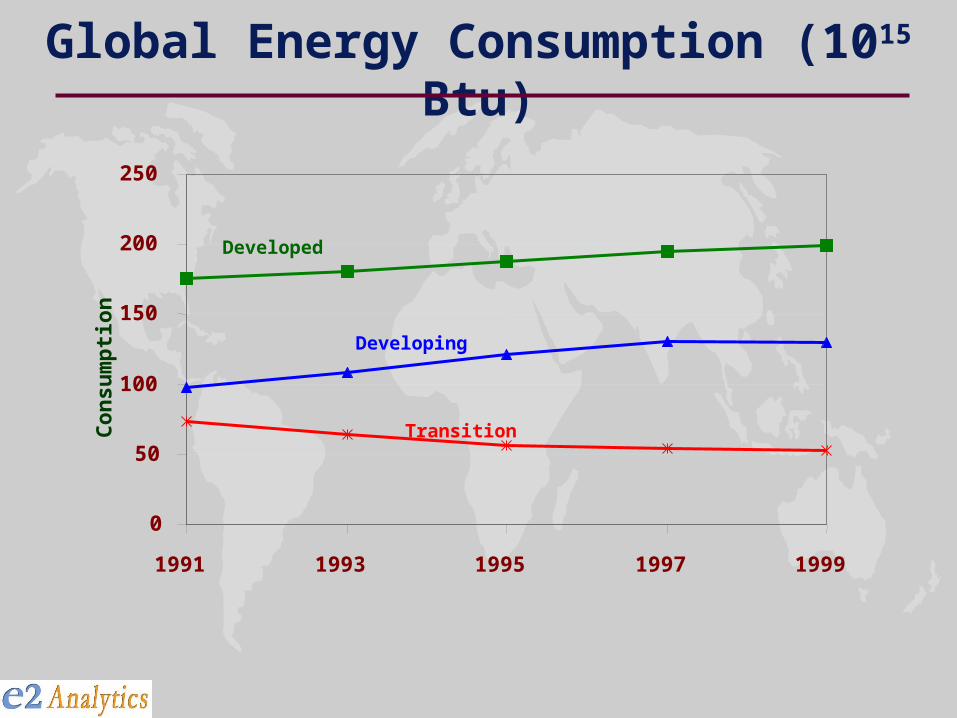
Global Energy Consumption (1015 Btu)
0
50
100
150
200
250
1991 1993 1995 1997 1999
Con
sum
pti
on
Developed
Developing
Transition
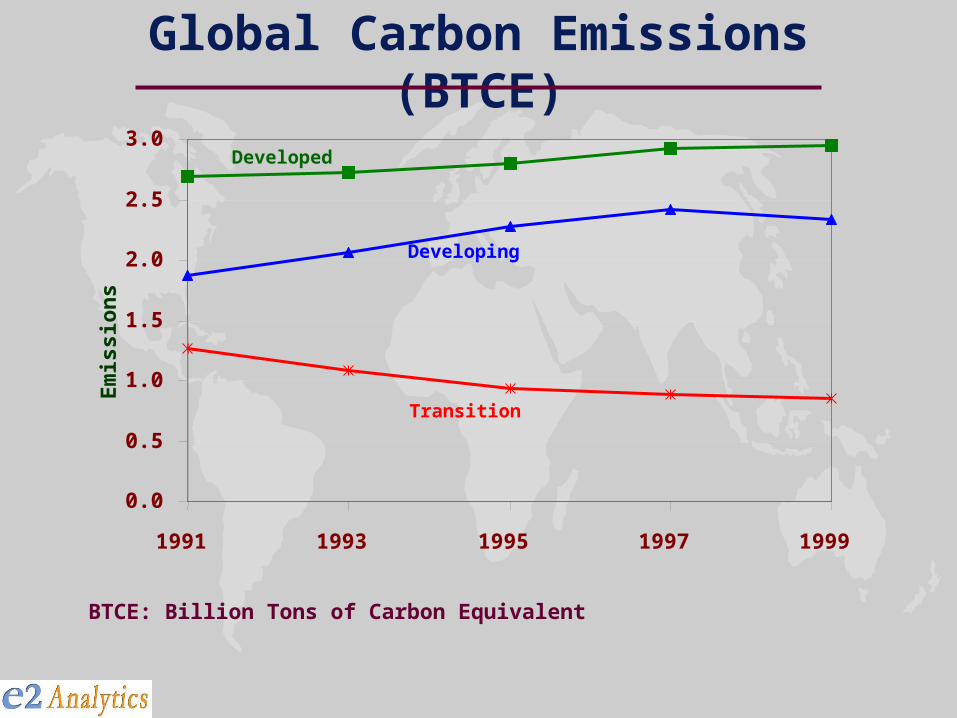
Global Carbon Emissions (BTCE)
0.0
0.5
1.0
1.5
2.0
2.5
3.0
1991 1993 1995 1997 1999
Em
issi
ons
Developed
Developing
Transition
BTCE: Billion Tons of Carbon Equivalent
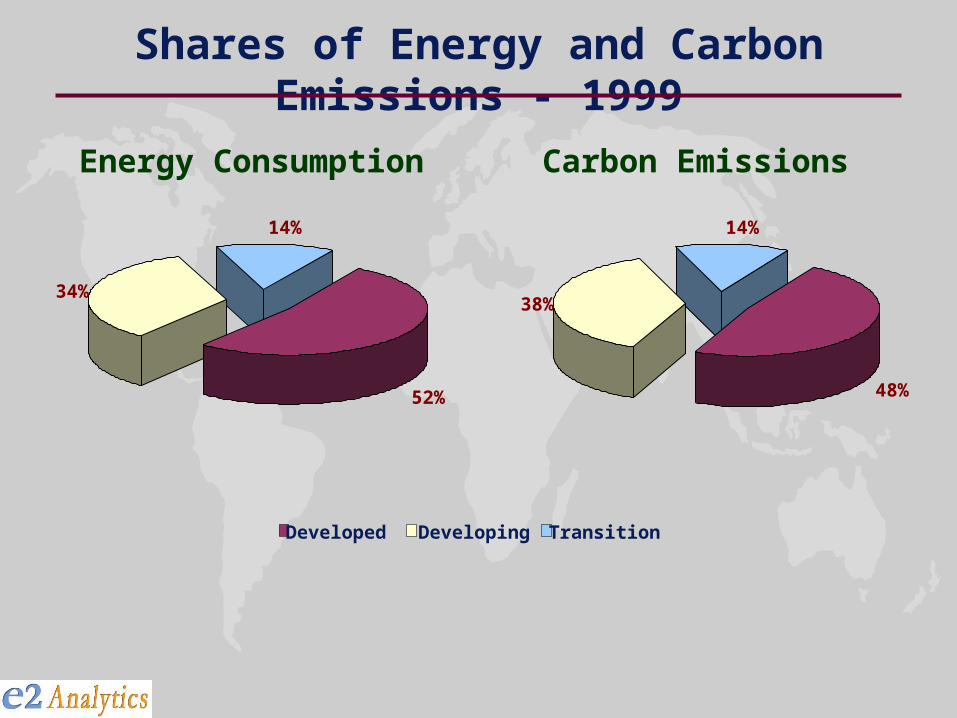
Shares of Energy and Carbon Emissions - 1999
Carbon EmissionsEnergy Consumption
52%
34%
14%
48%
38%
14%
Developed Developing Transition
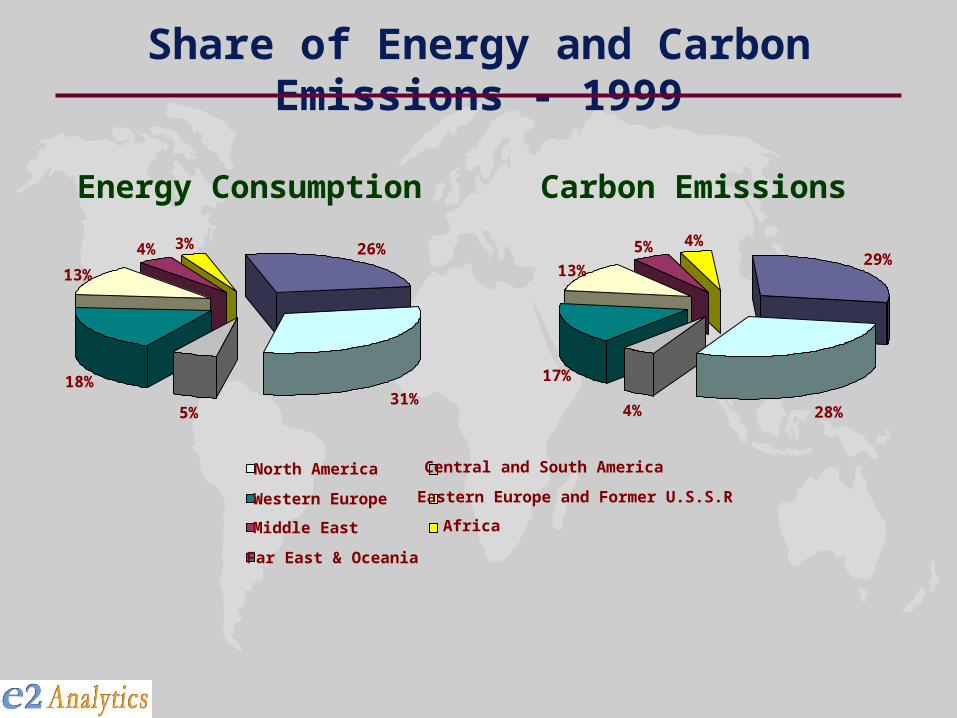
Share of Energy and Carbon Emissions - 1999
31%5%
18%
13%
4% 3% 26%
North America Central and South America
Western Europe Eastern Europe and Former U.S.S.R
Middle East Africa
Far East & Oceania
28%4%
17%
13%
5% 4%29%
Carbon EmissionsEnergy Consumption
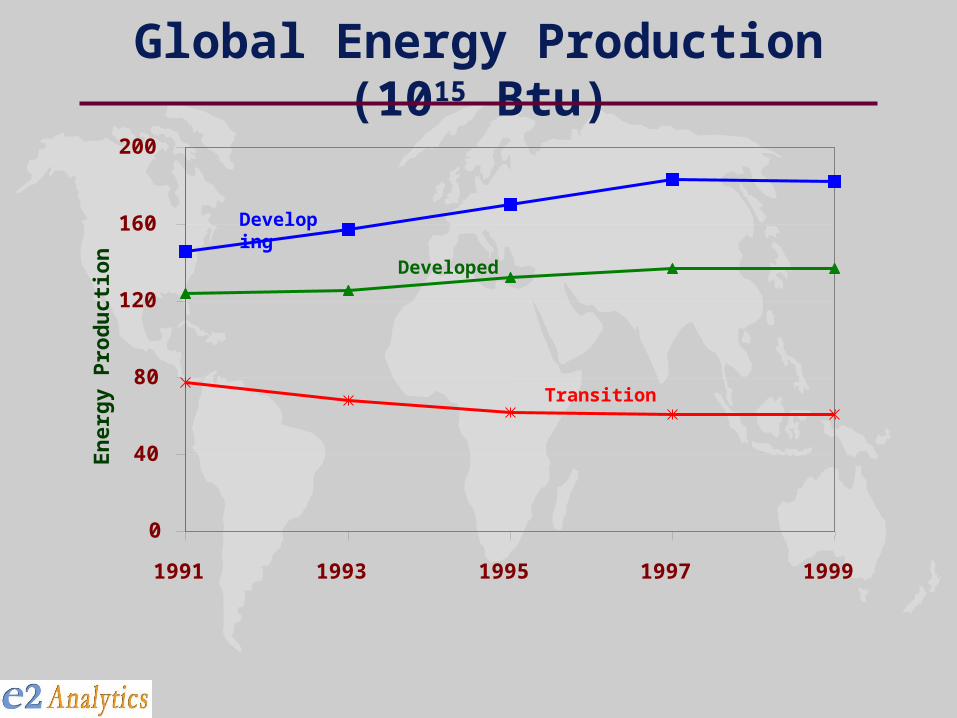
Global Energy Production (1015 Btu)
0
40
80
120
160
200
1991 1993 1995 1997 1999
En
ergy
Pro
du
ctio
n
Developed
Developing
Transition
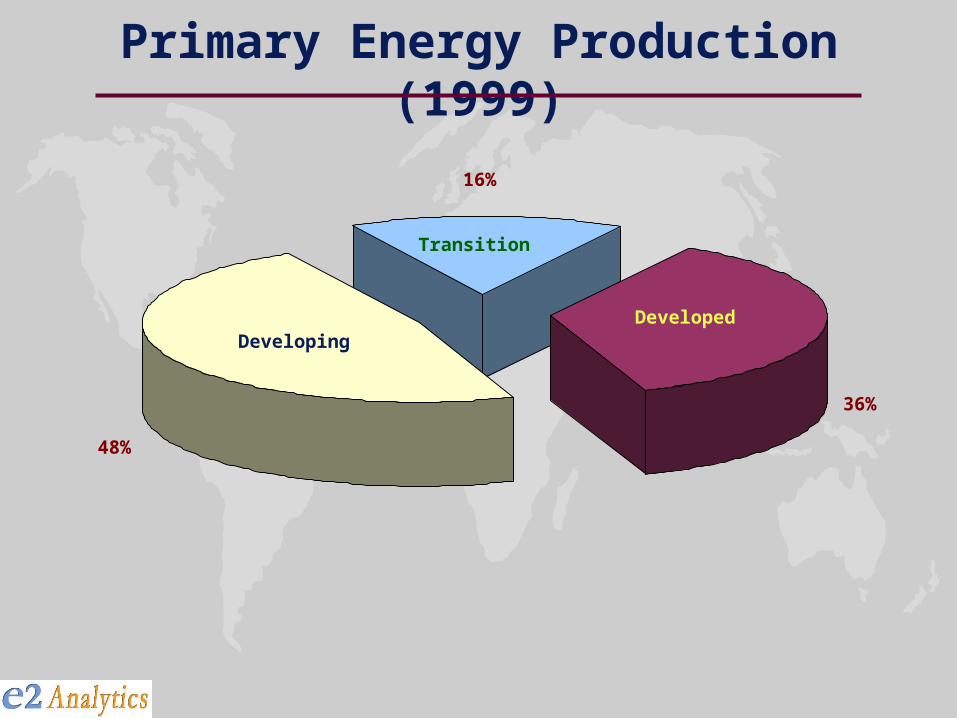
Primary Energy Production (1999)
36%
48%
16%
DevelopedDeveloping
Transition
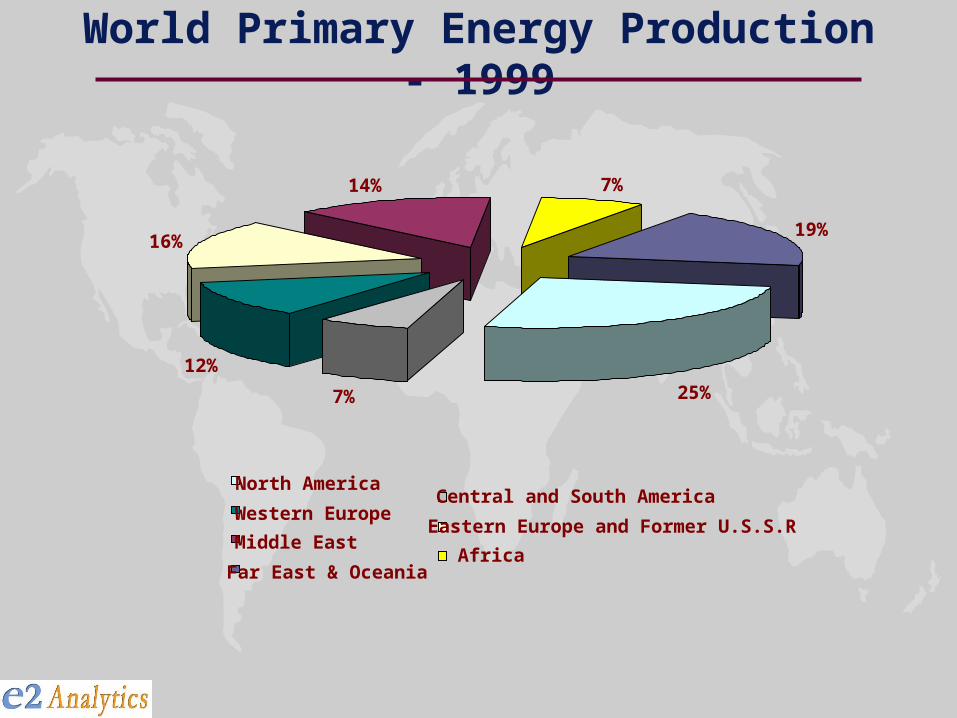
World Primary Energy Production - 1999
25%7%
12%
16%
14% 7%
19%
North AmericaCentral and South America
Western EuropeEastern Europe and Former U.S.S.R
Middle EastAfrica
Far East & Oceania
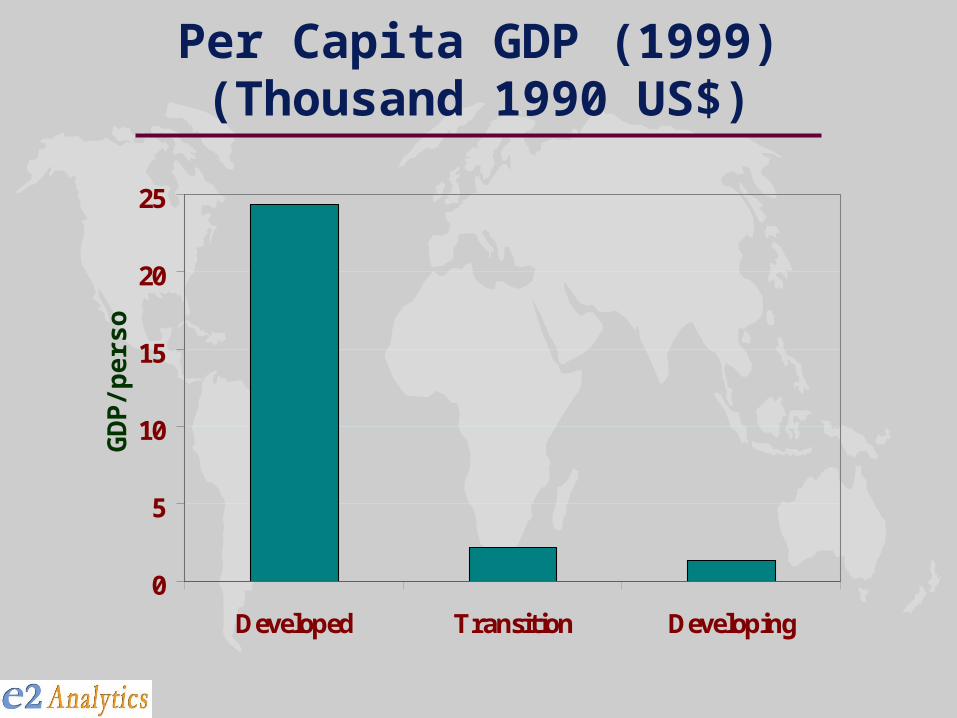
Per Capita GDP (1999)(Thousand 1990 US$)
0
5
10
15
20
25
Developed Transition Developing
GD
P/p
erso
n
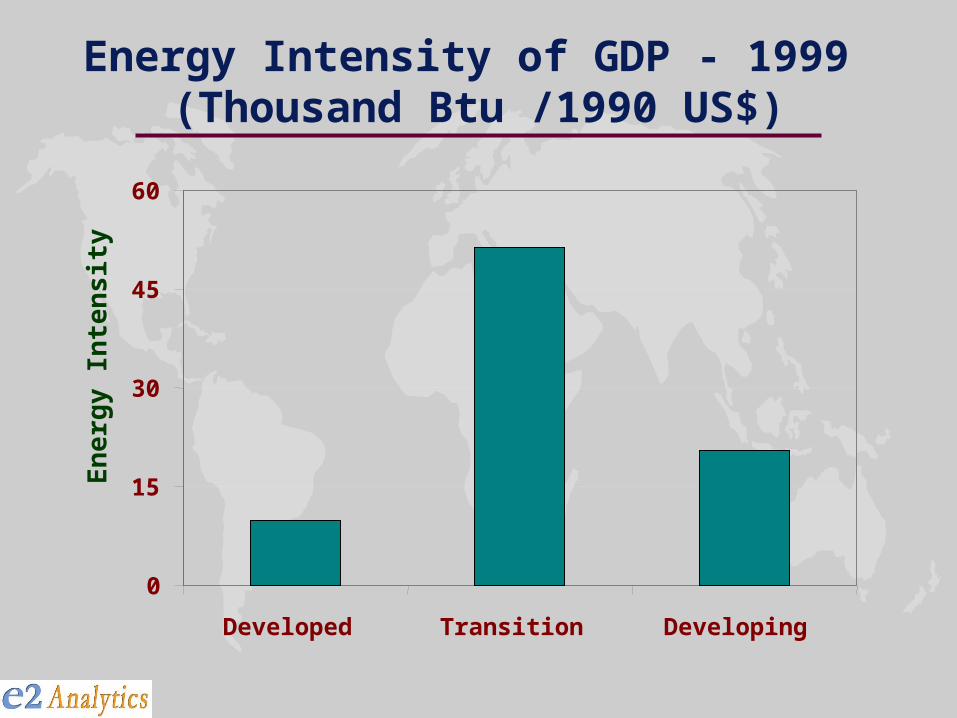
Energy Intensity of GDP - 1999 (Thousand Btu /1990 US$)
0
15
30
45
60
Developed Transition Developing
En
ergy
In
ten
sity
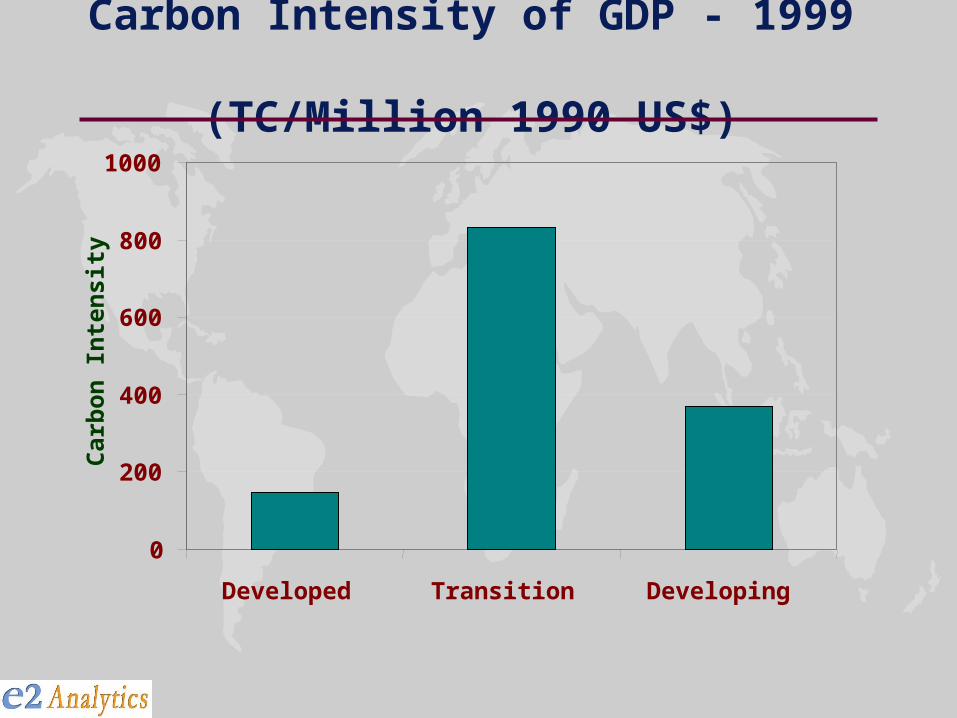
Carbon Intensity of GDP - 1999 (TC/Million 1990 US$)
0
200
400
600
800
1000
Developed Transition Developing
Car
bon
Int
ensi
ty
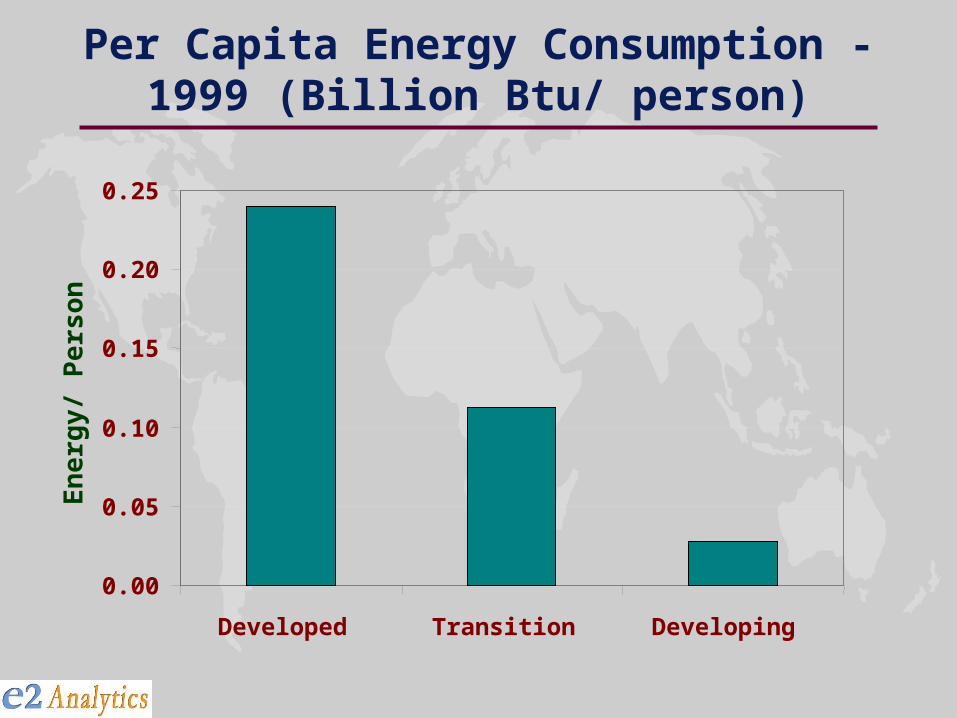
Per Capita Energy Consumption - 1999 (Billion Btu/ person)
0.00
0.05
0.10
0.15
0.20
0.25
Developed Transition Developing
En
ergy
/ Per
son
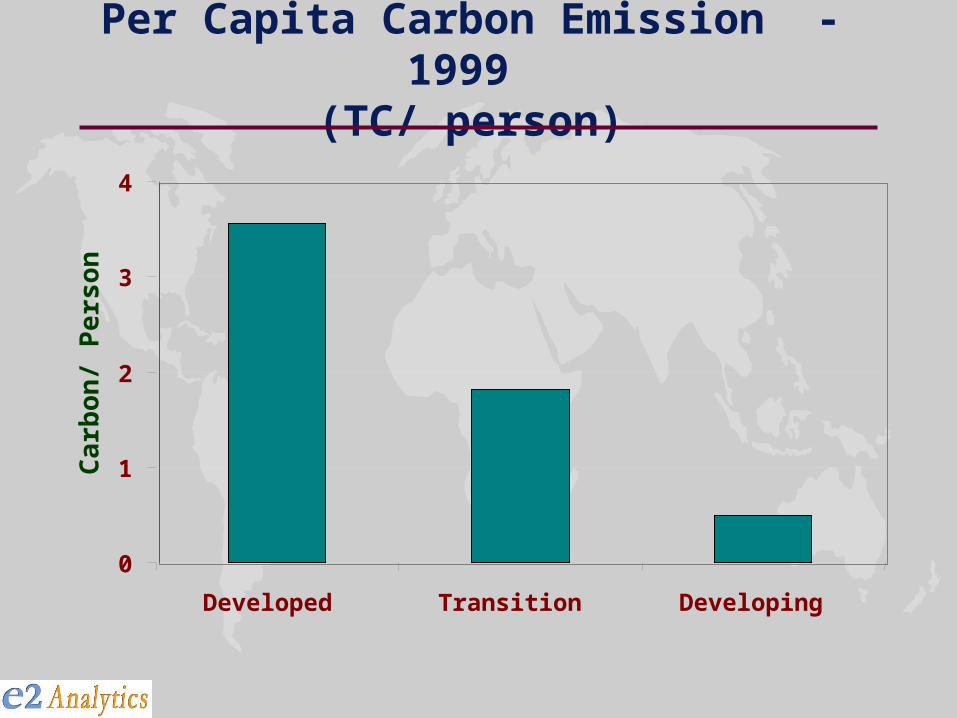
Per Capita Carbon Emission - 1999 (TC/ person)
0
1
2
3
4
Developed Transition Developing
Car
bon
/ Per
son

Structural Changes in Developing Economies
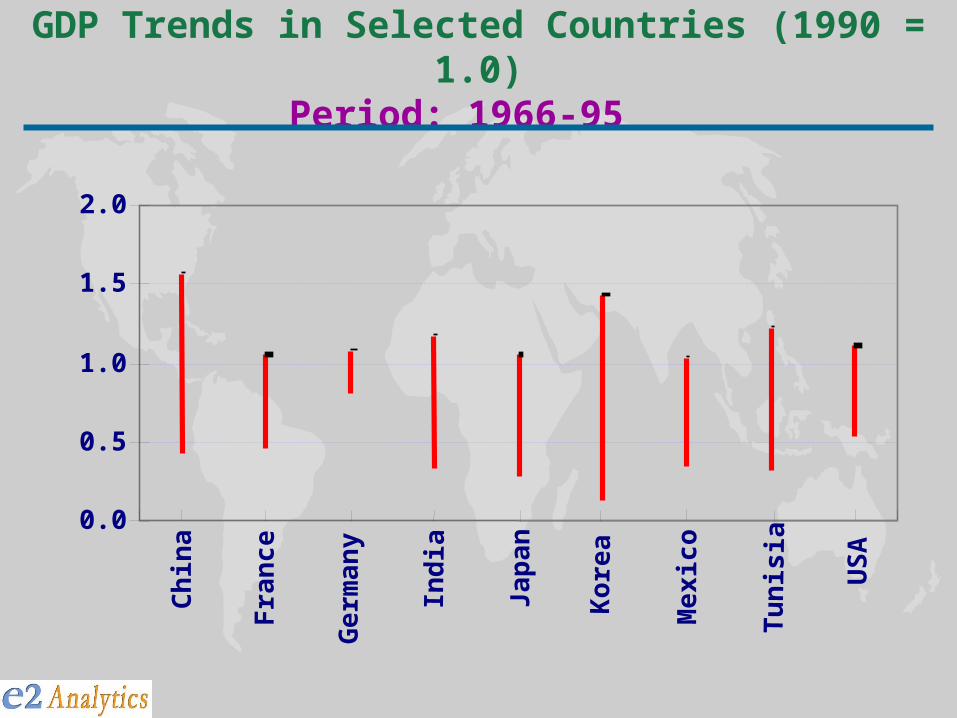
GDP Trends in Selected Countries (1990 = 1.0)Period: 1966-95
0.0
0.5
1.0
1.5
2.0C
hin
a
Ger
man
y
Jap
an
Mex
ico
US
A
Fra
nce
Ind
ia
Kor
ea
Tu
nis
ia
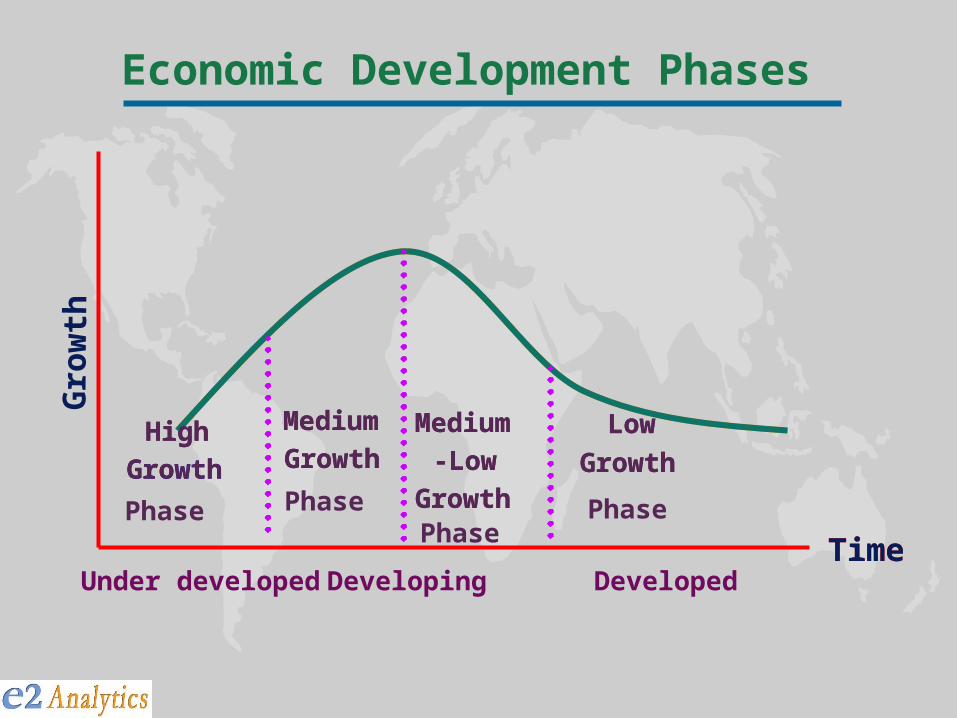
Economic Development Phases
Phase Phase
Time
High
Growth
Medium
GrowthMedium
-Low
Growth
Low
Growth
Phase
Under developed
Phase
DevelopingTime
Developed
High
Growth
Medium
GrowthMedium
-Low
Growth
Low
Growth
Gro
wth
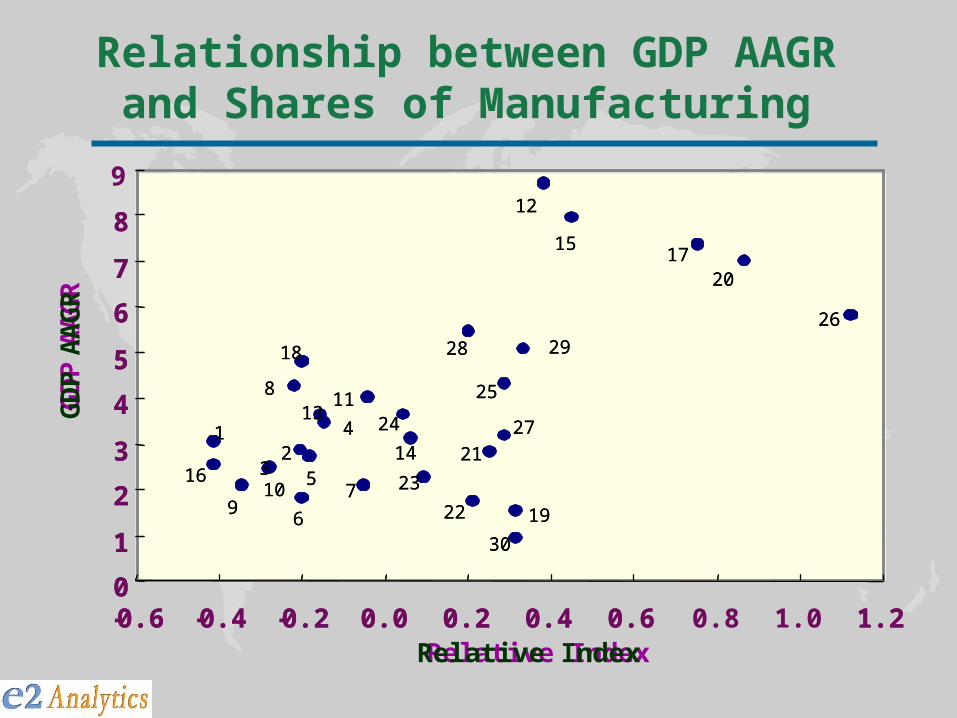
Relationship between GDP AAGR and Shares of Manufacturing
9
0
1
2
3
4
5
6
7
8
-0.6 -0.4 -0.2 0.0 0.2 0.4 0.6 0.8 1.0 1.2Relative Index
GD
P A
AG
R
12
1
96
7
811
26
2017
15
2928
25
27
21
19
30
22
23
14
24
105
2
18
413
16 3
0
1
2
3
4
5
6
7
8
-0.6 -0.4 -0.2 0.0 0.2 0.4 0.6 1.2Relative Index
GD
P A
AG
R
12
1
96
7
811
26
2017
15
2928
25
27
21
19
30
22
23
14
24
105
2
18
413
16 3
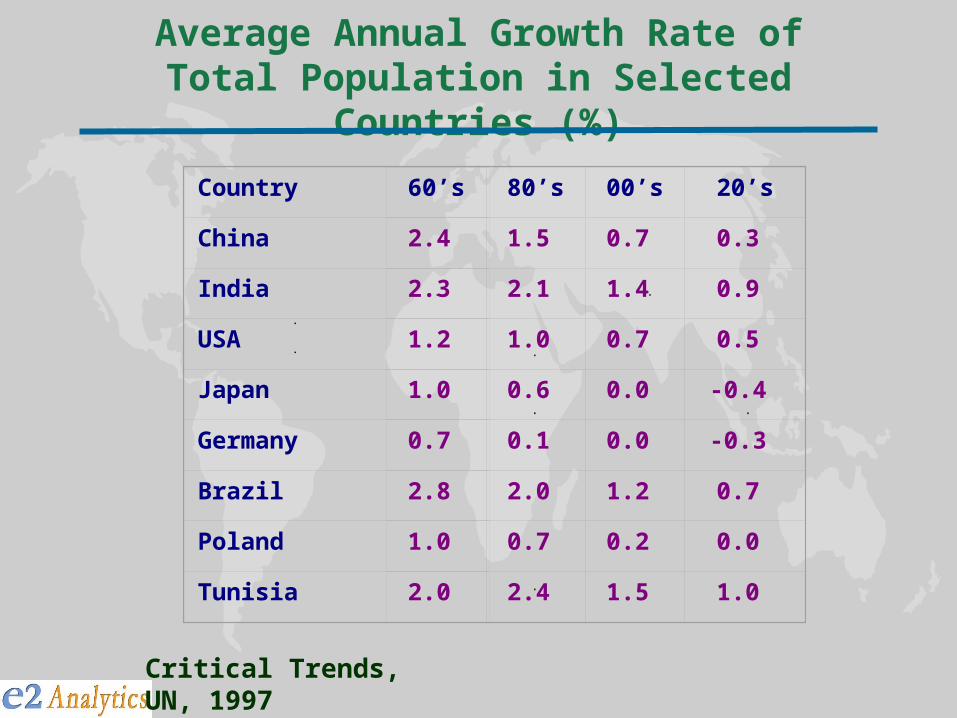
Average Annual Growth Rate of Total Population in Selected Countries (%)
Critical Trends, UN, 1997
Country 60’s 80’s 00’s 20’s
China 2.4 1.5 0.7 0.3
India 2.3 2.1 1.4 0.9
USA 1.2 1.0 0.7 0.5
Japan 1.0 0.6 0.0 -0.4
Germany 0.7 0.1 0.0 -0.3
Brazil 2.8 2.0 1.2 0.7
Poland 1.0 0.7 0.2 0.0
Tunisia 2.0 2.4 1.5 1.0
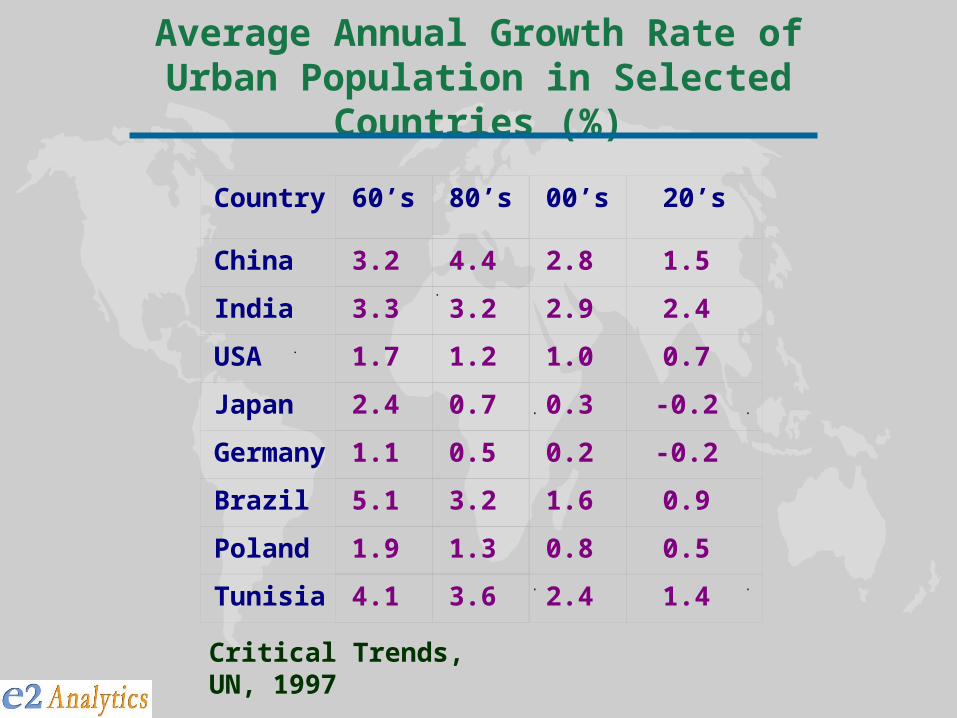
Average Annual Growth Rate of Urban Population in Selected Countries (%)
Critical Trends, UN, 1997
Country 60’s 80’s 00’s 20’s
China 3.2 4.4 2.8 1.5
India 3.3 3.2 2.9 2.4
USA 1.7 1.2 1.0 0.7
Japan 2.4 0.7 0.3 -0.2
Germany 1.1 0.5 0.2 -0.2
Brazil 5.1 3.2 1.6 0.9
Poland 1.9 1.3 0.8 0.5
Tunisia 4.1 3.6 2.4 1.4
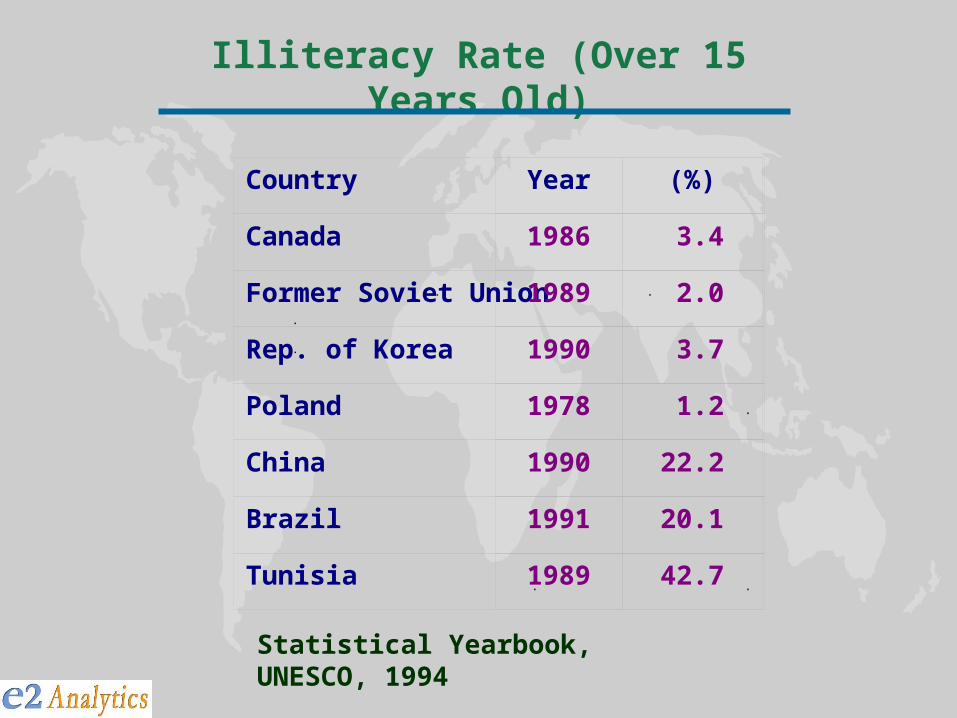
Illiteracy Rate (Over 15 Years Old)
Statistical Yearbook, UNESCO, 1994
Country Year (%)
Canada 1986 3.4
Former Soviet Union 1989 2.0
Rep. of Korea 1990 3.7
Poland 1978 1.2
China 1990 22.2
Brazil 1991 20.1
Tunisia 1989 42.7
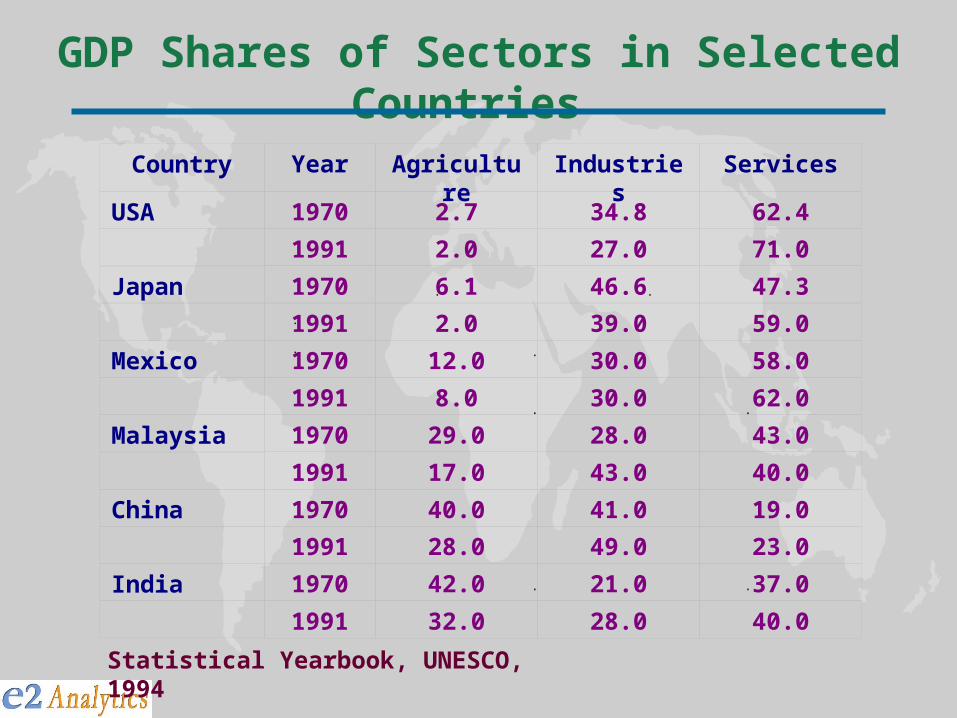
GDP Shares of Sectors in Selected Countries
Statistical Yearbook, UNESCO, 1994
Country Year Agriculture Industries Services
USA 1970 2.7 34.8 62.4
1991 2.0 27.0 71.0
Japan 1970 6.1 46.6 47.3
1991 2.0 39.0 59.0
Mexico 1970 12.0 30.0 58.0
1991 8.0 30.0 62.0
Malaysia 1970 29.0 28.0 43.0
1991 17.0 43.0 40.0
China 1970 40.0 41.0 19.0
1991 28.0 49.0 23.0
India 1970 42.0 21.0 37.0
1991 32.0 28.0 40.0
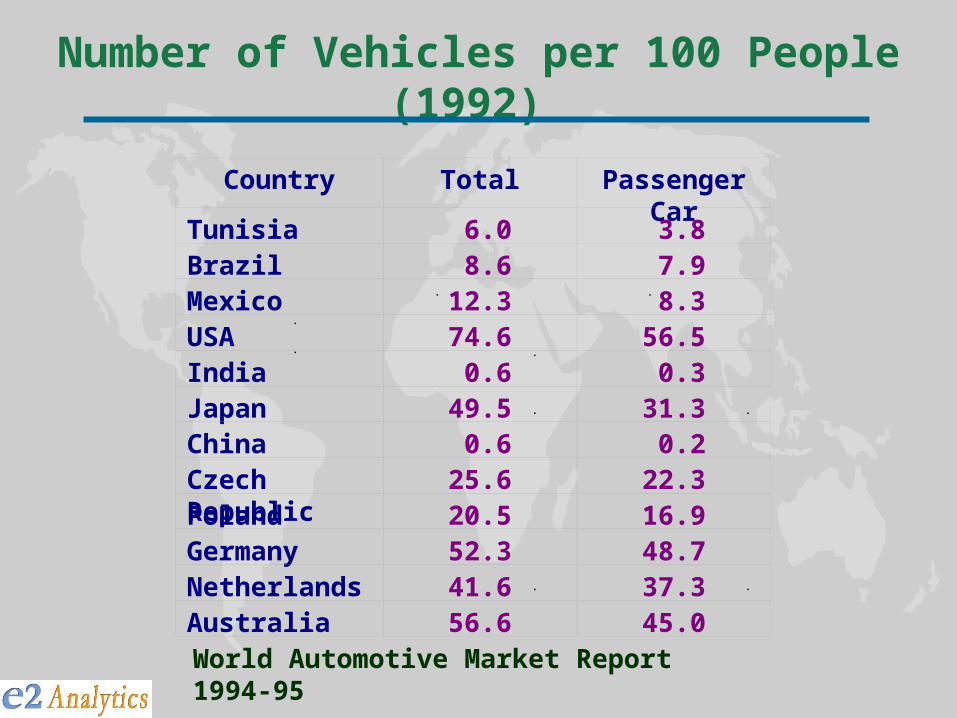
Number of Vehicles per 100 People (1992)
World Automotive Market Report 1994-95
Country Total Passenger Car
Tunisia 6.0 3.8Brazil 8.6 7.9Mexico 12.3 8.3USA 74.6 56.5India 0.6 0.3Japan 49.5 31.3China 0.6 0.2Czech Republic 25.6 22.3Poland 20.5 16.9Germany 52.3 48.7Netherlands 41.6 37.3Australia 56.6 45.0
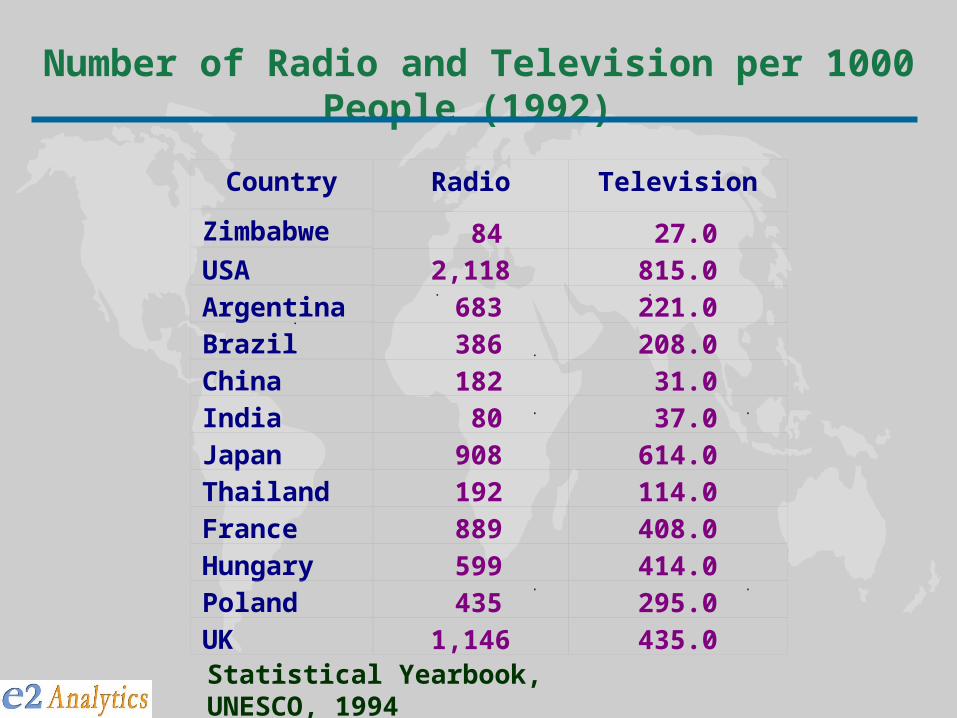
Number of Radio and Television per 1000 People (1992)
Statistical Yearbook, UNESCO, 1994
Country Radio Television
Zimbabwe 84 27.0USA 2,118 815.0Argentina 683 221.0
Brazil 386 208.0China 182 31.0India 80 37.0Japan 908 614.0Thailand 192 114.0France 889 408.0
Hungary 599 414.0Poland 435 295.0UK 1,146 435.0
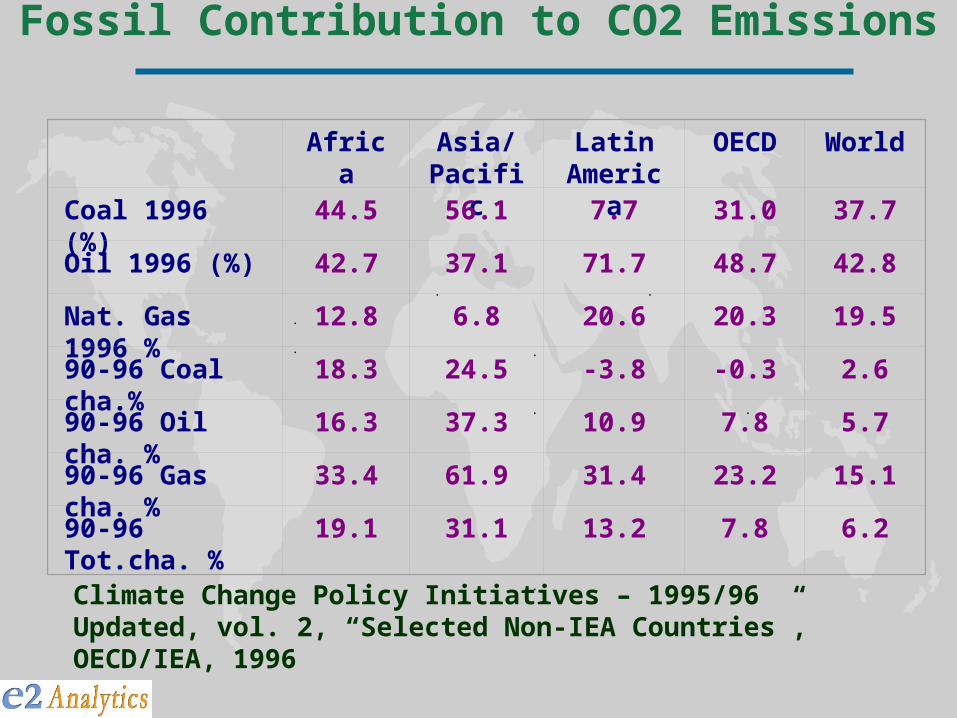
Fossil Contribution to CO2 Emissions
Climate Change Policy Initiatives – 1995/96 Updated, vol. 2, “Selected Non-IEA Countries”, OECD/IEA, 1996
Africa Asia/Pacific
Latin America
OECD World
Coal 1996 (%) 44.5 56.1 7.7 31.0 37.7
Oil 1996 (%) 42.7 37.1 71.7 48.7 42.8
Nat. Gas 1996 % 12.8 6.8 20.6 20.3 19.5
90-96 Coal cha.% 18.3 24.5 -3.8 -0.3 2.6
90-96 Oil cha. % 16.3 37.3 10.9 7.8 5.7
90-96 Gas cha. % 33.4 61.9 31.4 23.2 15.1
90-96 Tot.cha. % 19.1 31.1 13.2 7.8 6.2
Global GDP (1990 US$ Trillion)
0
5
10
15
20
25
1991 1993 1995 1997 1999
GD
P
Developed
Developing
Transition
Country Comparisons
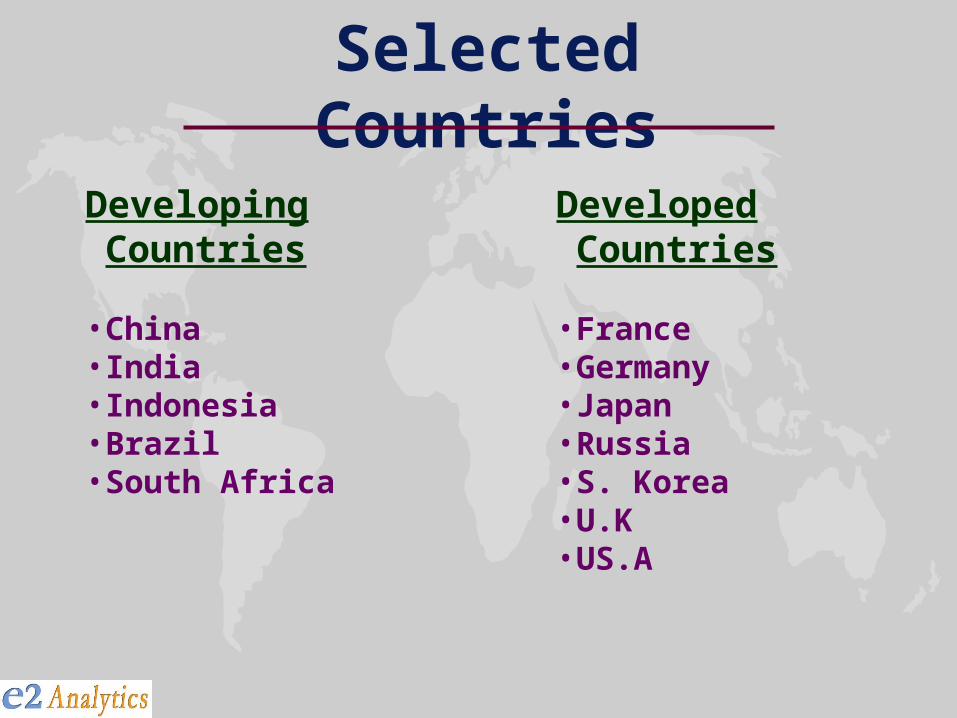
Selected Countries
Developing Countries
• China• India• Indonesia• Brazil• South Africa
Developed Countries
• France• Germany• Japan• Russia• S. Korea• U.K• US.A
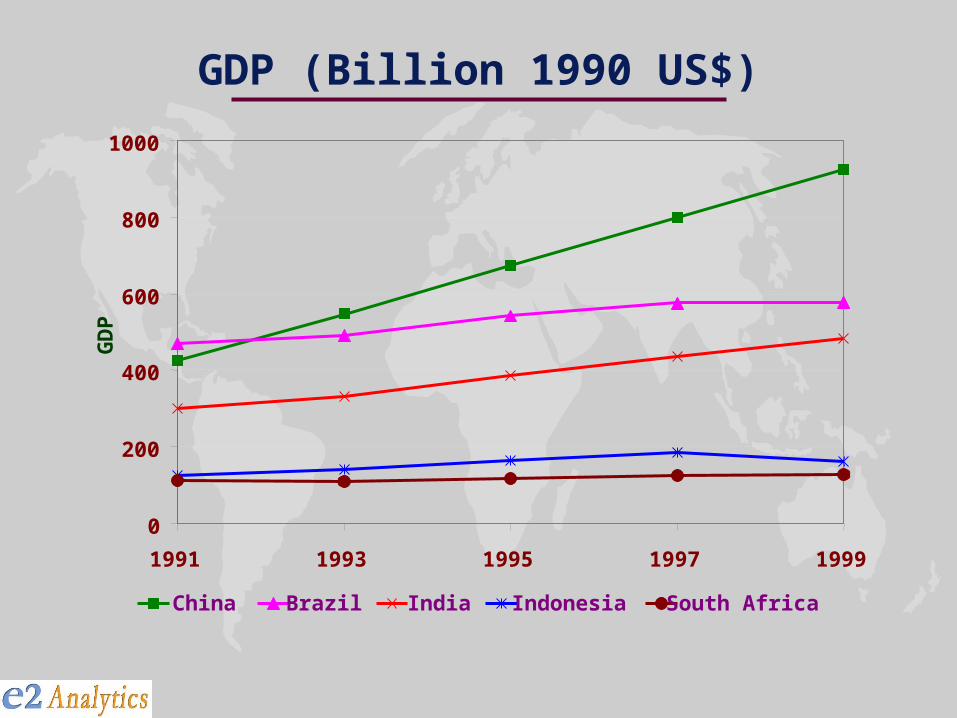
GDP (Billion 1990 US$)
0
200
400
600
800
1000
1991 1993 1995 1997 1999
GD
P
China Brazil India Indonesia South Africa
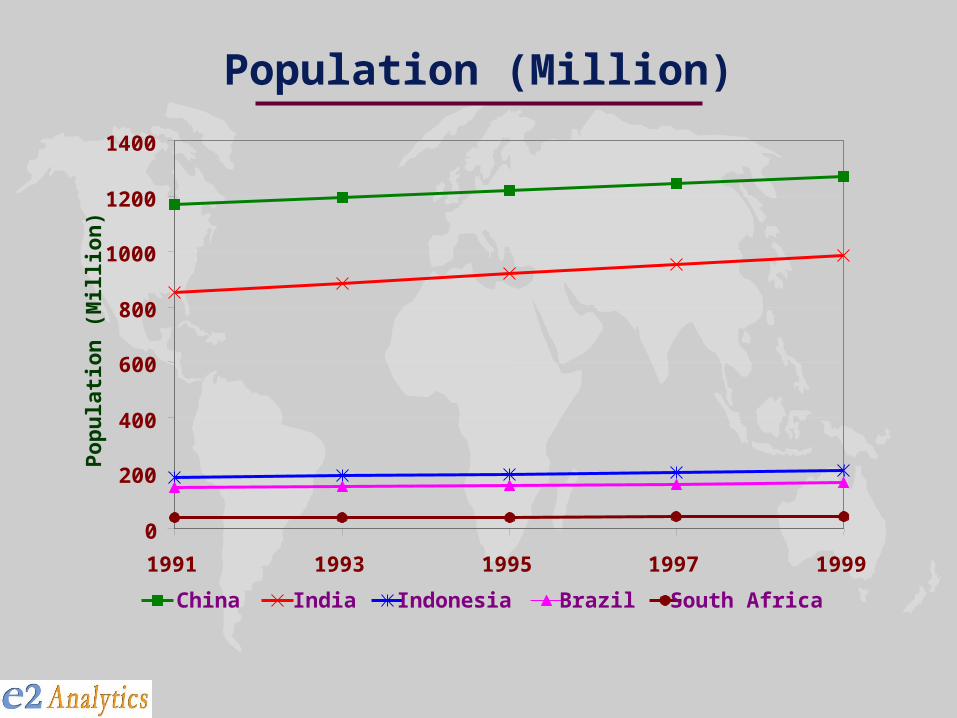
Population (Million)
0
200
400
600
800
1000
1200
1400
1991 1993 1995 1997 1999
Pop
ula
tion
(M
illi
on)
China India Indonesia Brazil South Africa
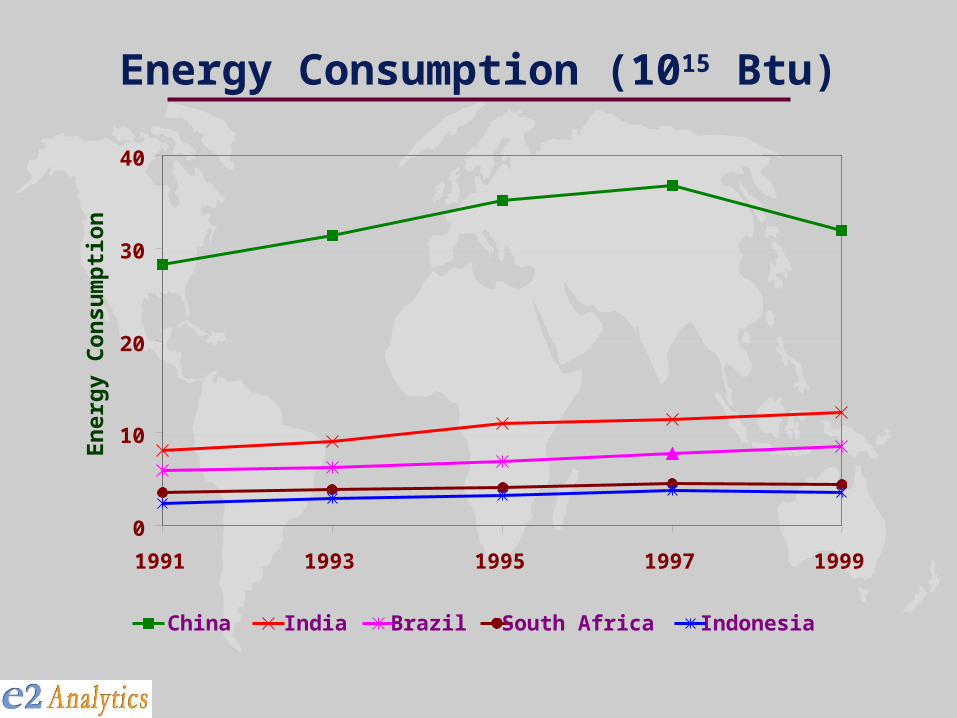
Energy Consumption (1015 Btu)
0
10
20
30
40
1991 1993 1995 1997 1999
En
ergy
Con
sum
pti
on
China India Brazil South Africa Indonesia
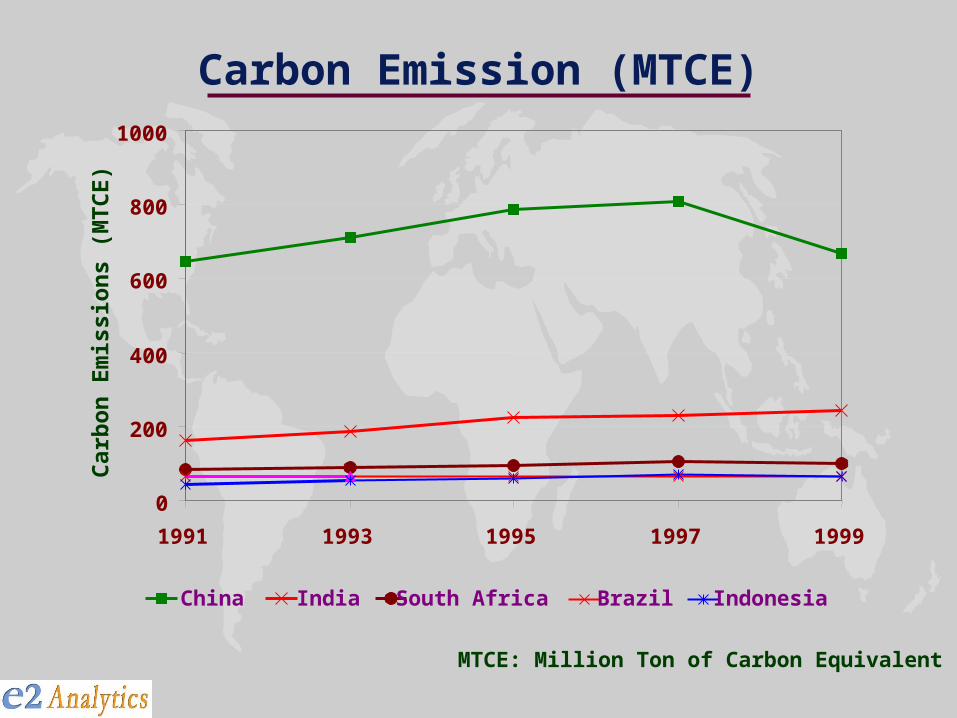
Carbon Emission (MTCE)
0
200
400
600
800
1000
1991 1993 1995 1997 1999
Car
bon
Em
issi
ons
(MT
CE
)
China India South Africa Brazil Indonesia
MTCE: Million Ton of Carbon Equivalent
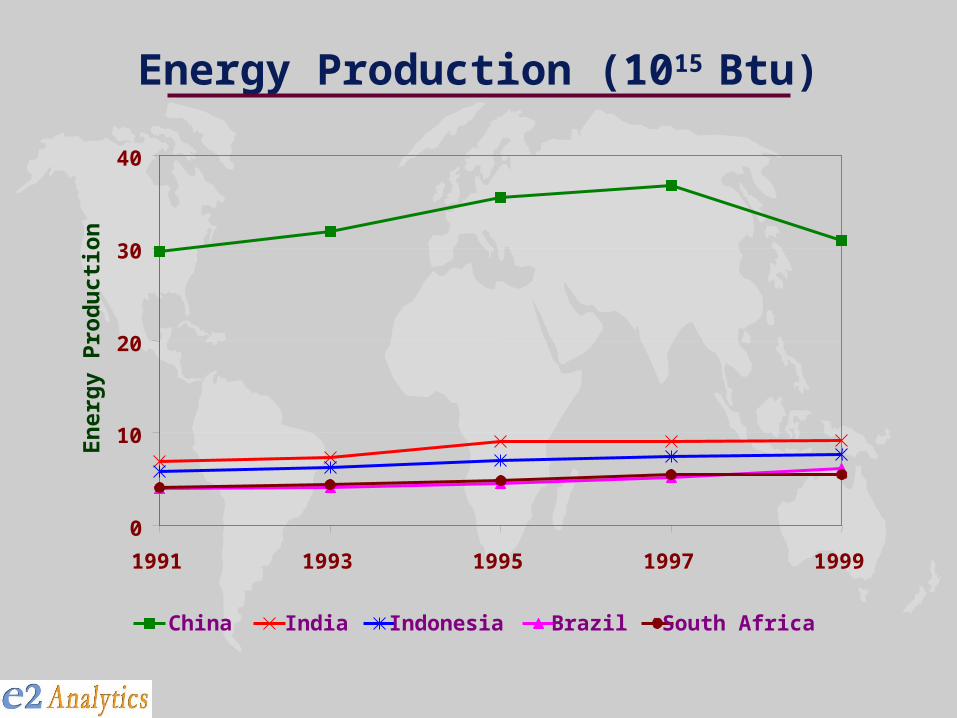
Energy Production (1015 Btu)
0
10
20
30
40
1991 1993 1995 1997 1999
En
ergy
Pro
du
ctio
n
China India Indonesia Brazil South Africa
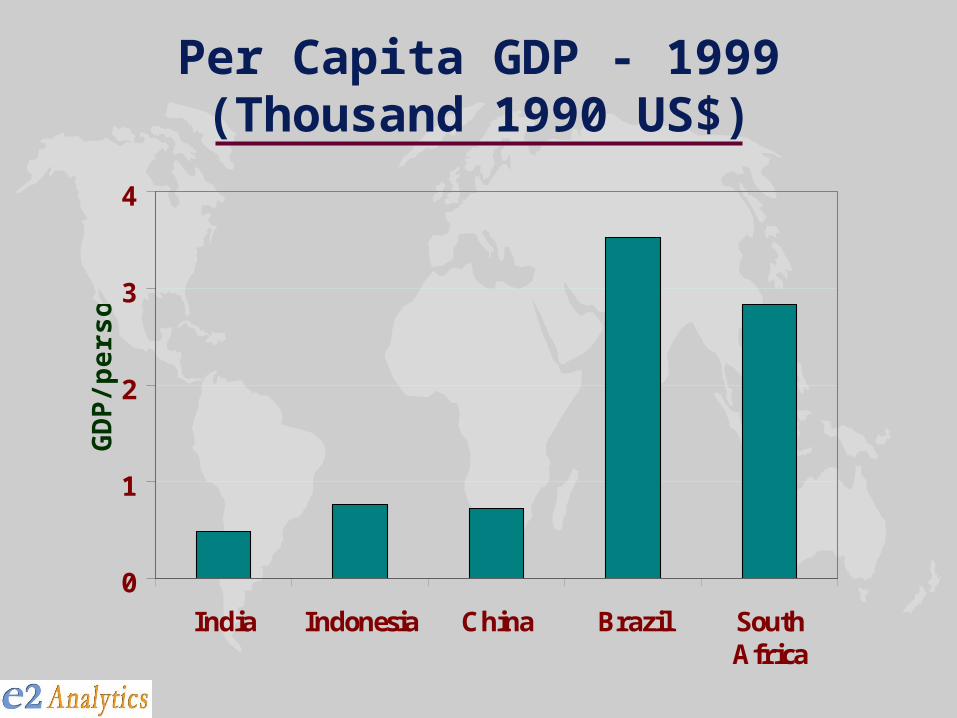
Per Capita GDP - 1999(Thousand 1990 US$)
0
1
2
3
4
India Indonesia China Brazil SouthAfrica
GD
P/p
erso
n
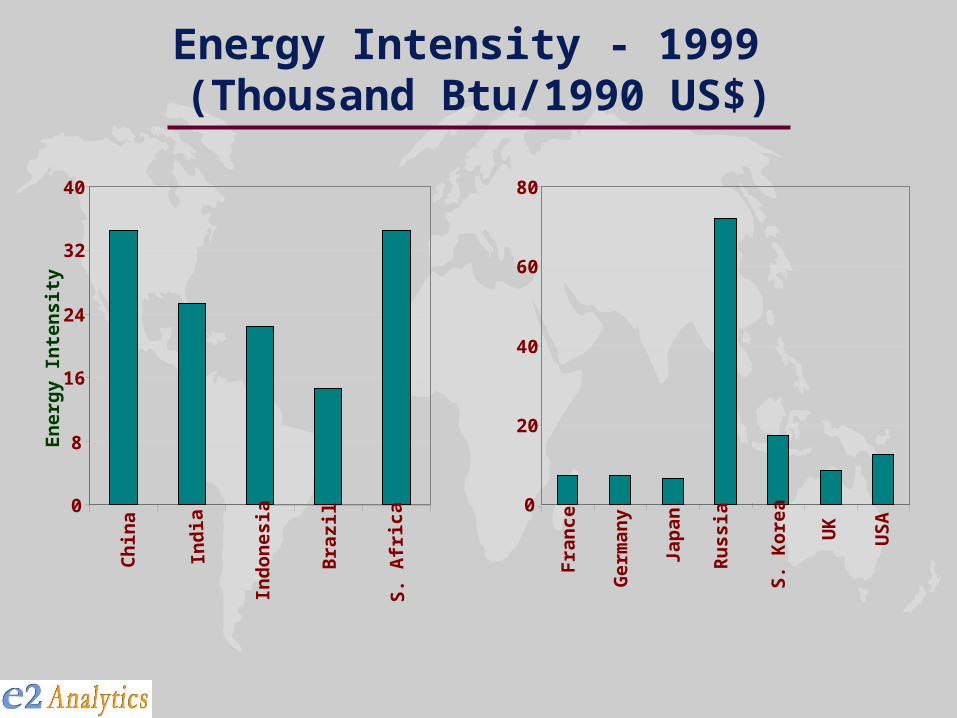
Energy Intensity - 1999 (Thousand Btu/1990 US$)
0
8
16
24
32
40
Ch
ina
Ind
ia
Ind
ones
ia
Bra
zil
S. A
fric
a
En
ergy
In
ten
sity
0
20
40
60
80
Fra
nce
Ger
man
y
Jap
an
Ru
ssia
S. K
orea
UK
US
A
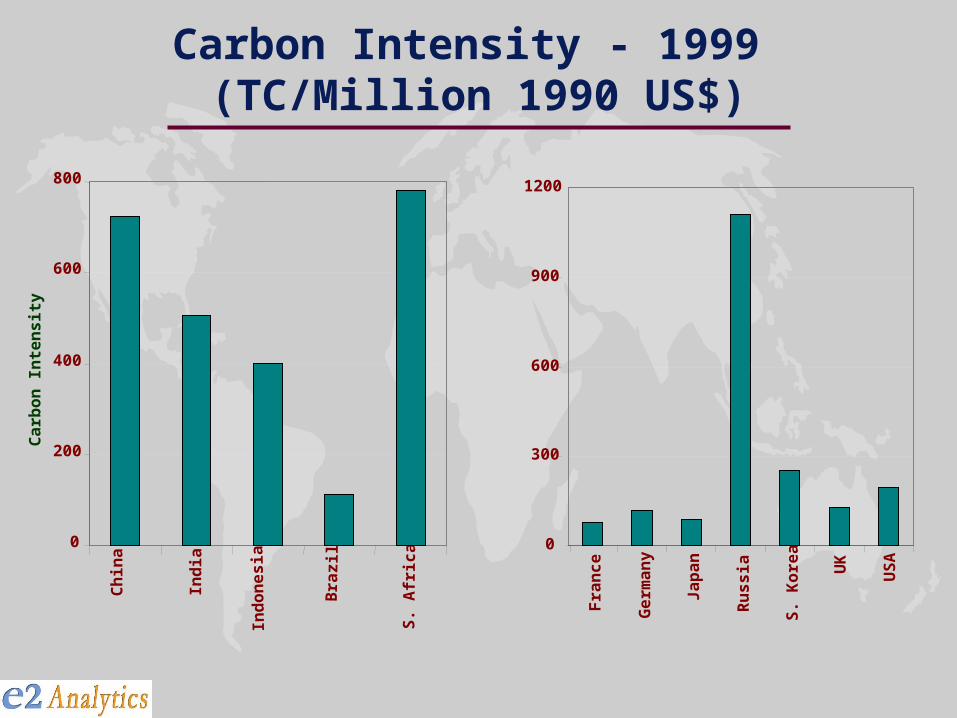
Carbon Intensity - 1999 (TC/Million 1990 US$)
Ind
ones
ia
S. A
fri c
a
0
200
400
600
800
Ch
ina
Ind
ia
Bra
zil
Car
bon
In
ten
sity
0
300
600
900
1200
Fra
nc
e
Ge
rma
ny
Ja
pa
n
Ru
ss
ia
S.
Ko
rea
UK
US
A
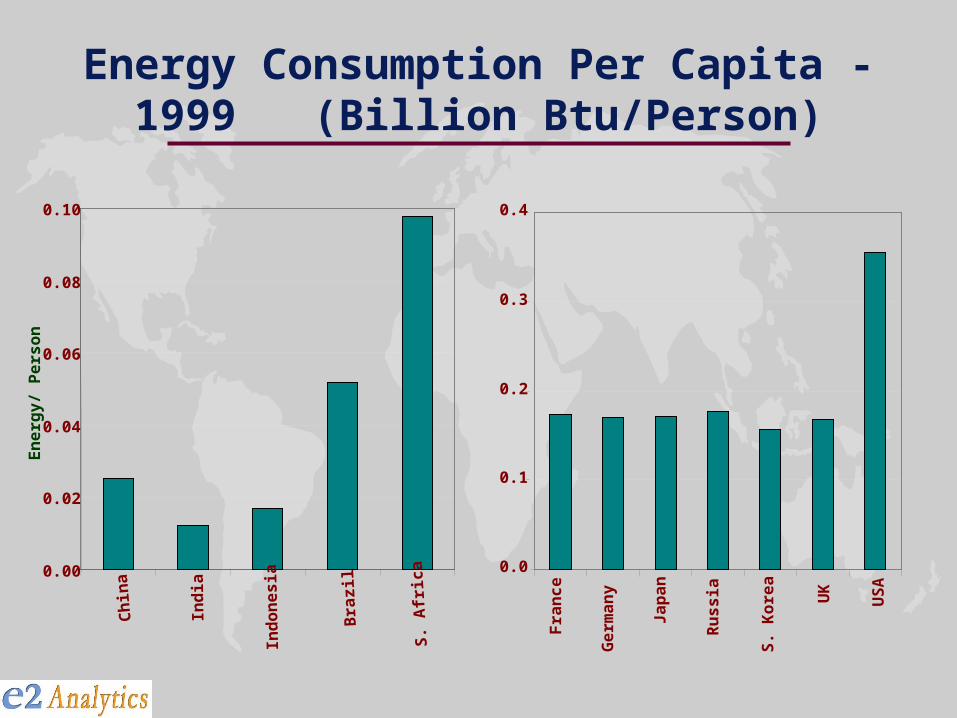
Energy Consumption Per Capita - 1999 (Billion Btu/Person)
0.00
0.02
0.04
0.06
0.08
0.10
Ch
ina
Ind
ia
Ind
ones
ia
Bra
zil
S. A
fric
a
En
erg
y/
Pe
rso
n
0.0
0.1
0.2
0.3
0.4
Fra
nc
e
Ge
rma
ny
Ja
pa
n
Ru
ss
ia
S.
Ko
rea
UK
US
A
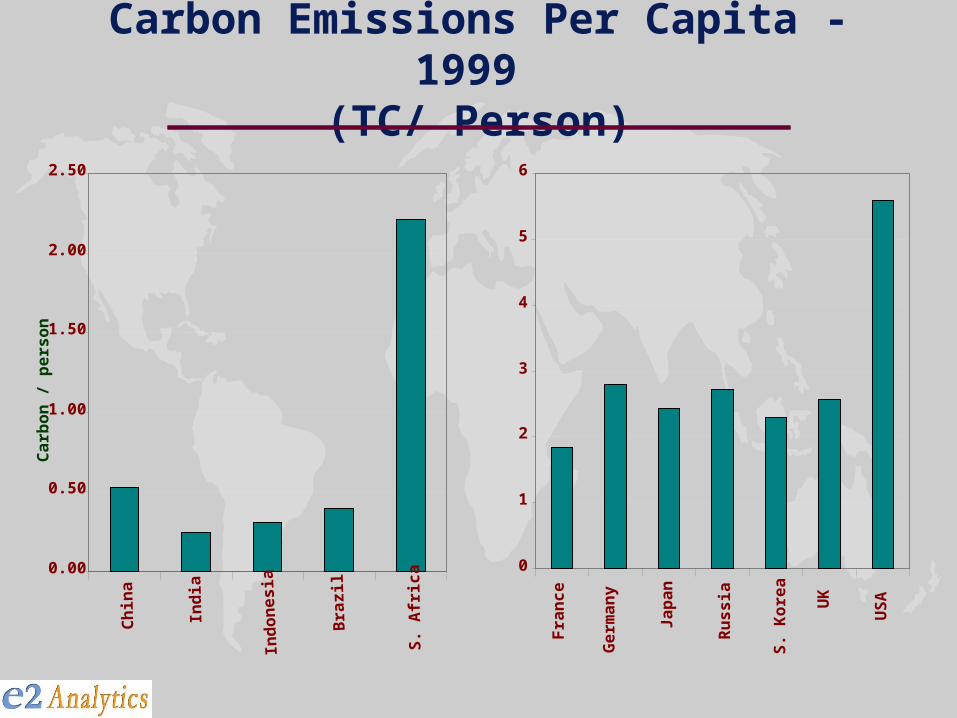
Carbon Emissions Per Capita - 1999 (TC/ Person)
0.00
0.50
1.00
1.50
2.00
2.50
Ch
ina
Ind
ia
Ind
ones
ia
Bra
zil
S. A
fric
a
Car
bon
/ p
erso
n
Ge
rma
ny
0
1
2
3
4
5
6
Fra
nc
e
Ja
pa
n
Ru
ss
ia
S.
Ko
rea
UK
US
A