Embed Size (px)
Citation preview
GLOBAL CASSAVA RESEARCH AND
DEVELOPMENT
The Cassava Econmy of Asia Adaptmg to Economic Change
Documentatwn of cassava demand studies conducted m Asia m collaboratlon With natiOnal programs
Draft verswn prepared for TAC for the Nairobi meetmg ]une 21 july l 1987
May 1987
rXJf CSOCKl'ü' ''ll...
UNIDAD DE INFORMACION Y DOCUMErHACION
2 3 AfJR 1998
\. J
O 9 JD 1J 1998
CIAT Ce>tro lnternacwnal de Agncul tura Tropical
RESEARCH GLOBAL CASSAVA ANO
DEVELOPMENT
The Cassava Economy of Asia Adaptmg to Economic Change
by
Dr 1 ohn Lynam
with collaboration from the followmg persons with respect to the Chapters mdicated
Dr Boon¡It Titapiwatanakun Kasetsart Umversity Thailand
Dr Delane Welsch Umversity of Mmnesota Malaysia
The Chapter entitled 'Trends and Distnbutwn of Chmese Cassava Productwn and Use
was prepared by
Dr Bruce Stone Internatwnal F ood Pohcy Research Institute
May 1987
CIAT Centro InternaciOnal de Agncul tura Tropical
Preface
The accompanying manuscript on the Cassava Economy of AsÁa represents a work stÁll 1n progress The study is essentially complete in its maJor find1ngs but the work has not yet been shaped into a consistent whole Distribution at this stage is done in order to share at an early stage the findings of the study with those interested in understand1ng the current status and future potent1al of the cassava crop The report should therefore be read as a draft the introductory chapter is not included here and the animal feed section for the China chapter was not ready in time for inclus1on Also some of the figures are sitll lack1ng 1n the text
The study has adopted a country-by-country approach to the analysis of the cassava economy in Asia It will hopefully be apparent from the study that this approach was correct as the differences between the var1ous countries are large indeed The study covers all the maJor cassava producing countries 1n the region except V1etnam for which access was restricted The study relies almost exclusively on secondary data sources The only primary data collection involved a cost survey of ch1pping and pelleting factories in Thailand A dependence on existing data source has often left areas where further detail would have been valuable especially in production 1ssues Nevertheless Asian countries have relatively well developed data systems wh1ch allowed a s1gn1f1cant level of detail 1n the analysis although the data base for cassava is far weaker than that for the prÁncipal grains
The study was carried out by John Lynam the economist 1n the CIAT Cassava Program except for the chapter on China which was dony by Dr Bruce Stone of the Internacional Food Policy Research Institute Dr Lynam was aided 1n this task by Dr BoonJ1t Titapiwatanakum of Kasetsart Un1versity who oversaw the cost survey of the cassava processing plants in Thailand Dr Delane Welsch of the Un1versity of Minnesota was hired as a consultant for the early phases of the proJect to help in data collection and 1nitial planning of the subject material The author visited all the countr1es and the pr1ncipal production zones but not extensive per1od of t1me was devoted to more in-depth studies 1n the countries With the current study as a planning base there are now plans to undertake more micro-level stud1es which w1ll support CIAT s overall research effort on cassava in Asia
The current volume should therefore be seen as an 1ntegral part of CIAT s research effort 1n the reg1on and as such the contans and results w1ll be subJect to revision as more 1nformation is developed about the crop in As1a An independent researcher may have approached the subJect d1fferently and in some instances may have put emphas1s on d1fferent issues 1n the conclusions However what has been more valuable for CIAT 1s the process 1nherent 1n the study The study prov1des only a snapshot 1n t1me of an ongo1ng exercise fncused on a fuller 1ntegration of th1s type of research 1nto research on cassava production and processing technology 1n Asia Having been forced to develop hypotheses probe data sources and understand markets and pol1cies the CIAT Cassava Program has itself deepened 1ts understanding of cassava in the region an understanding on wh1ch it now can build
I
II
The Cassava Economy of As~a Adapt~ng to Economic Change
Tak~ng Root A History of Cassava in As~a (Chapter ~n preparat~on)
1 2 3 4
5
Introduction and early distribut~on The ~ntegration of cassava ~nto As~an food The advent of steamship trade and the r~se Shift~ng comparative advantage Malaysia Thailand Cassava a crop in permanent transition
economies of tap~oca pearl Indonesia and
Ind~a Kerala and Tamil Nadu
1 Production a Production trends and distr~bution b Cassava production systems
1 Kerala 2 Tam~l Nadu
e Yields d Costs of production and labor utilizaiton e Teehnology
2 Markets and Demand a A synthes~s of produetion and utilization
1 Kerala 2 Tam11 Nadu 3 Other States
b Cassava for direet human eonsumption e The dr~ed eh~p market d The stareh market e Prie~ng and market effie~eney
3 Conelusions
III Trends and Distribution of Chinese Cassava Produet~on and Use (by Bruee Stone IFPRI)
1 Produetion a Produetion trends and d~str~but~on b Cassava produet~on systems e Y~elds
d Costs of produetion and labor util~zation e Teehnology development
2 Markets and demand a A synthesis of produet~on and util~zat~on b Cassava for d~reet human eonsumption e The stareh market d Tne domest~e and export an~mal feed market
3 Conelusions
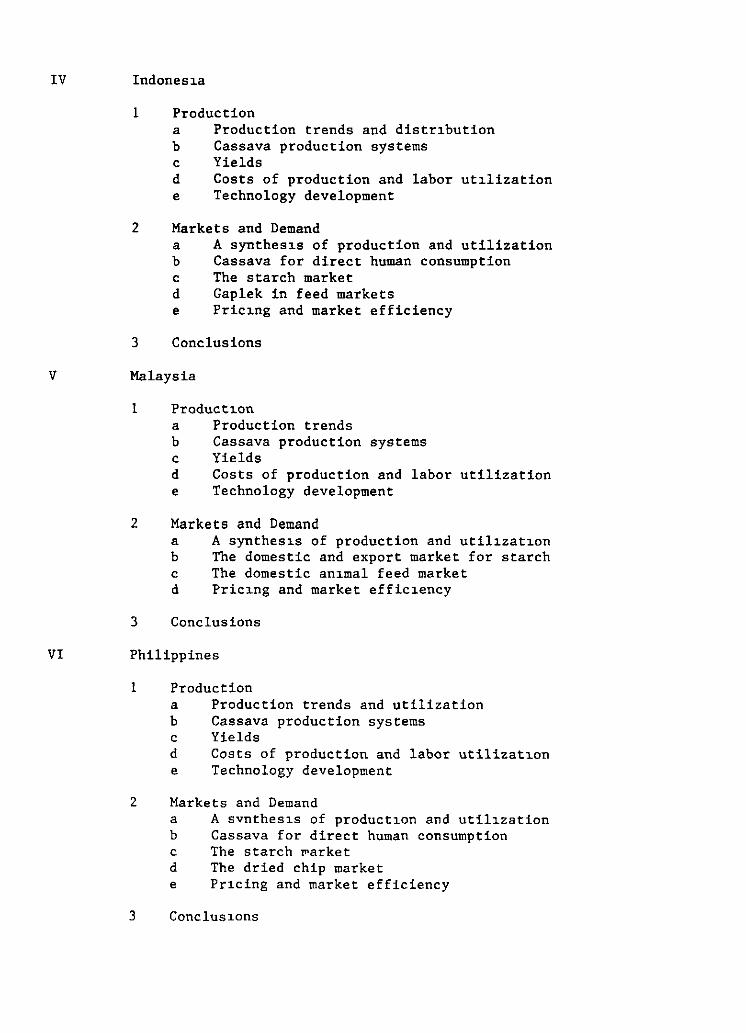
IV Indones~a
1 Produetion a Produetion trends and distr~bution b Cassava produetion systems e Yields d Costs of produetion and labor ut~lization e Teehnology development
2 Markets and Demand a A synthes~s of produetion and utilization b Cassava for direet human eonsumption e The stareh market d Gaplek in feed markets e Prie~ng and market efficiency
3 Conclusions
V Malaysia
1 Product~on a Production trends b Cassava production systems e Yields d Costs of produetion and labor utilization e Technology development
2 Markets and Demand a A synthes~s of production and util~zat~on b The domestic and export market for starch e The domestic an~mal feed market d Pric~ng and market effie~eney
3 Conelusions
VI Philippines
1 Produetion a Produetion trends and utilization b Cassava produetion systems e Yields d Costs of produetion and labor utilizat~on e Teehnology development
2 Markets and Demand a A svnthes~s of produet~on and util~zation b Cassava for direet human eonsumption e The starch ~arket d The dried chip market e Pr~cing and market efficieney
3 Conclus~ons
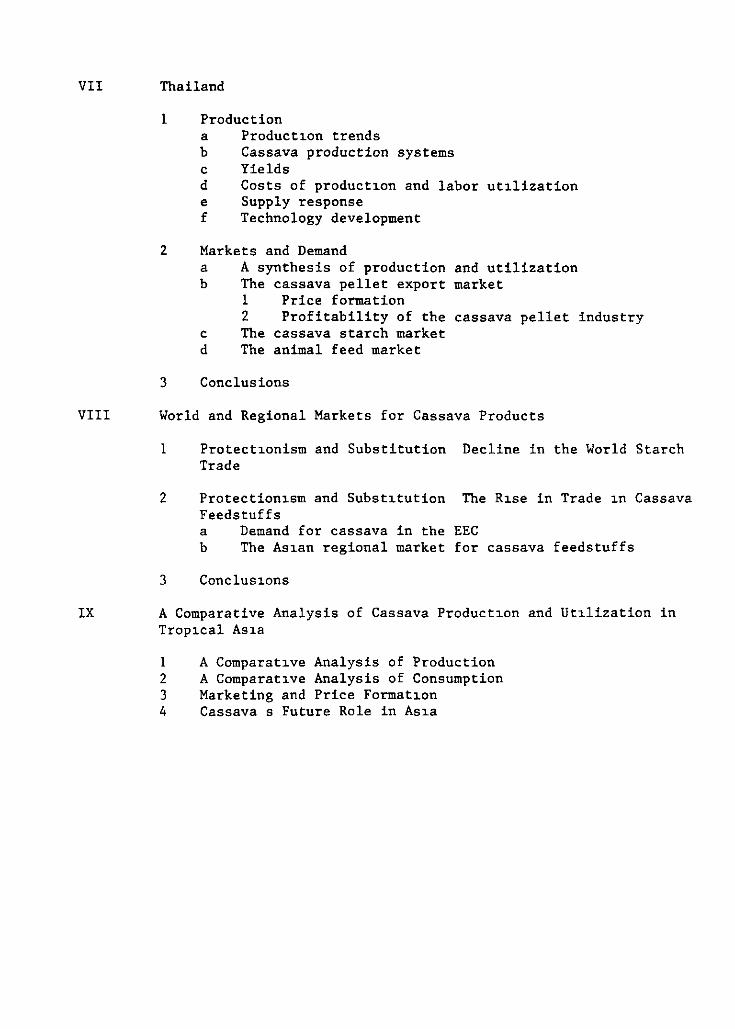
VII Thailand
1 Production a Product~on trends b Cassava production systems e Yields d Costs of product~on and labor ut~lization e Supply response f Technology development
2 Markets and Demand a A synthesis of production and utilization b The cassava pellet export market
1 Price formation 2 Profitability of the cassava pellet industry
e The cassava starch market d The animal feed market
3 Conclusions
VIII World and Regional Markets for Cassava Products
IX
1 Protect~onism and Substitution Decline in the Wor1d Starch Trade
2 Protection~sm and Subst~tution The R~se in Trade ~n Cassava Feedstuffs a Demand for cassava in the EEC b The As~an regional market for cassava feedstuffs
3 Conclus~ons
A Comparative Analysis of Cassava Product~on and Ut~lization in Trop~cal As~a
1 A Comparat~ve Analysis of Production 2 A Comparat~ve Analysis of Consumption 3 Marketing and Price Format~on 4 Cassava s Future Role in As~a
li INDIA
Cassava within the Rural Economies of ~erala and Tamil Nadu
India is a vast diverse sub-continent where over three-quarters of the 684 million people (1981 Census) live in the rural and sector where their welfare is subject to the vagaries of the annual monsoons Consequently a maJOr concern of agricultura! policy has been developing the capacity of the country to feed itself and this in turn has resulted in a commitment to attaining self-sufficiency in food grain production This goal was achieved in the m1d-1970 s essent1ally by focusing on development of the more productive agricultura! regions (Sarma 1982)
Self-sufficiency while indicating a termination in imports is nevertheless a relative concept because it implies that consumption is limited to production availability rather than determ1ned by demand fa_tors The central government has attempted to control the resultant price fluctuations by intervening in grain marketing to manage demand The government operates a public food distribution system at subsidized prices to ensure that a certain m1nimum level of universal distribution of food grains is achieved independent of income levels
As Sarma has noted This (self-sufficiency) strategy wh1ch was confined to certain crops and areas with assured irrigat1on also resulted in the widening of interpersonal and interreg1onal dispar1ties The social justice objective in terms of reducing unemployment or underemployment and allev1ating poverty in rural areas remained largely unfulfilled (p 24) The cassava-growing areas in the south of India have been such a region which has rema1ned largely outside the area of 1mpact of the green revolution technology Although cassava is very much a regional crop in India this is also true of all other crops except rice Analyzing cassava in southern Ind1a thus provides some insight into rectifying the disparities between regions in India
PRODUCTION
Product1on Trends and Distr1bution
Cassava 1s very much a regional crop in India two states Kerala and Tamil Nadu make up 971 of cassava product1on in India (Table 2 1) On a country wide basis cassava makes only a small contr1bution to total calorie supplies w1th production being more or less equivalent to some of the minor coarse grains such as barlev or the small m1llets However in the south of the country cassava ranks second to rice as the maJor calorie producing crop G1ven the range of temperature and ra1nfall condit1ons in Ind1a this type of reg1onal specialization 1n crop product1on would be expected for non-1rr1gated crops
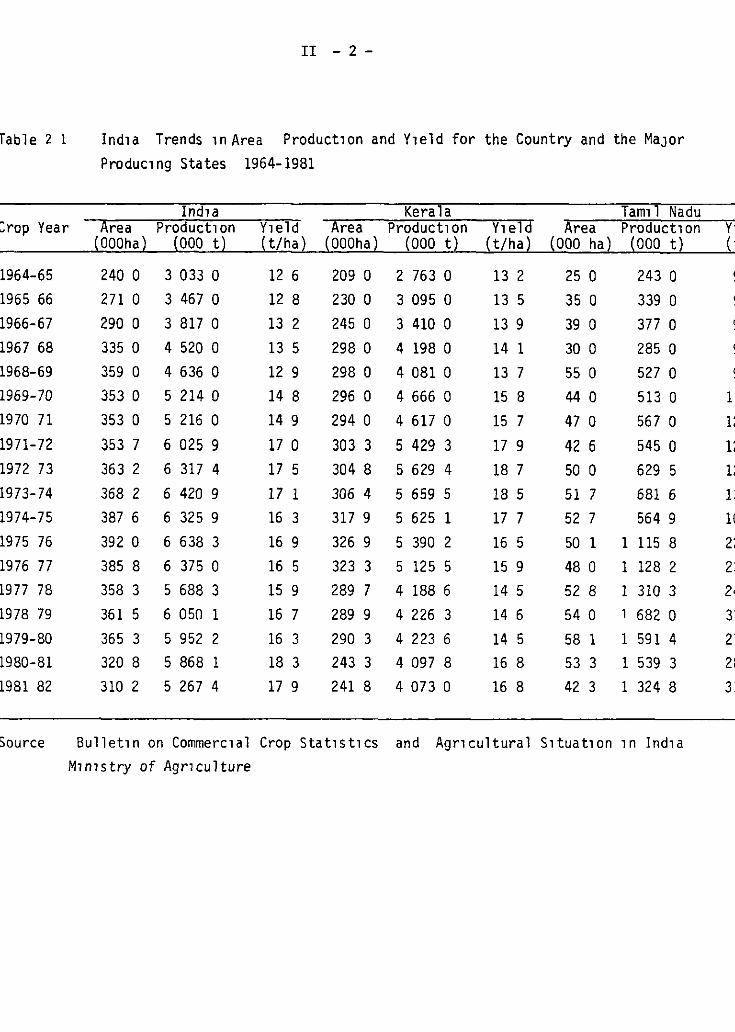
Accord1ng to the official data series area planted to cassava in India increased slowly from the mid-s1xties to the m1d-sevent1es reaching a peak area of 392 thousand hectares in 1975-76 (Table 2 1) S1nce then cassava area has declined quite markedl) reaching a level of 310 thousand hectares in 1981-82 The trends in area are due principa~ly to changes in
II - 2-
fable 2 1 Ind1a Trends 1 n Are a Product1on and Y1eld for the Country and the MaJor Produc1ng States 1964-1981
Ind1a Kera la Tam1l Nadu :rop Year Are a Product1on Y1eld Are a Product1on Y1eld Are a Product1on
1964-65 1965 66
1966-67 1967 68
1968-69 1969-70 1970 71
1971-72
1972 73
1973-74 1974-75 1975 76
1976 77 1977 78
1978 79
1979-80 1980-81 1981 82
Source
(OOOha) (000 t) (t/ha) (OOOha) (000 t) (t/ha) (000 ha) ( 000 t)
240 o 3 033 o 12 6 209 o 2 763 o 13 2 25 o 243 o 271 o 3 467 o 12 8 230 o 3 095 o 13 5 35 o 339 o 290 o 3 817 o 13 2 245 o 3 410 o 13 9 39 o 377 o 335 o 4 520 o 13 5 298 o 4 198 o 14 1 30 o 285 o 359 o 4 636 o 12 9 298 o 4 081 o 13 7 55 o 527 o 353 o 5 214 o 14 8 296 o 4 666 o 15 8 44 o 513 o 353 o 5 216 o 14 9 294 o 4 617 o 15 7 47 o 567 o 353 7 6 025 9 17 o 303 3 5 429 3 17 9 42 6 545 o 363 2 6 317 4 17 5 304 8 5 629 4 18 7 50 o 629 5 368 2 6 420 9 17 1 306 4 5 659 5 18 5 51 7 681 6 387 6 6 325 9 16 3 317 9 5 625 1 17 7 52 7 564 9 392 o 6 638 3 16 9 326 9 5 390 2 16 5 50 1 1 115 8 385 8 6 375 o 16 5 323 3 5 125 5 15 9 48 o 1 128 2 358 3 5 688 3 15 9 289 7 4 188 6 14 5 52 8 1 310 3 361 5 6 050 1 16 7 289 9 4 226 3 14 6 54 o 1 682 o 365 3 5 952 2 16 3 290 3 4 223 6 14 S 58 1 1 591 4 320 8 S 868 1 18 3 243 3 4 097 8 16 8 53 3 1 539 3 310 2 S 267 4 17 9 241 8 4 073 o 16 8 42 3 1 324 8
Bullet1n on Commerc1al Crop Stat1st1cs and Agr1cultural S1tuat1on 1n Ind1a M1n1stry of Agr1culture
Y· ('
1
1: ¡;
1:
1:
1(
2: 2: 2<
3: 2: 2l
3:
11 - 3 -
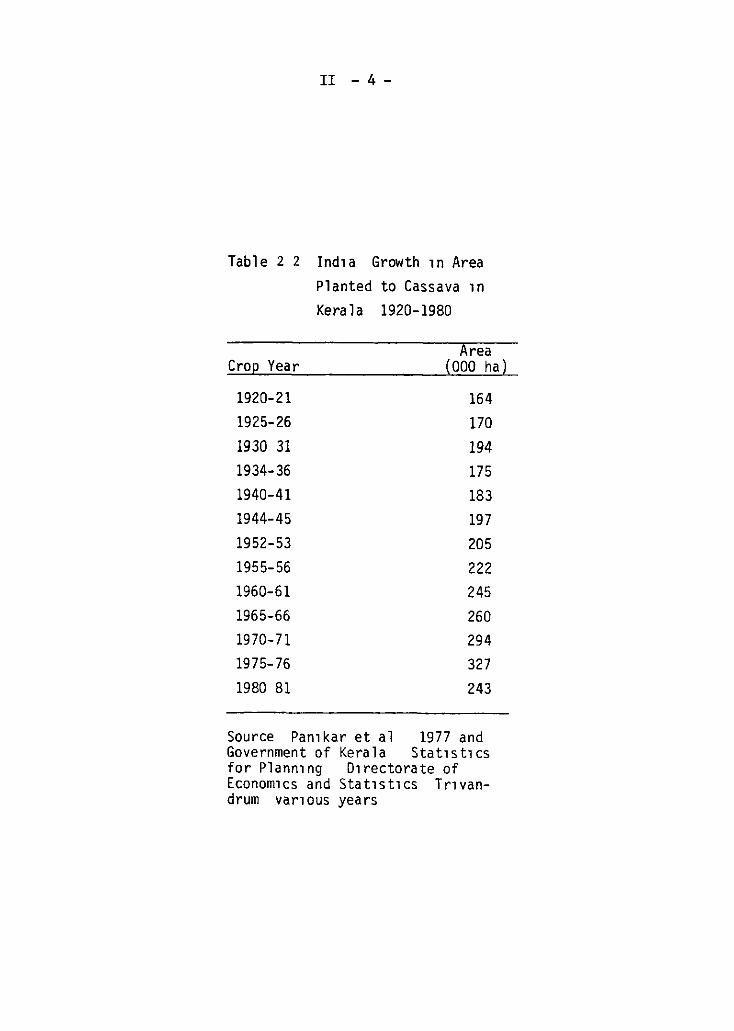
cassava plantings in Kerala Cassava has been widely planted in Kerala since at least the turn of the century In the 55-year period from 1920 to 1975 cassava area in Kerala expanded at a relatively slow and uneven rate of 1 3% per annum (Table 2 2) Since 1975 cassava area has declinad rapidly to the same level as the early sixt1es On the other hand area planted to cassava in Tamil Nadu has remained relatively constant at around 50 thousand hectares since the late 1960 s
Product1on trends are more difficult to evaluate since the basis on which yield has been estimated has been changed twice In 1963 yield levels in Kerala were revised sharply upward from a trend of 7 t/ha to a rising yield trend starting at 12 t/ha In 1979 a crop cutting survey was instituted in Kerala and Tamil Nadu and what had been a rising trend in yields in Kerala was revised downward In Tamil Nadu on the other hand yield estimates were dramatically increased Given these revisions in yield estimares production trends which follow from the area and yield estimates are somewhat mean1ngless What can be sa1d w1th sorne degree of confidence is that production in Kerala has declinad markedly s1nce 1975 at an annual rate of about 5% per annum Cassava production in Tamil Nadu in the same period has shown a slight increase The dominant question that arises is the reason behind the declining area and production oÍ cassava in Kerala
Cassava production systems
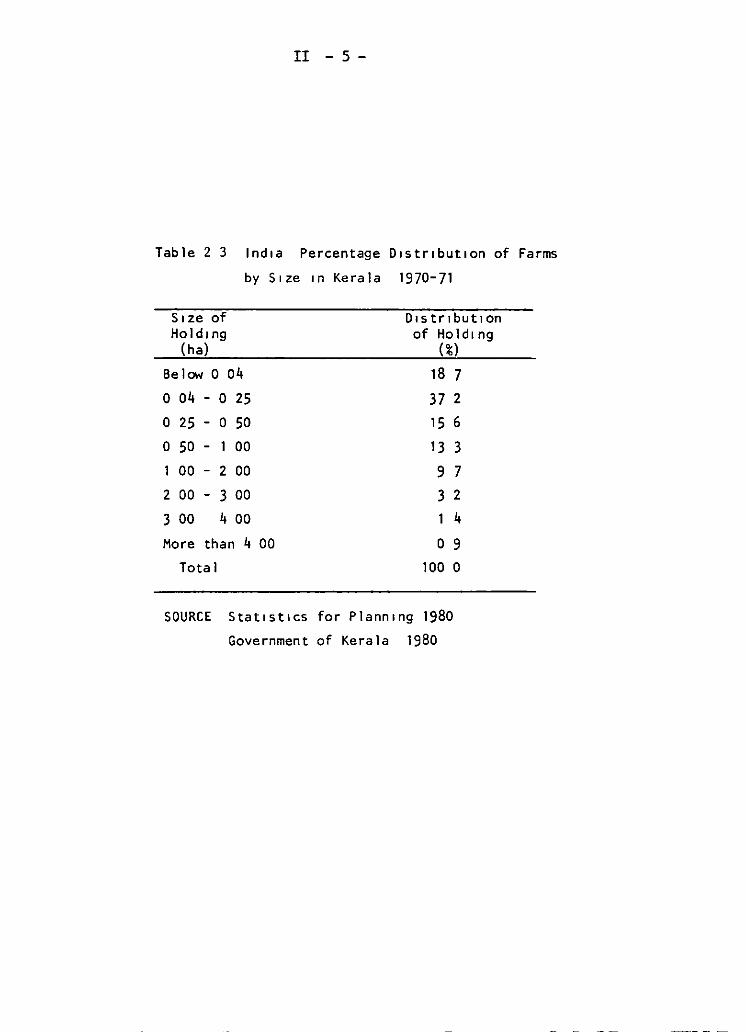
Kerala Kerala is one of the most populous rural areas in the trop1cs Populat1on densities in sorne districts exceed 1000 people per square kilometer About 81k of the population reside in the rural area according to the 1981 census while a little less than half of the work force are directly involved 1n agricultura Rowever a more accurate reflection of the populat1on pressure is that while average farm size 1s only O 49 of a hectare only one third of the work force in the agr1cultural sector have access to land Moreover over 70% of the population who do own land have less than half a hectare (Table 2 3)
As a consequence of this population pressure land use is very 1ntensive Exclud1ng forest reserves and non-agricultura! uses 87% of ava1.lable land is cultivated The cropping intensity index in Kerala 1n 1977/78 was 132 percent well above the average for India as a whole However this figure is more remarkable when it 1s considerad that two-thirds of cultivated area is under permanent tree crops Thus for area under annual crops the cropping 1ntensity index is 192 percent that is a substantial port1on of the land under annual crops is double or triple cropped
Cassava is the most 1mportant annual crop in Kerala after r1ce mak1ng up 38/ of the net area sown to annual crops Two factors explain why cassava has achieved such 1mportance in so 1ntens1ve an agr1cultural system First the non-irrigated upland areas are cnaracterized by later1t1c soils which are low in inherent so1l fert1lity especially phosphorus and are qUl.te acidic Cassava 1n compar1son to most other annual crops is well adapted to such so1ls even Wl.th relat1vely min1m~l amounts of fertilizar Second cassava gives very h1gh carbohydrate y1elds under these cond1tions W1th average y1elds around 15 t/ha only tr1ple
II - 4-
Table 2 2 Ind1a Growth 1n Area Planted to Cassava 1n Kerala 1920-1980
Area Cro~ Year (000 ha)
1920-21 164
1925-26 170
1930 31 194
1934-36 175
1940-41 183
1944-45 197
1952-53 205
1955-56 222
1960-61 245
1965-66 260
1970-71 294
1975-76 327
1980 81 243
Source Pan1kar et al 1977 and Government of Kerala Stat1st1cs for Plann1ng D1rectorate of Econom1cs and Stat1st1cs Trlvandrum var1ous years
II -S-
Table 2 3 lnd1a Percentage D1str1but1on of Farms
by S 1 ze 1 n Kera la 1970-71
S1ze of 01str1but10n Hold1ng of Hold1ng
(ha) (%) Below O 04 18 7
o 04 - o 25 37 2
o 25 - o 50 15 6
o 50 - 00 13 3
1 00 - 2 00 9 7
2 00 - 3 00 3 2
3 00 4 00 4
More than 4 00 o 9
Total 100 o
SOURCE Stat1st1cs for Plann1ng 1980
Government of Kerala 1980
Il -6-
cropping of rice under irrigation g1ves higher dry weight yields in the state
While rice is grown on the irrigated bottomland cassava is grown on the sloping upland areas On these upland soils cassava competes pr1marily with tree crops for land and it is the general concensus that cassava is being displaced by higher value tree crops However for the principal tree crops increased plantings of rubber and cashewnut are more than offset by dechning area of coconut and black pepper (Table 2 4) The crop or crops that are displacing cassava remain unclear from the aggregate data but the strongest hypothesis still remains some combination of tree crops
Cassava production systems in Kerala are relatively simple compared to countries such as Indonesia Th1s is partly due to the constra1nts on potentul intercrops imposed by soil conditions Annual rainfall in the state averages about 3000 mm and varies from about 2000 mm in the south to 3800 mm in the north There is a long dry period from December to March when little rain at all is received The rains start in April-May when 60-65% of the cassava crop is sown (Hone 1973) The monsoons arrive in full force in June-July From 35-40% of the crop 1s planted in September-October when the rains have fallen off but before the start of the dry season in December
Land preparation is done completely by hand and any green vegetation in the plot is concentrated 1n the soil below where the cassava stems are to be sown The stakes are sown vertically at populations of 10 to 12 thousand per hectare In such intensive systems weed control is fairly meticulous and when farmyard manure or wood ash 1s available it is incorporated in the same form as the green manure
Some chemical fertilizer is certainly used on cassava in Kerala although there is conflicting data to suggest just how extensive this use is Certainly potassium fert1l1zer consumption is a much higher percentage of total fertil1zer consumption in Kerala than in India as a whole (33 3/ of consumption as compared to 11 4% in the whole country) Cassava (and tree crops) has a h1gher potassium requirement than grain crops A National Council of Applied Economic Research survey in 1975/76 found that 83% of cassava area m Kerala was fertilized but that only 19 kg/ha of nutrients were appl1ed to the area fertilized Desa1 (1982) has found this survey to substantially overestimate aggregate fertilizer consumption in Kerala He provides estimates for India as a whole suggesting that 1n 1976/77 38 2% of cassava area was fertil1zed at a rate of 33 kg/ha The limited data available thus suggests that there is some fertilizat1on of cassava but at very low rates of appl1cat1on
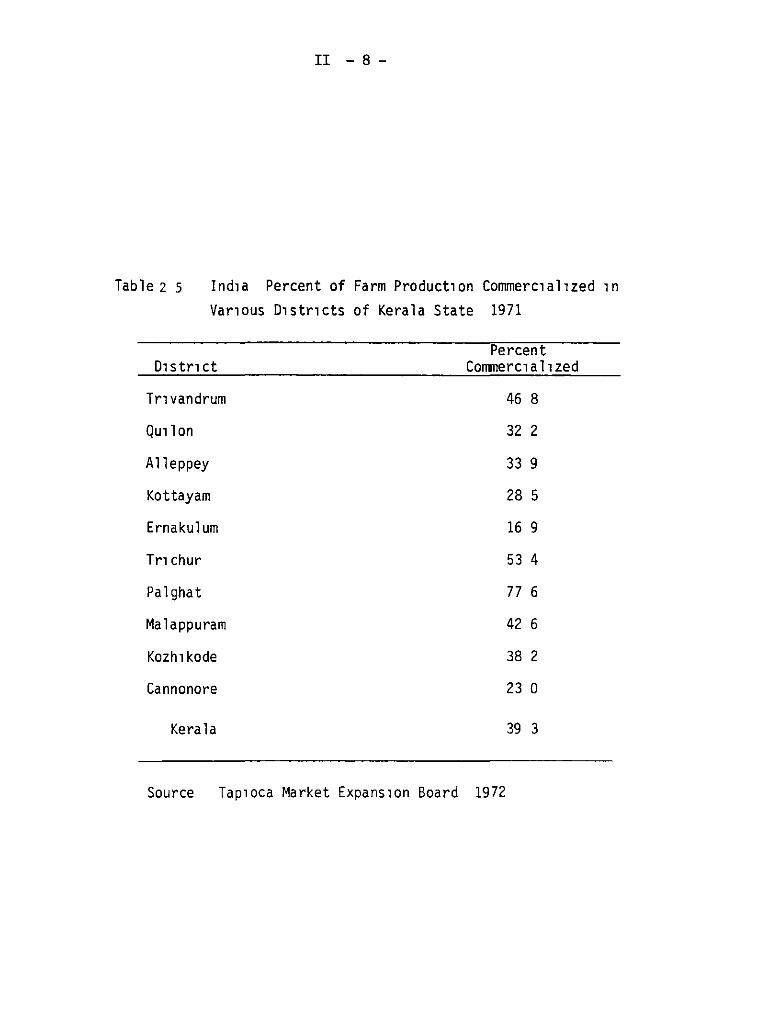
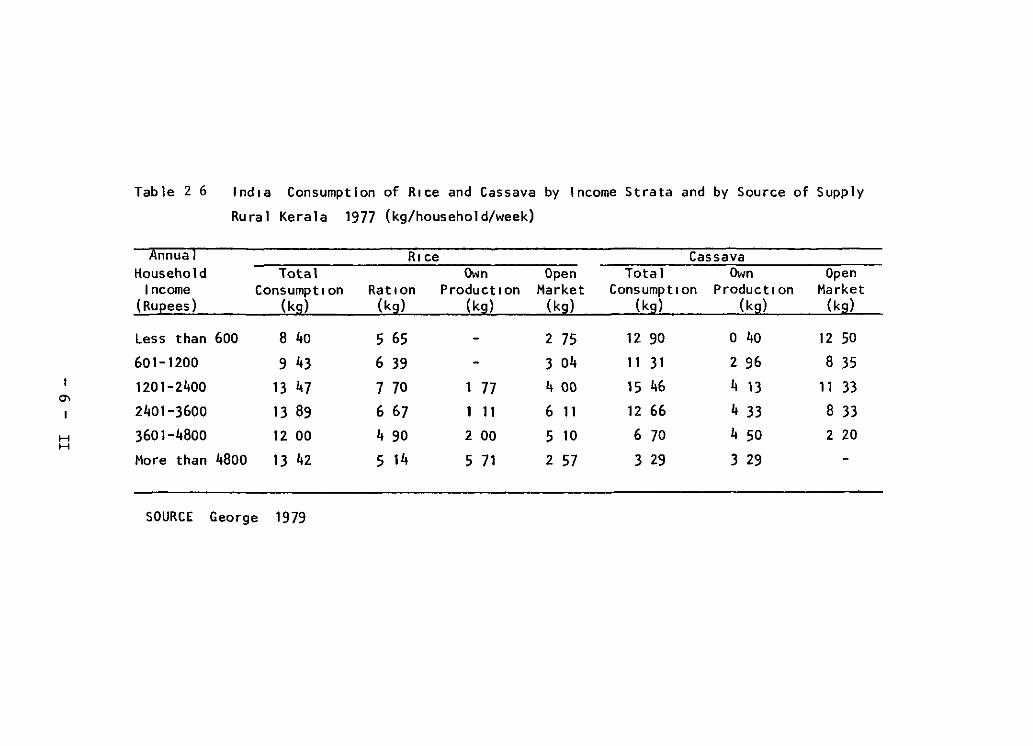
The cassava roots are harvested at about 10 months w1th the bulk of the crop being harvested in the dry period from December to February The percentage of the crop that is sold off the farm 1s open to some question A relatively dated report (Tapioca Market Expansion Board 1972) est1mates that about 40/ of production enters market channels (Table 2 S) This would appear a b1t low considering that cassava 1s such a pervasive consumption item in Kerala that about two-th1rds of households in Kerala do not grow cassava and that household consumption surveys show higher consumption levels for purchased cassava than own production (Table 2 6)
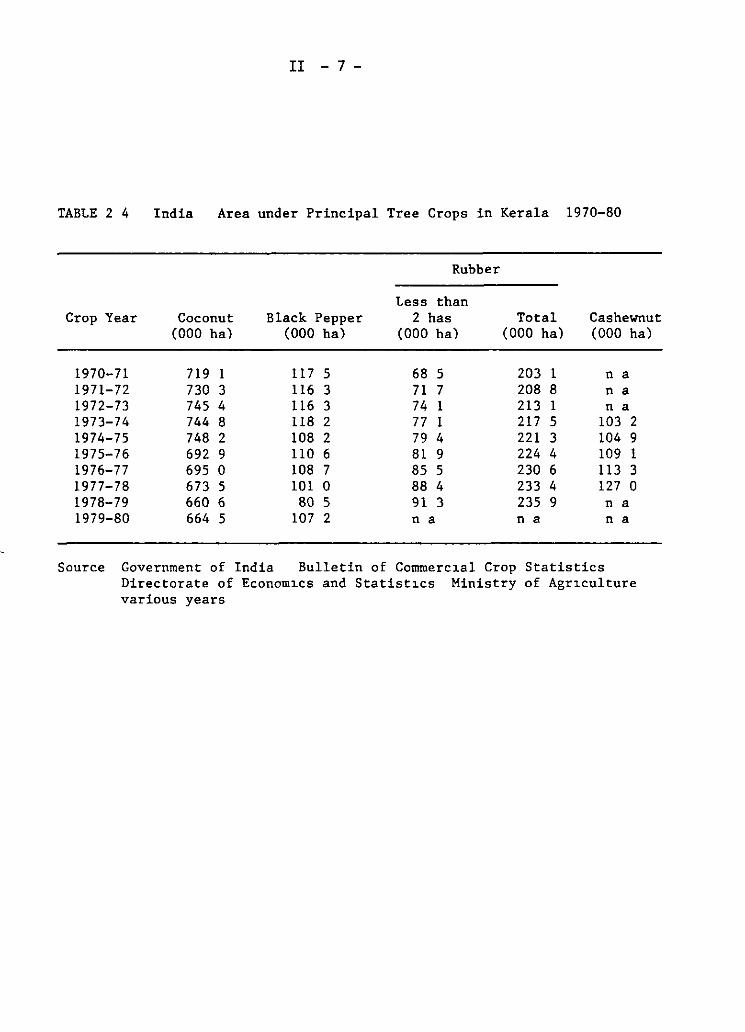
TABLE 2 4
Crop Year
1970-71 1971-72 1972-73 1973-74 1974-75 1975-76 1976-77 1977-78 1978-79 1979-80
II - 7-
India Area under Principal Tree Crops in Kerala 1970-80
Coconut (000 ha)
719 1 730 3 745 4 744 8 748 2 692 9 695 o 673 5 660 6 664 5
Black Pepper (000 ha)
117 5 116 3 116 3 118 2 108 2 110 6 108 7 101 o 80 5
107 2
Rubber
Less than 2 has
(000 ha)
68 5 71 7 74 1 77 1 79 4 81 9 85 5 88 4 91 3 n a
Total (000 ha)
203 1 208 8 213 1 217 5 221 3 224 4 230 6 233 4 235 9 n a
Cashewnut (000 ha)
na na na
103 2 104 9 109 1 113 3 127 o n a na
Source Government of India Bulletin of Commerc1al Crop Statistics Directorate of Econom1cs and Statist1cs Ministry of Agr1culture various years
II - 8-
Table 2 s Ind1a Percent of Farm Product1on Commerc1al1Zed 1n Var1ous D1str1cts of Kerala State 1971
Percent D1stn ct Commerc1allzed
Tr1vandrum 46 8
Qu1lon 32 2
A lleppey 33 9
Kottayam 28 5
Ernakul um 16 9
Tn chur 53 4
Palghat 776
Ma 1 appuram 42 6
Kozh1kode 38 2
Cannonore 23 o
Kera la 39 3
Source Tap1oca Market Expans1on Board 1972
Tab le 2 6 lnd1a Consumptlon of R1ce and Cassava by lncome Strata and by Source of Supply
Ru ra 1 Kera 1 a 1977 (kg/household/week)
Annual R1ce Cassava Household Total Own Open Total Own Open
1 ncome Consumpt1on Rat1on Product1on Market Consumpt1on Productlon Market (Ru[!ees) (k¡¡) (kg) (kg) (k¡¡) (kg) (k¡¡) (kg)
Less than 600 8 40 5 65 - 2 75 12 90 o 40 12 50
601-1200 9 43 6 39 - 3 04 11 31 2 96 8 35 1201-2400 13 47 7 70 177 4 00 15 46 4 13 11 33
a-1 2401-3600 13 89 6 67 1 11 6 11 12 66 4 33 8 33
H 3601-4800 12 00 4 90 2 00 5 10 6 70 4 50 2 20 H
More than 4800 13 42 5 14 5 71 2 57 3 29 3 29
SOURCE George 1979
II - 10 -
The perversity of the latter is due to the positive relation between income and land ownership in Kerala and the shift from cassava to rice at higher incomes 40% is then probably a minimum estimate of marketed surplus of cassava in Kerala
The most common marketing pract~ce is for farmers to sell the standing cassava crop to purchase agents for a lump sum payment The agents do not necessarily harvest straight away but must harvest befare the start of the rains Farmers as well gradually harvest the crop themselves selling in small lots by the roadside or in local markets When marketing of the fresh root is problematic particularly ~n the north of Kerala the roots are peeled sliced and dried as chips during the princ~pal harvest per~od in the dry season Wholesale merchants and weekly markets serve as assembly points for roots and chips
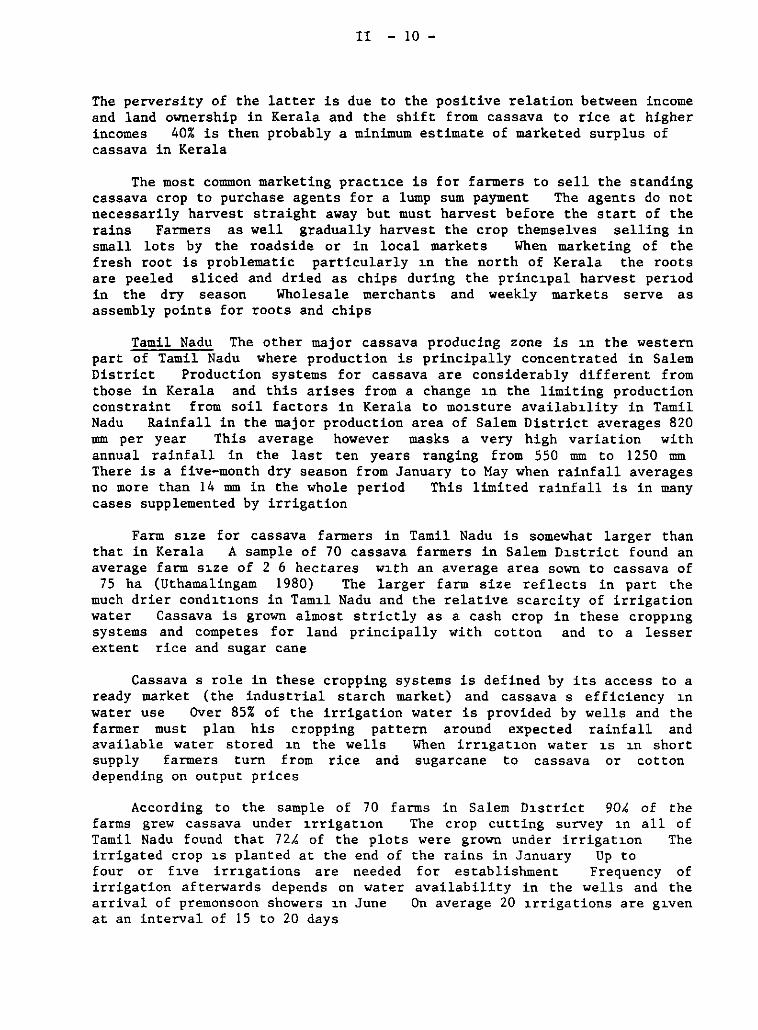
Tamil Nadu The other majar cassava producing zone is ~n the western part of Tamil Nadu where production is principally concentrated in Salem District Production systems for cassava are considerably different from those in Kerala and this arises from a change ~n the limiting production constraint from soil factors in Kerala to mo~sture availab~lity in Tamil Nadu Rainfall in the majar production area of Salem District averages 820 mm per year This average however masks a very high variation with annual rainfall in the last ten years ranging from 550 mm to 1250 mm There is a five-month dry season from January to May when rainfall averages no more than 14 mm in the whole period This limited rainfall is in many cases supplemented by irrigation
Farm s~ze for cassava farmers in Tamil Nadu is somewhat larger than that in Kerala A sample of 70 cassava farmers in Salem D~strict found an average farm s~ze of 2 6 hectares w~th an average area sown to cassava of
75 ha (Uthamalingam 1980) The larger farm size reflects in part the much drier cond~t~ons in Tam~l Nadu and the relative scarcity of irrigation water Cassava is grown almost strictly as a cash crop in these cropp~ng systems and competes for land principally with cotton and to a lesser extent rice and sugar cane
Cassava s role in these cropping systems is defined by its access to a ready market ( the industrial starch market) and cassava s efficiency ~n water use Over 85% of the irrigation water is provided by wells and the farmer must plan bis cropping pattern around expected rainfall and available water stored ~n the wells When irr~gat~on water ~s ~n short supply farmers turn from rice and sugarcane to cassava or cotton depending on output prices
According to the sample of 70 farms in Salem D~strict 90-' of the farms grew cassava under ~rrigat~on The crop cutting survey ~n all of Tamil Nadu found that 72k of the plots were grown under irrigat~on The irrigated crop ~s planted at the end of the rains in Jnnuary Up to four or f~ve irr~gations are needed for establishment Frequency of irrigation afterwards depends on water availability in the wells and the arrival of premonsoon showers ~n June On average 20 ~rrigations are g~ven at an interval of 15 to 20 days
II -11-
The rainfed crop is sown at the start of the southwest monsoon in August The crop is assured of no more than five months of rainfall before the start of the dry season in January which is followed by the pre-monsoon showers 1n June-July A rainfed crop is often grown on as little as 500 DIDI of rainfall The irrigated crop is usually harvested after 8 to 10 months while the rainfed crop requires 12 months before it can be harvested
Land preparation relies on bullocks and for the irrigated crop the land is ploughed four or five times before forming either beds and channels or ridges and furrows Plant populat1on is approximately 10 000/ha Stakes are sown vertically and normally six or seven weedings are done during the course of the crop year
Fertilization or manuring is a coDIDion practice for cassava in Tamil Nadu especially for the irrigated crop The crop-cutting survey found that 74% of the cassava plots were either fertilized or manured using either animal manure or a vegetable compost The farmer survey in Salem found an average application of 18 5 t/ha of farmyard manure or 15 1 t/ha of compost Manuring is often cODJbined with applicat1on of compound fertilizer Moreover cassava is usually planted in rotation with other crops and w1ll often take advantage of residual fert1lity from fert1lizer applicatJ.on on prior crops However where cassava is grown in successive years in the same plot there is a marked tendency for yield to drop A typical trend is 35 t/ha in the first year 24 t/ha 1n the second and 17 t/ha in the third (Tapioca Experiment Station Salem District pr1vate CODIDiunication)
In contrast to Kerala most of the cassava is harvested and marketed by farmers only a small percentage is sold standing 1n the lot In the Salem farm sample 877 of the cassava was marketed directly by farmers The reason for this is the very decentralized nature of the cassava starch processing industry The industry consists of upwards of 500 relatively small-scale plants distributed throughout the district Coordination of harvest1ng by the farmer and processing of the fresh roots at the factory are easily managed without the need of middlemen or large expenditures on transport
Y1elds
By world standards cassava yields in India are high Yields in the 1980-81 crop year averaged 16 8 t/ha in Kerala and 28 9 t/ha in Tam1l Nadu With the generally intens1ve leve! of cultural practices used in Kerala and Tam1l Nadu this high yield l.S not surprising The difference in yields between Kerala and Tamil Nadu is due essentially to the poorer soils in Kerala and the use of 1rrigation and assoc1ated higher 1nput levels 1n Tam1l Nadu
The author is unaware of any farm-level data on d1stribution of cassava y1elds in Kerala and therefore of any est1mates of vield variance across farms in the state The district-level data suggest a sl1ght tendency for yields to be higher 1n the southern and central parts of the state and lower in the north Thus the 1980-81 crop estimates suggest average yields of 15 t/ha in the four southern dl.stricts and of 11 t/ha 1n
II - 12 -
Kozhikode and 12 t/ha in Malappuram suggest little variat1on in yields implication for across farm variation
in the north This limited data across the state but has little
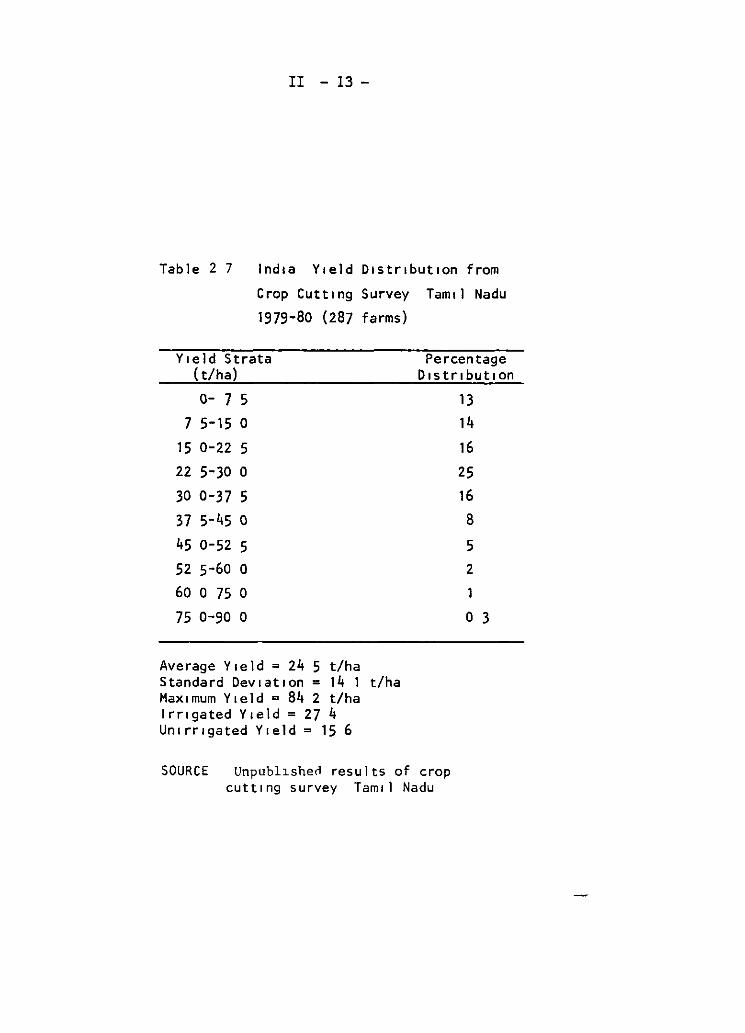
In Tamil Nadu a crop cutting survey in 7 districts in the state found a significant variation in farm-level yields (Table 2 7) The y1eld distribution was skewed toward the lower side of the mean and as well exhibited a very extended upper tail that is a more or less typical distribution for farm-level cassava yields apart from the very h1gh mean Over 15% of the plots had yields of over 37 t/ha with a maximum yield of 84 2 t/ha
Tamil Nadu provides a perfect example of the yield potential of cassava when grown under very favorable production cond1tions Part of the reason why national cassava yields in other parts of Asia never approach such levels is that cassava is usually grown under more marginal agro-climatic conditions Yet even within a highly productive region such as Tamil Nadu over a quarter of the farmers are gett1ng less than 15 t/ha Such typical yield d1stributions lie at the heart of production research what factors explain the difference in yields at the low and high end of the distribution and to what extent are these factors a function of farmer management or a function of more or less uncontrollable b1ological and edapho-climat1c factors facing the farmer' The issue 1s cr1tical to understanding the substantial y1eld gap for cassava between the experiment station and farm level and how closely experimental yields translate 1nto farm-level yields
Costs of product1on and labor utilization
In such densely populated rural areas and in such ~ntens1ve production systems as exist in southern Ind1a the expectation is that relat1ve to other cassava production areas wage rates will be low labor input per hectare wül be h1gh inputs that subst1tute for land will be applied at high levels and labor costs w1ll be a lower portian of total costs The available data suggest per hectare labor inputs of 265 days for 1rr1gated systems in Tamil Nadu 139 days for rainfed systems in Tamil Nadu (Uthamalingam 1980) and 116 days for product1on systems in Kerala (N1nan 1984)
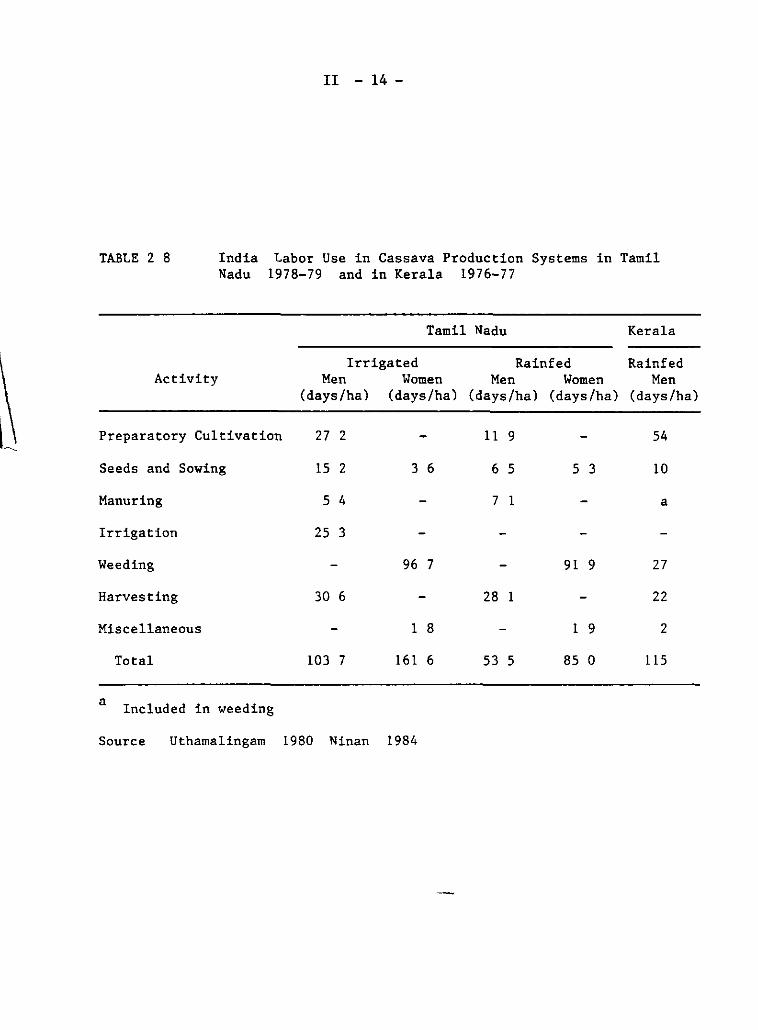
The breakdown of labor activities for Tamil Nadu shows that weeding is the principal labor requirement and makes up 60% of total labor demand with 1nputs in ra1nfed systems requir1ng about half that in 1rrigated systems (Table 2 8) Labor for harvest1ng forms the next maJar component 1n both systems followed by land preparat1on In Kerala on the other hand land preparation is by far the pn.ncipal source of labor demand again reflect1ng the non-use of any sort of alternat1ve power source in prepar1ng the land Labor use for weed1ng 1s far below that employed 1n Tamil Nadu either in irr1gated or ra1nfed systems Thus moisture for weed growth is not a factor 1nfluenc1ng labor input The kPy difference is the use of h1red female labor 1n Tam1l Nadu whereas 1n Kerala espec1ally on farms of less than one hectare most of weeding is done by family labor almost solely men
Labor 1nput in cassava systems in India is lower than that in Indones1a but significantly higher than labor 1nput in Tha1land Malaysia and the Philipp1nes Th1s result is expected given the relat1ve
II - 13 -
Table 2 7 lnd1a Y1eld D1str1bUt1on from
Crop Cutt1ng Survey Tam1l Nadu
1979-80 (287 farms)
Y1eld Strata ( t/ha)
o- 7 5 7 5-15 o
15 0-22 5 22 5-30 o 30 0-37 5 37 S-45 O
45 0-52 5 sz 5-6o o 60 o 75 o 75 0-90 o
Average Y1eld = 24 5 t/ha Standard Dev1at1on = 14 1 t/ha Max1mum Y1eld = 84 2 t/ha lrr1gated Y1eld = 27 4 Un1rr1gated Y1eld = 15 6
Percentage D1str1but•on
13 14 16 25 16 8
5 2 1 o 3
SOURCE Unpubl1shen results of crop cutt1ng survey Tam1 1 Nadu
l~
II - 14-
TABLE 2 8 India Labor Use in Cassava Production Systems in Tamil Nadu 1978-79 and in Kerala 1976-77
Tamil Nadu Kerala
Irrigated Rainfed Rainfed Activity M en Women M en Women Men
(days/hal (days/ha l (days/ha) (days/ha) (days/hal
Preparatory Cultivation 27 2 11 9 54
Seeds and Sowing 15 2 3 6 6 S S 3 10
Manuring S 4 7 1 a
Irrigation 25 3
Weeding 96 7 91 9 27
Harvesting 30 6 28 1 22
Miscellaneous 1 8 1 9 2
Total 103 7 161 6 53 S 85 o 115
a Included in weeding
Source Uthamalingam 1980 Ninan 1984
II - 15 -
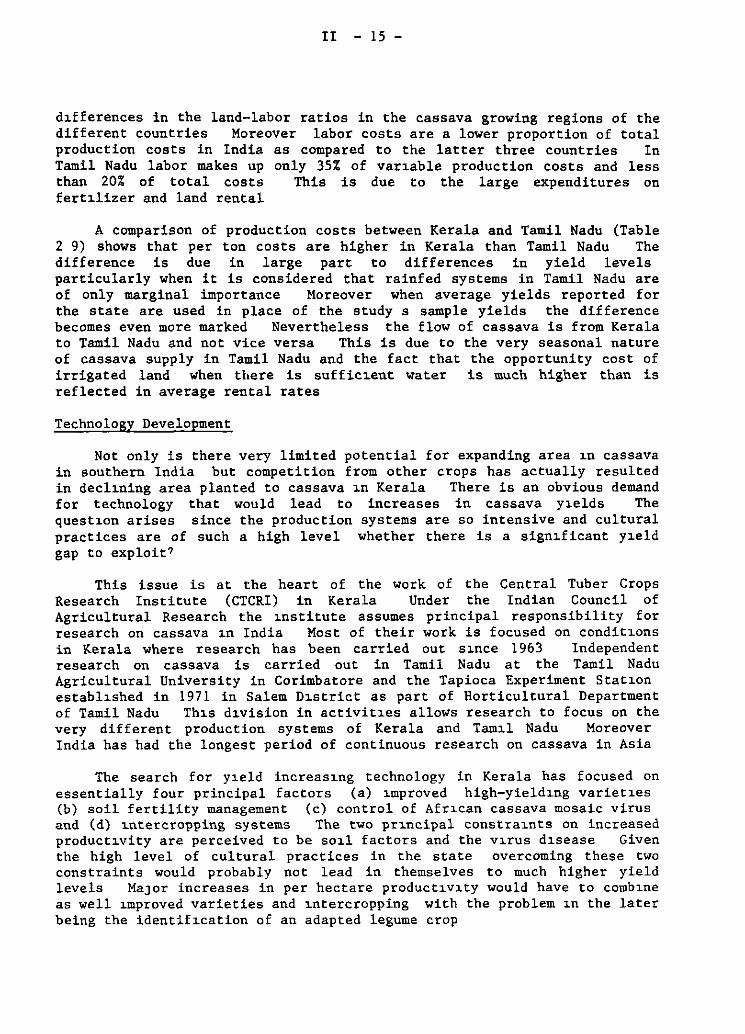
d1fferences in the land-labor ratios in the cassava growing regions of the different countries Moreover labor costs are a lower proportion of total production costs in India as compared to the latter three countries In Tamil Nadu labor makes up only 35% of var1able production costs and less than 20% of total costs This is due to the large expenditures on fert1lizer and land rental
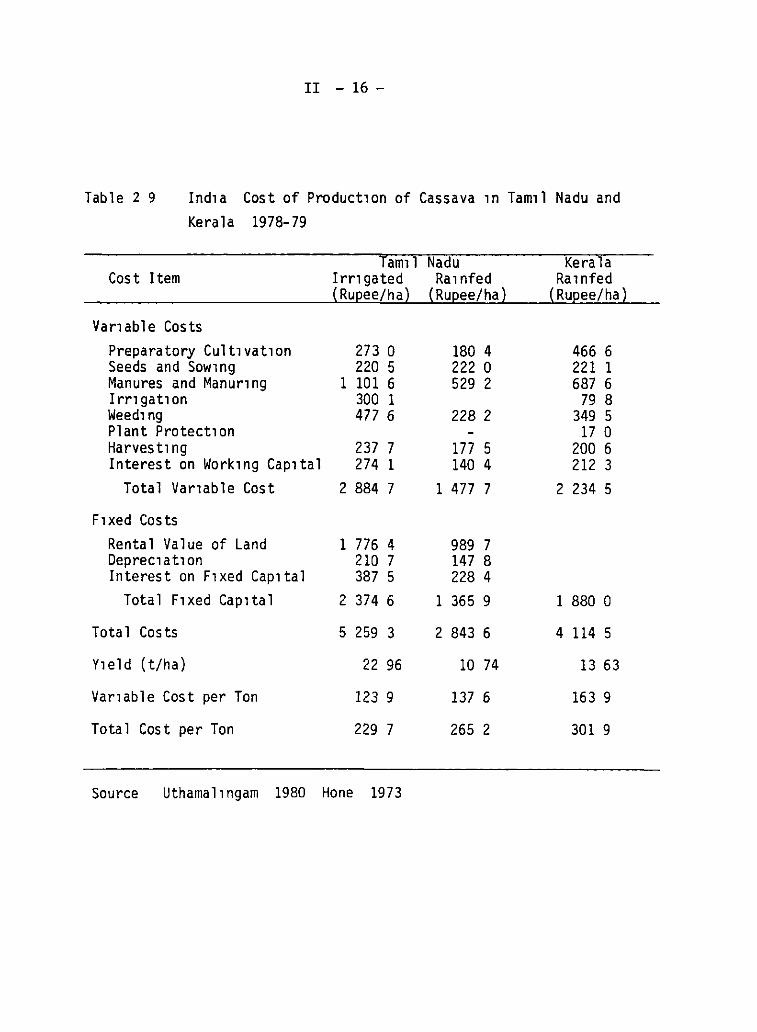
A comparison of production costs between Kerala and Tamil Nadu (Table 2 9) shows that per ton costs are higher in Kerala than Tamil Nadu The difference is due in large part to differences in yield levels particularly when it is considered that rainfed systems in Tamil Nadu are of only marginal importance Moreover when average yields reported for the state are used in place of the study s sample yields the difference becomes even more marked Nevertheless the flow of cassava is from Kerala to Tamil Nadu and not vice versa This is due to the very seasonal nature of cassava supply in Tamil Nadu and the fact that the opportunity cost of irrigated land when there is suffic1ent water is much higher than is reflected in average renta! rates
Technology Development
Not only is there very limited potencial for expanding area 1n cassava in southern India but competition from other crops has actually resulted in decl1ning area planted to cassava 1n Kerala There is an obvious demand for technology that would lead to increases in cassava y1elds The quest1on arises since the production systems are so intensive and cultural practices are of such a high level whether there is a sign1ficant y1eld gap to exploit?
This issue is at the heart of the work of the Central Tuber Crops Research Institute (CTCRI) in Kerala Under the Indian Council of Agricultura! Research the 1nstitute assumes principal responsibility for research on cassava 1n India Most of their work is focused on condit1ons in Kerala where research has been carried out s1nce 1963 Independent research on cassava is carried out in Tamil Nadu at the Tamil Nadu Agricultura! University in Corimbatore and the Tapioca Experiment Stat1on establ1shed in 1971 in Salem D1strict as part of Horticultura! Department of Tamil Nadu Th1s d1vision in activit1es allows research to focus on the very different production systems of Kerala and Tam1l Nadu Moreover India has had the longest period of continuous research on cassava in Asia
The search for y1eld increas1ng technology in Kerala has focused on essentially four principal factors (a) 1mproved high-yield1ng variet1es (b) soil fertility management (e) control of Afr1can cassava mosaic virus and (d) 1ntercropping systems The two pr1ncipal constra1nts on increased product1vity are perceived to be so1l factors and the v1rus d1sease Given the high level of cultural practices in the state overcoming these two constraints would probably not lead in themselves to much higher yield levels MaJor increases in per hectare product1v1ty would have to comb1ne as well 1mproved varieties and 1ntercropping with the problem 1n the later being the identif1cation of an adapted legume crop
II - 16 -
Table 2 9 Ind1a Cost of Product1on of Cassava 1n Tam1l Nadu and Kerala 1978-79
Cost Item
Vanable Costs Preparatory Cult1vat1on Seeds and Sow1ng Manures and Manur1ng I rn gat1 on Weed1 ng Plant Protect1on Harvest1ng Interest on Work1ng Cap1tal
Total Var1able Cost
F1xed Costs Rental Value of Land Deprec1at1on Interest on F1xed Cap1tal
Total F1xed Cap1tal
Total Costs
Y1eld (t/ha)
Var1able Cost per Ton
Total Cost per Ton
Tam1l Irn gated ( Rupee/ha)
273 o 220 5
1 101 6 300 1 477 6
237 7 274 1
2 884 7
1 776 4 210 7 387 5
2 374 6
5 259 3
22 96
123 9
229 7
Source Uthamal1ngam 1980 Hone 1973
Nadu Ra1nfed
(Rupee/ha)
180 4 222 o 529 2
228 2
177 5 140 4
1 477 7
989 7 147 8 228 4
1 365 9
2 843 6
10 74
137 6
265 2
Kera la Ra 1 nfed
(Rupee/ha)
466 6 221 1 687 6
79 8 349 5
17 o 200 6 212 3
2 234 5
1 880 o
4 114 5
13 63
163 9
301 9
ll -17-
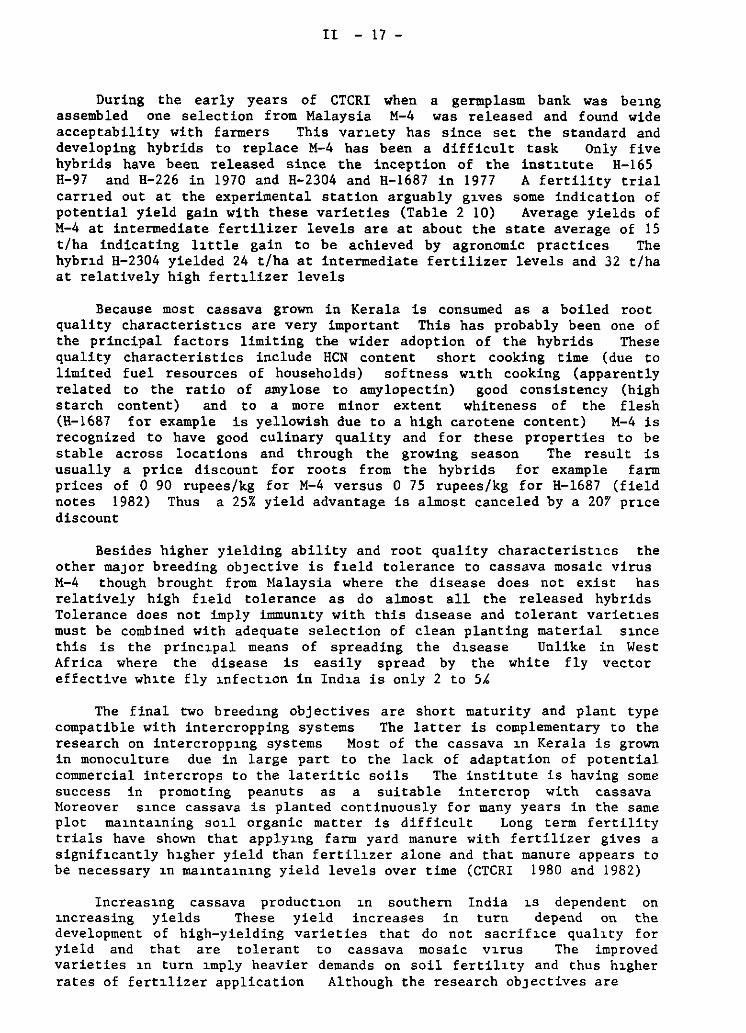
During the early years of CTCRI when a germplasm bank was beJ.ng assembled one selection from Malaysia M-4 was released and found wide acceptability with farmers This varJ.ety has since set the standard and developing hybrids to replace M-4 has been a difficult task Only Uve hybrids have been released since the inception of the instJ.tute H-165 H-97 and H-226 in 1970 and H-2304 and H-1687 in 1977 A fertility trial carrJ.ed out at the experimental station arguably gJ.ves sorne indication of potential yield gain with these varieties (Table 2 10) Average yields of M-4 at intermediate fertilizer levels are at about the state average of 15 t/ha indicating ll.ttle gain to be achieved by agronomic practices The hybrJ.d H-2304 yielded 24 t/ha at intermediate fertilizer levels and 32 t/ha at relatively high fertJ.lizer levels
Because most cassava grown in Kerala is consumed as a boiled root quality characteristJ.cs are very important This has probably been one of the principal factors limiting the wider adoption of the hybrids These quality characteristics include HCN content short cooking time (due to limited fuel resources of households) softness wl.th cooking (apparently related to the ratio of amylose to amylopectin) good consistency (high starch content) and to a more minor extent whiteness of the flesh (H-1687 for example is yellowish due to a high carotene content) M-4 is recognized to have good culinary quality and for these properties to be stable across locations and through the growing season The result is usually a price discount for roots from the hybrids for example farm prices of O 90 rupees/kg for M-4 versus O 75 rupees/kg for H-1687 (field notes 1982) Thus a 25% yield advantage is almost canceled by a 207 prJ.ce discount
Besides higher yielding ability and root quality characteristJ.cs the other maJar breeding obJective is fJ.eld tolerance to cassava mosaic virus M-4 though brought from Malaysia where the disease does not exist has relatively high f1eld tolerance as do almost all the released hybrids Tolerance does not imply immunJ.ty with this dJ.sease and tolerant varietJ.es must be combined with adequate selection of clean planting material sJ.nce this is the princJ.pal means of spreading the dJ.sease Unlike in West Africa where the disease is easily spread by the white fly vector effective whJ.te fly J.nfectJ.on in IndJ.a is only 2 to 5k
The final two breedJ.ng obj ectives are short maturity and plant type compatible with intercropping systems The latter is complementary to the research on intercroppl.ng systems Most of the cassava J.n Kerala is grown in monoculture due in large part to the lack of adaptation of potential commercial intercrops to the lateritic soils The institute is having sorne success in promoting peanuts as a suitable intercrop with cassava Moreover sJ.nce cassava is planted continuously for many years in the same plot maJ.ntaJ.ning soJ.l organic matter is difficult Long term fertility trials have shown that applyl.ng farm yard manure with fertilizer gives a signifJ.cantly hJ.gher yield than fertilJ.zer alone and that manure appears to be necessary J.n maJ.ntaJ.nl.ng yield levels over time (CTCRI 1980 and 1982)
IncreasJ.ng cassava productJ.on J.n southern India l.S dependent on J.ncreasing yields These yield increases in turn depend on the development of high-yielding varieties that do not sacrifJ.ce qualJ.ty for yield and that are tolerant to cassava mosaic vJ.rus The improved varieties J.n turn l.mply heavier demands on soil fertill.ty and thus hJ.gher rates of fertJ.lizer application Although the research obJectives are
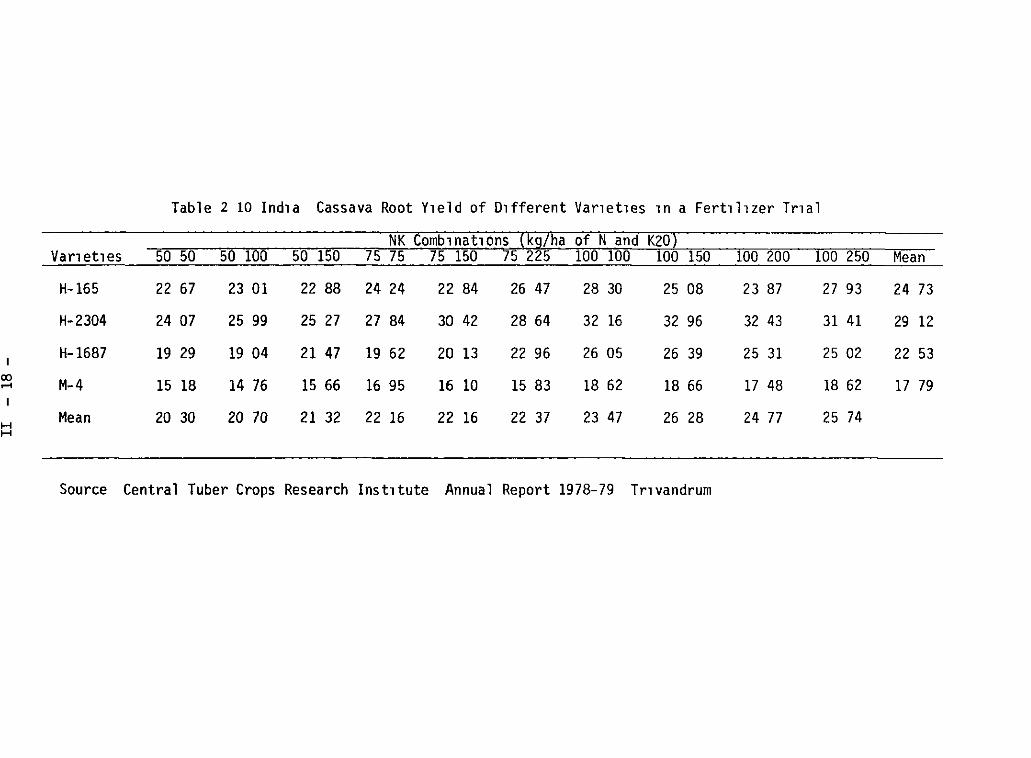
Table 2 10 Ind1a Cassava Root Y1eld of D1fferent Var1et1es 1n a Fert1l1zer Tr1al
NK Comb1nat10ns (kg7ha of N and K20) Vanet1es --sa-50- 50 100 50 150 75 75 75 150 75 225 100 100 100 150 lOO 200 lOO 250 Mean
H-165 22 67 23 01 22 88 24 24 22 84 26 47 28 30 25 08 23 87 27 93 24 73
H-2304 24 07 25 99 25 27 27 84 30 42 28 64 32 16 32 96 32 43 31 41 29 12
H-1687 19 29 19 04 21 47 19 62 20 13 22 96 26 05 26 39 25 31 25 02 22 53 1
00 M-4 15 18 14 76 15 66 16 95 16 10 15 83 18 62 18 66 17 48 18 62 17 79 ,....,
H Mean 20 30 20 70 21 32 22 16 22 16 22 37 23 47 26 28 24 77 25 74
H
Source Central Tuber Crops Research Inst1tute Annual Report 1978-79 Tr1vandrum
II - 19 -
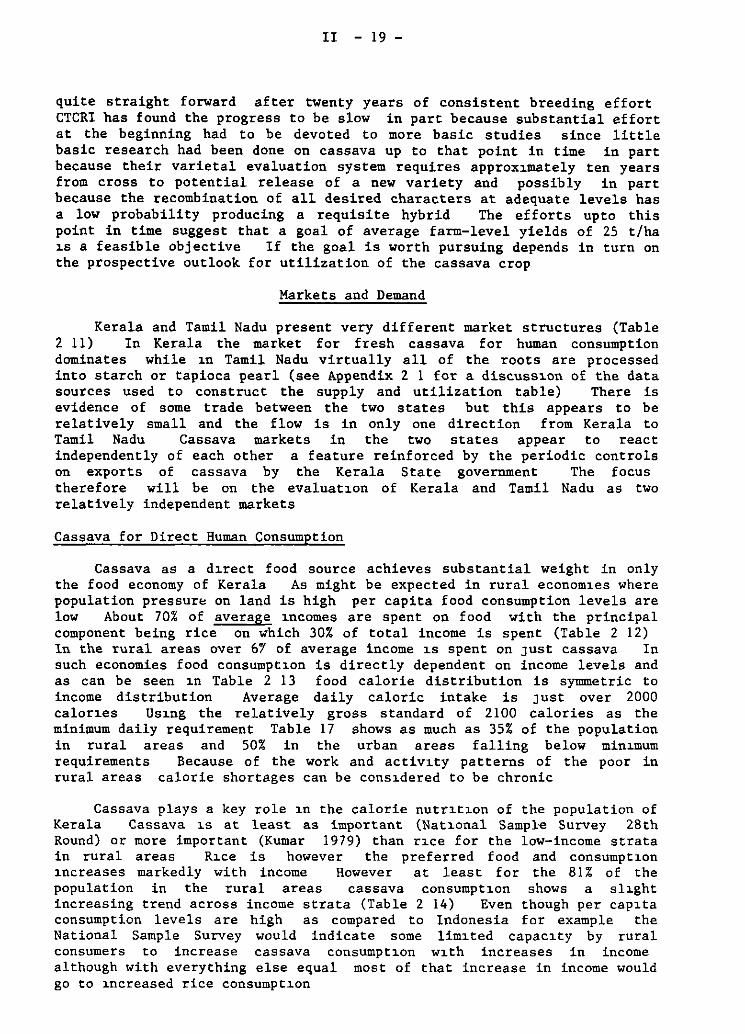
quite straight forward after twenty years of consistent breeding effort CTCRI has found the progresa to be slow in part because substantial effort at the beginning had to be devoted to more basic studies since little basic research had been done on cassava up to that point in time in part because their varietal evaluation system requires approx1mately ten years from cross to potential release of a new variety and possibly in part because the recombination of all desired characters at adequate levels has a low probability producing a requisite hybrid The efforts upto this point in time suggest that a goal of average farm-level yields of 25 t/ha 1s a feasible objective If the goal is worth pursuing depends in turn on the prospective outlook for utilization of the cassava crop
Markets and Demand
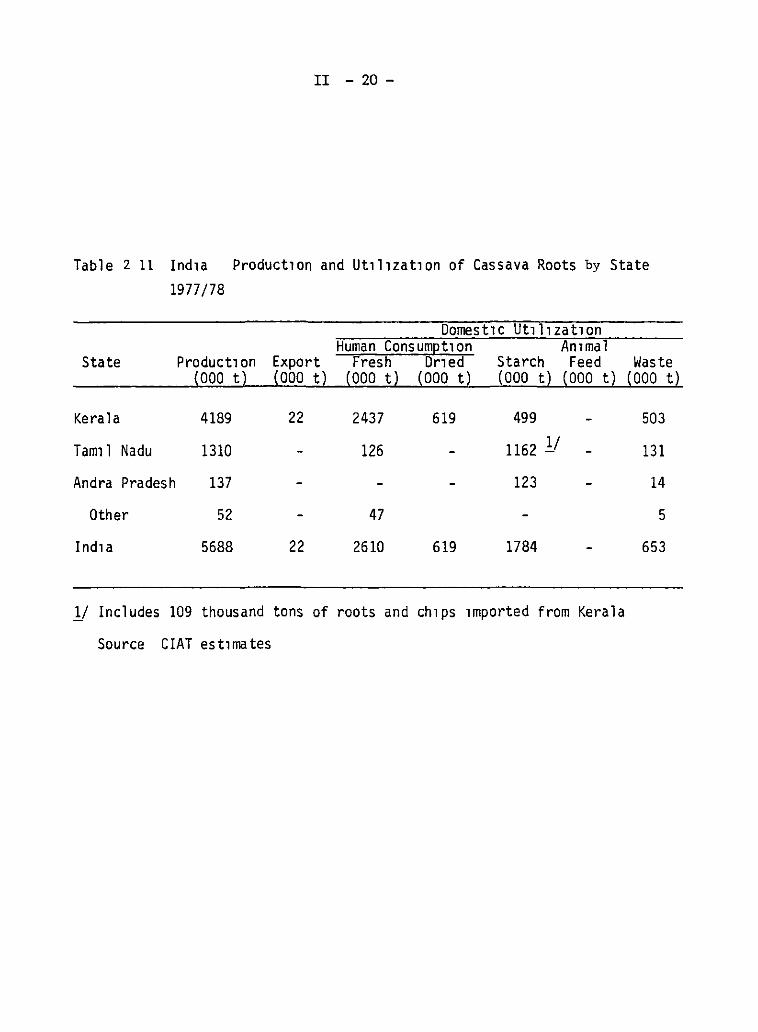
Kerala and Tamil Nadu present very different market structures (Table 2 11) In Kerala the market for fresh cassava for human consumption dominates while l.n Tamil Nadu virtually all of the roots are processed into starch or tapioca pearl (see Appendix 2 1 for a discuss1.on of the data sources used to construct the supply and utilization table) There is evidence of some trade between the two states but this appears to be relatively small and the flow is in only one direction from Kerala to Tamil Nadu Cassava markets in the two states appear to react independently of each other a feature reinforced by the periodic controls on exports of cassava by the Kerala State government The focus therefore will be on the evaluatJ.on of Kerala and Tamil Nadu as two relatively independent markets
Cassava for Direct Human Consumption
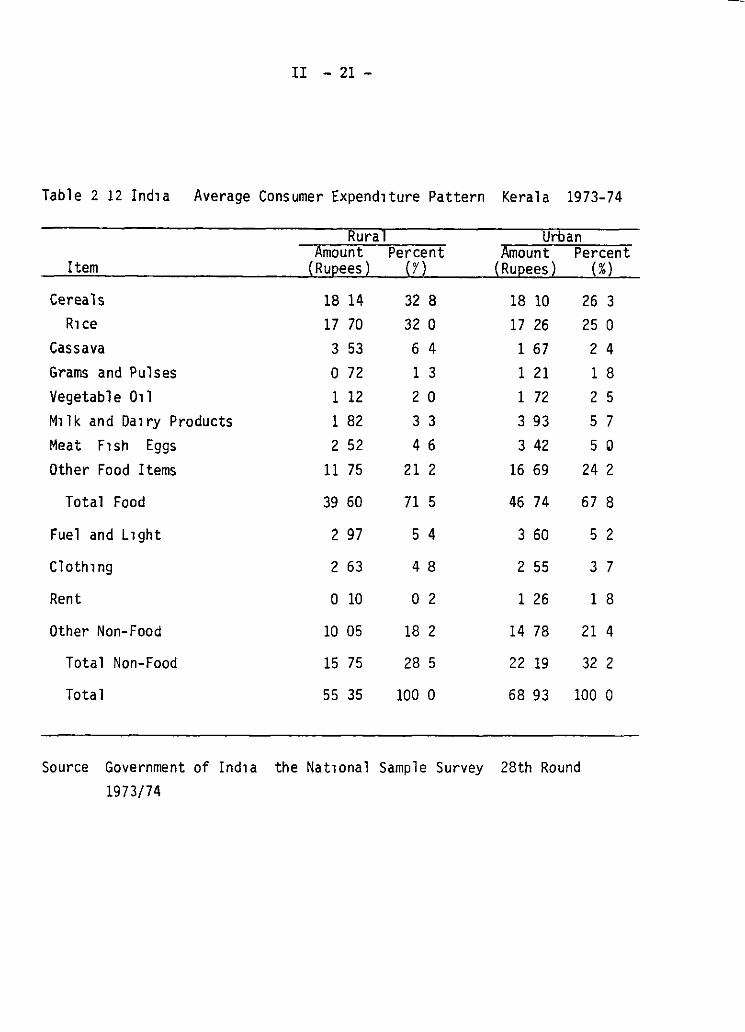
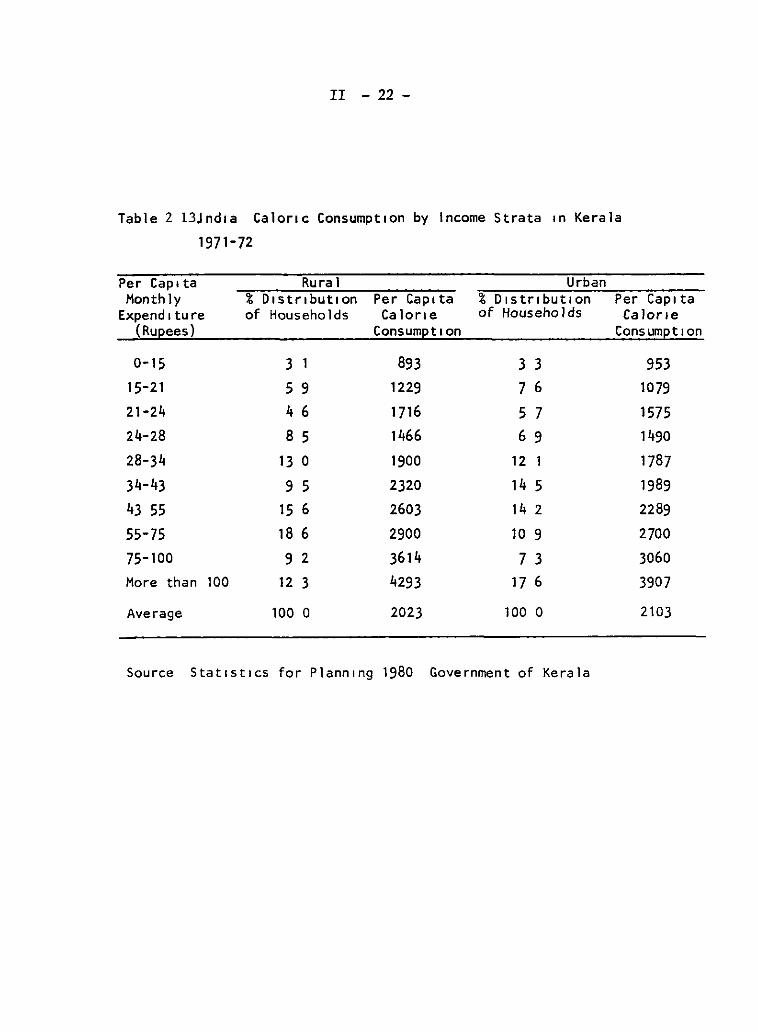
Cassava as a d1.rect food source achieves substantial weight in only the food economy of Kerala As might be expected in rural econom1.es where population pressur~ on land is high per capita food consumption levels are low About 70% of average l.ncomes are spent on food with the principal component being rice on which 30% of total income is spent (Table 2 12) In the rural areas over 6Y of average income l.S spent on JUSt cassava In such economies food consumpt1.on is directly dependent on income levels and as can be seen l.n Table 2 13 food calorie distribution is symmetric to income distribution Average daily caloric intake is JUSt over 2000 calor1.es Us1.ng the relatively gross standard of 2100 calories as the minimum daily requirement Table 17 shows as much as 35% of the population in rural areas and SO% in the urban areas falling below min1.mum requirements Because of the work and activJ.ty patterns of the poor in rural areas calorie shortages can be cons1.dered to be chronic
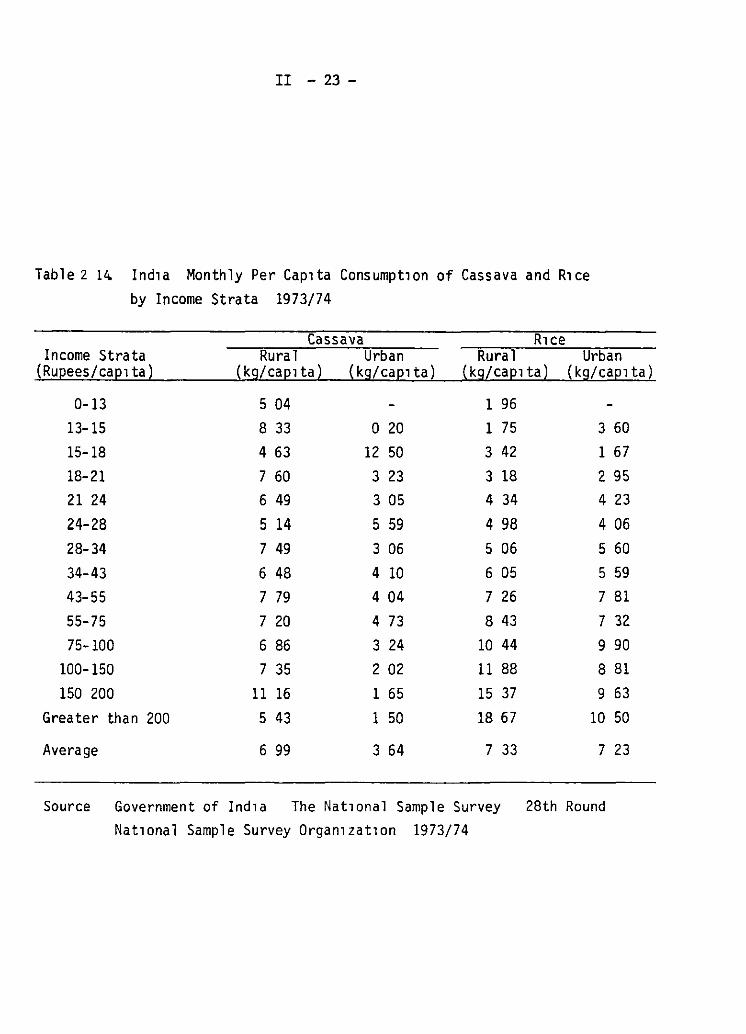
Cassava plays a key role l.n the calorie nutrl.tl.on of the population of Kerala Cassava l.s at least as important (Nat1onal Sampl€ Survey 28th Round) or more important (Kumar 1979) than r1.ce for the low-income strata in rural areas R1.ce is however the preferred food and consumptl.on l.ncreases markedly with income However at least for the 81% of the population in the rural areas cassava consumptl.on shows a sl1.ght increasing trend across income strata (Table 2 14) Even though per cap1.ta consumption levels are high as compared to Indonesia for example the National Sample Survey would indicate some lim1.ted capac1.ty by rural consumers to increase cassava consumpt1on w1th increases in income although with everything else equal most of that increase in income would go to 1.ncreased rice consumptl.on
II - 20 -
Table 2 11 Ind1a Product1on and Ut1l1zat1on of Cassava Roots by State
1977/78
Domest1c Ut1l1zat1on Human Consum~t1on Ammal
S tate Product1on Export Fresh Dned Starch Feed (000 t) (000 t) (000 t) (000 t) ( 000 t) ( 000 t)
Kera 1 a 4189 22 2437 619 499
Tam1l Nadu 1310 126 1162 y
Andra Pradesh 137 123
Other 52 47
Ind1a 5688 22 2610 619 1784
1J Includes 109 thousand tons of roots and ch1ps 1mported from Kerala
Source CIAT est1mates
Waste ( 000 t)
503
131
14
5
653
II - 21 -
Table 2 12 Ind1a Average Consumer Expend1ture Pattern
Item
Cereals R1ce
Cassava Grams and Pulses Vegetab 1 e 011 M1l k and Da1 ry Products Meat F1sh Eggs Other Food Items
Total Food
Fue 1 and L1 ght
Cloth1ng
Rent
Other Non-Food
Total Non-Food
Total
Rural Amount Percent
(Rupees) (r}
18 14 17 70 3 53 072
1 12 1 82 2 52
11 75
39 60
2 97
2 63
o 10
10 05
15 75
55 35
32 8
32 o 6 4
1 3
2 o 3 3
4 6
21 2
71 5
5 4
4 8
o 2
18 2
28 5
100 o
Kerala 1973-74
Urban Amount Percent
(Rupees) {%)
18 10 26 3 17 26 25 o 1 67 2 4
1 21 1 8
1 72 2 5
3 93 5 7 3 42 5 o
16 69 24 2
46 74 67 8
3 60 5 2
2 55 3 7
1 26 1 8
14 78 21 4
22 19 32 2
68 93 100 o
Source Government of Ind1a the Nat1onal Sample Survey 28th Round 1973/74
II - 22 -
Table 2 13Jndla Calor1c Consumpt1on by lncome Strata 1n Kerala
1971-72
Per Cap 1 ta Monthly
Expend1ture (Rupees)
0-15 15-21
21-24
24-28
28-34
34-43
43 55
55-75 75-100 More than 100
Average
Rura 1 % D1stnbut1on of Households
3 1
5 9 4 6
8 5
13 o 9 5
15 6
18 6
9 2 12 3
100 o
Per Cap1ta Calor1e
Consumpt 1 on
893 1229
1716 1466
1900
2320 2603
2900
3614
4293
2023
Urban % D1stnbut1on of Househo l ds
3 3
7 6
5 7
6 9
12 1
14 5
14 2
10 9
7 3
17 6
100 o
Source StatiStlcs for Plann1ng 1980 Government of Kerala
Per Cap1 ta Ca lon e
Consumpt1on
953 1079
1575 1490
1787 1989 2289
2700 3060
3907
2103
II - 23 -
Tablez 14. Ind1a Monthly Per Cap1ta Consumpt1on of Cassava and R1ce by Income Strata 1973/74
Cassava R1ce Income Strata Rural Urban Rural Urban
(Rupees/capl ta) (kg/cap1ta) (k g/ caplta) (kg/capl ta) ( kg/capl ta)
0-13 S 04 1 96
13-15 8 33 o 20 1 75 3 60
15-18 4 63 12 so 3 42 1 67
18-21 7 60 3 23 3 18 2 95 21 24 6 49 3 os 4 34 4 23
24-28 5 14 5 59 4 98 4 06
28-34 7 49 3 06 5 06 5 60
34-43 6 48 4 10 6 05 S 59
43-55 7 79 4 04 7 26 7 81
55-75 7 20 4 73 8 43 7 32
75-100 6 86 3 24 10 44 9 90 100-150 7 35 2 02 11 88 8 81
150 200 11 16 1 65 15 37 9 63
Greater than 200 S 43 1 so 18 67 10 so
Average 6 99 3 64 7 33 7 23
Source Government of Ind1a The Nat1onal Sample Survey 28th Round Nat1onal Sample Survey Organ1zat1on 1973/74
II - 24 -
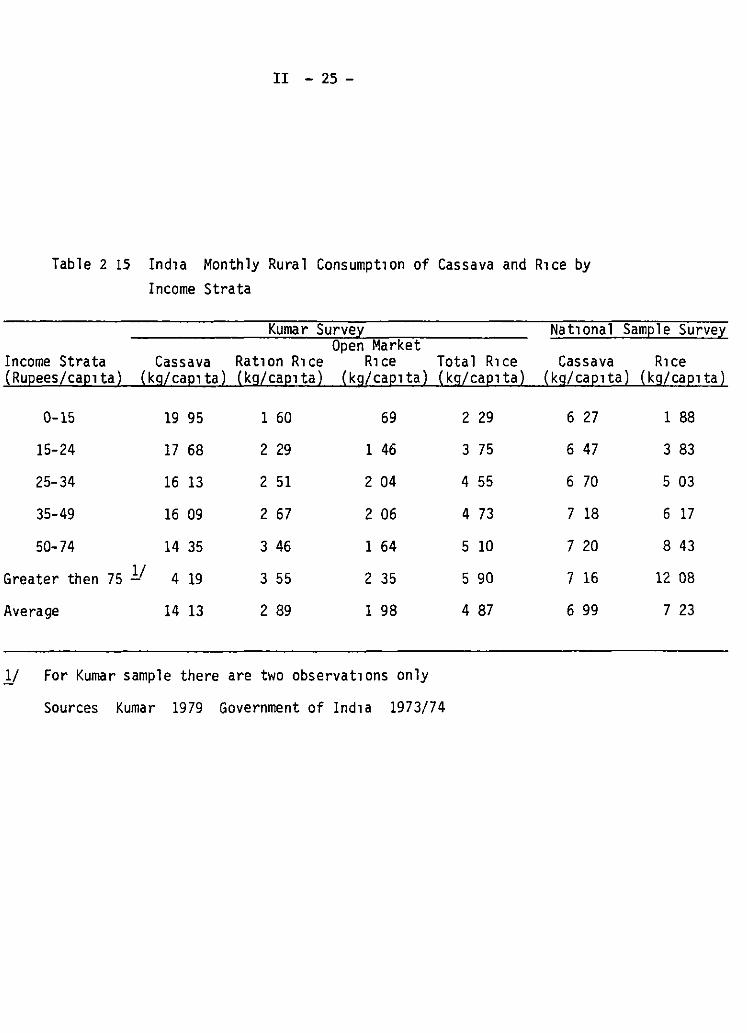
Because of the limited incomes in Kerala a low-cost-per-calorie food such as cassava playa a principal role as a supplement to the higher cost r1ce A principal issue 1s whether promoting techn1cal change in cassava production and the resultant lower prices will lead to bridgmg the calorie deficit In the majar cassava producing district of Trivandrum cassava prices tend to be substantially lower and rice prices h1gher than in other districts The survey of Kumar in Trivandrum suggests that cassava consumption levels are substantially h1gher and rice consumpt1on slightly lower than the average for Kerala (Table 2 15) However for the poorer income strata total calorie consumption is substantially higher than for the state average for this stratum In areas such as the survey area where average annual consumpt1on reaches 172 kg there is probably not much potencial for further increases in cassava consumpt1on but changing the rice-cassava price relationship in other parts of Kerala would on the basis of this very limited comparison lead to increases in cassava consumption and increased calorie consumption
Shah (undated) has argued that attempts to increase the production of low cost h1gh calorie foods with a view to bridging the calorie gap by themselves may prove inadequate because preferences for food qualities other than just calories bias consumption even 1n the low income groups to more costly foods Food consumption patterns across income groups as described above would indeed confirm that food quality is important but as well that for the poor where pr1ce differences are sufficiently large cassava can constitute up to two thirds of total calor1e intake that 1s the poor are very responsive to changes in relative prices of substitutes
The central government has in part incorporated the quality argument 1n its system of public food distribution The foodgrain distribut1on system has played a majar role in the food economy of Kerala since 1964 when food shortages in India led to food zoning and curtailment of private 1nterstate trade The system dependa on a comprehensive system of ration or fa1r pr1ce shops at which consumera are given quotas for foodgrains and prices are set well below open market prices However consumption requirements are well above the ration quota and consumera must purchase their addit1onal requirements from the open market
The availability of ration rice has a marked influence on rice and cassava consumption patterns A study by George (1979) found that consumption of ration rice was relatively constant across income strata (Table 2 6) although th1s f1nding 1s based on household 1ncome Kumar (1979) found that ration rice consumption increased with income when expressed on a per capita basis However whereas the higher 1ncome strata were able to complement this allotment with rice from open market purchases and at the h1ghest income levels from own production the lower income strata supplemented the ration rice with very high levels of cassava consumption most of which was purchased (George 1979) Nutrition of the poor thus depended principally on ration rice allotments and cassava purchases as was also found by Kumar
Wheat found that their rice
is also available through the ration shops but George (1979) rural households consumed only a small quantity of wheat When
quota was exhausted consumers preferred to purchase cassava
II - 25 -
Table 2 15 Ind1a Monthly Rural Consumpt1on of Cassava and R1ce by Income Strata
Kumar Surve1 Open Market
Income Strata Cassava Rat1on R1ce R1ce Total R1ce (Rupees/caplta) (k g/ cap1 ta) (k g/ cap1 ta) (kg/caplta) (kg/caplta)
0-15 19 95 1 60 69
15-24 17 68 2 29 1 46
25-34 16 13 2 51 2 04
35-49 16 09 2 67 2 06
50-74 14 35 3 46 1 64
Greater then 75 1.! 4 19 3 55 2 35
Average 14 13 2 89 1 98
1J For Kumar sample there are two observat1ons only
Sources Kumar 1979 Government of Ind1a 1973/74
2 29
3 75
4 55
4 73
5 10
5 90
4 87
Nat1onal Sample Survey
Cassava R1ce (kg/cap1ta) (k g/ cap1 ta)
6 27 1 88
6 47 3 83
6 70 5 03
7 18 6 17
7 20 8 43
7 16 12 08
6 99 7 23
II - 26 -
from the open market than wheat from the ration shops Wheat purchases from the ration shops accounted for only about one-third of the total wheat allotment for the total sample and were the lowest in the low income household (p 33)
Given the preference for rice a principal determinant of the demand for cassava w1ll be ration rice allotments The firs~ factor to consider is whether ration rice consumption is influenced by demand factors Two studies (George 1979 and Kumar 1979) conclude that ration r1ce consumption is not influenced by demand factors but purely by supplies available that is all that is available would be consumed
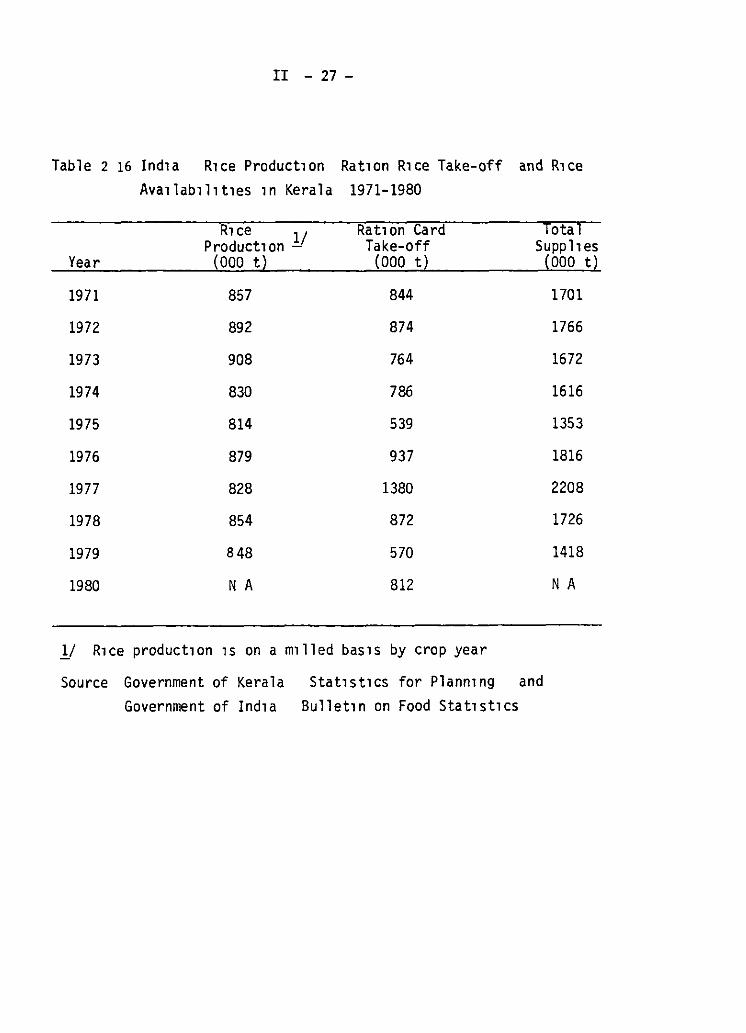
As levy procurement of r1ce within Kerala dropped to negligible levels the ration system in Kerala carne to rely almost completely on allotments from the Central Pool of the Food Corporation of India (FCI) Moreover these allotments now account for over half of rice supplies in Kerala (Table 2 16) and whereas such allotments should introduce a certa1n stability in r1ce supplies they are in fact the maJar cause of variability in rice availability in the state The author knows of no study which analyzes the determinants of state allocation of ration rice by the FCI but obviously there are other criteria than JUSt maintenance of per capita consumption levels over time There is l1ttle choice but that cassava will continue to be a principal component of a food strategy 1n Kerala and in particular cassava can be used to provide a certa1n flexibility in the operation of the food ration system in the state
The dr1ed chip market
A peeled dry chip similar to gaplek in Indonesia is produced 1n Kerala The market principally provides an alternative outlet for cassava during the pr1ncipal harvest period from December to April which coincides with the dry season The chips are principally produced and assembled in the northern districts with Calicut Trichur and Changanachery being the principal assembly centers
Data on the markets for cassava chips are v1rtually non-existent What can be sa1d is that th1s market is not as large nor as well-integrated as the gaplek market 1n Indonesia Most consumera 1n Kerala have relatively direct access to fresh roots and most f1eld observations would suggest a consumer preference for fresh over dried cassava The one and relat1vely dated source (Tapioca Market Expansion Board 1972) on processed cassava consumption suggests very l1m1ted consumption levels with an average annual per capita consumption of 9 5 kg of dried product lnd1cations are that the dried chip market for human consumption w1ll remain very l1m1ted
As is apparent in Indonesia a well funct1oning dr1ed ch1p market provides an element of pr1ce stabil1ty to the fresh root market especially where the maJar portian of plant1ng and harvesting takes place at relat1vely restr1cted times of year The chip market acts as a storage mechanism for cassava during the low season and provides a price floor during the peak harvest period In Kerala the other maJar market for cassava chips is for processing into starch and glucose especially glucose Fresh roots produce a h1gher qual1ty starch (Meuser et al 1978) but chips are used in the starch industry 1n Kerala because they are
II - 27 -
Table 2 16 Ind1a R1ce Preduct1en Rat1en R1ce Take-eff and R1 ce Ava1lab1l1t1es 1 n Kera 1 a 1971-1980
R1 ce 1 Rat1 en Card Teta 1 Preduct1en _j Take-eff Supp 11 es
Year (000 t) (000 t) (000 t)
1971 857 844 1701
1972 892 874 1766
1973 908 764 1672
1974 830 786 1616
1975 814 539 1353
1976 879 937 1816
1977 828 1380 2208
1978 854 872 1726
1979 848 570 1418
1980 N A 812 N A
1) R1ce preduct1en 1s en a m1lled bas1s by crep year
Seurce Gevernment ef Kerala Gevernment ef Ind1a
Stat1st1cs fer Plann1ng and Bullet1n en Feed Stat1st1cs
II - 28 -
cheaper en a starch basis and help te maintain operation outside the peak harvest season However if roots were available at the price and quantity desired the starch industry would operate exclusively en roots Th~s
particular outlet then does not provide a certain demand en which te develop an expansive dried ch1p market
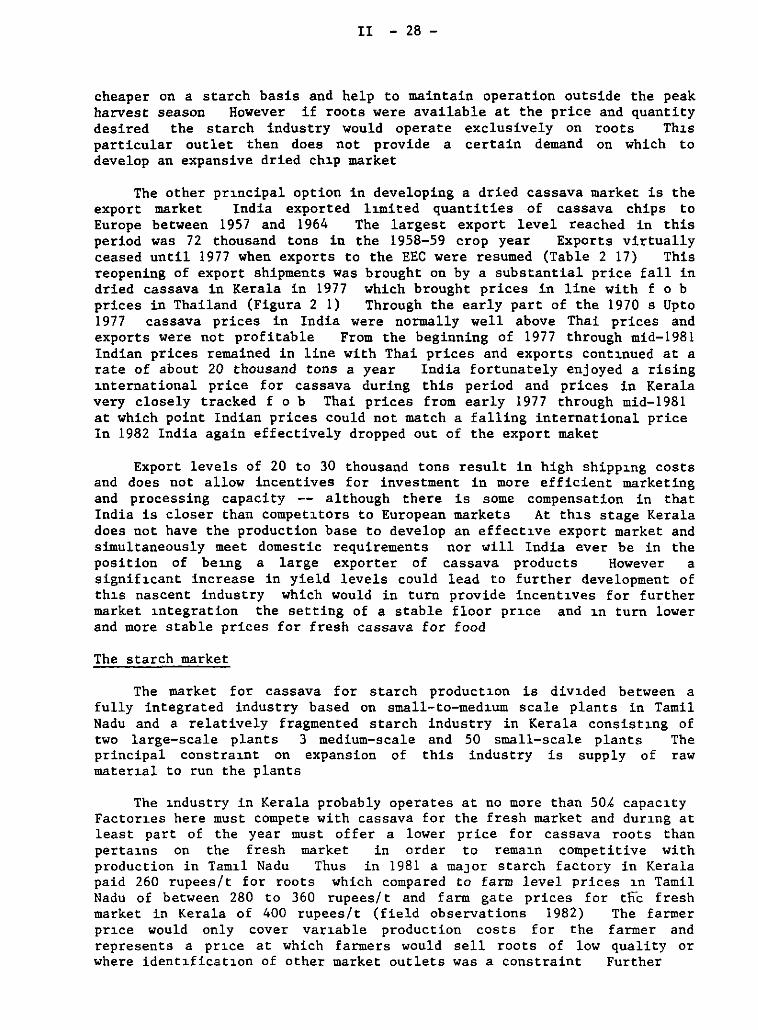
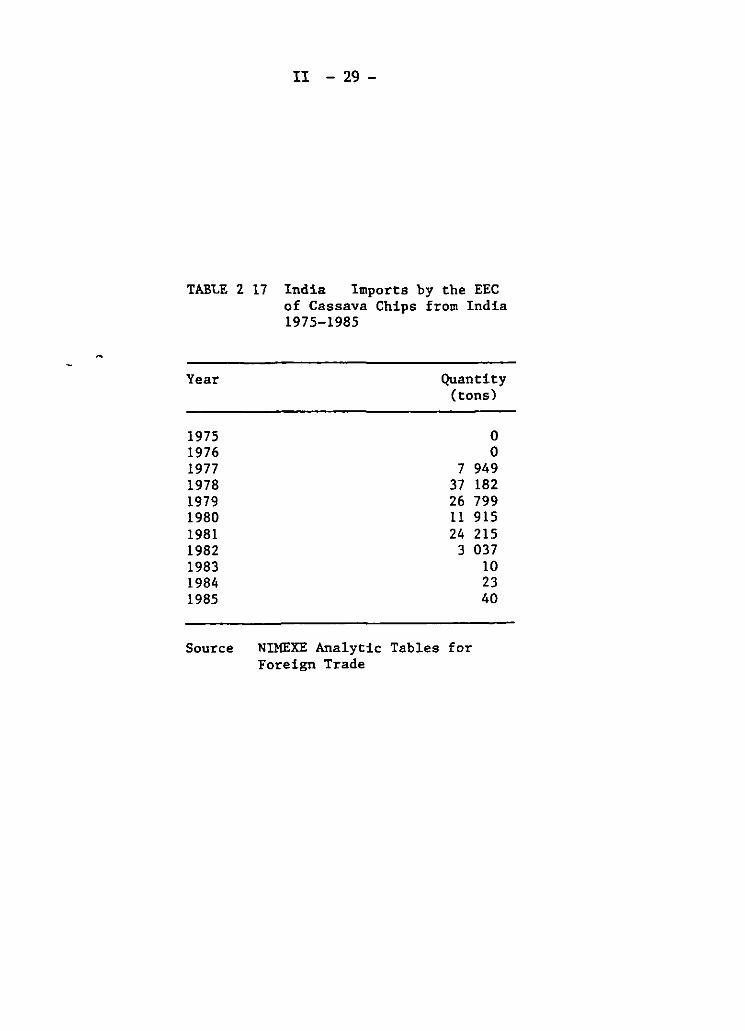
The other pr1ncipal option in developing a dried cassava market is the export market India exported l1mited quantities of cassava chips te Europe between 1957 and 1964 The largest export level reached in this period was 72 thousand tons in the 1958-59 crop year Exports virtually ceased until 1977 when exports te the EEC were resumed (Table 2 17) This reopening of export shipments was brought en by a substantial price fall in dried cassava in Kerala in 1977 which brought prices in line with f o b pricea in Thailand (Figura 2 1) Through the early part of the 1970 s Opto 1977 casaava pricea in India were normally well above Thai prices and exporta were not profitable From the beginning of 1977 through mid-1981 Indian pricea remained in line with Thai prices and exporta cont1nued at a rate of about 20 thousand tons a year India fortunately enjoyed a rising 1nternational price for cassava during this period and prices in Kerala very cloaely tracked f o b Thai pricea from early 1977 through mid-1981 at which point Indian prices could not match a falling international price In 1982 India again effectively dropped out of the export maket
Export levels of 20 te 30 thousand tons reault in high shipp1ng costs and does not allow incentives for inveatment in more efficient marketing and processing capacity -- although there is some compensation in that India is closer than compet~tors te European markets At th1s stage Kerala does not have the production base te develop an effect1ve export market and simultaneously meet domestic requirements nor will India ever be in the position of be1ng a large exporter of cassava products However a signif~cant increase in yield levela could lead te further development of th~s nascent industry which would in turn provide incent~ves for further market 1ntegration the setting of a stable floor pr~ce and ~n turn lower and more stable prices for fresh cassava for food
The starch market
The market for cassava for starch product~on is div~ded between a fully integrated industry based en amall-to-med~um scale plants in Tamil Nadu and a relatively fragmented starch industry in Kerala consist1ng of two large-scale plants 3 medium-scale and 50 small-scale plants The principal constra1nt en expansion of this industry is supply of raw mater1al te run the planta
The ~ndustry in Kerala probably operates at no more than SOk capac1ty Factor1es here must compete with cassava for the fresh market and dur1ng at least part of the year must offer a lower price for cassava roots than perta1ns en the fresh market in arder te rema1n competitive with production in Tam1l Nadu Thus in 1981 a maJar starch factory in Kerala paid 260 rupees/t for roots which compared te farm level prices 1n Tamil Nadu of between 280 te 360 rupees/ t and f arm gate prices for tnc fresh market in Kerala of 400 rupees/t (field observations 1982) The farmer pr1ce would only cover var1able production costs for the farmer and representa a pr1ce at which farmers would sell roots of low quality or where ident1ficat1on of other market outlets was a constraint Further
II - 29 -
TABLE 2 17 India Importa by the EEC of Cassava Chips from India 1975-1985
Year
1975 1976 1977 1978 1979 1980 1981 1982 1983 1984 1985
Source
Quantity (tons)
o o
7 949 37 182 26 799 11 915 24 215
3 037 10 23 40
NIMEXE Analytic Tables for Foreign Trade
F1 ;¡ut e .2 1 In di J
II - 30-
Compons:-n Pehet Pt 1:e
of Ch1c. Pt .ce 1n Bong• ü~
_, J Jl·~ .JI ~-.' 1
1tJ ~-------------------------------------------------eo 1 140 -~ .i 7¡) l._ -
1 Yl .J 1-.;,: 1
._ ¡
1C1:1-J ::.n -i
- 1
(" i l -.-, t .,
~o i~ =n .._ -. : l .... ¡-- .
1 1 1 1 1
1
Ind1.:1
1 r 1 ¡1 ! ¡ ¡1! j
¡ 1 r r 1 1 ,¡
11
; 1 tl.l 1 1 m
1 1 11
11 w¡
11
•
11 1
J 1
1 1
. " ! 1 1 !
i J -.," l
1 11
-.-~ tj ;:!iiii!Q..-..J:¡i !iiiliói;i:::.:;,Y"s;:::;¡;:--.iiU-.-D-...sU~ea~ ..... -P:i.~:ff..410-,
., .., :. --: ""'J. '""'t:' '"'),_ ...,., "?C -,~ .;:._¡-¡ e- 1 6-t-t f- \,;,;, !- - J
= 1 =-..,. --
II - 31 -
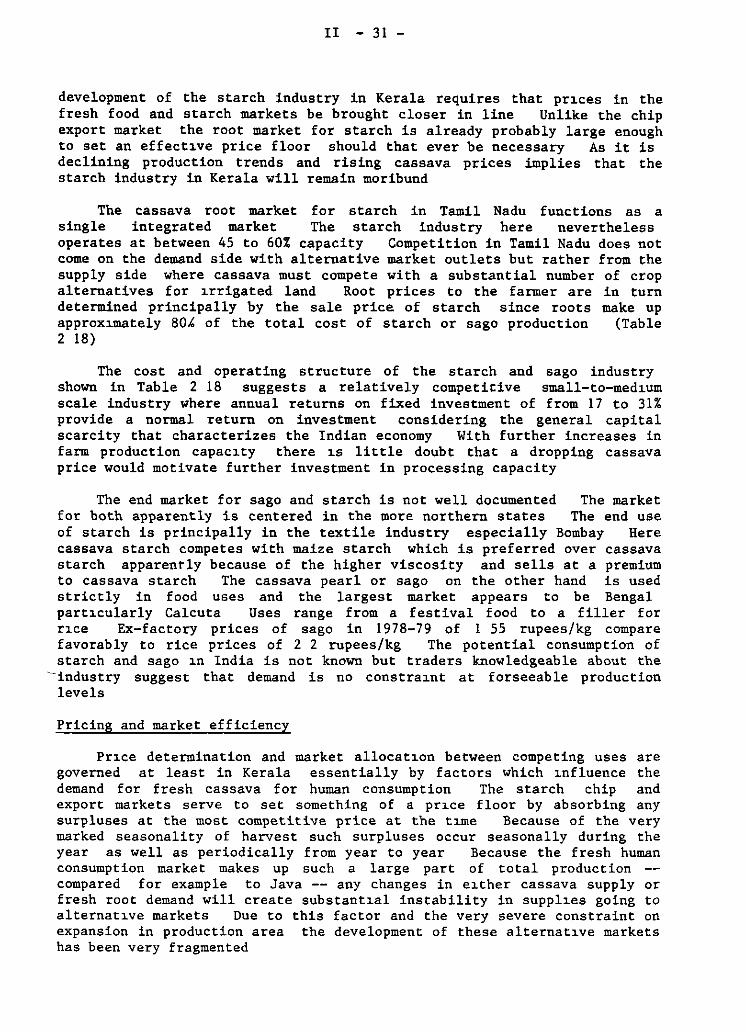
development of the starch industry in Kerala requires that pn.ces in the fresh food and starch markets be brought closer in line Unlike the chip export market the root market for starch is already probably large enough to set an effect~ve price floor should that ever be necessary As it is declining production trends and rising cassava prices implies that the starch industry in Kerala will remain moribund
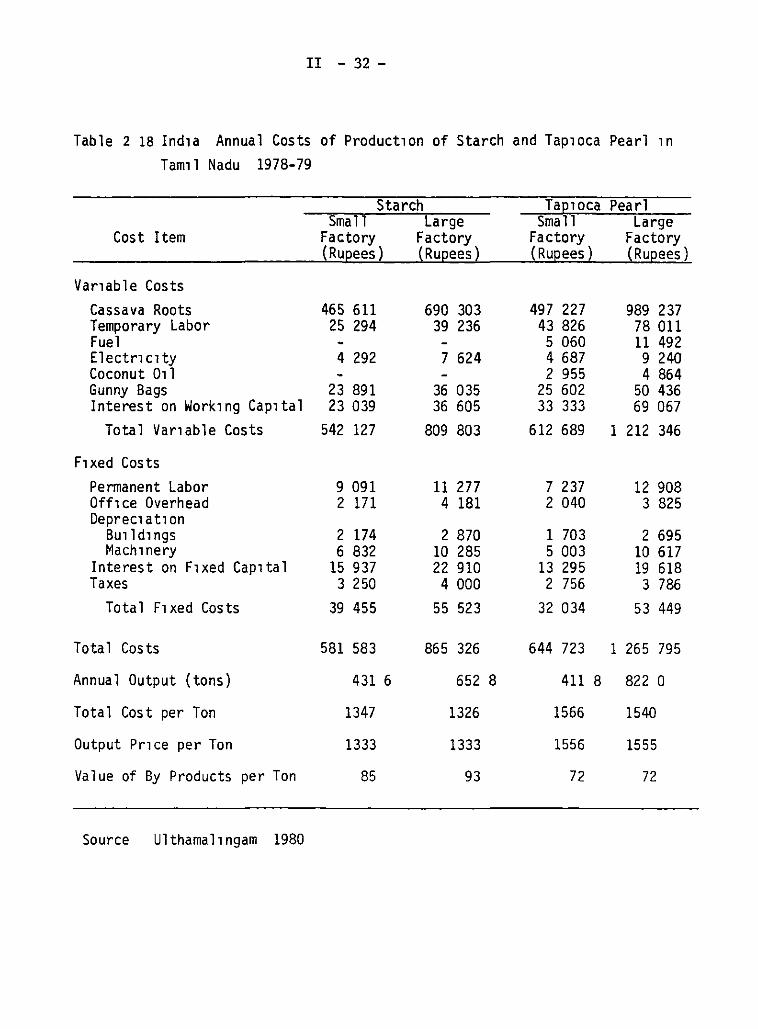
The cassava root market for starch in Tamil Nadu functions as a single integrated market The starch industry here nevertheless operates at between 45 to 60% capacity Competition in Tamil Nadu does not come on the demand side with alternative market outlets but rather from the supply side where cassava must compete with a substancial number of crop alternatives for ~rrigated land Root prices to the farmer are in turn determined principally by the sale price of starch since roots make up approx~tely 80~ of the total cost of starch or sago production (Table 2 18)
The cost and operating structure of the starch and sago industry shown in Table 2 18 suggests a relatively competitive small-to-med~um
scale industry where annual returns on fixed investment of from 17 to 31% provide a normal return on investment considering the general capital scarcity that characterizes the Indian economy With further increases in farm production capac~ty there ~s little doubt that a dropping cassava price would motivate further investment in processing capacity
The end market for sago and starch is not well documented The market for both apparently is centered in the more northern states The end use of starch is principally in the textile industry especially Bombay Here cassava starch competes with maize starch which is preferred over cassava starch apparently because of the higher viscosity and sells at a premium to cassava starch The cassava pearl or sago on the other hand is used strictly in food uses and the largest market appears to be Bengal part~cularly Calcuta Uses range from a festival food to a filler for nce Ex-factory prices of sago in 1978-79 of 1 55 rupees/kg compare favorably to rice prices of 2 2 rupees/kg The potential consumption of starch and sago ~n India is not known but traders knowledgeable about the
~industry suggest that demand is no constra~nt at forseeable production levels
Pricing and market efficiency
Pr~ce determination and market allocat~on between competing uses are governed at least in Kerala essentially by factors which 1.nfluence the demand for fresh cassava for human consumption The starch chip and export markets serve to set something of a pr1ce floor by absorbing any surpluses at the most competitive price at the t~me Because of the very marked seasonality of harvest such surpluses occur seasonally during the year as well as periodically from year to year Because the fresh human consumption market makes up such a large part of total production compared for example to Java -- any changes in e~ther cassava supply or fresh root demand will create substant~al instability in suppl1.es going to alternatl.ve markets Due to this factor and the very severe constraint on expansion in production area the development of these alternat~ve markets has been very fragmented
II - 32 -
Tab le 2 18 Ind1 a Ann ua 1 Cos ts of Product1on of Starch and Tap1oca Pearl 1n
Tam1l Nadu 1978-79
Starch TaElOCa Pearl Small Large Small Large
Cost Item Factory Factory Factory Factory (RuEees) (RuEees) ( Ru12ees) (RuEees)
Var1able Costs
Cassa va Roots 465 611 690 303 497 227 989 237 Temporary Labor 25 294 39 236 43 826 78 011 Fuel 5 060 11 492 El ectr1 c1 ty 4 292 7 624 4 687 9 240 Coconut 011 2 955 4 864 Gunny Bags 23 891 36 035 25 602 50 436 Interest on Work1ng Cap1tal 23 039 36 605 33 333 69 067
Total Var1able Costs 542 127 809 803 612 689 1 212 346
F1 xed Cos ts Permanent Labor 9 091 11 277 7 237 12 908 Off1ce Overhead 2 171 4 181 2 040 3 825 Deprec1at1on
Bu1ld1ngs 2 174 2 870 1 703 2 695 Mach1nery 6 832 10 285 5 003 10 617
Interest on F1xed Cap1tal 15 937 22 910 13 295 19 618 Taxes 3 250 4 000 2 756 3 786
Total F1xed Costs 39 455 55 523 32 034 53 449
Total Costs 581 583 865 326 644 723 1 265 795
Annua 1 Output (tons) 431 6 652 8 411 8 822 o Total Cost per Ton 1347 1326 1566 1540
Output Pr1ce per Ton 1333 1333 1556 1555
Value of By Products per Ton 85 93 72 72
Source Ulthamal1ngam 1980
II - 33 -
Although cassava consumption and prices are obviously influenced by rice availability and prices there are no studies wh~ch measure the degree of this influence Planning and investment in rice production cassava production and ration rice distribution in Kerala are critically dependent on such a study Price series provide the only data which shed l~ght on the interaction between the rice and cassava markets and here several inexplicable trends become apparent One special difficulty ~n analyzing price series is separating out the effects of inflation in the general price level Since the consumer budget is weighted so heavily by food purchases the consumer price index will reflect changes in food prices more than other products These tend to be somewhat volatile anyway but in India upto 1977 food zoning heavily restricted interstate trade in food grains Food price levels thus varied by state and using the consumer price index for India as a whole to deflate prices in any particular state will probably not be reflective of price inflation in that particular state For this reason the consumer price index in Trivandrum was used to deflate all prices in Kerala
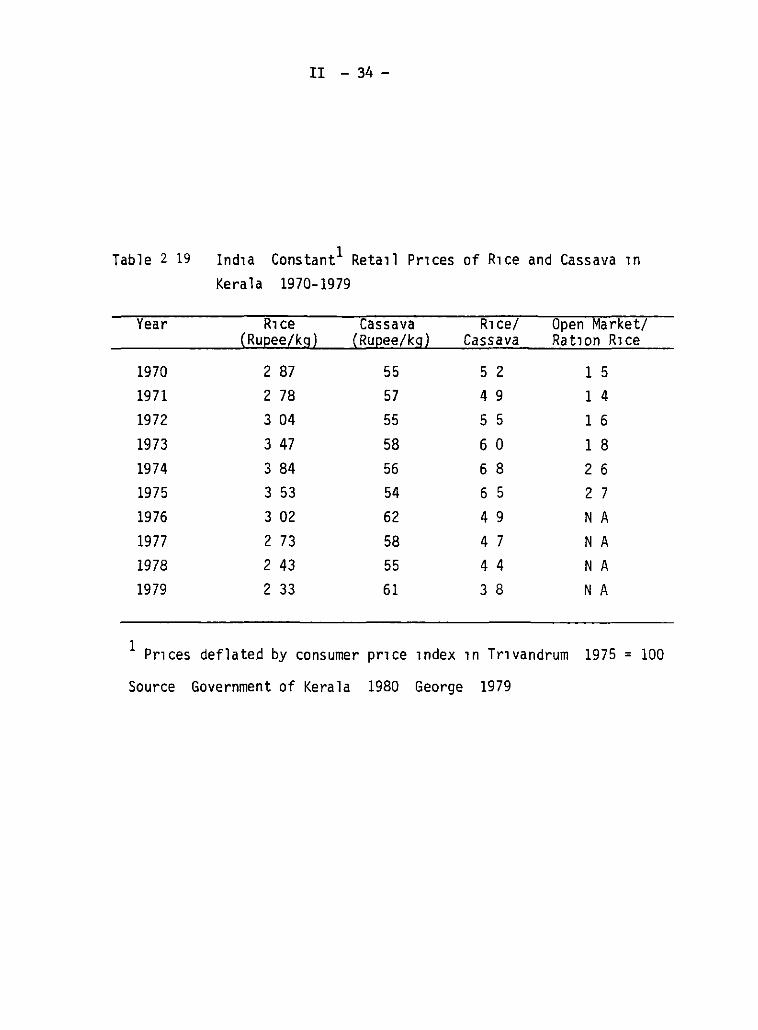
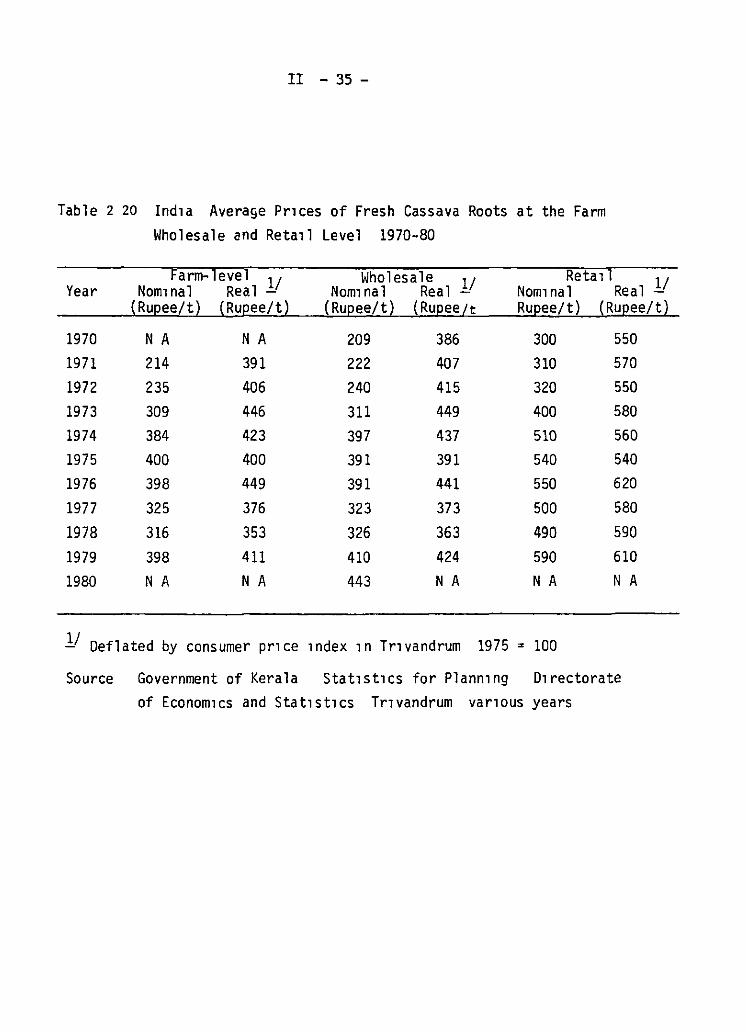
During the decade of the 1970 s real retail rice price rose till 1974-5 and then fell dramatically (Table 2 19) due to increases in ration rice availability Retail cassava pr~ces on the other hand remained relatively constant through the period resulting ~n rice becoming relat~vely cheaper to cassava While the marketing margin for fresh cassava in Kerala is proportionally low compared to margins in other countries the margin has masked much higher variabil~ty ~n cassava pr~ces at the farm and wholesale levels (Table 2 20) At the farm and wholesale levels comparable though not as marked trends to those that have occurred in the reta~l rice market have occurred In particular there ~s a falling real cassava price at a time (1976-78) when production was declining rapidly This wou~d support a marked influence of rice prices and availabibties on cassava prices In 1979 the brief linkage to internacional prices caused cassava prices to rise
The dominant issue then is what has been happening with r~ce
ava~labilities? Through the decade of the 1970 s rice production in Kerala was relatively stable (Table 2 16) The component of variability in rice supplies in Kerala was the availability of rat~on rice What ~s
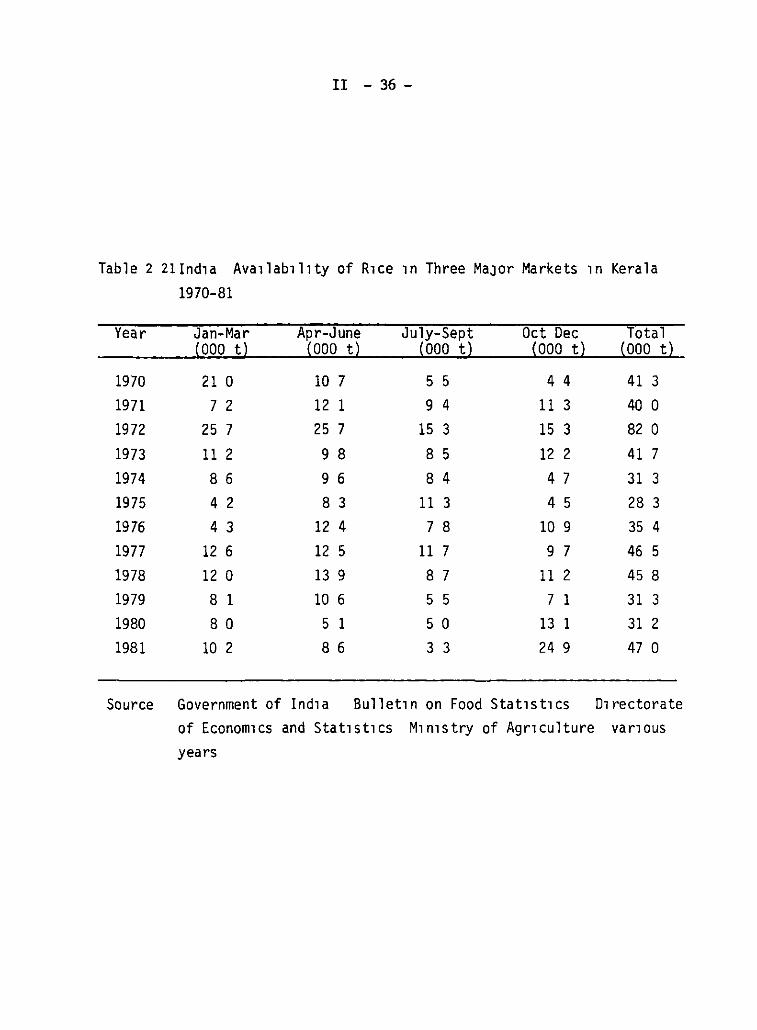
inexpbcable with the available data is the low rice prices in 1978 and 1979 Since food zoning and restrictions on interstate trade of food grains were eliminated in 1977 it ~s possible that there have been flows of rice into Kerala from other states brought by private traders and sold on the open market However even the limited evidence on open market availabilities suggest that such supplies 'Were not much changed in the years 1978 and 1979 (Table 2 21) and that el1minating food zoning has had no impact on rice suppll.es in Kerala R1ce pn.ces 1n Kerala have been trad1t1onally h1gher than 1n the other Indian states (eg retail rice prices in 1981 10 Kerala were 3 3 Rs/kg compared to 2 4 Rs/kg in Tamil Nadu) and wh1le the lireralization of trade flows should bring pr~ces more in line the mechanism to do th~s has to be 1ncreased ava~lab1lities
Thus while it 1s not clear why r1ce pr1ces have declined and in turn put a dampet on cassava prices that should otherw1se have been rising in response to decl~ning production Th~s allowed cassava prices to become compet1tive in the world market for a per~od of five years To the extent
II - 34 -
Table 2 19 Ind1a Constant1 Reta1l Pr1ces of R1ce and Cassava 1n Kerala 1970-1979
Year R1ce Cassava R1ce/ Open Market/ (Rupee/kg) (Rupee/kg) Cassava Ra t10n R1 ce
1970 2 87 55 5 2 1 5 1971 2 78 57 4 9 1 4 1972 3 04 55 5 5 1 6
1973 3 47 58 6 o 1 8 1974 3 84 56 6 8 2 6 1975 3 53 54 6 5 2 7 1976 3 02 62 4 9 N A
1977 2 73 58 4 7 N A
1978 2 43 55 4 4 N A
1979 2 33 61 3 8 N A
1 Pr1ces deflated by consumer pr1ce 1ndex 1n Tr1vandrum 1975 = 100
Source Government of Kerala 1980 George 1979
II - 35 -
Table 2 20 Ind1a Average Pr1ces of Fresh Cassava Roots at the Farm Wholesale and Reta1l Level 1970-80
Farm-level 11 Wholesale ]j Reta1l ]j Year Nom1nal Real - Nom1nal Real Nom1nal Real (Ru~ee/t) (Ru~ee/t) (Ru~ee/t) (Ru~ee¿t Ru~ee/t) (Ru~ee/t)
1970 N A N A 209 386 300 550 1971 214 391 222 407 310 570
1972 235 406 240 415 320 550
1973 309 446 311 449 400 580
1974 384 423 397 437 510 560
1975 400 400 391 391 540 540
1976 398 449 391 441 550 620
1977 325 376 323 373 500 580
1978 316 353 326 363 490 590
1979 398 411 410 424 590 610
1980 N A N A 443 N A N A N A
]j Deflated by consumer pr1ce 1ndex 1n Tr1vandrum 1975 = 100
Source Government of Kerala Stat1st1cs for Plann1ng D1rectorate of Econom1cs and Stat1st1cs Tr1vandrum var1ous years
II - 36 -
Table 2 Zl!nd1a Ava1lab1l1ty of R1ce 1n Three MaJor Markets 1n Kerala 1970-81
Year Jan-Mar Apr-June July-Sept Oct Dec Total ( 000 t) ( 000 t) (000 t) (000 t) ( 000 t)
1970 21 o 10 7 5 5 4 4 41 3
1971 7 2 12 1 9 4 11 3 400
1972 25 7 25 7 15 3 15 3 82 o 1973 11 2 9 8 8 5 12 2 41 7
1974 8 6 9 6 8 4 4 7 31 3
1975 4 2 8 3 11 3 4 5 28 3
1976 4 3 12 4 7 8 109 35 4
1977 12 6 12 5 11 7 9 7 46 5
1978 12 o 13 9 8 7 11 2 45 8
1979 8 1 10 6 5 5 7 1 31 3
1980 8 o 5 1 5 o 13 1 31 2
1981 10 2 8 6 3 3 24 9 47 o
Source Government of Ind1a Bullet1n on Food Stat1st1cs D1rectorate of Econom1cs and Stat15t1cs M1n1stry of Agr1culture var1ous years
II - 37 -
that increased rice supplies can be assured this would have the greatest impact on nutrition in Kerala What is clear however is that there are no such assurances Maintaining low pr~ced cassava for the human consumption market provides a critica! element of stability in food supplies What is needed however is better integration with alternative markets which can handle surpluses when rice supplies are adequate What this requires is a larger production base and this can only be achieved with further increases in yields
Conclusions
Cassava serves a maJor if somewhat dist~nct role in the agricultura! economies of Kerala and western Tamil Nadu In Kerala internal rice production is stagnant and there is an increasing portian of the upland area being planted to higher value tree crops Food supplies thus rely critically on rice allocat~ons from the central pool and more recently apparent pr~vately-traded inflows from outs~de the state However in maintaining or improving the food intake and nutrition of the low income strata the options are increases in rice rationing off-take or more plentiful and cheaper cassava Compared to rice where an increase in the poor s ration allotment implies an increase for everyone cheaper cassava could target directly on the poor and would not involve subsidies from the public treasury -- theses subsidies are boro by the Food Corporation of India and not the Kerala State government (George 1985) The design of a food and nutrition policy in Kerala is heavily dependent on the prognosis for rice production in India as a whole both given that food zoning is a policy of the past and that rice stocks in the central pool have increased in the mid-1980 s Nor should policy makers appear insensitive by suggest~ng that the poor should just eat cassava Pure pragmatism suggests that the calorie intake of the poor is critically low and that cassava can be as cheap a means as any of increasing calorie intake
In Tamil Nadu on the other hand a potent~al growth industry much like the case of Indonesia exists in the starch and tapioca pearl market The industry ~s constrained by lack of raw material for processing and for farmers there is no restrictions on finding market outlets for their production Prices are in most respects relatively stable and any increases in yields w~ll directly improve farmer incomes
The ~ssue then is how much higher farm level yields can be raised in these two states over the relatively high level which farmers already achieve Such increases will almost certainly depend on higher yielding variet~es The research of the CTCRI suggests that there is scope for do~ng th~s ~o Kerala An issue wh~ch CTCRI ~s very consc~ous of is that the quality characteristics of these improved var~et~es shall have to remain high since cassava is essentially consumed in a fresh form In Tamil Nadu on the other hand there are no such restrictions other than that the y~eld gap to be exploited there appears to be much smaller Southern Ind~a representa one of the few s~tuations in As~a (Java is the other) where the only frontier for cassava to exploit is the y~eld
frontier
II - 38 -
Appendix 2 1 A synthesis of production and utilization
The uncertainty surrounding the cassava production est1mates and the paucity of data on cassava consumption in its various end uses makes the development of a consistent supply and distribution series a speculative enterprise The exercise will be attempted by first separat1ng Kerala and Tamil Nadu then reviewing the available consumption data for each state and finally integrating these estimates with the production estimates The result provides the basis for the evaluation of cassava markets and demand in southern India
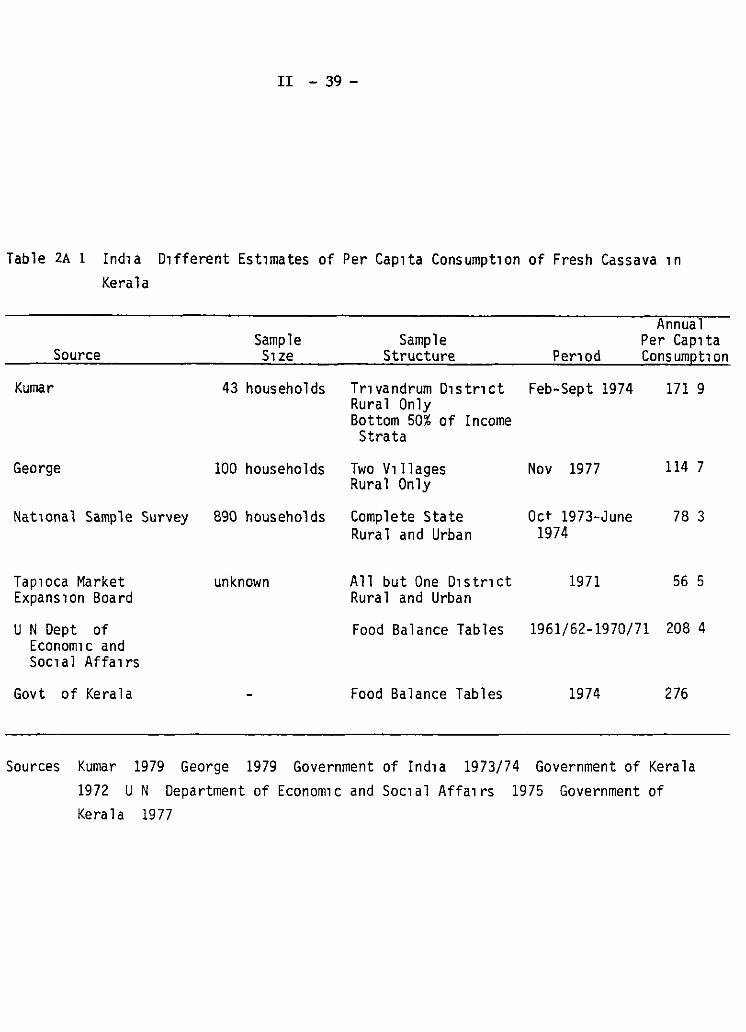
Kerala An analysis of cassava utilizat1on must begin with an estimate of human consumption of fresh roots Several estimates exist but as can be seen in Table 2A 1 there is a substancial range in these estimates Given that Kumar s sample introduces a substancial upward bias in the cassava consumption estimate -- consumption is higher in the southern districts in rural areas and in the lower income strata -- the strik1ng feature is the difference between the estimates from food balance sheets and those from sample surveys The George and Kumar samples have upward biases in their estimates of per capita consumpt1on The National Sample Survey is probably the best structured sample and thereby estimate of consumption levels Since fresh human consumption is considered the largest single market for cassava the difficulty arises of how to account for the difference between the consumer sample estimate and that derived from product1on estimates in the food balance sheets
Dr1ed cassava chips are also produced in Kerala principally in the northern d1stricts and primarily in the period October to Apr11 These ch1ps go into various end uses Dried cassava can be prepared in the home and eaten especially when fresh cassava is not available Cassava flour 1s also produced by grinding the ch1ps At least one factory operates 1n Malappuram exactly for this purpose The flour 1s in turn used to produce f1ne noodles Often the flour is produced in the home Also large starch factories also buy chips for process1ng part1cularly for glucose production Finally from 1955 to 1966 cassava chips were exported After that exports ceased until JUSt recently and since 1977 Ind1a has again been export1ng modest amounts of cassava chips
Stat1stics on production and utilization of cassava chips are practically non-existent The Tap1oca Market Expansion Board provides the single est1mate of household consumption of processed cassava products and estimates an annual consumption of 9 5 kg per cap1ta of dried cassava It can only be assumed that cassava flour is included in th1s f1gure Cassava chip exports were 1n1t1ated aga1n in 1971 after a lull of about 10 years Exports remain small and 1rregular lmports 1nto the European Commun1ty from Ind1a were 7 949 t 1n 1977 37 182 t in 1978 26 799 t in 1979 and 11 915 t in 1980 Chips purchased by the starch factories are assumed to be included in starch production figures
This leaves only potent1al exports of dried cassava to other states Data on transport through selected checkposts for the period May 1975 to May 1976 give the following figures
II - 39-
Table 2A 1 Ind1a D1fferent Est1mates of Per Cap1ta Consumpt1on of Fresh Cassava 1n Kerala
Annua 1 Sample Sample Per Cap1ta
So urce S1ze Structure Per1od Consumpt1on
Kumar 43 households Tr1vandrum D1str1ct Feb-Sept 1974 171 9
George 100 households
Nat1onal Sample Survey 890 households
Tap1oca Market unknown Expans 1 on Board
U N Dept of Econom1c and Soc1 a 1 Affa 1 rs
Govt of Kerala
Rural Only Bottom 50% of Income S trata
Two V1ll ages Rural Only
Complete State Rural and Urban
All but One D1str1ct Rura 1 and Urban
Food Balance Tables
Food Balance Tables
Nov 1977 114 7
Oct 1973-June 78 3 1974
1971 56 5
1961/62-1970/71 208 4
1974 276
Sources Kumar 1979 George 1979 Government of Ind1a 1973/74 Government of Kerala 1972 U N Department of Econom1c and Soc1al Affa1rs 1975 Government of Kerala 1977
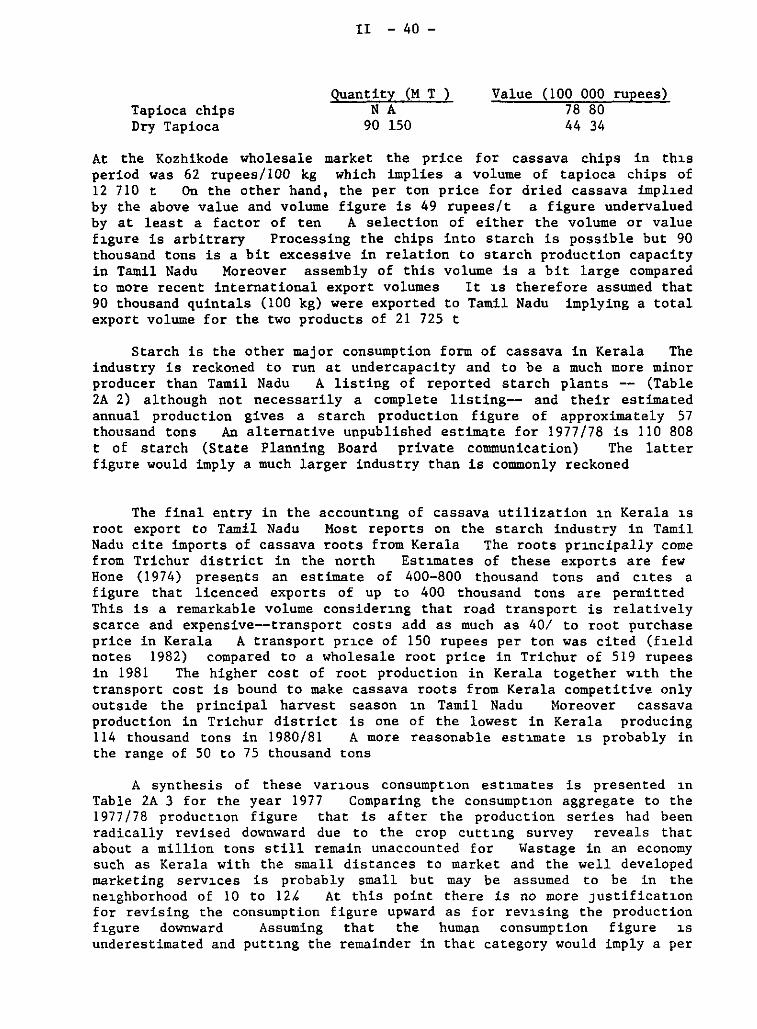
Tapioca chips Dry Tapioca
ll - 40 -
Quantity (M T ) N A
90 150
Value (100 000 rupees) 78 80 44 34
At the Kozhikode wholesale market the price for cassava chips in thJ.s period was 62 rupees/100 kg which implies a volume of tapioca chips of 12 710 t On the other hand, the per ton price for dried cassava implJ.ed by the above value and volume figure is 49 rupees/t a figure undervalued by at least a factor of ten A selection of either the volume or value fJ.gure is arbitrary Processing the chips into starch is possible but 90 thousand tons is a bit excessive in relation to starch production capacity in Tamil Nadu Moreover assembly of this volume is a bit large compared to more recent international export volumes lt J.s therefore assumed that 90 thousand quintals (100 kg) were exported to Tamil Nadu implying a total export volume for the two produces of 21 725 t
Starch is the other major consumption form of cassava in Kerala The industry is reckoned to run at undercapacity and to be a much more minor producer than Tamil Nadu A listing of reported starch planta -- (Table 2A 2) although not necessarily a complete listing-- and their estimated annual production gives a starch production figure of approximately 57 thousand tons An alternative unpublished estimate for 1977/78 is 110 808 t of starch (State Planning Board private communication) The latter figure would imply a much larger industry than is commonly reckoned
The final entry in the accountJ.ng of cassava utilization J.n Kerala J.S root export to Tamil Nadu Most reporta on the starch industry in Tamil Nadu cite importa of cassava roots from Kerala The roots prl.ncipally come from Trichur district in the north EstJ.mates of these exporta are few Hone (1974) presenta an estimate of 400-800 thousand tons and cJ.tes a figure that licenced exporta of up to 400 thousand tona are permitted This is a remarkable volume considerJ.ng that road transport is relatively acaree and expensive--transport costa add as much as 40/ to root purchase price in Kerala A transport prJ.ce of 150 rupees per ton was cited (fJ.eld notes 1982) compared to a wholesale root price in Trichur of 519 rupees in 1981 The higher cost of root production in Kerala together WJ.th the transport cost is bound to make cassava roots from Kerala competitive only outsJ.de the principal harvest season J.n Tamil Nadu Moreover cassava production in Trichur district is one of the lowest in Kerala producing 114 thousand tons in 1980/81 A more reasonable estJ.mate J.S probably in the range of 50 to 75 thousand tons
A synthesis of these van.ous consumptl.on estJ.mates is presented 1n Table 2A 3 for the year 1977 Comparing the consumpt1on aggregate to the 1977/78 product1on figure that is after the production series had been radically revised downward due to the crop cuttJ.ng survey reveals that about a million tons still remain unaccounted for Wastage in an economy such as Kerala with the small distances to market and the well developed marketing serv1ces is probably small but may be assumed to be in the ne1ghborhood of 10 to 12k At this point there is no more JUStificatJ.on for revising the consumption figure upward as for rev1sing the production fJ.gure downward Assuming that the human consumption figure 1s underestimated and putt1ng the remainder in that category would imply a per
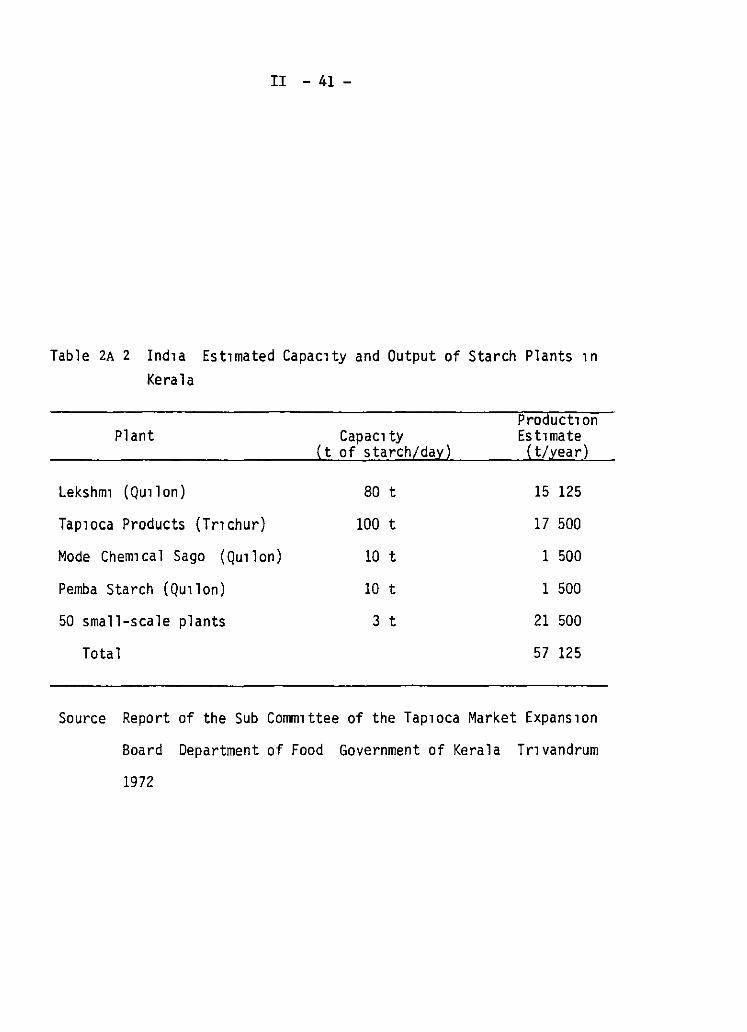
II - 41 -
Table 2A 2 Ind1a Est1mated Capac1ty and Output of Starch Plants 1n Kera 1 a
Plant
Lekshm1 ( Qu1l on)
Tap1oca Products (Trlchur)
Mode Chem1 ca 1 Sago ( Qu1l on)
Pemba Starch (Qu1lon)
50 small-scale plants
Total
Capac1ty (t of starch/day)
80 t
100 t
10 t
10 t
3 t
Product1on Es t1mate ( t/year)
15 125
17 500
1 500
1 500
21 500
57 125
Source Report of the Sub Comm1ttee of the Tap1oca Market Expans1on
Board Oepartment of Food Government of Kerala Tr1vandrum
1972
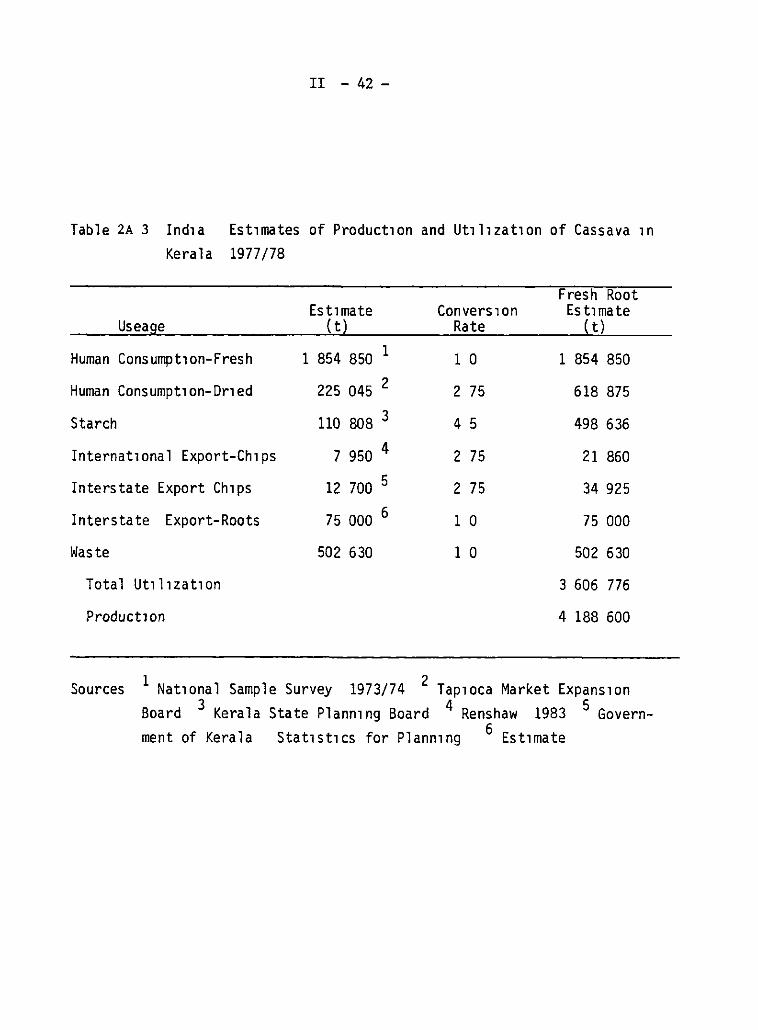
II - 42 -
Table 2A 3 Ind1a Est1mates of Product1on and Ut1l1zat1on of Cassava 1n Kera 1 a 1977/78
Est1mate Useage {t)
Human Consumpt1on-Fresh 1 854 850 1
Human Consumpt1on-Dr1ed 225 045 2
Starch 110 808 3
Internat1onal Export-Ch1ps 7 950 4
Interstate Export Ch1ps 12 700 5
Interstate Export-Roots 75 000 6
Waste 502 630
Total Ut1l1zat1on
Product1on
Convers1on Rate
1 o
2 75
4 5
2 75
2 75
1 o 1 o
Fresh Root Est1mate
( t)
1 854 850
618 875
498 636
21 860
34 925
75 000
502 630
3 606 776
4 188 600
Sources 1 Nat1onal Sample Survey 1973/74 2 Tap1oca Market Expans1on Board 3 Kerala State Plann1ng Board 4 Renshaw 1983 5 Government of Kerala Stat1St1cs for Plann1ng 6 Est1mate
II - 43 -
capita consumption level of 103 kg/year Compared to the other sample estJ.mates this is not unreasonable but certaJ.nly suggests that earlier estimates of per capita consumption from food balance sheets were substantially overestimated generally by more than 100k
Tamil Nadu
The market for cassava in Tamil Nadu as compared to Kerala is dominated by demand for industrial uses as opposed to food uses The starch and tapioca pearl industry centered in Salem District is considered to be the maJor end user of cassava in Tamil Nadu There are 611 starch factories in Tamil Nadu 497 of which are located in Salem District and the other 114 of which are located in Dharampuri South Arcot and Coimbatore districts (Salem Starch and Sago Manufacturera s Cooperative private communication and Uthamalingam 1980) Utilization of cassava roots would then follow from the operacional characteristics of these plants
Uthamalingam (1980) selected a sample of 30 starch and pearl facto ies in Salem town and in outlying rural areas The operacional structure is given in Table 2A 4 There are 228 pearl factories and 269 starch factories in Salem and assumJ.ng a distribution of 75% small-scale and 25% large-scale leads to an average annual output per factory of 499 t This annual average starch output thereby implies an annual production level of 248 thousand tons in Salem District and an additional 57 thousand tons in the three adjacent districts
Uthamalingam (1980) provides alternative estimates based on the quantity shipped by railway and that purchased by the Salem Sago and Starch Merchants Association (Table 2A S) These are only about one-third of the above estimates The rail shipments obviously do not include the starch consumed locally -- a food habits survey by the Protel.n Foods Association of India suggests sJ.gnificant local consumption of pearl or that transported by road and therefore provides only a minimum estimate of production and an idea of variation of production from year to year The estimate based on per factory output implies root utJ.ll.zation of 992 thousand tons in Salem and 228 thousand tons in the adJacent dJ.stricts assuming the relatively high conversion rate reported J.n Tamil Nadu of 4 1
Most reports suggest that food usage of the cassava root is relatively minimal in Tamil Nadu The 1973/74 National Sample Survey reports an average annual rural consumption of cereal substitutes of 4 1 kg/year for the whole state It is probable that thJ.s figure includes only cassava but J.t is not certain what percentage would be root and what would be processed cassava Since the only reported consumption in Tamil Nadu is for rural areas J.t is probable that this figure only includes root consumption This would l.mply a total food consumption of 125 thousand tons
The recapitulation of the consumptl.on together with an assumed 10% wastage gJ.ves a total figure of 1 514 thousand tons which compares favorably with the production estimate of 1 682 thousands tons in 1978/79 and -¡ 591 thousand tons in 1979/80 A small change in the starch conversion rate could account for any difference The production and consumption data would appear to be more or less consistent at least since the 1977/78 crop year
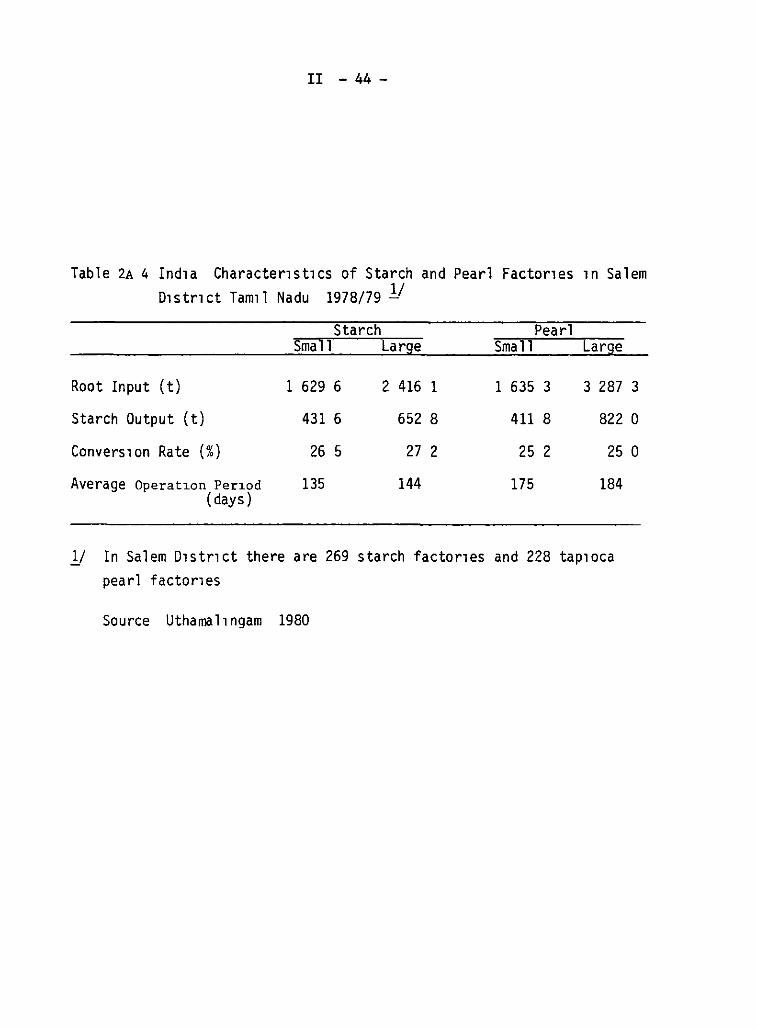
II - 44-
Table 2A 4 Ind1a Character1st1cs of Starch and Pearl Factor1es 1n Salem D1str1ct Tam1l Nadu 1978/79!!
Starch Pearl Small Large Small Large
Root Input (t) 1 629 6 2 416 1 1 635 3 3 287 3
Starch Output (t) 431 6 652 8 411 8 822 o Convers1on Rate (%} 26 5 27 2 25 2 25 o Average Operat1on Per1od 135 144 175 184
( days)
!/ In Salem D1str1ct there are 269 starch factor1es and 228 tap1oca pearl faetones
So urce Uthama 11 ngam 1980
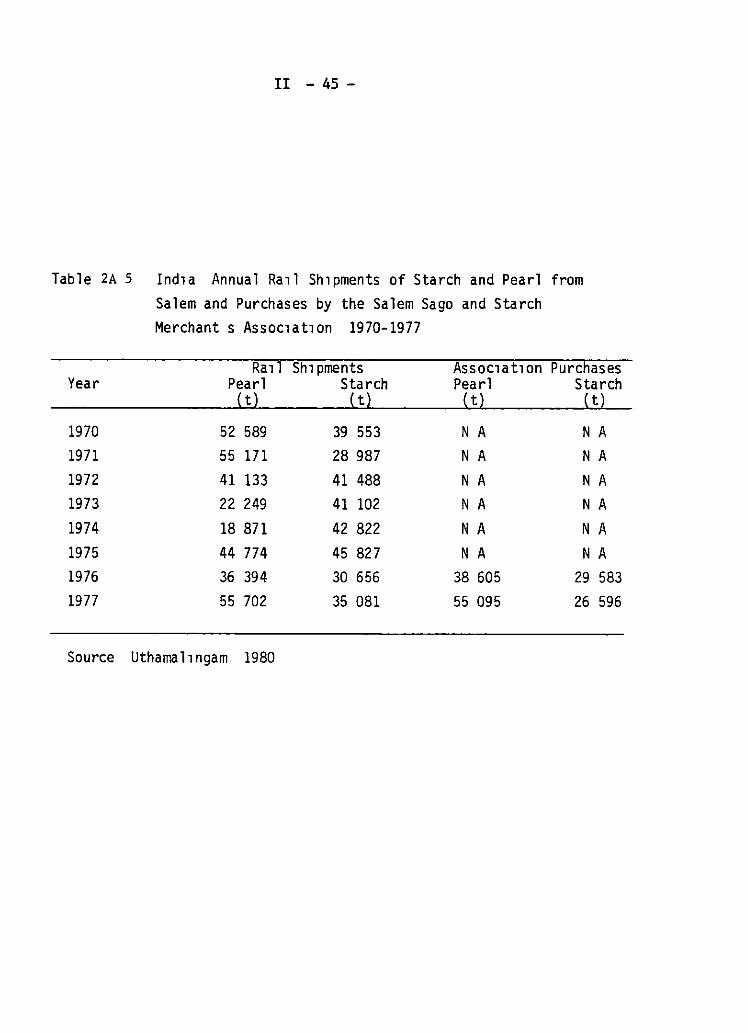
II - 45 -
Table 2A S Ind1a Annual Ra1l Sh1pments of Starch and Pearl from Salem and Purchases by the Salem Sago and Starch Merchant S ASSOC1at10n 1970-1977
Ra1l Sh1pments Assoc1at10n Purchases Year Pearl Starch Pearl Starch
( t) ( t) (t) ( t)
1970 52 589 39 553 N A N A 1971 55 171 28 987 N A N A 1972 41 133 41 488 N A N A 1973 22 249 41 102 N A N A 1974 18 871 42 822 N A N A 1975 44 774 45 827 N A N A 1976 36 394 30 656 38 605 29 583
1977 55 702 35 081 55 095 26 596
Source Uthamal1ngam 1980

II - 46 -
Other States For the sake of completeness Andhra Pradesh is the only other state with anywhere close to a significant production volume Production in this state was 88 2 thousand tons in 1979/80 and 171 O thousand tons in 1980/81 This volume is comparable to about 10¿ of the production of Salem District Cassava is a ra~nfed crop in Andhra Pradesh and is principally grown in East Godavari District The cassava root is used exclusively in a small cassava pearl industry located in the district
III
Trends and D1str1but1on of Ch1nese Cassava Product1on and Use 1820-1984 (A technologlcal and economlc exam1nat1on of h1stor1cal development and future potent1al )
Bruce Stone
A paper prepared for the Inte1natlonal Center for Trop1cal Agr1culture Palm1ra Colomb1a
Internat1onal Food Pol1cy Resea1ch Inst1tute \/ashlngton o e
December 1986
TRENOS AND DISTRIBUTION OF CHINESE CASSAVA PRODUCTION AND USE
1820 - 1984
Product1on trends and d1str1but1on
No off1c1al nat1onal data ser1es for cassava 1n the Peoples
Republ1c have been publ1shed by Ch1nese author1t1es It 1s poss1ble
to obta1n est1mated ser1es from the Food and Agr1cultural
Organ1zat1on of the Un1ted Nat1ons 1 Such ser1es are based on
assumed annual 1ncrements 1n harvested area for most years and
somewhat less regular but a s1m1lar monoton1cally non-decreas1ng set
of est1mates for product1on Y1elds appear to be der1ved from the
rough area and product1on est1mates by calculat1on The only f1gure
among these wh1ch appears to have come from a Ch1nese source 1s the 3
m1ll1on ton product1on f1gure c1rca 1980 prov1ded unoff1c1ally as an
undated est1mate to the 1982 CIAT delegat1on by one of the
agr1cultural sc1ence 1nst1tutes v1s1ted 1n Guangdong Earl1er work 2
has concluded that the ent1re FAO ser1es for root and tuber crops
bears l1ttle relat1on to the aggregate ser1es publ1shed s1nce 1979 by
Ch1nese stat1st1cal author1t1es 3 It 1s now also clear that the FAO
le g FAO Supply Ut1l1zat1on Tapes 1984 Standard1zed Commod1ty Balance Tape 1984 Rome Product1on Yearbook Tape 1984 Rome 1985
Rome 1985 FAO 1985 and FAO
2Bruce Stone An Exam1nat1on of Econom1c Data on Cassava Product1on Ut1l1zat1on and Trade a paper prepared for the Internat1onal Center for Ttop1cal Agr1culture (CIAT) Internat1onal Food Pol1cy Research Inst1tute Wash1ngton D C August 1983
3e g He Kang et al Zhongguo Nongyebu [M1n1stry of Agr1c~lture of Ch1na] (eds ) Zhongguo Nongye N1anJ1an 1980 [Agr1cultural Yearbook of Ch1na 1980] (BelJlng Nongye Chubanshe [Agr1cultural Publ1sh1ng House] 1980) and Zhongguo GuoJla TongJlJU [State Stat st1cal Bureau] Zhongguo TongJl NlanJlan - 1983 [Stat1st1cal Yeatboo~ of Ch1na- 1983] (BelJlng TongJl Chubanshe [Stat1st1cal Publ1sh1ng House] 1983)
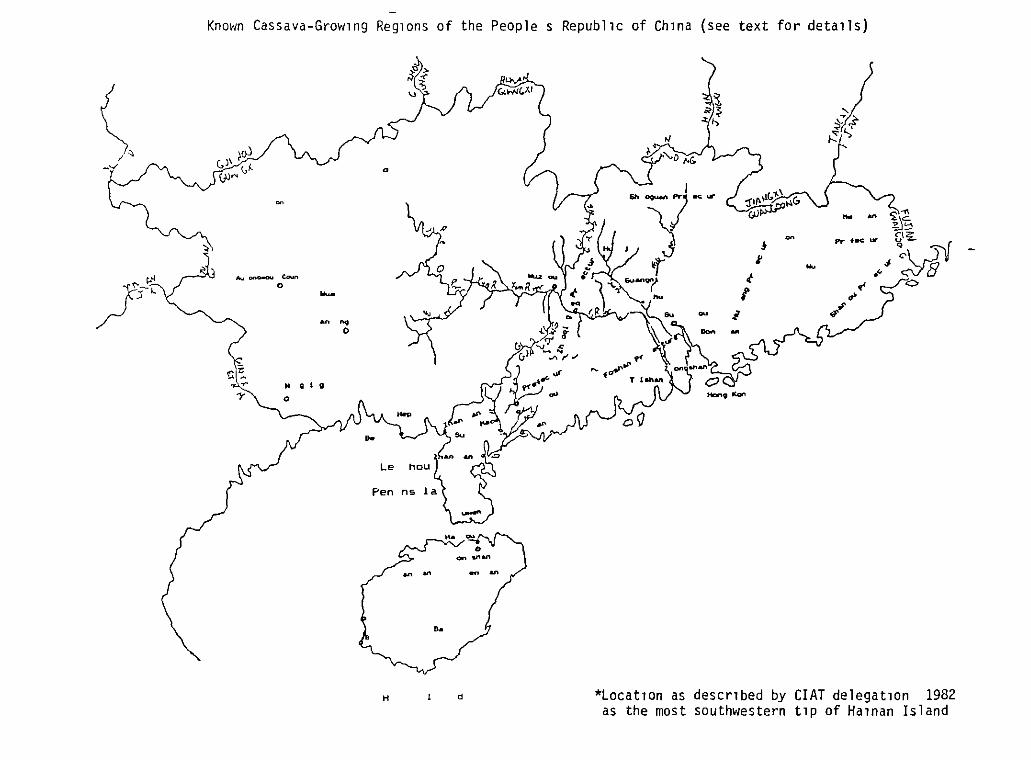
\, Known Cassava-Grow1ng Reg1ons of the People s Republlc of Ch1na (see text for detalls)
Au -- c.-n o .....
~ .. o
-r N QiQ
o
~-s¡.; l_'l; ...,
- i -1
1
; j
~
...
; ;¡
,::,'>
n. ., ~\'"1\ ~\C. ;;.¡~
Pr f.C... 0~ ,J :\. 5V
~ c:\JB
(;~~ -y " ll... 1 "(;--' .,., " 1\ / ~ -. ... -
Le
Pen
~ ~
H
..
d *Locat1on as descr1bed by CIAT delegat1on 1982 as the most southwestern t1p of Ha1nan Island
- 2
ser1es for cassava ~se confl1ct w1th off1c1ally publ1shed ser1es
for one of the two pr1nc1pal grow1ng reg1ons and w1th scattered
nat1onal est1mates for 1nd1v1dual years found elsewhere 1n Ch1nese
publ1cat1ons S1nce 1984 the FAO has taken account of sorne of the
recent 1nformat1on 1n formulat1ng current root and tuber crop
est1mates for publ1cat1on 1n FAO Product1on Yearbooks But much
recent 1nformat1on has not been reflected 1n FAO ser1es and
add1t1onal work 1s requ1red to obta1n a rel1able 1mpress1on of long
term trends for 1nd1v1dual crops 1nclud1ng cassava
Accord1ng to Ch1nese sources 4 cassava had been 1ntroduced 1nto
Ch1na from South Amer1ca v1a nanyang [the South Seas or Pac1f1c
Ocean] by 1820 although 1t 1s not clear whether 1t entered Guangdong
Prov1nce d1rectly from the West or whether 1t was 1ntroduced
1nd1rectly follow1ng reg1onal cult1vat1on 1n Sr1 Lanka Ind1a or
lndones1a By far the ma1n Ch1nese produc1ng area 1s the extreme
south below the Trop1c of Cancer (23 5°N) espec1ally Guangdong
4L1ang Guangshang (ed ) Mushu Za1pe1 yu L1yong [Cassava Cult1vat1on and Use] (Guangzhou Guangdong KeJ1 Chubanshe [Guangdong Sc1ent1f1c and Techn1cal Publ1sh1ng House] 1981) author s preface and p 4 Cassava 1s conf1rmed to have been grown 1n Ch1na for more than 100 years 1n Zhongguo Kexueyuan D1l1 YanJ1Usuo J1n9J1 D1l1 YanJ1USh1 [Ch1nese Academy of Sc1ences Inst1tute of Geography Econom1c Geography Research Room] Zhongguo Nongye D1l1 Zonglun [A General Treat1se on Ch1na s Agr1cultural Geography] (Be1J1ng Kexue Chubanshe [Sc1ent1f1c Publ1sh1ng House] 1980) p 129 1820 was also the 1ntroduct1on date ment1oned dur1ng a spr1ng 1982 delegat1on from the Internat1onal Center for Trop1cal Agr1culture (CIAT) and recorded 1n James H Cock and Kazuo Kawano Cassava 1n Ch1na unpubl1shed tr1p report CIAT Palm1ra Colomb1a June 1982 p 1 However Mushu Za1pe1 yu L1yong clearly 1nd1cates that 1820 1s the earl1est record of cassava cult1vat1on so far uncovered the 1nt1oduct1on date may well have been earl1er
- 3 -
Prov1nce and Guangx1 Zhuang Autonomous Reg1on Of the two
product1on has typ1cally been greatest 1n Guangdong Cassava 1s also
cult1vated 1n FUJlan Yunnan Hunan Gu1zhou and Ta1wan Prov1nces
but much less extens1vely and to a very m1nor extent 1n Hube1
J1angx1 ZheJlang and S1chuan Sorne est1mates of prov1nc1al
cult1vated area gleaned from Ch1nese sources are arranged 1n Table 1
Wh1le cassava had been 1ntroduced 1nto Guangdong and Guangx1 by
the f1rst half of the 19th century and a book devoted to cassava
plant1ng methods had been publ1shed as early as 1900 the f1rst
cult1vat1on record 1n FUJlan 1s 1920 and 1n Ta1wan 1929
Introduct1on dates for most other prov1nces were cons1derably later
Hunan 1941 Gu1zhou 1942 ZheJlang 1954 and J1angx1 1959
Cult1vat1on of cassava 1n Yunnan though potent1ally beg1nn1ng
earl1er was est1mated at only two thousand hectares 1n 1960 Most
farmland 1n these pro11nces fall w1th1n what 1s descr1bed 1n Ch1nese
sources as the expans1on area north of the Trop1c of Cancer and
south of 30°N There 1s exper1mental cult1vat1on of cassava even
north of 30°N w1th the northernmost plant1ngs at the Hebe1 Forestry
Sc1ence Inst1tute at 39°20 N These exper1ments began dur1ng the
fam1ne years 1n 1960 and 1961 1n Hube1 Anhu1 J1angsu Shaanx1
Shandong L1aon1ng S1chuan and Hebe1 wh1ch const1tute the f11st
record of cassava related act1v1t1es 1n these prov1nces 5 Cassava
5L1ang Guangshang (ed ) Mushu Za1pe1 yu L1yong author s preface and pp 4 9 and 10
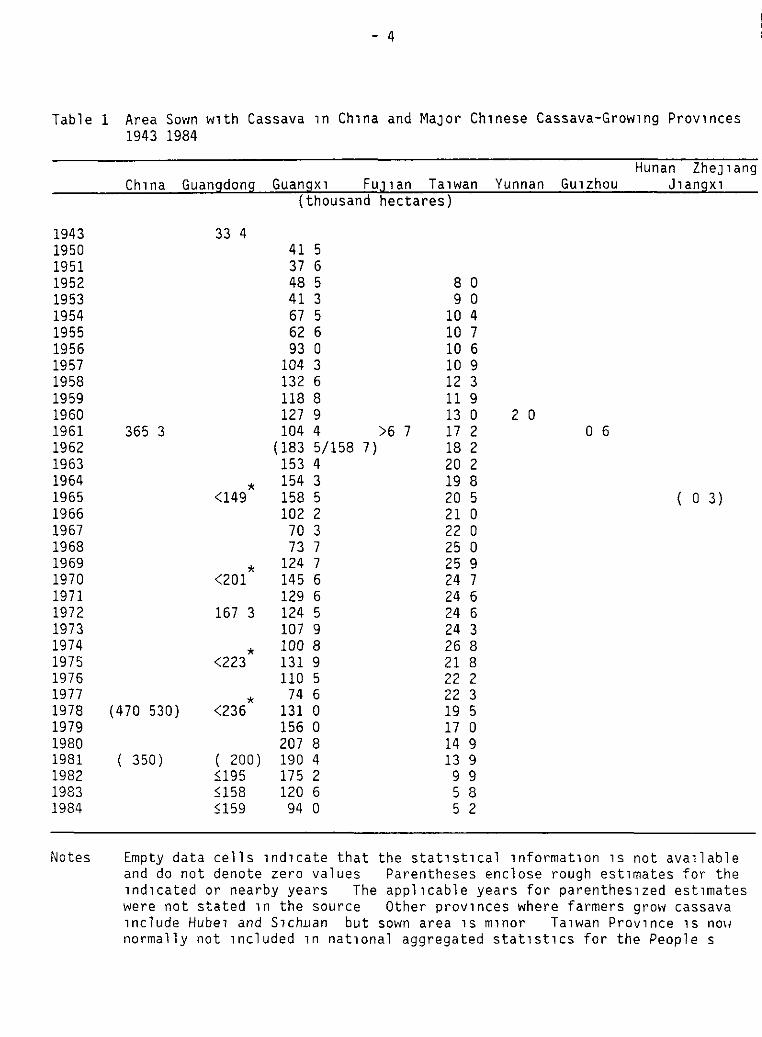
- 4
Table 1 Area Sown w1th Cassava 1n Ch1na and MaJor Ch1nese Cassava-Grow1ng Prov1nces 1943 1984
1943 1950 1951 1952 1953 1954 1955 1956 1957 1958 1959 1960 1961 1962 1963 1964 1965 1966 1967 1968 1969 1970 1971 1972 1973 1974 1975 1976 1977 1978 1979 1980 1981 1982 1983 1984
Notes
Ch1na Guangdong Guangx1 FUJ1an Ta1wan Yunnan Gu1zhou
365 3
(470 530)
( 350)
33 4
* <149
* <201
167 3
* <223
* <236
( 200) ~195 ~158 ~159
(thousand hectares)
41 5 37 6 48 5 41 3 67 5 62 6 93 o
104 3 132 6 118 8 127 9 104 4 >6 7
(183 5/158 7) 153 4 154 3 158 5 102 2
70 3 73 7
124 7 145 6 129 6 124 5 107 9 100 8 131 9 110 5
74 6 131 o 156 o 207 8 190 4 175 2 120 6 94 o
8 o 9 o
10 4 10 7 10 6 10 9 12 3 11 9 13 o 17 2 18 2 20 2 19 8 20 5 21 o 22 o 25 o 25 9 24 7 24 6 24 6 24 3 26 8 21 S 22 2 22 3 19 5 17 o 14 9 13 9 9 9 5 8 5 2
2 o o 6
Hunan ZheJ1ang J1angx1
( o 3)
Empty data cells 1nd1cate that the stat1st1cal 1nformat1on 1s not ava1lable and do not denote zero values Parentheses enclose rough est1mates for the 1nd1cated or nearby years The appl1cable years for parenthes1zed est1mates were not stated 1n the source Other prov1nces where farmers grow ca55ava 1nclude Hube1 and S1chDan but 5own area 15 m1nor Ta1wan Prov1nce 15 no11 normally not 1ncluded 1n nat1onal aggregated stat1st1cs for the People s
Source5
Guangx1
Ta1wan
- 5
Republ1c of Ch1na although 5eparate data entr1e5 for Ta1wan are not unu5ual among PRC 5tat15t1cal compend1a Ta1wan 15 probably 1ncluded 1n the 1961 nat1onal f1gure however
* The5e f1gure5 probably overe5t1mate off1c1ally recorded plant1ng5 by 20-40 thou5and hectare See Table 7
Guangx1 J1ng]1 N1anJ1an 81anJ1bu [Guangx1 Econom1c Yearbook Ed1tor1al Oepartment] (ed5 ) Guangx1 J1ngJ1 N1an]1an 1985 [Guangx1 Econom1c Yearbook 1985] (Nann1ng Guangx1 J1ngj1 N1an]1an B1an]1bu 1985) pp 531 and 593
The 1976 f1gure wa5 conf1rmed 1n Guangx1 Nongye 0111 B1anx1ezu [Guangx1 Agr1cultural Geography Ed1tor1al Board] (ed5 ) Guangx1 Nongye 0111 [Guangx1 Agr1cultural Geography] (Nann1ng Kexue Chuban5he [Sc1ent1f1c Publ15h1ng Hou5e] 1980) p 76
The lower f1gure for 1962 15 from L1ang Guang5hang (ed ), Mu5hu Za1pe1 yu L1yong (Guangzhou Guangdong KeJ1 Chubanshe 1981) p 9
Republ1c of Ch1na Execut1ve Yuan 01rectorate General of Budget Account1ng and Stat15t1c5 Stat15t1cal Yearbook of the Republ1c of Ch1na 1985 (Ta1pe1 Republ1c of Ch1na 1985) p 281
The 1952 54 f1gure5 were added from
Republ1c of Ch1na 01rectorate-General of Budget Account1ng and Stat15t1c5 Stat15t1cal Yearbook of the Republ1c of Ch1na 1982 (Ta1pe1 Republ1c of Ch1na 1982) p 115
Ch1na and other Prov1nce5
The 1978 f1gure 1s from Zhongguo Kexueyuan D1l1 YangJ1U5UO J1ng]1 0111 Yan]1ush1 [Ch1nese Academy of Sc1ence ln5t1tute of Geography Econom1c Geography Re5earch Laboratory] Zhongguo Nongye 0111 Zonglun [A General Treat15e on Ch1nese Agr1cultural Geography] (Be1J1ng Kexue Chubanshe 1980) p 129
The 1981 f1gure 15 ftom James H Cock and Kazuo Kawano Cassava 1n Ch1na unpubl1shed tr1p report
Guangdong
- 6 -
Internat1onal Center for Tropical Agr1cultural Research (CIAT) Cal1 Colombia June 1982 pp 1-2
The 1961 figure 1s from L1ang Mushu Za1pe1 yu L1yong p 9 Th1s source also stated that nat1onal cassavasown area rema1ned around 5 m1ll1on mu dur1ng the 1960s (300-367 000 hectares assum1ng 4 5-5 5 m1ll1on mu ) The figure for Hunan ZheJiang and J1angx1 comb1ned was g1ven as around 5 000 mu (333 ha ) 1n each year of the 1960s
The overest1mates for Guangdong for 1965 1970 1975 1978 1979 and 1982-84 are from Table 7 A 1981 overest1mate of 201 thousand hectares was also calculated The 1979 and 1982-84 est1mates are relat1vely close approx1mat1ons The 1965 1970 1975 and 1978 f1gures probably overest1mate by at least 20-40 thousand hectares See Table 7 The 1943 and 1972 f1gures are from L1ang Mushu Za1pe1 yu L1yong p 9 and the 1981 est1mate 1s from Cock and Kawano Cassava 1n As1a p 1
seems to enJOY sorne very m1nor farmer cult1vat1on 1n S1chuan but
probably not elsewhere w1th1n the experimental area In fact 1t 1s
not yet clear from the est1mates of nat1onal Guangdong and Guangx1
cult1vat1on assembled 1n Table 1 that cassava expans1on efforts have
resulted In s1gn1f1cant 1ncreased plant1ngs outs1de of those two
prov1nces
In the absence of a rel1able nat1onal cassava product1on ser1es
the best approx1mat1on would be to synthes1ze product1on ser1es for
Guangdong and Guangx1 Fortunately complete 1950-84 ser1es for
Guangx1 were publ1shed 1n 1985 (Table 2) These data though not
necessar1ly w1thout flaws prov1de the best understand1ng of year to
year movements 1n cult1vat1on and y1elds A glance at Table 2 w1ll
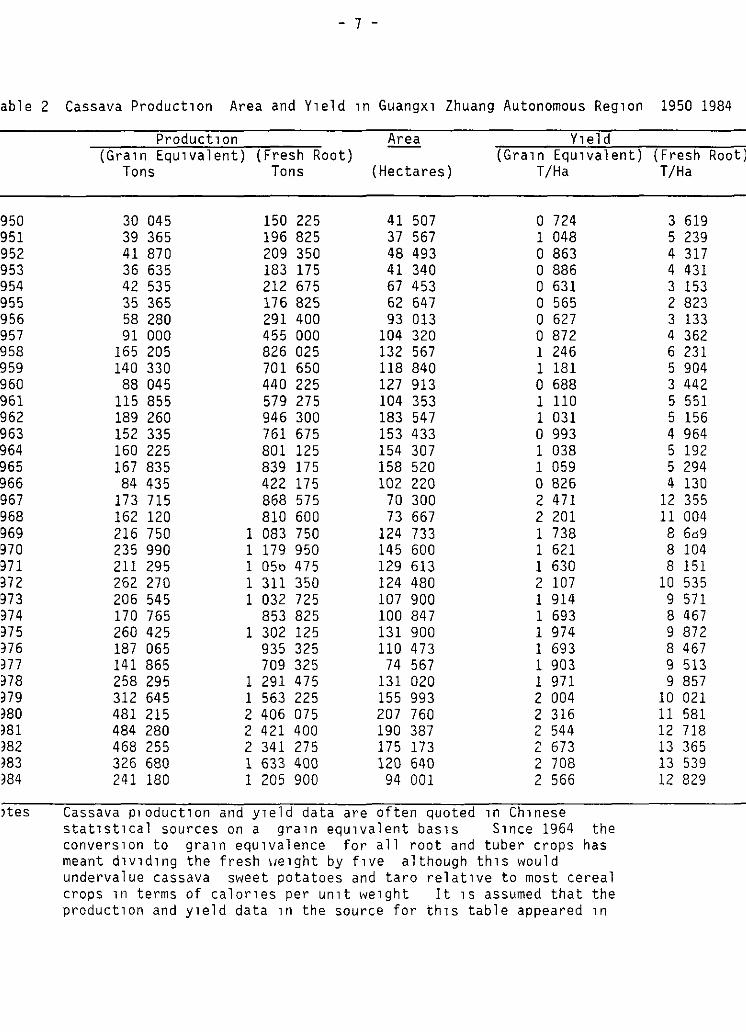
- 7 -
·able 2 Cassava Product1on Area and Y1eld 1n Guangx1 Zhuang Autonomous Reg1on 1950 1984
950 951 952 953 954 955 956 957 958 959 960 961 962 963 964 965 966 967 968 969 970 971 372 973 374 375 376 377 378 379 380 381 382 )83 )84
Product1on (Gra1n Equ1valent) (Fresh Root)
Tons Tons
30 045 39 365 41 870 36 635 42 535 35 365 58 280 91 000
165 205 140 330 88 045
115 855 189 260 152 335 160 225 167 835 84 435
173 715 162 120 216 750 235 990 211 295 262 270 206 545 170 765 260 425 187 065 141 865 258 295 312 645 481 215 484 280 468 255 326 680 241 180
150 225 196 825 209 350 183 175 212 675 176 825 291 400 455 000 826 025 701 650 440 225 579 275 946 300 761 675 801 125 839 175 422 175 868 575 810 600
1 083 750 1 179 950 1 OSo 475 1 311 350 1 032 725
853 825 1 302 125
935 325 709 325
1 291 475 1 563 225 2 406 075 2 421 400 2 341 275 1 633 400 1 205 900
Are a
(Hectares)
41 507 37 567 48 493 41 340 67 453 62 647 93 013
104 320 132 567 118 840 127 913 104 353 183 547 153 433 154 307 158 520 102 220
70 300 73 667
124 733 145 600 129 613 124 480 107 900 100 847 131 900 110 473
74 567 131 020 155 993 207 760 190 387 175 173 120 640
94 001
Y1eld (Gra1n Equ1valent)
T/Ha
o 724 1 048 o 863 o 886 o 631 o 565 o 627 o 872 1 246 1 181 o 688 1 110 1 031 o 993 1 038 1 059 o 826 2 471 2 201 1 738 1 621 1 630 2 107 1 914 1 693 1 974 1 693 1 903 1 971 2 004 2 316 2 544 2 673 2 708 2 566
Jtes Cassava p¡oductlon and y1eld data are often quoted 1n Ch1nese stat1st1cal sources on a gra1n equ1valent bas1s S1nce 1964 the convers1on to gra1n equ1valence for all root and tuber crops has meant d1v1d1ng the fresh 11e1ght by f1ve although th1s would undervalue cassava sweet potatoes and taro relat1ve to most cereal crops 111 terms of calor1es per un1t we1ght It lS assumed that the product1on and y1eld data 111 the source for th1s table appeared 111
(Fresh Root) T/Ha
3 619 5 239 4 317 4 431 3 153 2 823 3 133 4 362 6 231 5 904 3 442 5 551 5 156 4 964 S 192 5 294 4 130
12 355 11 004 8 6o9 8 104 8 151
10 535 9 571 8 467 9 872 8 467 9 513 9 857
10 021 11 581 12 718 13 365 13 539 12 829
- 8 -
gra1n equ1valent form The or1g1nal data have therefore been mult1pl1ed by f1ve to calculate fresh root we1ght
So urce Guangx1 J1ngJ1 N1anJ1an BlanJlbu (eds ) Guangx1 J1ngJ1 N1anJ1an 1985 (Nann1ng Guangx1 JlnQJl N1anJ1an B1anJ1bu 1985) pp 531-532 and 593
conf1rm that the 35-year perlad encompasses cons1derable var1at1on 1n
both
Dur1ng the 1950s sorne government-1n1t1ated efforts were
undertaken to expand cult1vat1on of cassava wh1ch was v1ewed as a
crop capable of prov1d1ng cons1derable bulk and calarle content per
un1t area One cannot rule out the poss1b1l1ty however that a
port1on of the 1mpl1ed 1ncrease 1n cult1vat1on reflected prev1ously
unreg1stered cassava areas eventually 1ncluded 1n stat1st1cal
coverage espec1ally dur1ng the format1on of agr1cultural producers
cooperat1ves (1954-56) and the people s communes (1958) Elsewhere6
1t has been demonstrated that most of the 1mpl1ed growth 1n total
root and tuber crop area s1nce 1952 1s l1kely to be real the actual
f1gutes rema1n1ng 1n all probab1l1ty w1th1n about 5 percent (below)
the off1c1al data
The cons1derable 1ncrease 1n cassava area 1n 1958 parallels an
even larger reported 1ncrease for all root and tuber crops \lh 1 1 e
1958 was a year of extreme stat1st1cal d1stort1on cast1ng doubt on
6sruce Stone Crop Product1on
An Analys1s of Ch1nese Data on Root and Tuber The Ch1na Quarterly September 1984 pp 594 630
9 -
the magn1tude of the 1ncrease the 1mpl1ed growth was no greater than
that of 1956 much of wh1ch may have been real 1958 was also ayear
1n wh1ch great efforts were made to 1ncrease foodcrop product1on by
whatever means poss1ble Root and tuber crops 1nclud1ng cassava
were correctly 1dent1f1ed as the eas1est means to effect a short term
leap 1n bulk food product1on It 1s d1ff1cult however to accept
the 1mpl1ed 1958 1ncrease 1n average y1eld to ar unprecedented level
espec1ally 1n v1ew of the (except for sweet and wh1te potatoes more
modest) expans1on of area planted w1th other food crops and
ma1ntenance of y1elds 1n that year In sum wh1le 1t appears that
the total Guangx1 foodcrop data (exclud1ng cassava) have been
adJusted 1n the 1985 Guangx1 Econom1c Yearbook for the stat1st1cal
d1stort1on typ1cal of 1958 publ1shed mater1als 1t 1s qu1te poss1ble
that those for cassava may not have been part1cularly 1n the y1eld
category
The decl1ne 1n 1959 area however followed by sorne recovery 1n
1960 are undoubtedly real although 1t 1s 1mposs1ble to ver1fy the
exact f1gures Inflated reports of m1raculous gra1n product1on
success 1n 1958 led author1t1es to 1ncrease area sown w1th econom1c
crops 1n 1959 at the expense of staples 7 When the truth became
clear (1958 had been a good but not spectacular year) 1t was too
7L1 Choh-m1ng The Stat1st1cal System of Commun1st Ch1na (Berkeley Un1vers1ty of Cal1forn1a Press 1962) Kenneth R \lalker Food Gra1n Procurement and Consumpt1on 1n Ch1na (Cambr1dge Cambr1dge Un1vers1ty P1ess 1984) N1cholas R Lardy Agl 1culture 1n Ch1na s Modeln Econom1c Development Cambr1dge Cambr1dge Un1vers1ty Press 1983
10 -
late to correct spr1ng plant1ng Sorne cornpensat1on would have been
made w1th 1959 fall planted cassava however and 1n 1960 1n v1ew of
peor harvests for all foodcrops the prev1ous year The y1eld decl1ne
1n 1960 1s cons1stent w1th w1despread natural d1sasters throughout
Ch1na est1mated to be the worst 1n the twent1eth century These were
somewhat less severe 1n Guangx1 than 1n sorne other prov1nces but
y1elds of other Guangx1 food crops reportedly decl1ne by a we1ghted
average of 9 percent dur1ng 1960 and 1961 8 Spr1ng planted cassava
1n part1cular 1s subJect to 1nsect damage dur1ng the seedl1ng per1od
and 1n the fall typhoon damage
The low area f1gure for 1961 1s cons1stent w1th both poor
stat1st1cal coverage dur1ng the per1od and s1gn1f1cant rural
d1slocat1on assoc1ated w1th the 1960-61 farn1ne throughout Ch1na wh1ch
may have part1ally extended 1nto Guangx1 The large 1ncrease 1n
cassava area 1n 1962 followed by subs1dence dur1ng the follow1ng few
years 1s also expla1nable 1n terms of react1on to the 1960 61 fam1ne
Geograph1c coverage may not have been cons1stent throughout the
ser1es Q1nzhou Spec1al D1str1ct was transferred from Guangx1 to
Guangdong 1n 1955 then back to Guangx1 1n 1965 Q1nzhou 1ncludes
the ent1re current Guangx1 coast and extends north from the current
prov1nc1al border to the Yu R1ver then angles southwest towa1ds the
8Guangx1 JlnQJl N1an]1an B1anJ1bu [Guangx1 Econorn1c Yearbook Ed1tor1al Board] Guangx1 JlnQJl N1an]1an, 1985 [Guangx1 Econom1c Yearbook 1985] (Nann1ng Guangx1 J1ngJ1 N1anJ1an B1an]1bu 1985) p 530
- 11 -
border w1th V1etnam In 1976 area sown w1th foodgra1ns 1n Q1nzhou
covered 461 333 hectares Area planted w1th root and tuber crops 1n
the western d1str1ct of Guangdong c1rca 1957 (1nclud1ng Q1nzhou
Spec1al D1str1ct and ZhanJlang Prefecture) cons1sted of 28 3 percent
of total area sown w1th foodcrops (exclud1ng soybeans) a l1ttle less
than 5 percent of wh1ch was planted w1th cassava and mao potatoes
These reports suggest that someth1ng on the arder of 6 thousand
hectares of cassava were transferred from Guangx1 to Guangdong 1n
1955 then (potent1ally more extens1ve cassava area) back to Guangx1
1n 1965 Th1s could expla1n the counter-trend movements of cassava
area 1n the Guangx1 ser1es for 1955 and 1965
Data osc1llat1ons dur1ng the succeed1ng decade (1966-77) are
less understandable as a funct1on of nat1onw1de econom1c developments
and may be pecul1ar to cassava orto Guangx1 Hypotheses for
expla1n1ng these osc1llat1ons 1nclude the lagged effect of earl1er
shocks echoed v1a the rotat1on system (see below) and per1od1c
reclamat1on 1n1t1at1ves In Guangx1 cassava 1s often grown dur1ng
the early yea1s of a reclamat1on proJect 1n arder to earn sorne
econom1c return befo1e reclamat1on 1s complete When the qual1ty of
farmland construct1on and f1eld preparat1on perm1ts cassava 1s often
phased out to make 11ay for more h1ghly valued crops
9sruce Stone Crop Product1on
An Analys1s of Ch1nese Data on Root and Tuber pp 612 615
9
- 12 -
The low planted area f1gures for 1967 and 1968 and
part1cularly the h1gh average y1eld est1mates for those years are
espec1ally anomalous Although fert1l1zer use accelerated dur1ng the
1960s w1despread appl1cat1on to cassava as early as 1967-68 1s very
unl1kely One 1s consequently mot1vated to hypothes1ze about a
stat1st1cal qu1rk e g 1ndependent product1on and area est1mates
w1th the latter underest1mated due to stat1st1cal confus1on typ1cal
of the early years of the Cultural Revolut1on per1od (1966-77)
Even exclud1ng 1967 and 1968 the data 1nd1cate a marked
1ncrease 1n y1elds from an average of 4 5 tons per hectare (1950 66)
to 9 O tons per hectare (1969-77) or 10 3 tons per hectare (1969 84)
Sorne of th1s 1ncrease per un1t product1v1ty 1s expla1nable 1n terms
of 1n1t1at1on of fert1l1zer appl1cat1on and cult1vat1on of cassava
on state farms w1th plent1ful access to fert1l1zers But state farms
1n Guangx1 occup1ed only 20 thousand hectares (1982) and large
port1ons of th1s total were devoted to cult1vat1on of gra1n crops and
sugar cane 10 It seems unl1kely therefore that 1ncreased
fert1l1zer use alone can fully expla1n th1s y1eld 1ncrease
In the absence of def1n1t1ve 1nformat1on what could expla1n a
sudden doubl1ng of average y1elds 1n the m1d 1960s7 One hypothes1s
would emphas1ze techn1cal change Much of the 1mportant select1on
and breed1ng work was undertaken 1n the late 1950s and early 1960s
10zhongguo GuoJ1a TongJ1JU Zhongguo TongJ1 N1anJ1an 1983 pp
- 13 -
The South Ch1na Trop1cal Crops Research Academy bred or selected many
of the well-known var1et1es under current product1on represent1ng
s1gn1f1cant 1mprovement 1n aggregate speed and quant1ty of root
product1on dur1ng the 1959-62 per1od The South Ch1na Agr1cultural
Sc1ence Academy 1n Guangzhou bred or selected for mult1pl1cat1on and
d1ssem1nat1on several other h1gher y1eld1ng var1et1es dur1ng the
1957-62 per1od 11 Part1cular attent1on pa1d to cassava dur1ng th1s
per1od may also have produced 1mportant results 1n 1mprov1ng f1eld
cult1vat1on techn1ques
Another hypothes1s would suggest that cassava cult1vat1on on
somewhat better land was 1n1t1ated dur1ng th1s perlad The Cultural
Revalut1an decade {1966-77) was marked by a pol1cy af local self
suff1c1ency 1n gra1n product1on and escalat1on of quota del1ver1es
In sorne cases quotas were spec1f1ed 1n terms of part1cular craps
needed by the state In other cases quotas were spec1f1ed only 1n
terms of we1ght of staples leav1ng the cho1ce of crops ta each
collect1v1ty of farmers Although farmers rece1ved compensat1on for
quota del1ver1es pr1ces were notor1ausly low 1nvolv1ng an 1mpl1c1t
tax Land taxes amount1ng ta roughly 5-13 percent of output dur1ng
th1s per1ad depend1ng on locat1on were also payable 1n k1nd Taxes
and quotas were therefore obl1gat1ons to be d1scharged w1th
cammod1t1es ach1ev1ng the h1ghest bulk y1eld per un1t area Although
fresh we1ght af root and tuber crops was d1Vlded by 4 for these
11L1ang Guangshang (ed ) Mushu Za1pe1 yu L1yong pp 77-78
- 14 -
account1ng purposes through 1963 and by 5 thereafter cassava may
have been cult1vated and even fert1l1zed by a w1der var1ety of
local1t1es 111 South Ch1na w1th the express purpose of exped1t1ously
d1scharg1ng these obl1gat1ons 12
The determ1nants of var1at1on dur1ng the f1nal per1od (1978 84)
are somewhat eas1er to 1dent1fy w1th conf1dence The steady growth
1n y1elds 1s almost certa1nly related to an 1ncrease 1n manufactured
fert1l1zer nutr1ent appl1cat1on Although average appl1cat1on levels
for cassava are not known w1th prec1s1on nutr1ent appl1cat1on w1th1n
Ch1na as a whole tr1pled between 1976 and 1984 and doubled between
1978 and 1984 culm1nat1ng w1th an average rate of 120 6 kg /ha of
sown area Eff1c1ency of ut1l1zat1on also 1ncreased dur1ng the
per1od Although the average level 1n Guangx1 was somewhat lower 1t
grew even more rap1dly than the nat1onal average between 1976 and
1982 (to 110 2 Kg /ha ) then stagnated 1n 1983 (112 4 Kg /ha ) and
1984 (109 7 Kg /ha ) parallel1ng y1eld progress 1n Guangx1 13
12For further d1scuss1on of these 1ssues see Bruce Stone Ch1na s 1985 Foodgra1n Product1on Target lssues and Prospects 1n
Anthony M Tang and Bruce Stone Food Product1on 1n the People s Republ1c of Ch1na IFPRI Research Report no 15 (Wash1ngton O e Internat1onal Food Pol cy Research Inst1tute 1980} pp 147 149
13sruce Stone Ch1nese Fert1l1zer Appl1cat1on 1n the 1980s and 1990s Issues of Gro11th Balance Allocat1on Eff1c1ency and Response 1n US eongress Jo1nt Econom1c Comm1ttee (eds ) eh1na s Economy Looks to the Year 2000 vol 1 The Four Modern1zat1ons (\lash1ngton O e U S Government Pr1nt1ng Off1ce 1986 pp 453 496 and State Stat1st1cal Bureau PRe Stat1st1cal Yearbook of eh1na 1985 (Hongkong and Be1J11lg Econom1c Informat1on and Agency and Ch1na Stat1st1cal Informat1on and eonsultancy Serv1ce 1985) p 283
- 15 -
Appl1cat1on of manufactured fert1l1zers to cassava 1s l1kely to
be much below the average level for all crops 1n Guangx1 except on
state farms but scattered survey reports 14 conf1rm that on farmers
f1elds near cassava research 1nst1tut1ons 1n South Ch1na y1elds
wh1ch are comparable to the recent Guangx1 prov1nc1al averages are
only obta1nable w1th fert1l1zer appl1cat1on or under good so1l and
cl1mat1c cond1t1ons atyp1cal of most Ch1nese cassava grow1ng areas
One of the survey respondents however also 1nd1cated that the
cassava research 1n Ch1na had made s1gn1f1cant progress 1n develop1ng
1mproved var1et1es and low-cost cultural pract1ces a decade earl1er
Yet the predom1nant var1et1es planted 1n the 1980s were among those
selected (or bred) dur1ng the late 1950s and early 1960s (see below)
The r1se and fall ln cassava area dur1ng the 1978-84 per1od 1s
attr1butable to a number of factors the most powerful of wh1ch has
been the r1se and fall of opportun1t1es for export to the European
Commun1ty W1th EC pressure on Tha1land (the dom1nant and low cost
suppl1er) to reduce exports dur1ng the late 1970s Ch1nese exports
responded to the opportun1ty w1th rap1d growth 1n 1979 1980 and 1981
UNIDAD DE 11\tUfiMACICI\ Y 14 Delph1 Survey for the Assessment of PotentlalDVlf~1l'tfs1 1bf:IUN
Cassava c1rculated to cassava breed1ng 1nst1tut1ons 1n Ch1na and elsewhere by J S Sarma lnternat1onal Food Pol1cy Research lnst1tute 1986 The respondent who ment1oned var1etal and cultural 1mprovement a decade ago was L1u YlnQJlng of the South Ch1na lnst1tute of Botany 1n Guangzhou
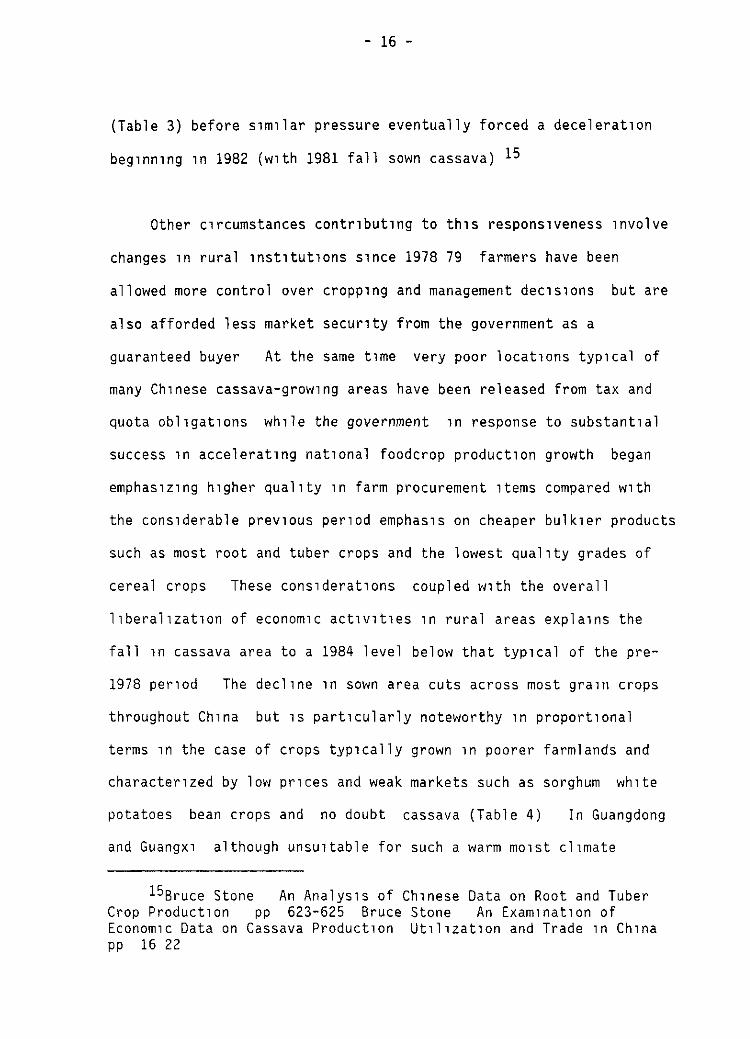
- 16 -
(Table 3) befare s1m1lar pressure eventually forced a decelerat1on
beg1nn1ng 1n 1982 (w1th 1981 fall sown cassava) 15
Other c1rcumstances contr1but1ng to th1s respons1veness 1nvolve
changes 1n rural 1nst1tut1ons s1nce 1978 79 farmers have been
allowed more control over cropp1ng and management dec1s1ons but are
also afforded less market secur1ty from the government as a
guaranteed buyer At the same t1me very poor locat1ons typ1cal of
many Ch1nese cassava-grow1ng areas have been released from tax and
quota obl1gat1ons wh1le the government 1n response to substant1al
success 1n accelerat1ng nat1onal foodcrop product1on growth began
emphas1z1ng h1gher qual1ty 1n farm procurement 1tems compared w1th
the cons1derable prev1ous per1od emphas1s on cheaper bulk1er products
such as most root and tuber crops and the lowest qual1ty grades of
cerea 1 crops These cons1derat1ons coupled w1th the overall
l1beral1zat1on of econom1c act1v1t1es 1n rural areas expla1ns the
fall 1n cassava area to a 1984 level below that typ1cal of the pre-
1978 per1 od The decl1ne 1n sown area cuts across most gra1n crops
throughout Ch1na but 1s part1cularly noteworthy 1n proport1onal
terms 1n the case of crops typ1cally grown 1n poorer farmlands and
character1zed by low pr1ces and weak markets such as sorghum wh1te
potatoes bean crops and no doubt cassava (Table 4) In Guangdong
and Guangx1 although unsu1table for such a warm mo1st cl1mate
15sruce Stone An Analys1s of Ch1nese Data on Root and Tuber Crop Product1on pp 623-625 Bruce Stone An Exam1nat1on of Econom1c Data on Cassava Product1on Ut1l1zat1on and Trade 1n Ch1na pp 16 22
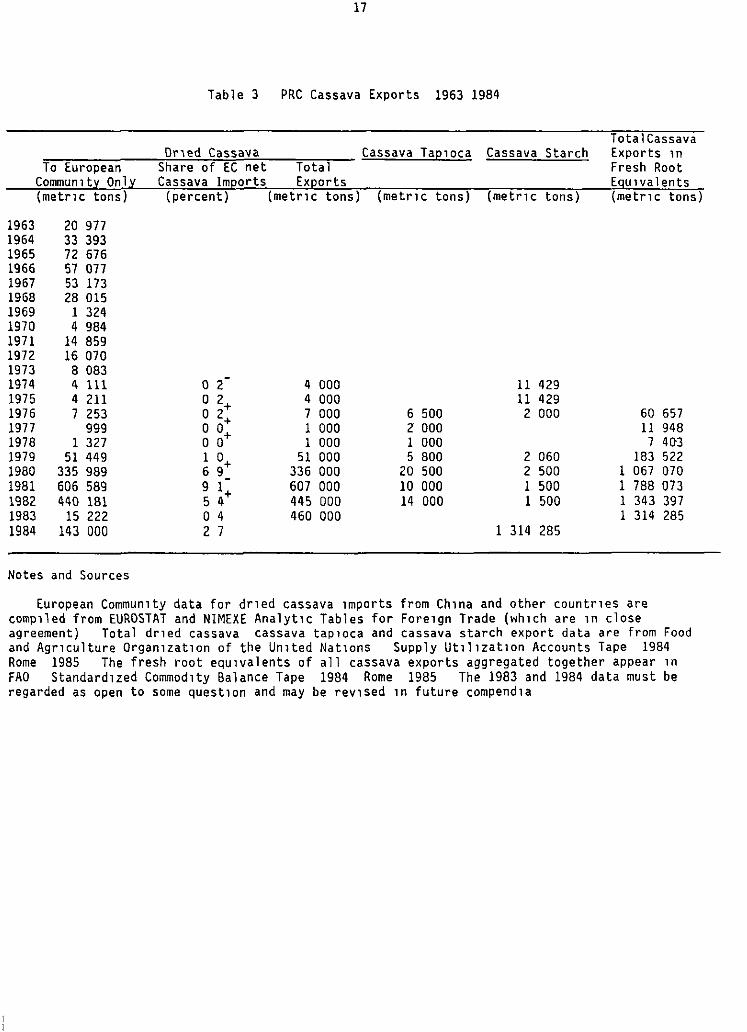
To European Commun1ty OnlY (metr1c tons)
1963 20 977 1964 33 393 1965 72 676 1966 57 077 1967 53 173 1968 28 015 1969 1 324 1970 4 984 1971 14 859 1972 16 070 1973 8 083 1974 4 111 1975 4 211 1976 7 253 1977 999 1978 1 327 1979 51 449 1980 335 989 1981 606 589 1982 440 181 1983 15 222 1984 143 000
Notes and Sources
11
Table 3 PRC Cassava Exports 1963 1984
Dr1ed Cassava Cassava Tap1oca Cassava Starch Share of EC net Total Cassava Imports Exports
(percent) (metr1c tons) (metr1c tons) (metr1c tons)
-o 2 4 000 11 429 o 2+ 4 000 11 429 o 2+ 7 000 6 500 2 000 o o+ 1 000 z 000 o o 1 000 1 000 1 o+ 51 000 5 800 2 060 6 9 336 000 20 500 2 500 9 1~ 607 000 10 000 1 500 5 4 445 000 14 000 1 500 o 4 460 000 2 7 1 314 285
TotalCassava Exports 1n Fresh Root EqulValents (metr1c tons)
60 657 11 948 7 403
183 522 1 067 070 1 788 073 1 343 397 1 314 285
European Commun1ty data for dr1ed cassava 1mports from Ch1na and other countr1es are comp1led from EUROSTAT and NIMEXE Analyt1c Tables for Fore1gn Trade (wh1ch are 1n close agreement) Total dr1ed cassava cassava tap1oca and cassava starch export data are from Food and Agr1culture Organ1zat1on of the Un1ted Nat1ons Supply Ut1l1zat1on Accounts Tape 1984 Rome 1985 The fresh root equ1valents of all cassava exports aggregated together appear 1n FAO Standard1zed Commod1ty Balance Tape 1984 Rome 1985 The 1983 and 1984 data must be regarded as open to some quest1on and may be rev1sed 1n future compend1a
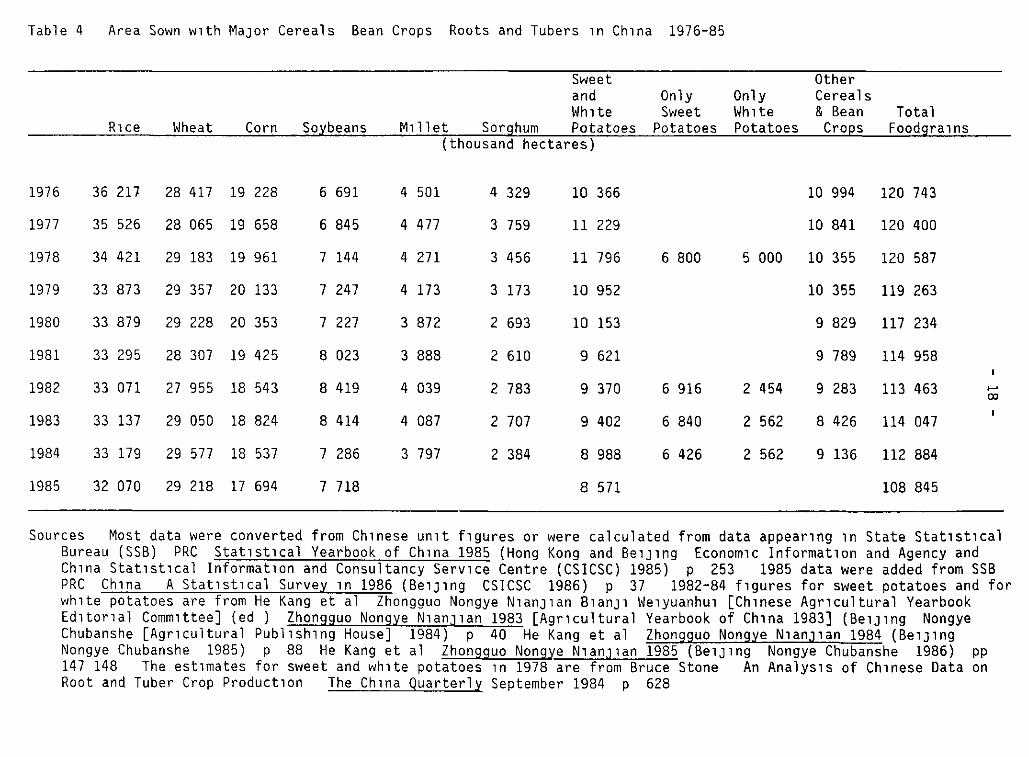
Table 4 Area Sown w1th MaJar Cereals Bean Crops Roots and Tubers 1n Ch1na 1976-85
Sweet Other and Only Only Cereals Wh1te Sweet Wh1te & Bean Total
R1ce Wheat Corn SoybE!ans M1ll et Sorghum Pota toes Pota toes Pota toes Cro~s Foodgra1ns (thousand hectares)
1976 36 217 28 417 19 228 6 691 4 501 4 329 10 366 10 994 120 743
1977 35 526 28 065 19 658 6 845 4477 3 759 11 229 10 841 120 400
1978 34 421 29 183 19 961 7 144 4 271 3 456 11 796 6 800 5 000 10 355 120 587
1979 33 873 29 357 20 133 7 247 4 173 3 173 10 952 10 355 119 263
1980 33 879 29 228 20 353 7 227 3 872 2 693 10 153 9 829 117 234
1981 33 295 28 307 19 425 8 023 3 888 2 610 9 621 9 789 114 958
1982 33 071 27 955 18 543 8 419 4 039 2 783 9 370 6 916 2 454 9 283 113 463 .... CXl
1983 33 137 29 050 18 824 8 414 4 087 2 707 9 402 6 840 2 562 8 426 114 047
1984 33 179 29 577 18 537 7 286 3 797 2 384 8 988 6 426 2 562 9 136 112 884
1985 32 070 29 218 17 694 7 718 8 571 108 845
Sources Most data were converted from Ch1nese un1t f1gures or were calculated from data appear1ng 1n State Stat1st1cal Bureau (SSB) PRC Stat1st1cal Yearbook of Ch1na 1985 (Hong Kong and BelJlng Econom1c Informat1on and Agency and Ch1na Stat1st1cal Informat1on and Consultancy Serv1ce Centre (CSICSC) 1985) p 253 1985 data were added from SSB PRC Ch1na A Stat1st1cal Survey 1n 1986 (BelJlng CSICSC 1986) p 37 1982-84 f1gures for sweet potatoes and for wh1te potatoes are from He Kang et al Zhongguo Nongye NlanJlan 81anJl We1yuanhu1 [Ch1nese Agr1cultural Yearbook Ed1tar1al Comm1ttee] (ed ) Zhongguo Nongye NlanJlan 1983 [Agr1cultural Yearbook of Ch1na 1983] (BelJlng Nongye Chubanshe [Agr1cultural Publ1sh1ng House] 1984) p 40 He Kang et al Zhongguo Nongye N1anJ1an 1984 (BelJlng Nongye Chubanshe 1985) p 88 He Kang et al Zhongguo Nongye N1anJ1an 1985 (BelJlng Nongye Chubanshe 1986) pp 147 148 The est1mates for sweet and wh1te potatoes 1n 1978 are from Bruce Stone An Analys1s of Ch1nese Data on Root and Tuber Crop Product1on The Ch1na Quarterly September 1984 p 628
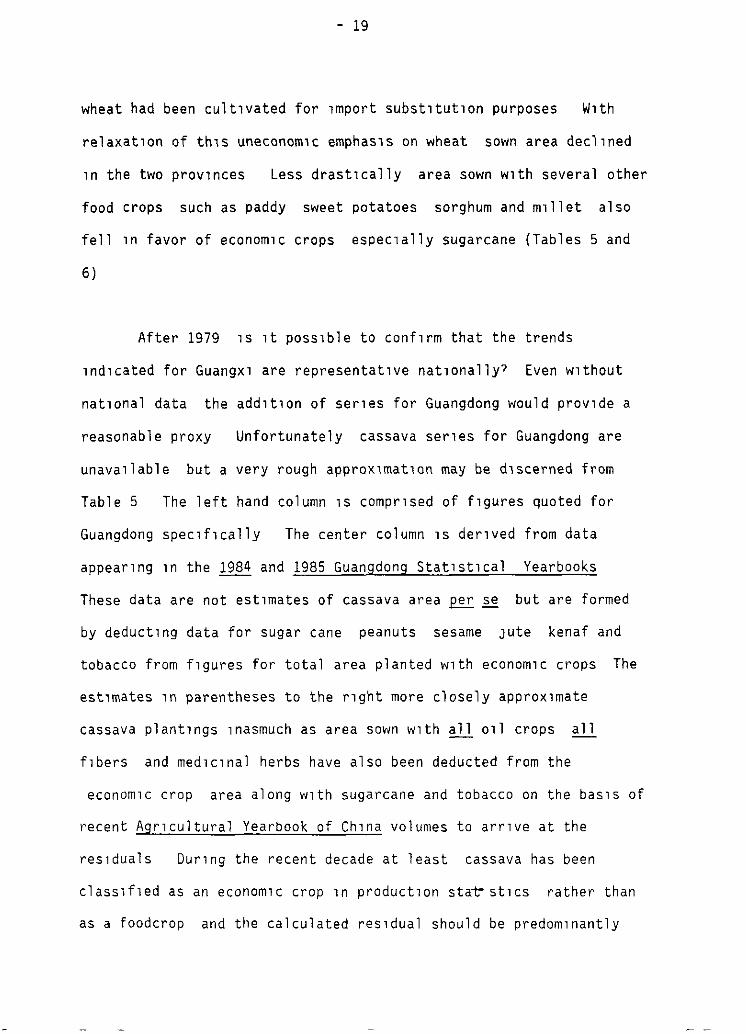
- 19
wheat had been cult1vated for 1mport subst1tut1on purposes W1th
relaxat1on of th1s uneconom1c emphas1s on wheat sown area decl1ned
1n the two prov1nces Less drast1cally area sown w1th several other
food crops such as paddy sweet potatoes sorghum and m1llet also
fell 1n favor of econom1c crops espec1ally sugarcane {Tables 5 and
6)
After 1979 1s 1t poss1ble to conf1rm that the trends
1nd1cated for Guangx1 are representat1ve nat1onally7 Even w1thout
nat1onal data the add1t1on of ser1es for Guangdong would prov1de a
reasonable proxy Unfortunately cassava ser1es for Guangdong are
unava1lable but a very rough approx1mat1on may be d1scerned from
Table 5 The left hand column 1s compr1sed of f1gures quoted for
Guangdong spec1f1cally The center column 1s der1ved from data
appear1ng 1n the 1984 and 1985 Guangdong Stat1st1cal Yearbooks
These data are not est1mates of cassava area ~ se but are formed
by deduct1ng data for sugar cane peanuts sesame JUte kenaf and
tobacco from f1gures for total area planted w1th econom1c crops The
est1mates 1n parentheses to the r1ght more closely approx1mate
cassava plant1ngs 1nasmuch as area sown w1th all o1l crops all
f1bers and med1c1nal herbs have also been deducted from the
econom1c crop area along w1th sugarcane and tobacco on the bas1s of
recent Agr1cultural Yearbook of Ch1na volumes to arr1ve at the
res1duals Dur1ng the recent decade at least cassava has been
class1f1ed as an econom1c crop 1n product1on st~ st1cs rather than
as a foodcrop and the calculated res1dual should be predom1nantly
20 -
- o ~ ~ ::¡ g :;; ~ "' ~ "' "' " "' "' " " - o
~ ~ ~ - ~ - - ,. = ~ ~ ~ - " - -~ o "' ~ -:: o o = g " o o - o "' ~
~ ~
" - " ª - - - = "' -- "' --~ - " - o ~
" "' -" -"' - -- ~ - " - = - - - " ~ -" -- -
"' o ;¡; o - "' - " :: "' "' " " - = ¡¡; - :'; - -
"' :: " - - - - "' -¿"'
"' - e
"' o " "'
~ " " o
"' -- " -" ~ _Jil::: - -- o
~ ~ E "
~
"" o g -" g g g ::; " " - -"' ~ - - - -- -o ---:; ;; -- - ¡;; ;;
"' "
::; :; :;; -" O; :;; O; ~ -:; "' ,. :0 " " ;;: " ~ :0 :: o ¡:; o
"' -~ ;; -~
"' "' ;;; = "' :;, ¡; -" -;¡: " :;; ~ "' = ~ ~ ~ g " ~ " - ;:; -O; " - " !;< -
"' --= o - "' = -"' -" -
o ~ ~ " = - - - ~ " "' -o - - O; O; -" " "' "' ~ :;;
:¡: = ~ :;; " -:¡:
"' - "' " "' - - - " "' " "' " -" - :: -"' :;; O; - " O; :¡; :;; "
~ o :; :;; g 3 :;; ~ ;;;
" " :: ::; ~ -- - - = ~ o - ~ = -- - - - - "' -
-" g o ;:: " - "' -"' " ;:: -" " -- - --:; ; "' = " - - - - - - "' --;;: ;;: "' g "' "' :;; " g " - O; :; :; ~
"' o -~ - "' -~ - " ~ ~ o ¡>¡ " - - - - - - - :0 .. -
.¡ " " --¡ " --= -1 .,
= ~1~ ~r -
- 1 = -1
~~--;¡- ~ ~ ~ - "' ;1" - ~ ~ ~ -~ --
" ,¡ -1 ' 1 " "
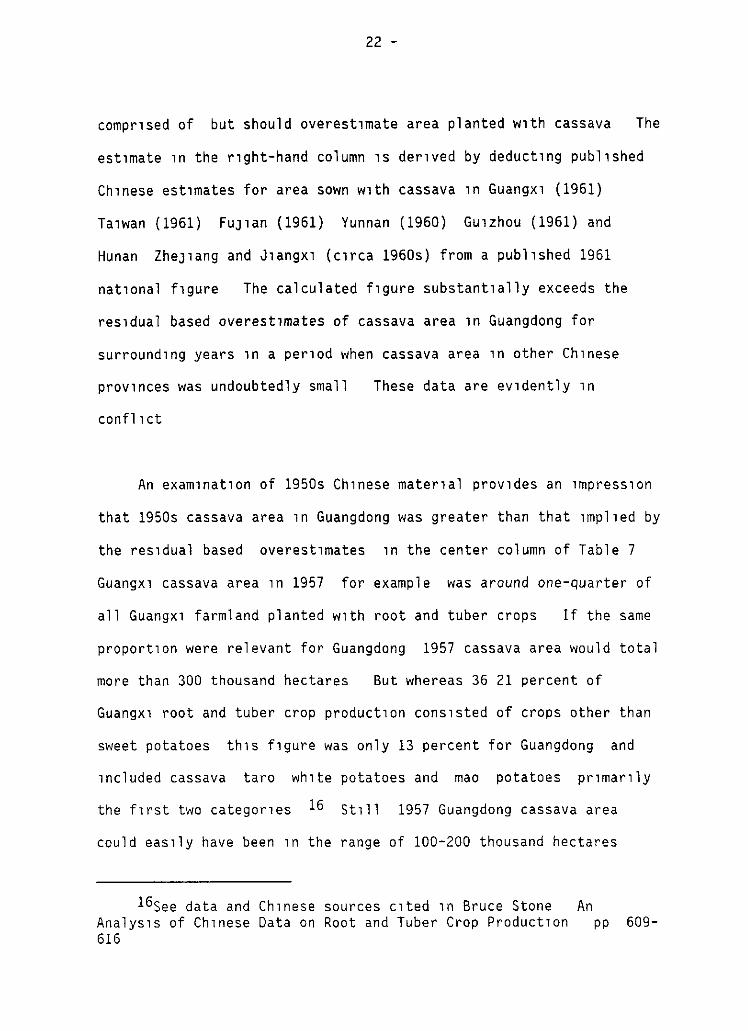
22 -
compr1sed of but should overest1mate area planted w1th cassava The
est1mate 1n the rlght-hand column 1s der1ved by deduct1ng publ1shed
Ch1nese est1mates for area sown w1th cassava 1n Guangx1 (1961)
Ta1wan (1961) FUJlan (1961) Yunnan (1960) Gu1zhou (1961) and
Hunan ZheJlang and J1angx1 (c1rca 1960s) from a publ1shed 1961
nat1onal f1gure The calculated f1gure substant1ally exceeds the
res1dual based overest1mates of cassava area 1n Guangdong for
surround1ng years 1n a perlad when cassava area 1n other Ch1nese
prov1nces was undoubtedly small These data are ev1dently 1n
conf11ct
An exam1nat1on of 1950s Ch1nese mater1al prov1des an 1mpress1on
that 1950s cassava area 1n Guangdong was greater than that 1mpl1ed by
the res1dual based overest1mates 1n the center column of Table 7
Guangx1 cassava area 1n 1957 for example was around one-quarter of
all Guangx1 farmland planted w1th root and tuber crops If the same
proport1on were relevant for Guangdong 1957 cassava area would total
more than 300 thousand hectares But whereas 36 21 percent of
Guangx1 root and tuber crop product1on cons1sted of crops other than
sweet potatoes th1s f1gure was only 13 percent for Guangdong and
1ncluded cassava taro wh1te potatoes and mao potatoes pr1mar1ly
the f1rst two categor1es 16 St1ll 1957 Guangdong cassava area
could eas1ly have been 1n the range of 100-200 thousand hectares
16see data and Ch1nese sources c1ted 1n Bruce Stone Analys1s of Ch1nese Data on Root and Tuber Crop Product1on 616
An PP 609-
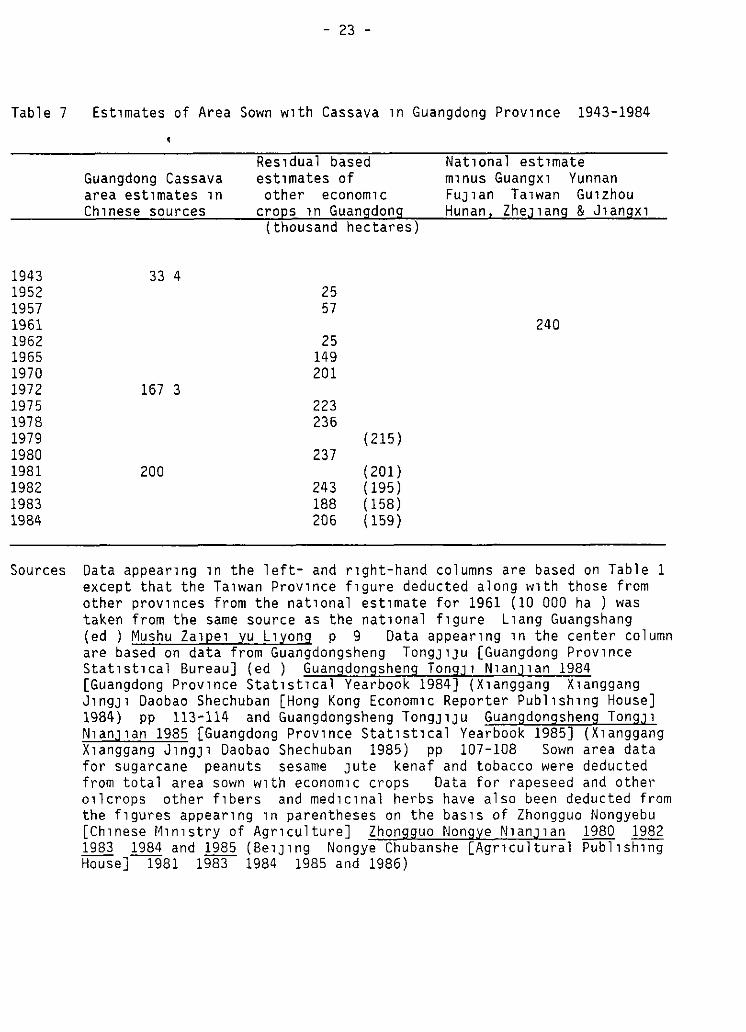
Table 7
- 23 -
Est1mates of Area Sown w1th Cassava 1n Guangdong Prov1nce 1943-1984
Guangdong Cassava area est1mates 1n Ch1nese sources
Res1dual based est1mates of other econom1c
crops 1n Guangdong (thousand hectares)
Nat1onal est1mate m1nus Guangx1 Yunnan FUJ1an Ta1wan Gu1zhou Hunan, ZheJ1ang & J1angx1
1943 33 4 1952 25 1957 57 1961 240 1962 25 1965 149 1970 201 1972 167 3 1975 223 1978 236 1979 (215) 1980 237 1981 200 {201) 1982 243 {195) 1983 188 {158) 1984 206 (159)
Sources Data appear1ng 1n the left- and r1ght-hand columns are based on Table 1 except that the Ta1wan Prov1nce f1gure deducted along w1th those from other prov1nces from the nat1onal est1mate for 1961 (10 000 ha ) was taken from the same source as the nat1onal f1gure L1ang Guangshang (ed ) Mushu Za1pe1 yu L1yong p 9 Data appear1ng 1n the center column are based on data from Guangdongsheng TongJ1JU [Guangdong Prov1nce Stat1st1cal Bureau] {ed ) Guangdongsheng TongJ1 N1an]1an 1984 [Guangdong Prov1nce Stat1st1cal Yearbook 1984] (X1anggang X1anggang J1ngJ1 Daobao Shechuban [Hong Kong Econom1c Reporter Publ1sh1ng House] 1984) pp 113-114 and Guangdongsheng TongJ1JU Guangdongsheng TongJ1 N1anJ1an 1985 [Guangdong Prov1nce Stat1st1cal Yearbook 1985] (X1anggang X1anggang J1n9J1 Daobao Shechuban 1985) pp 107-108 Sown area data for sugarcane peanuts sesame Jute kenaf and tobacco were deducted from total area sown w1th econom1c crops Data for rapeseed and other o1lcrops other f1bers and med1c1nal herbs have also been deducted from the f1gures appear1ng 1n parentheses on the bas1s of Zhongguo Nongyebu [Ch1nese t~1n1stry of Agr1culture] Zhongguo Nongye N1anJ1an 1980 1982 1983 1984 and 1985 (Be1Jlng Nongye Chubanshe [Agr1cultural Publ1sh1ng House]--r981 1983 1984 1985 and 1986)
- 24 -
Dur1ng the 1950s cassava was treated expl1c1tly as shule1
[1nclud1ng both tuber crops and tuberous roots] ,
wh1ch 1n turn were
class1f1ed as l1angsh1 [staple food crops] occas1onally as part of
m1scellaneous gra1ns By the m1d-1970s however 1t 1s clear that
cassava was excluded from shule1 and l1angsh1 stat1st1cs and
1ncorporated as a sub-category or as a res1dual w1th1n J1ngJ1 zuowu
[econom1c crops] The trans1t1on date has not been clearly
determ1ned although 1964 and 1976 have been suggested as cand1dates 17
In v1ew of the trends exh1b1ted for Guangx1 1n Table 2 and the
forego1ng d1scuss1on attempt1ng to resolve the confl1ct 1mpl1ed 1n
Table 7 1t seems l1kely that the 1950s econom1c crop stat1st1cs
appear1ng 1n the Guangdong Prov1nce Stat1st1cal Yearbooks though
recently publ1shed are unl1kely to have been adjusted for 1nclus1on
of cassava hence the center column cannot be used as a proxy for
cassava area for the 1950s nor probably for 1962 From 1965 onward
however these res1duals may well prov1de the best 1nd1cat1on of
trends 1n (though not exact est1mates of) Guangdong cassava area
s1nce cassava 1s l1kely to dom1nate the category It should be
noted however 1n v1ew of econom1c l1beral1zat1on s1nce 1979 that
the d1vergence of th1s res1dual ser1es and actual cassava area 1s
l1kely to have 1ncreased espec1ally s1nce the decl1ne 1n export
opportun1t1es 1n the early 1980s
pp 600 604
- 25 -
Unfortunately desp1te the ava1lab1l1ty of an off1c1al cassava
ser1es for Guangx1 and a rough approx1mat1on of trends for Guangdong
1t 1s st1ll not poss1ble to be def1n1t1ve about nat1onal trends for
Ch1na It 1s clear that cassava was planted on less than 100
thousand hectares 1n the m1d 1940s r1s1ng qu1ckly to perhaps around
250 thousand hectares by 1957 and 355 thousand hectares (exclud1ng
Ta1wan) by 1961 dur1ng the fam1ne Total plant1ngs on the Ch1nese
ma1nland probably subs1ded to roughly 300 thousand hectares by 1965
and were certa1nly not much lower 1n 1972 when plant1ngs 1n Guangdong
and Guangx1 alone totalled 292 thousand Off1c1al area sown w1th
cassava 1n the two southern prov1nces seems to have r1sen to 370
thousand hectares 1n 1979 perhaps peak1ng 1n 1980 at 410-420
thousand hectares subs1d1ng to 390 tha and 370 tha 1n 1981 and 1982
and plummet1ng to 275 tha and 250 tha 1n 1983 and 1984
But whether cassava area rose apprec1ably outs1de of these two
southern prov1nces s1nce the early 1960s 1s not clear The (undated}
total of 350 thousand hectares g1ven to the ClAT delegat1on by
Ch1nese cassava breeders 1n spr1ng 1982 would 1mply that 1t has not
wh1le the (undated) Inst1tute of Geography est1mate (around 500
thousand hectares) publ1shed 1n 1980 suggests e1ther cons1derable
expans1on 1nto other prov1nces or more aggress1ve est1mates of non
f1eld cult1vat1on Barr1ng the unl1kely event of relat1vely even
d1str1but1on among other ment1oned prov1nces off1c1ally recorded
plant1ngs of 120-190 thousand hectares outs1de of Guangdong and
Guangx1 1mpl1ed by the lnst1tute f1gure and the prov1nc1al est1mates
- 26 -
would surely have been ment1oned by the breeders or 1n cassava
related publ1cat1ons wh1le the 350 thousand hectare f1gure though
purportedly 1nclud1ng an est1mate for cassava on pr1vate plots does
not even appear to cover probable plant1ngs 1n the two southern
prov1nces
Part of the problem 1s that cassava area 1s undoubtedly more
d1ff1cult to est1mate than that of most f1eld crops s1nce
cons1derable proport1ons are grown on pr1vate plots on narrow str1ps
adJacent to roads and f1elds on h1lly and 1ncompletely cleared land
not yet or normally cons1dered farmlands and on t1ny corners not
even counted among pr1vate plot stat1st1cs There 1s even sorne
1llegal cult1vat1on under trees on state rubber plantat1ons for
example 18 The Inst1tute of Geography f1gure probably 1ncorporates a
more aggress1ve est1mate based on sorne survey ev1dence of these
k1nds of plant1ngs wh1ch 1n large part elude off1c1al stat1st1cal
coverage
All that can be cla1med w1th near certa1nty 1s that nat1onal
cassava plant1ng reached another maJar peak 1n the late 1970s or
early 1980s and then decl1ned rap1dly w1th the subs1dence of
opportun1t1es for 1nternat1onal trade 1ncreas1ng l1beral1zatJon of
rural econom1c act1v1t1es and a probable cut back 1n the government s
role 1n cassava market1ng
18op Clt p 621
27 -
Nat1onal product1on trends are even less d1scern1ble The only
ava1lable f1gure for recent product1on 1s 3 rn1ll1on tons prov1ded to
the CIAT delegat1on 1n spr1ng 1982 19 although l1ke the 350 thousand
hectare f1gure prov1ded at the sarne t1rne 1t rnay well be an
underest1rnate The best 1nd1cat1on of nat1onal y1eld trends 15
undoubtedly the Guangx1 ser1es 1n Table 2 w1th sorne reservat1ons
about a few of the years such as 1967 and 1968 The nat1onal average
1rnpl1ed by the f1gures g1ven to the CIAT delegat1on 1s 8 6 tons per
hectare suggest1ng that average y1elds 1n Guangdong and elsewhere
are lower than 1n Guangx1 But th1s cornpar1son too cannot be taken
too l1terally s1nce the four to f1ve tons per hectare 1981 Guangdong
average suggested by such an exerc1se 1rnpl1es too great a d1vergence
between Guangx1 and Guangdong part1cularly 1n v1ew of greater
general ava1lab1l1ty of fert1l1zer 1n the latter prov1nce
W1th1n these two southern prov1nces sorne of the pr1nc1pal
cassava-grow1ng areas can be 1dent1f1ed The f1rst record of Ch1nese
cassava cult1vat1on was 1n 1820 1n Gaozhou County part of ZhanJ1ang
Prefecture 1n southwe5tern Guangdong 20 Gaozhou 15 not a coa5tal
county and earl1er cult1vat1on 1s ent1rely po5s1ble In the 19505
there 15 cont1nued record of cassava 1n ZhanJ1ang Prefectura where
uplands const1tuted 27 5 percent of cult1vated land a greater
19Jarnes H Cock and Kazuo Kawano Cassava 1n Ch1na unpubl1shed tr1p report Internat1onal Center fo1 Trop1cal Agr1culture Palm1ra Colomb1a June 1982 p 1
20L1ang Guangshang (ed ) r1ushu Za1pe1 yu L1yong p 4
- 29
been grawn there at least s1nce 1912 when a well-knawn Malays1an
var1ety was 1ntraduced 1nta Dan X1an rubber plantat1ans Accard1ng
ta 1951 stat1st1cs raats and tubers accaunted for 38 5 percent af
gra1n cansumpt1an 1n pla1ns areas af the Island and 69 8 percent 1n
h1lly d1str1cts paddy r1ce prav1d1ng mast of the rema1nder 1n bath
cases 22
In Guangx1 cassava was generally d1str1buted 1n the XunJlang
and L1UJ1ang Valleys (east central Guangx1) character1zed by
relat1vely barren draught-prane land Yet y1elds af 7 5 15 O tons
per hectare were c1ted It was used as food feed and ta produce
starch for catton yarn 1n the c1ty af Wuzhau 1n east central Guangx1
on the Guangdang barder where Guangx1 s f1rst starch factary was
apened 1n 1952 Cassava was alsa w1dely planted 1n southeastern
Guangx1 and alang the sauthern coast espec1ally Hepu Caunty and the
suburbs af Be1ha1 an the southeast coast But althaugh Be1ha1 and
\luzhou rema1ned maJar centers by the mld-ta-late 1950s cassava
starch factar1es and cansequently expanded cassava cult1vat1an had
spread w1dely 1n the Autanamaus Reg1an 1nclud1ng N1ngm1ng 1n the
sauthwest Barna Yaazu Autanamaus Caunty taward the narthwest and
Wum1ng 1n the center af the Reg1an 23 In Yunnan cassava cult1vat1an
1n 1960 was recarded 1n Hekau Yaozu Autanomous County 1n the south
22ap c1t transfer below
pp 137 138 and p 201 See deta1ls of var1etal
c1t pp 258 and 333-334 GuangYl J1ng]1 NlanJlan Guangx1 J1ng]1 N1an]1an 1985 p 192
- 28 -
proport1on than 1n other Guangdong Prefectures Su1x1 County and the
ZhanJlang c1ty suburbs (where uplands compr1sed 12 percent) 1n the
center of the prefecture and Xuwen County on the southern t1p of the
Le1zhou Pen1nsula are ment1oned 1n 1950s l1terature on cassava but
the crop may have been grown more generally throughout the gra1n
def1c1ent Le1zhou Pen1nsula and 1n the uplands adJacent to the
J1anJ1ang Pla1n where m1scellaneous gra1ns (80 9 percent of wh1ch
were root or tuber crops) compr1sed 44 percent of staple foodcrop
product1on 1n 1955 Throughout the ZhanJlang Prefecture and enclosed
mun1c1pal areas root and tuber crops (valued at one-fourth fresh
we1ght) const1tuted only 28 percent of staple crop product1on wh1ch
occup1ed 95 percent of sown area Sweet potatoes were the pr1nc1pal
root crop however w1th cassava and mao potatoes compr1s1ng a
l1ttle less than 5 percent of root and tuber crop product1on 21
But cassava cult1vat1on clearly was not l1m1ted to southwestern
Guangdong 1n the 1950s There 1s also record 1n the Econom1c
Geography of South Ch1na (1959) of cassava and taro be1ng grown 1n
the mounta1nous uplands surround1ng the Su1 and X1 R1ver Valleys 1n
West Central Guangdong notably Hua1Jl Guangn1ng S1hu1 Gaoyao and
Oeq1ng Count1es all 1n Zhaoq1ng Prefecture Cassava was not
spec1f1cally ment1oned 1n the d1scuss1on of Ha1nan lsland but has
21sun J1ngzh1 {ed ) Huanan D1chu J1ngJ1 D1l1 [Econom1c Geography of South Ch1na] (BelJlng Kexue Chubanshe [Sc1ent1f1c Publ1sh1ng House] 1959) Translated 1n Jo1nt Publ1cat1ons Research Serv1ce August 24 1969 no 14954 pp 137 138 and 178 179 \lhen these stat1st1cs were gathered the reg1on 1ncluded the Q1nzhou Spec1al 01str1ct encompass1ng known cassava grow1ng areas such as Hepu County and the Be1ha1 suburbs
- 30
along the V1etnamese border 1n Dehong Da1zu J1ngpozu Autonomous
Prefecture 1n the west along the Burmese border and elsewhere 24
By 1972 Zhaoq1ng Prefecture had taken over as the pr1nc1pal
cassava grow1ng reg1on of Guangdong account1ng for 57 thousand
hectares or 33 9 percent of the prov1nc1al f1gure for that year
ZhanJlang Prefecture was next w1th 33 thousand hectares or 19 5
percent The rema1n1ng 77+ thousand hectares were d1str1buted
throughout Guangdong 1nclud1ng Ha1nan Island and Shaoquan Me1x1an
Shantou Foshan and Hu1yang Prefectures Sorne of these secondary
reg1ons 1ncreased cassava plant1ngs rap1dly 1n the late 1970s
Cassava area 1n Me1x1an Prefecture for example 1n the northeast
cerner of the prov1nce grew from 10 800 hectares 1n 1977 to 40 000
hectares 1n 1978 25
In spr1ng of 1982 a delegat1on of cassava breeders from the
Internat1onal Center for Trop1cal Agr1culture (CIAT) v1s1ted a number
of cassava grow1ng areas 1n Guangdong 1nclud1ng Ba1sha County and
Ha1kou Mun1c1pal1ty en Ha1nan Island three state farms 1n ZhanJlang
Prefecture and Dongguan County (Hu1yang Prefecture) en the Pearl
R1ver Delta Sorne 1mpress1on of area trends en the Delta can be
obta1ned from stat1st1cs for Dongguan Cassava plant1ngs decl1ned
from 8 600 ha (1957) te 4 600 ha (1977) w1th much of the decl1ne
occurr1ng 1n the 1970s Cassava area then fell even more rap1dly te
24Llang Guangshang (ed ) Mushu Za1pe1 yu L1yong p 9
251bld
31 -
3 157 4 ha 1n 1978 then 3 100 ha (1981) and 2 816 8 (1982) But
on the other s1de of the Delta 1n Ta1shan (Foshan Prefecture)
cassava was not grown on a large scale unt1l recently And Fucheng
Commune (w1th1n Dongguan County) cassava area fell from 500 to 367
hectares between 1980 and 1981 but recovered to 434 ha 1n 1982 26
Y1elds observed by the CIAT delegat1on were generally 1n the 6
to 8 ton/ha range but 20-25 tons/ha was cla1med for sorne state
farms and exper1ment stat1ons 27 Average y1elds for Dongguan County
on the Delta were 11 73 tons/ha 1n 1978 and 15 76 tons 1n 1982
Fucheng Commune w1th1n Dongguan County cla1med around 15 tons/ha 1n
1980 14 43 tons/ha 1n 1981 and 17 75 tons/ha 1n 1982 28 In
Guangdong generally w1th 1200 1800 mm of annual ra1nfall y1elds on
farmer s f1elds w1th poor so1ls have been est1mated by one Ch1nese
breeder to fall typ1cally between 5 to 7 tons per hectare and between
10 to 13 tons under good cl1mat1c cond1t1ons and so1l cond1t1ons
Throughout Southern Ch1na (800-2000 mm/yr annual ra1nfall) y1elds are
est1mated by another breeder to be 5 to 9 tons per hectare on poor
so1ls and 15 30 tons/ha (avg 20 tons/ha ) under good cond1t1ons
W1thout fert1l1zer or 1rr1gat1on however poor so1l y1elds were
reported to be 3 to 6 tons/ha (average 4 tons) and for good so1ls
26cock and Kawano Cassava 1n As1a op c1t The 1957 1977 and 1981 f1gures for Dongguan County are from p 13 The 1978 and 1982 data the Fucheng Commune data and the 1mpress1ons for the 1970s and for Ta1shan are from Prof Graham Johnson Dept of Anthropology and Soc1ology Un1vers1ty of Br1t1sh Columb1a correspondence Sept 19 1983
27cock and Kawano Cassava 1n Ch1na p 1
28Graham Johnson op Clt
32 -
w1th good weather 12 to 18 tons/ha In Zhaoq1ng and Shaoiuan
Prefectures (1450-1700 mm/yr avg ra1nfall) farmers y1elds w1thout
fert1l1zer and 1rr1gat1on were reported by an agronom1st spec1al1z1ng
1n cassava to average 6 4 tons/ha under poor cond1t1ons and 11 2
tons/ha under good cond1t1ons W1th fert1l1zer but w1thout
1rr1gat1on these averages rose to 11 69 tons/ha and 19 7 tons/ha
w1th ranges of around 4 tons/ha Average y1elds on research stat1ons
run 2 to 10 tons per hectare h1gher than those quoted above for
farmers f1elds 29
These data 1n sum would seem to suggest that most cassava 1n
Guangdong 1s grown on poor land espec1ally uplands and unt1l
recently rarely rece1ved much fert1l1zer Total cassava area has
fallen dur1ng the past decade or so on better lands such as those
typ1cal of the Pearl R1ver Delta (w1th scattered temporary except1ons
dueto the short-l1ved EC export opportun1t1es) lead1ng to sorne
decl1ne 1n the average qual1ty of farmland grow1ng cassava Th1s
decl1ne has been more than counterbalanced by the 1ncrease 1n
fert1l1zer appl1cat1on to cassava 1n recent years such that average
y1elds (though not necessar1ly total product1on) have 1ncreased
sharply The h1gher cassava y1elds on state farms and for pr1vate
and cooperat1ve farm1ng 1n the Pearl R1ver Delta locat1ons l1ke
29Delph1 survey responses sent to J S Sarma (IFPRI) for Shaoquan and Zhaoq1ng Prefectures by Huang X1 of the Inst1tute of Drought Gra1n Crops Guangdong Prov1nce Academy of Agr1cultural Sc1ences Guanzhou June 28 1986 for Guangdong by L1u YlnQJlng of the South Ch1na Inst1tute of Botany Ch1nese Academy of Sc1ences Guangzhou June 30 1986 and for South Ch1na Academy of Trop1cal Crops Pesearch Dan X1an Ha1nan lsland June 20 1986
33 -
Dongguan County are part1ally expla1nable 1n terms of greater access
to (and more attract1ve relat1ve pr1ces for) manufactured
fert1l1zers as well asto often better so1l and h1gher standards of
agronomy But an add1t1onal 1mportant factor relates to var1etal
adopt1on An espec1ally small port1on of cassava grown on state
farms and on the Delta 1s l1kely to be ut1l1zed for d1rect human
consumpt1on so there 1s l1ttle reason for managers and farmers to
cult1vate the lower y1eld1ng sweeter var1et1es character1zed by low
cyan1de and h1gher prote1n content as well as greater overall
palat1b1l1ty (see below) The argument 1s at least part1ally
relevant for Zhaoq1ng and &
Shao~uan Prefecturas wh1ch are becom1ng
one of Guangdong s maJor reg1ons for process1ng 1ndustr1es ut1l1z1ng
cassava and for s1m1lar reasons east central and southern Guangx1
h1stor1cally among the pr1nc1pal cassava grow1ng areas w1th1n the
Autonomous Reg1on
Cassava product1on systems
Cassava 1n Ch1na 1s grown both extens1vely and 1n small plots
and scattered plant1ngs Extens1ve cult1vat1on 1s most notable on
but by no means conf1ned to state farms and 1s pr1nc1pally
assoc1ated w1th starch product1on the domest1c an1mal feed market
and exports Outs1de the state farm sector w1th the formal
d1ssolut1on of the communes 1n favor of the household product1on •
respons1b1l1ty system 1t 1s safe to assume that extens1ve
cult1vat1on has decl1ned somewhat s1nce the earl; 1980s However
- 34 -
Graharn Johnson has po1nted out 30 that rural reforrns have 1n sorne
1nstances strengthened rather than weakened cooperat1on 1n South
Ch1na so 1t cannot be assurned that extens1ve cult1vat1on 1n the old
cooperat1ve sector has d1sappeared
S1nce the forrnat1on of agr1cultural producers cooperat1ves
(1954-56} and the people s cornrnunes (1958} collect1ve lands
const1tut1ng the vast rnaJor1ty of Ch1nese farrnlands have been
cult1vated cornrnunally However the 54 thousand cornrnunes have
norrnally not been the pr1nc1pal cult1vat1on un1t More often srnaller
un1ts the 719 thousand br1gades or rnost cornrnonly the 56 rn1ll1on
product1on tearns have cult1vated as cooperat1ve groups A product1on
tearn norrnally cons1sted of around th1rty farrn farn1l1es (an average of
139 people) that pooled usually cont1guous land and shared
cult1vat1on respons1b1l1t1es 31 The pr1nc1pal farrn un1t var1ed
geograph1cally 1n s1ze but by the late 1970s averaged around 8 6
hectares 1n Guangdong and 8 9 hectares 1n Guangx1 and certa1nly less
1n the very densely populated Pearl R1ver Delta of Guangdong 32
30Graharn E Johnson Ch1nese Agr1culture Sorne vol 55 no 3 (Fall) 1982
The Product1on Respons1b1l1ty Systern 1n Exarnples from Guangdong Pac1f1c Affa1rs
pp 430 449
31zhongguo GuoJ1a TongJ1JU [State Stat1st1cal Bureau of Ch1na] Zhongguo TongJ1 N1anJ1an 1983 [Stat1st1cal Yealbook of Ch1na 1983] (Be1J1ng TongJ1 Chubanshe [Stat1st1cal Publ1sh1ng House] 1983) p 147
321b1d pp 77-79
p 148 D1l1 YanJ1usuo Zhongguo Nongye D1l1 Zonglun
- 35 -
S1nce the early 1980s however cult1vat1on of collect1ve lands
1s no longer a communal respons1b1l1ty but has been delegated to
several spec1al1zed households Normally 1t 1s the part1cularly
sk1lled farmer who 1s entrusted w1th respons1b1l1ty for farm1ng
collect1ve lands But 1n relat1vely advanced communes or 1n suburban
areas non-agr1cultural act1v1t1es w1th h1gher 1ncome earn1ng
potent1al attract the most able workers
As1de from collect1ve lands 1nd1v1dual farm fam1l1es ma1nta1n
pr1vate plots of normally O 03 O 05 hectares wh1ch are used pr1mar1ly
for fam1ly product1on of food 1tems espec1ally vegetables and
l1vestock products (and consequently fodder for the latter) Although
no est1mates are ava1lable for cassava cult1vat1on on such lands the
1mportance of cassava as a sw1ne feed the cons1derable 1mportance of
sw1ne 1n the l1vestock economy of South Ch1na and the dom1nance of
fam1ly-owned and managed sw1ne w1th1n the sw1ne husbandry sector
suggest that pr1vate plot cult1vat1on of cassava 1n South Ch1na 1s
not tl 1v1al
In add1t1on to formally establ1shed pr1vate plots ass1gned to
each fam1ly there appears to be cult1vat1on of cassava on an even
more fragmentary bas1s on narrow str1ps adJacent to roads and
f1elds on steep h1lls1des and other areas not formally counted among
cult1vated lands and 1llegally 1n econom1c forests reclamat1on areas
and other lands managed by the state The latter may be
d1st1ngU1shed h011ever from planned cult1vat1on on such lands by the
State Falm and Reclamat1on Bureau \lh1le land 1s be1ng cleared and
- 36
recla1med cassava 1s often grown as an 1ntermed1ate crop for a few
years unt1l 1t 1s d1scont1nued when f1eld transformat1on progress
allows cult1vat1on of the pr1nc1pal crop 33
F1nally cassava 1s planted as a f1eld crop on state farms
There 1ts cult1vat1on 1s espec1ally extens1ve and 1s character1zed by
h1gh standards of agronomy and abundant appl1cat1on of modern 1nputs
part1cularly fert1l1zers V1s1tors 1nterested 1n cassava are often
brought to state farms to v1ew extens1ve cult1vat1on and h1gh y1elds
but state farm plant1ngs rema1n a small proport1on of total cassava
area Cult1vated area on state farms 1n Guangdong var1ed between
only 60 and 64 thousand hectares from 1981 to 1984 and rema1ned at
20 thousand hectares 1n Guangx1 In 1984 state farm sown area 1n
Guangdong was only 86 900 hectares or less than 1 8 percent of tho
prov1nc1al total of wh1ch 72 200 hectares were planted w1th cereals
beans sweet and wh1te potatoes o1lcrops and sugarcane leav1ng a
res1dual of 14 700 hectares wh1ch could have been planted w1th
cassava vegetables green manure other fodder crops or other
southern 1ndustr1al crops such as s1sal hemp In Guangx1 state farm
sown area was only 17 400 hectares or less than O 5 percent of the
reg1onal total of wh1ch the res1dual category 1nclud1ng cassava
33Bruce Stone An Analys1s of Ch1nese Data on Root and Tuber Crop Product1on The Ch1na Quarterly September 1984 p 621 L1ang Guangshang (ed ) Mushu Za1pe1 yu L1yong p 36 Bruce Stone An Exam1nat1on of Econom1c Data on Ch1nese Cassava Product1on Ut1l1zat1on and Trade
- 37 -
compr1ses but 3 300 hectares 34 Thus pr1vate and collect1ve
plant1ngs dom1nate cassava area 1n Ch1na
Ava1lable 1nternat1onal data on cassava ut1l1zat1on 1n Ch1na 1s
unrel1able but 1t 1s clear that an1mal (espec1ally sw1ne but also
cattle f1sh and s1lkworm) feed 1s assoc1ated w1th each of the
cassava product1on systems Exports and starch product1on as well as
less trad1t1onal 1ndustr1al and process1ng uses are assoc1ated w1th
collect1ve product1on and the state farms wh1le d1rect human
consumpt1on 1s assoc1ated w1th pr1vate product1on and the collect1ve
sector 1n poorer areas Mach1ne cult1vat1on 1s assoc1ated w1th a
port1on of the extens1ve plant1ngs between 100 m and 300 m above sea
level Between 300 m and 1 000 m cassava 1s grown 1n rotat1on w1th
dryland crops as far as 30°N Most cassava 1n Ch1na 1s un1rr1gated
but the cl1mate prov1des adequate mo1sture 1n most years and
locat1ons Th1s 1s espec1ally true 1n the south where fall-planted
cassava 1s common 35
Cassava 1s cult1vated year round 1n South Ch1na w1th the
pr1nc1pal plant1ngs concentrated 1n spr1ng and fall The plant1ng
mater1al may be e1ther freshly cut stakes or stored mater1al
Storage 1s pract1ced by cutt1ng long stakes wh1ch may e1ther be left
1n the sun 1n bundles or placed under trees Cutt1ngs are fa1rly
34Ch1na Agr1cultural Yearbook Ed1tor1al Board Ch1na Agr1cultural Yearbook 1985 (BelJlng Agr1cultural Publ1sh1ng House 1986) pp 114 and 185-186
35L1ang Guangshang (ed ) f1ushu Za1pe1 yu L1yong p 36
38 -
short (10-15 cm) w1th m1n1mal select1on Plant1ng 1s fa1rly deep (up
to 10 cm and hor1zontal) Germ1nat1on var1es cons1derably by
locat1on but 1s frequently very poor and strands are not un1form
Land preparat1on 1s generally acceptable and 1s done manually by
draft an1mal or tractor-dlawn 1mplements 36
Spr1ng cassava (e g 1n the Guangzhou area) 1s typ1cally planted
between January and March and harvested 1n the fall after at least 8
months espec1ally from October although for fodder purposes
cutt1ngs may be taken cont1nuously over an extended per1od of t1me
The spr1ng and summer seasons cons1derably a1d leaf and stem growth
of sprlng-planted cassava and fall arr1ves opt1mally for starch
format1on Y1elds of sprlng-planted cassava tend to be large but
are less rel1able s1nce typhoons 1n fall occas1onally cause damage
Furthermore low temperatures 1n spr1ng extend the budd1ng and
sprout1ng per1od and thus the r1sk of 1nsect damage But spn ng-
planted cassava f1ts well 1nto South Ch1nese 1ntercropp1ng and
rotat1on systems fac1l1tat1ng the ach1evement of as many as three
crops per year 1nclud1ng one of cassava 37
Fall- and Wlnter-planted cassava 1s common 1n the most trop1cal
areas 111th harvests start1ng the follow1ng fall The peak per1od for
both plant1ng and harvest1ng 1s September to November Fa 11 p 1 anted
36coc~ and Kawano Cassava 1n Ch1na p 7
37The d1scuss1on of spr1ng- and fall planted cassava 1s Pl1ma11ly from matenal appear1ng 1n L1ang Guangshang (ed ) Za1pe1 yu L1yong pp 10 11 and 33 34
~1ushu --
- 39 -
cassava 1s pract1cable from around Gaozhou County (21°56 N ZhanJlang
Prefecture Guangdong Prov1nce) south where temperatures average
about 22 7°C annually and the lowest average January temperatures
exceed 15°C These areas also enJOY 1304-1718 mm of ra1nfall per
year and 1941-2455 hours of sunl1ght h1gher than more northerly
reg1ons espec1ally dur1ng the w1nter thereby prov1d1ng more
hosp1table cond1t1ons for fall plant1ng Of course fall-planted and
spr1ng planted cassava are not mutually exclus1ve QlJlng Br1gade
for example 1n D1anba1 County (w1th1n the coastal zone ly1ng along
the South Ch1na Sea well to the south of Gaozhou) planted 25
thousand hectares of cassava 1n 1972 approx1mately one-thlrd fall
planted two-thlrds sprlng-planted
A pr1nc1pal advantage of fall-planted cassava 1s the potent1al
for avo1d1ng typhoon damage Th1s 1s part1cularly 1mportant on the
Le1zhou Pen1nsula and Ha1nan lsland Insect damage to the sprouts 1s
also lower s1nce cr1cket populat1ons decl1ne rap1dly 1n fall and the
sprout1ng per1od 1s collapsed w1th sprouts and roots beg1nn1ng
w1th1n a week after plant1ng Fall planted cassava can be more
conven1ently l1nked w1th ser1culture s1nce leaves are prov1ded more
opportunely w1thout 1nfluenc1ng root y1eld \!1th the longer season
cassava planted 1n fall fac1l1tates fuller ut1l1zat1on of product1on
capac1ty 1n local starch factor1es and 1s conven1ent for on farm
l1vestock development The pnnc1pal dra11backs are the slm1er 111nter
growth and the 1nconven1ence of the longer season for rotat1on and
mult1ple cropp1ng
1ntens1ty 1s h1gh
Thus even 1n the far south 1f the cropp1ng
ca~sava 1s apt to be planted 1n spnng \11th
- 40 -
v1rtually all cassava north of 22°N andan 1mportant port1on of the
rema1nder planted 1n spr1ng the maJOrlty of cassava 1n Ch1na 1s
l1kely to be sprlng-planted
The Ch1nese are well aware of the necess1ty of rotat1on and
1ntercropp1ng for cont1nued cassava cult1vat1on They est1mate that
y1elds decl1ne by 20-30 percent 1n a second consecut1ve year of
cassava cult1vat1on and by 30-40 percent for three consecut1ve
years 38 The CIAT delegat1on noted however that cassava 1s grown
as a monocrop 1n sorne areas 39 South Ch1nese rotat1on systems are
complex and var1ed those 1nclud1ng cassava are no except1on F1gure
A presents notable 2-year through 6-year rotat1on systems for cassava
and other dryland food crops In newly recla1med areas cassava 1s
often grown for ene or two years among Jade cass1a (Ch1nese
c1nnamon) mounta1n apr1cot bamboo tong 011 tea o1l rubber trees
or 1n other econom1c forests Ch1nese l1terature po1nts out the
1mportance of rotat1on of cassava w1th green manure crops 1n econom1c
forests to avo1d eros1on
Cassava 1s normally the pr1nc1pal crop 1n a small number of
exceed1ngly poor local1t1es anda very few state farms As Table 5
and 6 1nd1cate the most 1mportant crop 1n South Ch1na 1s
unquest1onably paddy r1ce compr1s1ng 63 percent of sown area 1n
Guangdong 1n 1984 and 59 percent 1n Guangx1 Paddy f1elds occupy 63
38Llang Guangshang (ed ) Mushu Za1pe1 yu L1yong p 40
39cock and Kawano Cassava 1n Ch1na p 8
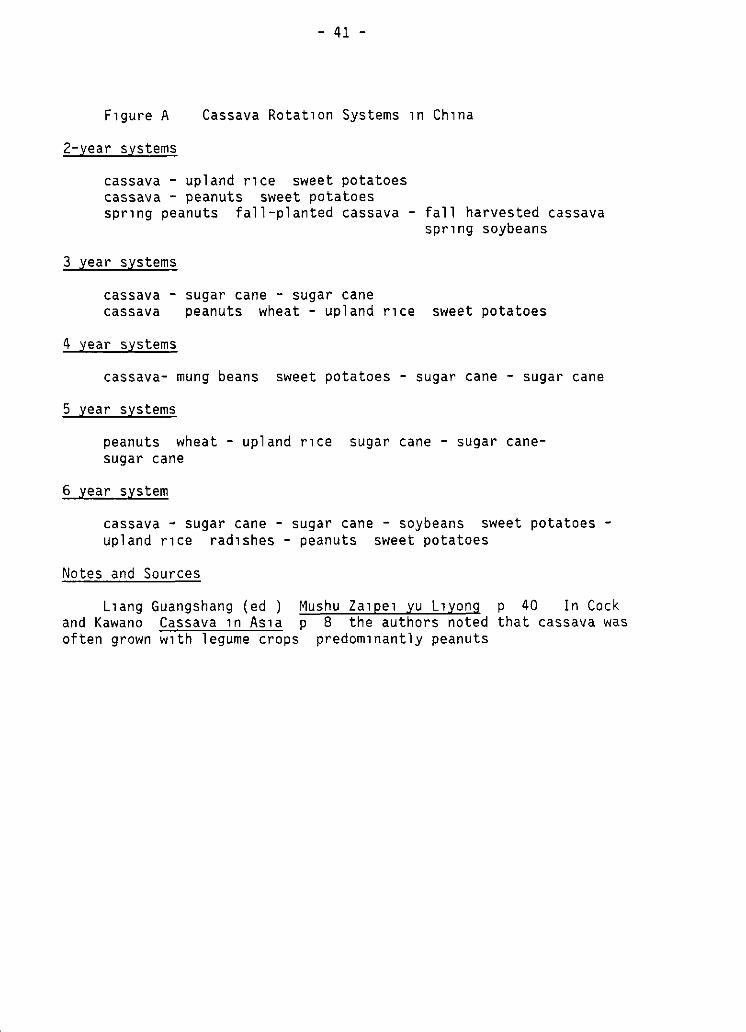
- 41 -
F1gure A Cassava Rotat1on Systems 1n Ch1na
2-year systems
cassava - upland r1ce sweet potatoes cassava - peanuts sweet potatoes spr1ng peanuts fall-planted cassava- fall harvested cassava
spn ng soybeans
3 year systems
cassava - sugar cane - sugar cane cassava peanuts wheat - upland r1ce sweet potatoes
4 year systems
cassava- mung beans sweet potatoes - sugar cane - sugar cane
5 year systems
peanuts wheat - upland r1ce sugar cane - sugar canesugar cane
6 year system
cassava ~ sugar cane - sugar cane - soybeans sweet potatoes ~
upland r1ce rad1shes - peanuts sweet potatoes
Notes and Sources
L1ang Guangshang (ed ) Mushu Za1pe1 yu L1yong and Kawano Cassava 1n As1a p 8 the authors noted often grown w1th legume crops predom1nantly peanuts
p 40 In Cock that cassava was
- 42 -
percent of cult1vated land 1n Guangx1 and are s1m1larly dom1nant 1n
Guangdong Sweet potatoes are second 1n arder of planted area 1n
Guangdong and comb1ned w1th wh1te potatoes totalled 10 percent of
sown area Peanuts (6 percent) and sugar cane (5 percent) rank th1rd
and fourth probably followed by cassava at around 3 percent
Soybeans ma1ze bast f1bers and tobacco are also grown and unt1l
1ts de-emphas1s 1n recent years wheat area exceeded cassava
plant1ngs In Guangx1 ma1ze 1s second at 11 percent of sown area
followed by soybeans and sweet potatoes (5 percent each) sugar cane
and peanuts (3 5 percent each) and green manure crops as a group (2 5
percent) Cassava at 2 1 percent 1s sl1ghtly below vegetables and
melons as a group When cassava area peaked 1n 1980 1ts share was
4 3 percent rank1ng f1fth beh1nd r1ce ma1ze soybeans and sweet
potatoes and h1gher than all econom1c crops 40
Y1elds
Most ava1lable 1nformat1on on cassava y1elds was prov1ded 1n the
sect1on on product1on trends and d1str1but1on In that sect1on 1t
was suggested that the cons1derable 1ncrease 1n average y1elds dur1ng
the latter 1960s (Table 2) was due to var1etal 1mprovement and to
sorne extent 1mprovement 1n cultural pract1ces wh1le y1eld growth
s1nce the late 1970s has been pr1nc1pally the result of 1ncreased
fert1l1zer appl1cat1on to cassava complemented by sorne 1mprovement
1n var1et1es and cult1vat1on techn1ques Mean cassava y1elds
throughout Ch1na 8 6 tons/ha 1n 1980) approx1mate the average for
40Table 5 and 6 Ch1na Agr1cultural Yearbook 1985 pp and D1l1 YanJ1Usuo Zhongguo Nongye D1l1 Zonglun pp 77 79
114 126
43 -
the rest of the world but are somewhat h1gher than mean y1elds 1n
the rema1nder of As1a Mean y1elds 1n Guangx1 (13 1 tons/ha 1981-84
average) however are somewhat h1gher than the 1nternat1onal
average and the h1ghest y1elds from f1eld cult1vat1on 1n Ch1na
(average 20-25 tons/ha w1th a max1mum of 30 tons/ha or more) are
comparable to the very h1ghest y1elds 1n the world 41 But Ch1nese
cassava 1s also grown on poor so1ls w1th no fert1l1zer or 1rr1gat1on
where average y1elds have been character1zed 1n the 3 to 8 ton range
The average f1gures c1ted above suggest that those peor cond1t1ons
are more typ1cal of Ch1nese cassava cult1vat1on than the state farm
or Pearl R1ver Delta pr1vate and cooperat1ve farm1ng exper1ence
However survey results suggest that even on poor so1ls w1thout
Jrr1gat1on fert1l1zer appl1cat1on can 1ncrease y1elds on both
research stat1ons and operat1ng farms by an average of at least 6
tons per hectare
Y1eld d1fferences among farms are due not only to d1fferences 1n
so1l fert1l1ty cl1mat1c cond1t1ons adopted var1et1es and appl1ed
fert1l1zers but to substant1al d1fferences 1n management as well
Farmers 1n sorne areas use unselected plant1ng mater1als g1v1ng very
poor stands and low y1elds On pr1vate plots management var1es more
than on collect1ve lands w1th1n a s1ngle v1c1n1ty but the level of
agronomy 1s often fa1rly h1gh 42
411bld from James H
p 1 and 8 Delph1 Survey responses Cock June 24 1983 Table 2
and correspondence
42cock and f a11ano Cock June 24 1983
Cassava 1n Ch1na correspondence from James
- 44 -
Among the responses of three Ch1nese cassava breeders surveyed
low y1eld potent1al of ex1st1ng var1et1es and unava1lab1l1ty of
fert1l1zers were both l1sted by each respondent as 1mportant
constra1nts on farmers y1elds But the survey results also suggest
that output market1ng problems storage and process1ng d1ff1cult1es
and general lack of product1on 1ncent1ves may restr1ct appl1cat1on of
labor and fert1l1zers to cassava 1n sorne areas 43 Although there 1s
cons1derable var1at1on 1n the qual1ty of cult1vated var1et1es Ch1na
has several popular var1et1es such as South Ch1na 205 prov1d1ng
reasonably h1gh and stable y1elds It 1s the prov1s1onal conclus1on
of ene 1nternat1onal breeder that l1ke Tha1land 1n the recent past
and Malays1a currently r1g1dly selected CIAT clones could outy1eld
the best Ch1nese cult1vars only sl1ghtly Th1s contrasts w1th
lndones1a and the Ph1l1pp1nes where the best local var1et1es are more
eas1ly dom1nated 44
Peor fert1l1zer response and 1nadequate extens1on were l1sted as
a secondary constra1nt on y1elds as was 1nadequate mo1sture 1n sorne
are as The 1982 CIAT delegat1on noted that fert1l1zer appl1cat1ons
were not generally l1nked to so1l analyses or recommendat1ons made on
the bas1s of exper1mental results Each of the surveyed breeders
appeared to agree that pests and d1seases were relat1vely un1mportant
43oelph1 Survey results
44Kazuo Kawano Tr1p Report to Ch1na (18-24 January 1986) unpubl1shed tr1p report prov1ded 1n correspondence from Kawano Apr1l 14 1986
- 45 -
1n l1m1t1ng cassava y1elds The 1982 CIAT delegat1on also found that
although pests and d1seases were not chem1cally controlled they
appeared to be of very low 1nc1dence and harvest losses from such
sources were concluded to be m1n1mal The most commonly observed
d1sease was Cercospora leaf spots and dur1ng the dry months
Tetranychus m1tes are reported to be a problem 45
Costs of product1on and labor ut1l1zat1on
The 1982 CIAT delegat1on was told that labor use var1ed from 100
man days per hectare w1th mechan1cal land preparat1on to 270 days
w1thout mach1nes and total product1on costs were est1mated at $550
US per hectare 170 days may be somewhat excess1ve for manual land
preparat1on but although the total of 270 days per hectare 1s h1gher
than 1n sorne As1an countr1es 1t 1s not unprecedented The total cost
f1gures are l1kely to have come d1rectly from the product1on accounts
of one or more Guangdong state farms where workers are pa1d set
wages or from a sma11 sub-group of more prosperous cassava grow1ng
collect1ves wh1ch happened to have kept good records and where y1elds
are h1gh Most of the 1mpl1ed cost per man day of around $2 US would
be labor A proJect prospectus for an agr1cultural cred1t
appl1cat1on to the World Bank 1nvolv1ng cassava cult1vat1on 1mpl1ed a
return to labor of $1 25 US per day r1uch of the labor 1 nvo l ved
45cock and Kawano Cassava 1n Ch1na p 7
- 46 -
espec1ally where cassava 1s fert1l1zed 1s for hand-weed1ng s1nce
herb1c1des are not used 46
Much of the non-labor costs on state farms would cons1st of
fert1l1zer appl1cat1on The h1ghest per hectare appl1cat1on rates
encountered by the C!AT delegat1on 1n 1982 were 20 tons of organ1c
manures 375 k1lograms of superphosphate (45-68 kg of P2o5) and 150
k1lograms of mur1ate of potash (37 5 kg of K O) 47 2 Such rates are
l1kely to have ex1sted only on state farms w1th plent1ful access to
fert1l1zers and/or few alternat1ve uses Impl1ed per hectare reta1l
value of th1s level of manufactured fert1l1zer use alone would have
totalled $ us 48 On collect1ve lands w1th plent1ful access to
fert1l1zers use of manufactured products 1s less lav1sh but organ1c
manure use w1th assoc1ated h1gh labor requ1rements 1s very
substant1al In Fucheng Commune of Dongguan County on the Pearl
R1ver Delta average y1elds of 21-22 5 tons per hectare on 400
hectares of cassava were ach1eved w1th 225 k1lograms of ammon1um
sulfate per hectare But 1n add1t1on three organ1c manure
appl1cat1ons were undertaken 1nvolv1ng total per hectare use of 3
tons of sw1ne and cattle manure 3-4 5 tons of human n1ght so1l and
15 tons of green manure (pr1mar1ly legumes) m1xed w1th 22 5 tons of
so1l On the Huashan State Farm 1n L1ngshan County Guangx1 per
46¡b1d pp 7 8 correspondence from John Lynam Program December 22 1983 Stone An Exam1nat1on of on Ch1nese Cassava Product1on Ut1l1zat1on and Trade
47cock and Kawano Cassava 1n Ch1na p 7
48
C!AT Cassava Econom1c Data
pp 6-9
- 47
hectare appl1cat1ons of 255 k1lograms of ammon1um sulphate and 15
tons of organ1c manure y1eld1ng 19 62 tons per hectare were est1mated
to prov1de 141 k1lograms of n1trogen 79 k1lograms of phosphor1c ac1d
and 180 k1lograms of n1trogen 49
One of the 1986 Ch1nese survey respondents prov1ded a comb1ned
per hectare est1mate of farmer fert1l1zer use on peor so1l cassava
lands 1n Guangdong of 150 k1lograms assoc1ated w1th average y1elds
of only 5 tons per hectare wh1le another respondent based on Ha1nan
Island (Guangdong) 1mpl1ed that no manufactured fert1l1zers were
used on cassava by farmers regardless of so1l cond1t1ons 50
It 1s very unl1kely that much fert1l1zer has been appl1ed to
cassava on d1stant collect1ves and pr1vate plots Th1s 1s due to low
farmgate cassava pr1ces a weak cassava market 1n many areas (see
below) and to the h1gher pr1ces and d1ff1cult access assoc1ated w1th
fert1l1zer purchase unless such purchase 1s l1nked to sales to
government procurement organ1zat1ons of farm goods 1n part1cular
state demand Pr1vate plot product1on of cassava employ1ng household
labor and w1thout manufactured fert1l1zer use could be conducted for
purposes of heme consumpt1on and hog feed at very low 1mpl1ed return
to labor Ho11ever w1th the low y1elds assoc1ated w1th most
product1on such returns could be well under $1 US per day and may
have been susta1nable only as a funct1on of Ch1nese labor market
49L1ang Guangshang (ed ) Mushu Za1pe1 yu L1yong p 86
50oelph1 Survey responses
- 48 -
restr1ct1ons W1th 1ncreas1ng l1beral1zat1on of econom1c act1v1t1es
1n the 1980s labor opportun1ty costs have r1sen substant1ally 1n
suburban and wealth1er rural farm areas As export opportun1t1es
have decl1ned these healthy econom1c movements have undoubtedly
worked aga1nst cassava cult1vat1on 1n such areas Opportun1ty costs
would be less affected 1n poorer and more d1stant farm areas but the
state s decl1n1ng market1ng role 1s less apt to be v1gorously
replaced by pr1vate market development 1n such areas
Technology development
Publ1cat1on of L1ang T1ngdong s Zhong Mufanshu Fa [Cassava
Plant1ng Methods] 1n 1900 was a benchmark 1n the 1n1t1at1on of a
formal process of cassava technology 1mprovement 1n Ch1na wh1ch
could span t1me and space As 1nd1cated 1n the f1rst sect1on
cassava spread to FUJlan and Ta1wan 1n the 1920s roughly 100 years
after 1ts f1rst known cult1vat1on 1n ne1ghbor1ng Guangdong
Introduct1on 1n Hunan and J1angx1 1n the early 1940s may have been
the f1rst example of del1berate trans prov1nc1al d1ssem1nat1on by
Ch1nese sc1ent1f1c 1nst1tut1ons
The Peoples Republ1c agr1cultural sc1ence establ1shment gave
attent1on to cassava as a bulky relat1vely drought-reslstant crop
wh1ch could be grown on poor so1ls and st1ll prov1de growth 1n
ava1lable calor1es per un1t of farmland w1th sorne advantages 1n
y1eld stab1l1ty Alternat1vely 1t could also furn1sh raw mater1als
for 1ndustry Th1s or1entat1on toward bulky cheaper food 1tems and
1ndu~tr1al crops was well w1th1n a trad1t1on establ1shed early 1n the
- 49 -
h1story of most soc1al1st governments and st1ll cont1nues to
d1st1ngu1sh the pattern of food product1on and ava1lab1l1ty although
to a decreas1ng extent over t1me 1n the Sov1et Un1on Eastern
European countr1es and North Korea as well as 1n Ch1na V1etnam and
other soc1al1st nat1ons more su1ted to cassava prQduct1on 51
Although d1ssem1nat1on of cassava was emphas1zed throughout the
1950s broaden1ng cult1vat1on 1n the two southern prov1nces and
1n1t1at1ng 1t 1n ZheJlang and J1angx1 cassava research began to show
results 1n the late 1950s Between 1957 and 1962 the Agr1cultural
Sc1ence Department s Gra1n Crops Laboratory of the South Ch1na
Academy of Agr1cultural Sc1ence 1n Guangzhou (23°8 N) selected 10
var1et1es from a pool of 30 for d1ssem1nat1on at least s1x of wh1ch
have been extens1vely cult1vated 1nclud1ng ZaJlao [Hybr1d] no 4 and
~Inn1 X1ye [Indones1an th1n leaf] exh1b1t1ng 11 percent and 23
percent y1eld 1mprovements over w1dely planted Hongwe1zhong [Red Ta1l
Var1ety] and M1anbao Mushu [Bread Cassava] ZaJlao no 1 and Nanwan
Mushu [South Bay Cassava] y1eld1ng 70 86 percent of Hongwe1zhong
but exh1b1t1ng other des1rable character1st1Cs such as super1or
ed1b1l1ty h1gher starch rates and/or y1eld stab1l1ty Although
breed1ng obJeCtlves for cassava have broadened cons1derably s1nce the
1950s h1gher root y1elds and 1mproved ed1b1l1ty rema1n as central
~ 51Sh1geru Ish1ka1va Ch1na s Food and Agnculture A Turn1ng Po1nt Food Pol1cy 2 (r1ay 1977) p 93 Bruce Stone Ch1na s 1985 Foodgra1n P1oduct1on Target Issues and Prospects 1n Anthony M Tang and Bruce Stone Food Proctuct1on 1n the PeoplPS Republ1c of Ch1na Research Report no 15 (\lash1ngton D C Internat1onal Food Pol1cy Research !nst1tute 1980) pp 92 96
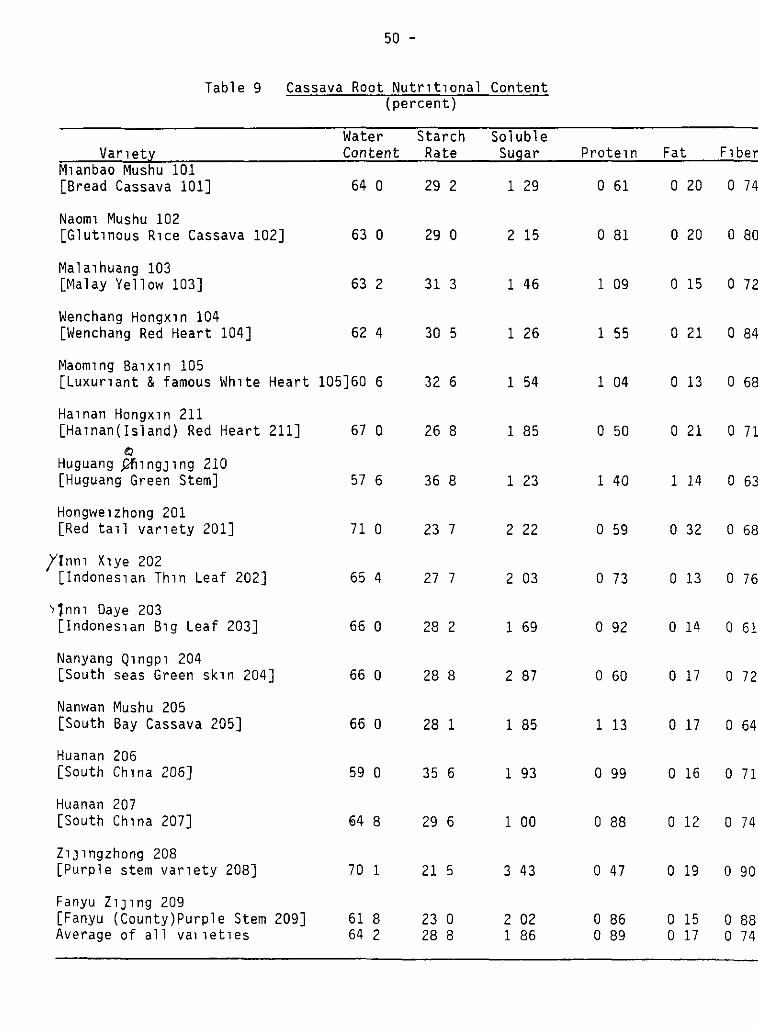
50 -
Table 9 Cassava Root Nutr1t1onal Content (percent)
Van ety M1anbao Mushu 101 [Bread Cassava 101]
Naom1 Mushu 102 [Glut1nous R1ce Cassava 102]
Mala1huang 103 [Malay Yellow 103]
Wenchang Hongx1n 104 [Wenchang Red Heart 104]
Maom1ng Ba1x1n 105
Water Starch Soluble Content Rate Sugar
64 o 29 2 1 29
63 o 29 o 2 15
63 2 31 3 1 46
62 4 30 5 1 26
[Luxur1ant & famous Wh1te Heart 105]60 6 32 6 1 54
Ha1nan Hongx1n 211 [Ha1nan(Island) Red Heart 211]
(';¡
Huguang ~lngJlng 210 [Huguang Green Stem]
Hongwe1zhong 201 [Red ta1l var1ety 201]
¡rnn1 X1ye 202 [Indones1an Th1n Leaf 202]
~inn1 Oaye 203 [Indones1an B1g Leaf 203]
Nanyang Q1ngp1 204 [South seas Green sk1n 204]
Nanwan Mushu 205 [South Bay Cassava 205]
Huanan 206 [South Ch1na 206]
Huanan 207 [South Ch1na 207]
ZlJlngzhong 208 [Purple stem var1ety 208]
Fanyu ZlJlng 209 [Fanyu (County)Purple Stem 209] Average of all va11et1es
67 o
57 6
71 o
65 4
66 o
66 o
66 o
59 o
64 8
70 1
61 8 64 2
26 8
36 8
23 7
27 7
28 2
28 8
28 1
35 6
29 6
21 5
23 o 28 8
1 85
1 23
2 22
2 03
1 69
2 87
1 85
1 93
1 00
3 43
2 02 1 86
Prote1n Fat F1ber
o 61 o 20 o 74
o 81 o 20 o 80
1 09 o 15 o 72
1 55 o 21 o 84
1 04 o 13 o 68
o 50 o 21 o 71
1 40 1 14 o 63
o 59 o 32 o 68
o 73 o 13 o 76
o 92 o 14 o 61
o 60 o 17 o 72
1 13 o 17 o 64
o 99 o 16 o 71
o 88 o 12 o 74
o 47 o 19 o 90
o 86 o 15 o 88 o 89 o 17 o 74
Sources
- 51 -
L1ang Guangshang (ed ), Mushu Za1pe1 yu L1yong [Cassava Cult1vat1on and Use] Guangzhou Guangdong Kezh1 Chubanshe [Guangdong Sc1ent1f1c and Techn1cal Publ1sh1ng Hou5e] 1981) p 108
foc1 of the Ch1ne5e breed1ng program 52
South Ch1na 201 15 al5o known as Hongwe1zhong or Dongguan
Hongwe1 [Dongguan Red Ta1l] A h1gh y1eld1ng cult1var w1th h1gh
cyan1de content 1t 15 the mo5t popular var1ety for flour product1on
Cult1vated on pla1ns h1lly tracts and mounta1nou5 upland5 th15
var1ety covers 70-80 percent of cassava area 1n many Guangdong and
Guangx1 Prefectures It 1s al5o exper1mentally cult1vated 1n the
Yangz1 Valley
South Ch1na 202 or)lnn1 X1ye was 1ntroduced from lndone51a 1n
1956 by the South Ch1na Agr1cultural Sc1ence Department 1n Guangzhou
It typ1cally outy1eld5 Hongwe1 by a 5mall marg1n but has the h1ghest
cyan1de content of popular var1et1e5 and 1s thus also used 1n
proces51ng 1ndu5tr1e5 pr1mar1ly for flour and 5tarch product1on
Plant1ngs are concentrated on the Aox1 State Farms There has al5o
been 5ucces5ful exper1mental cult1vat1on 1n NanJ1ng
South Ch1na 20~ or Nanwanmu5hu wa5 the shortest of the 51xteen
lead1ng cult1vars tested and 15 famou5 for w1th5tand1ng the Augu5t 17
typhoon 1 n 1963 It comb1ne5 y1eld 5tab1l1ty w1th h1gh potent1al
52L1ang Guang5hang (ed) r1u5hu Za1pe1 yu L1yong pp 10 and 77 r1uch of the 5ucceed1ng d1scuss1on on var1et1es and 1nst1tut1ons 1s based on pp 77 80 and Table 9 w1th a few add1t1ons f1om Cock and Ka11aro Cassava 1n As1a
- 52 -
and 1s good for flour and espec1ally starch product1on where 1t
Slgn1f1cantly outperforms other popular var1et1es As Table 9 Q
1nd1cates Huguang Q~lngJlng [Huguang Green Stem] or South Ch1na 210
and South Ch1na 206 have by far the h1ghest starch rates per un1t
we1ght but Nanwanmushu s respectable rate coupled w1th h1gher y1eld
potent1al make 1t a clear leader 1n starch per un1t of harvested
area Follow1ng Nanwanmushu South Ch1na 206 207 andrinn1 X1ye
feature the h1ghest starch content per un1t area South Ch1na 205 1s
an 1nternat1onally recogn1zed cult1var w1th s1m1lar character1st1cs
to those of the Vassour1nha var1ety of Braz1l and the Ph1l1pp1nes
The greatest area of Nanwanmushu concentrat1on 1s Zhongshan Dongguan
and other count1es 1n the Pearl R1ver Delta but 1t 1s planted w1dely
throughout Guangdong
South Ch1na 101 or M1anbao Mushu 1s also known as Mala1hong
[Malay Red] s1nce 1t was 1ntroduced onto rubber plantat1ons 1n Dan
X1an from Malays1a 1n 1912 The var1ety comb1nes y1eld stab1l1ty
w1th low cyan1de content and reasonably h1gh y1eld potent1al and 1s
recogn1zed as Ch1na s best tast1ng cult1var Plant1ngs are
concentrated on Ha1nan Island espec1ally 1n Dan X1an Wenchang and
Baot1ng Count1es but bread cassava 1s also grown 1n most areas of
Guangdong and has been exper1mentally cult1vated 1n Hebe1 Prov1nce
farther north than any other var1ety (39°20 N) Its characterlst1cs
are relat1vely s1m1lar to those of A1p1n Valenc1a of Southeast As1a
South Ch1na 104 or Wenchang Hongx1n [Wenchang Red Heart] 1s the
h1ghest y1eld1ng var1ety among the better tast1ng (sweeter)
cult vars It has the h1ghest prote1n content of the 16 lead1ng
53 -
var1et1es also features low cyan1de concentrat1ons reportedly
outy1elds M1anbao Mushu by 22 percent but 1s not typ1cally preferred
to the latter for d1rect consumpt1on South Ch1na 104 1s planted
predom1nantly 1n Wenchang and Q1ongshan Count1es on Ha1nan Island
w1th l1ttle cult1vat1on elsewhere
Among other palatable var1et1es Maom1ng Ba1x1n [Maom1ng Wh1te
Heart] or South Ch1na 105 from Maom1ng Mun1c1pal Area near
Guangdong s Le1zhou Pen1nsula and Nuom1 Mushu [pol1shed glut1nous
r1ce cassava] or South Ch1na 102 are worthy of ment1on Both
outy1eld M1anbao Mushu by 10-11 percent w1th substant1ally greater
super1or1ty 1n more northern areas Both are sweet and low 1n
cyan1de content w1th South Ch1na 102 lowest of the s1xteen prom1nent
var1et1es A var1ety known as 6068 1s also famous for 1ts excellent
eat1ng qual1t1es and 1s planted on around 10 000 hectares desp1te 1ts
modest y1elds
In sum the South Ch1na Trop1cal Crops Research Academy
concentrated not only on select1on and d1ssem1nat1on of cult1vars
featur1ng h1gher and more stable root y1elds and 1mproved ed1b1l1ty
but has focused breed1ng attent1on 1n comb1n1ng those
character1st1cs and 1n1t1ated research on starch content By
focus1ng on faster as opposed to str1ctly h1ghet root y1elds the
Academy also broughc to cassava breed1ng 1n th1s early per1od the
beg1nn1ngs of a qu1ntessent1ally Ch1nese or1entat1on breed1ng to
f1t rotat1onal patterns and mult1ple cropp1ng sequences
54 -
W1th the catastroph1c fam1nes of 1960 61 centered 1n North Ch1na
and the Yangz1 Valley efforts to spread cassava cult1vat1on
northward 1ntens1f1ed cons1derably The focal 1nst1tut1on 1n th1s
effort was the ZheJlang Prov1nce Sub-troplcal Crops Inst1tute 1n
P1ngyang (27°38 N) Between 1962 and 1964 the 1nst1tute 1ntroduced
31 var1et1es from Guangdong Guangx1 and FUJlan 1nclud1ng Hongwe1
Nanwanmushu Inn1 Daye Sh1be1~1ngJ1ng [stone tablet green stem] and
ZaJlao nos 1-6 But as Table 10 1nd1cates there has been
exper1mental cult1vat1on much further north although the South Ch1na
Trop1cal Crops Research Academy has 1nd1cated that good growth and
y1elds are cons1stently obta1ned only up to around 26°N wh1ch cuts
across southern Hunan Gu1zhou J1angx1 and FUJlan
As1de from the above ment1oned 1nst1tut1ons sorne cassava
related research 1s reportedly conducted 1n each of the prov1nces
w1th1n wh1ch cassava has been 1ntroduced In South Ch1na other
relevant 1nst1tut1ons are the Guangx1 Prov1nce As1an Trop1cal Crops
Research Inst1tute 1n Nann1ng the South Ch1na Crop Research
Inst1tute and the South Ch1na Inst1tute of Botany w1th1n the Ch1nese
Academy of Sc1ences the Inst1tute of Drought Res1stant Gra1ns and
the Upland Gra1ns Department 1n the Guangdong Agr1cultural Sc1ence
Academy and the South Ch1na Agr1cultural College all 1n Guangzhou
However cassava research 1s not reputed to be a s1gn1f1cant current
focus of any of the Guangzhou 1nst1tut1ons
Cassava research and development 1n Ch1na 1s 1ncreas1ngly
sh1ft1ng 1ts focus from the or1g1nal narrowly def1ned goals of
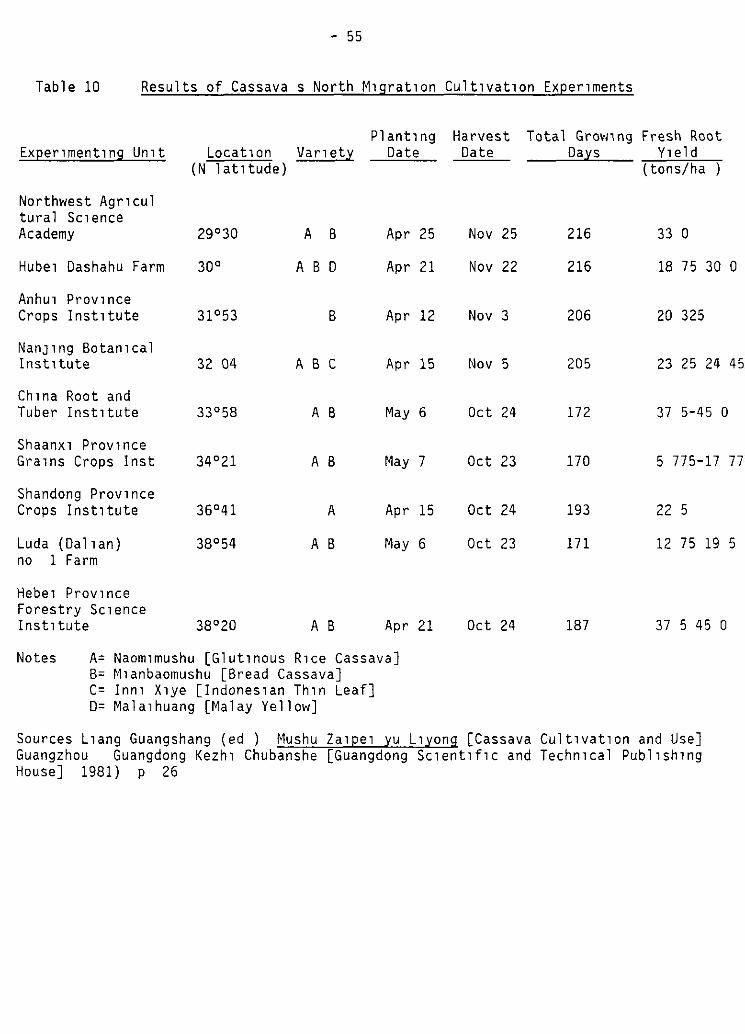
- 55
Table 10 Results of Cassava s North M1grat1on Cult1vat1on Exper1ments
Exper1ment1ng Un1t
Northwest Agr1cul tural Sc1ence Academy
Hube1 Dashahu Farm
Anhu1 Prov1nce Crops Inst1tute
NanJlng Botan1cal Inst1tute
Ch1na Root and Tuber Inst1tute
Shaanx1 Prov1nce Gra1ns Crops Inst
Shandong Prov1nce Crops Inst1tute
Luda (Dal1an) no 1 Farm
Hebe1 Prov1nce Forestry Sc1ence Inst1tute
Locat1on (N lat1tude)
29°30
30°
31°53
32 04
33°58
34°21
36°41
38°54
38°20
Var1 ety
A B
A B O
B
A B C
A B
A B
A
A B
A B
Plant1ng Date
Apr 25
Apr 21
Apr 12
Apr 15
May 6
May 7
Apr 15
May 6
Apr 21
Notes A= Naom1mushu [Glut1nous R1ce Cassava] B= M1anbaomushu [Bread Cassava] C= Inn1 X1ye [Indones1an Th1n Leaf] O= Mala1huang [Malay Yellow]
Harvest Date
Nov 25
Nov 22
Nov 3
Nov 5
Oct 24
Oct 23
Oct 24
Oct 23
Oct 24
Total Grow1ng Days
216
216
206
205
172
170
193
171
187
Fresh Root Y1eld
(tons/ha )
33 o
18 75 30 o
20 325
23 25 24 45
37 5-45 o
5 775-17 77
22 5
12 75 19 5
37 5 45 o
Sources L1ang Guangshang (ed ) Mushu Za1pe1 yu L1yong [Cassava Cult1vat1on and Use] Guangzhou Guangdong Kezh1 Chubanshe [Guangdong Sc1ent1f1c and Techn1cal Publ1sh1ng House] 1981) p 26
56 -
1mprov1ng y1eld and ed1b1l1ty The ma1n 1mprovement efforts
st1ll 1nclude ed1b1l1ty but also emphas1ze cult1vat1on techn1ques
espec1ally cassava s relat1on to other crops 1n var1ous systems and
the comb1ned development of cassava and non-crop rural act1v1t1es
Breed1ng obJeCtlves also 1nclude early plant1ng early r1pen1ng and
rap1d matur1ty goals as well as d1sease res1stance h1gh y1elds and
h1gh starch and prote1n content 53
Research and development goals related to cult1vat1on techn1ques
feature 1mprovement 1n rotat1on synerg1es seasonal cult1vat1on
1ntercropp1ng and ach1evement of two or even three r1pen1ngs per
year Bean crop and cassava rotat1ons and 1ntercropp1ng are of
part1cular 1nterest as techn1ques for develop1ng so1l strength The
1982 C!AT delegat1on observed that cassava was often 1ntercropped
w1th gra1n legumes 1n more 1ntens1vely cult1vated areas and est1mated
that y1elds of both crops were probably reduced by only 15-30 percent
result1ng 1n relat1vely eff1c1ent land use w1th good so1l
conservat1on propert1es 54
S1nce 1979 non-crop agr1culture has been emphas1zed 1n Ch1na
part1ally correct1ng for the substant1al pre-1979 stress on food
crops espec1ally staples Consequently a recent goal for cassava
development has been to 1ntegrate cassava Wlth forestry an1mal
husbandry ser1culture aquaculture and rural s1del1nes for
53L1ang Guangshang (ed ) Mushu Za1pe1 yu L1yong p 10
54!b1d correspondence from James H Cock Cassava Program D1rector C!AT June 24 1983
- 57 -
cooperat1ve product1on Invest1gat1on of add1t1onal and even novel
1ndustr1al uses 1s also of 1ncreas1ng 1nterest
Survey respondents among Ch1nese cassava breeders and
agronom1sts 55 appeared optlmlstlc about the potent1al for growth 1n
farmers y1elds dur1ng the next 4 and 14 years Respondents were
1nstructed to base the1r assessments on ex1st1ng var1et1es and those
currently under development but the1r est1mates d1ffered
cons1derably They were also opt1mlst1c about the prospects for
1ncreas1ng that potent1al v1a a doubl1ng of research expend1tures
related to cassava w1th the most conservat1ve assessments prov1ded
by the representat1ve of the 1nst1tut1on where most research on
cassava 1s conducted In h1s v1ew farmers y1elds on ooor so1ls
could 1ncrease from currently 3 6 tons per hectare to 4 8 tons by
1990 and 5-9 tons by 2000 or 5-10 tons and 6-12 tons respect1vely
w1th a doubl1ng of research expend1tures W1th good so1l and
cl1mat1c cond1t1ons farmers y1elds could 1ncrease from currently
15 30 tons/hectare w1th fert1l1zer to 18 35 tons by 1990 and 20 40
tons by 2000 or 25-35 tons and 35-45 tons w1th a doubl1ng of research
resources
It 1s clear that y1elds can 1mprove espec1ally 1n Guangdong
v1a greater access to manufactured fert1l1zers analys1s and
extens1on related to 1ts opt1mal use and to proper select1on of
plant1ng mater1als Fert1l1zer pr1c1ng d1str1bUt1on and analyt1c
systems are undergo1ng cons1derable structural change 1n Ch1na
5"Dolphl Survey responses
- 58
Proper resolut1on of rema1n1ng and newly emerg1ng d1ff1cult1es w1ll
be 1nstrumental 1n ach1ev1ng y1eld progress through growth 1n
fert1l1zer use 56
It also appears that there may be sorne l1m1ted potent1al
explo1table w1th further 1nternat1onal exchange of genet1c
mater1als 57 State farms are technolog1cal leaders 1n cassava
cult1vat1on though not for most staple crops and careful select1on
of plant1ng mater1als and quest for 1mproved cult1vars are ev1dent on
state farms Y1eld progress on several state farms 1n recent years
has allowed cont1nued prof1tab1l1ty of cassava cult1vat1on desp1te
decl1n1ng pnces Th1s means that new 1mproved var1et1es can move
rap1dly 1nto full scale product1on 1n Ch1na What may be called for
are 1nst1tut1onal l1nks wh1ch can br1ng state farm developments 1nto
the pr1vate and collect1ve economy more exped1t1ously A new var1ety
must undergo reg1onal test1ng for three years The results are
presented to the prov1nc1al seed comm1ss1on wh1ch may then recommend
the var1ety to seed product1on compan1es for mult1pl1cat1on
Work on 1ntercropp1ng and rotat1onal systems 1s someth1ng
Ch1nese researchers do part1cularly well and 1s l1kely to lead to
sorne further 1mprovements Sorne of these may not 1mmed1ately
56For deta1ls see Bruce Stone Ch1nese Fert1l1zer Appl1cat1on 1n the 1980s and 1990s Issues of Growth Balance Allocat1on Eff1c1ency and Response 1n U S Congress Jo1nt Econom1c Comm1ttee (eds ) Ch1na s Economy Looks Toward the Year 2000, vol 1 The Four Modern1zat1ons (Washington D C U S Government Pr1nt1ng Off¡ce 1986) pp 453 496 ~
57cock and Kawano Cassava 1n Ch1na Ch1na (18 26 January 1986)
Ka11ano Tn p Report to
- 59 -
1ncrease cassava y1elds per se but may 1mprove the attract1veness of
plant1ng cassava and thus arrest 1ts decl1ne 1n area What 1s
s1ngularly m1ss1ng for cassava as well as for many other crops 1s
soc1o econom1c research 1n cassava areas part1cularly poorer ones
Lack of agro econom1c data and analys1s for assess1ng constra1nts
l1m1t1ng farmers y1elds 1s recogn1zed by the South Ch1na Trop1cal
Crops Academy 58
F1nally w1th the reduct1on 1n export opportun1t1es and the
curta1led government role 1n market1ng development of demand and
market 1nst1tut1ons are of part1cular 1mportance for cont1nued
expans1on of cassava product1on and use These 1ssues w1ll be
undertaken 1n the follow1ng sect1ons
~1ARKETS AND DE~lAND
A synthes1s of product1on and ut1l1zat1on
As 1nd1cated above product1on stat1st1cs for cassava 1n Ch1na
are h1ghly fragmentary except for Guangx1 Zhuang Autonomous Reg1on
for wh1ch data are complete though even for Guangx1 quest1ons of
rel1ab1l1ty and comparab1l1ty rema1n Ut1l1zat1on data however are
almost wholly unava1lable w1th the except1on of the 1nternat1onal
trade data comp1led from European Commun1ty Analyt1c Tables for
Fore1gn Ttade appear1ng 1n Table 3 Government procurement data for
cassava assuredly ex1st but have not been made ava1lable 1n Ch1nese
5Boelph1 Surve; response fron Tan Xuecheng breeder
- 60 -
stat1st1cal compend1a on market1ng and trade Product1on data from
cassava flour and starch factor1es as well as from other 1ndustr1al
processors are certa1nly generated but are not of suff1c1ent
1mportance to appear among nat1onal stat1stJcal ser1es 1n the
relat1vely deta1led Guangdong Prov1nce StatJstJcal Yearbooks and the
Guangx¡ Econom1c Yearbook 1985 although the latter conta1ns a s1ngle
column of dJscuss1on of the starch market 1n wh1ch cassava 1s
ment1oned As a reg1onally concentrated crop cassava has not turned
up among publ1shed results from nat1onal farm surveys Even L1ang
Guangshang s cassava-spec¡f¡c publJcat1on Mushu Za1pe1 yu L1yong
[Cassava Cult¡vat¡on and Use] prov1des not a s¡ngle stat1st1c on
aggregate ut¡J¡zatJon
In the past 1t has been clear that FAO est1mates of cassava use
were all based on constant percentages of est1mated product1on 59
For example the FAO Supply Ut¡J¡zatJon Accounts Tape 1981 ev1dently
1ncorporated the follow1ng percentages feed use (25 percent) waste
(5 percent) food use (67 percent) process1ng (3 percent) use for
tap1oca (70 percent of process1ng) starch use (30 percent of
process1ng) 60 S1nce the product1on ser1es was mechan1cally
generated from v1rtually no stat¡stJcal base the ut¡J¡zatlon ser1es
were 1nev1tably unrel1able even ¡f the percentage shares were
roughly correct Conversely regardless of the accuracy of the
product1on est1mates
59Bruce Stone Cassava Product1on
the ut¡J¡zatJon shares have assuredly not been
An ExamJnat1on of Econom1c Data on Ch1nese Ut¡J¡zatlon and Trade pp 13 22
60Food and Agr1culture Organ¡zat1on of the Un1ted Nat1ons Supply Ut111zat1on Accounts Tape 1981 Reme 1982
- 61 -
constant over t1me w1th feed and process1ng use 1ncreas1ng 1n
1mportance at the expense of d1rect human consumpt1on Moreover
shares for feed and process1ng would exceed the shares 1mpl1ed by the
1981 Ut1l1zat1on Tapes even for the 1960s 61
Asan exam1nat1on of Tables 11 and 12 w1ll reveal
FAO ut1l1zat1on ser1es for Ch1na are now generated 1n a more
compl1cated fash1on but h1stor1cal product1on area and y1eld
f1gures are 1dent1cal to those appear1ng on the older tapes As1de
from the 1nternat1onal trade ser1es wh1ch relates well to and 1s
probably based on the EC Analyt1c Tables for Fore1gn Trade FAO
ser1es are st1ll generated from an extremely weak stat1st1cal bas1s
wh1ch probably cons1sts of no more than the partner country trade
data and the s1ngle product1on f1gure c1rca 1980 prov1ded to the
1982 CIAT delegat1on
In these recent FAO ser1es such as Supply Ut1l1zat1on Accounts
Tape 1984 released at the end of 1985 unprocessed feed 1s set at
10 percent throughout the 1961-83 per1od and waste 1s dropped from 5
percent on prev1ous tapes to 3 percent for the ent1re per1od D1rect
food consumpt1on est1mates have become trended values decl1n1ng from
72 O percent of product1on 1n 1962 to 67 O percent 1n 1979 (Table
12) Processed uses have become monot1cally non decreas1ng trended
values beg1nn1ng somewhat arb1trar1ly at 15 O percent 1n 1962 and
r1s1ng to 20 O percent 1n 1979 of wh1ch dr1ed cassava (ch1ps and
61stone An Exam1nat1on of Econom1c Data on Ch1nese Cassava Th1s paper was prov1ded to both CIAT and the FAO Stat1st1cal DlVlSlOn s Bas1c Data Un1t 1n 1983 and prov1ded part of the bas1s for subsequent adJustments
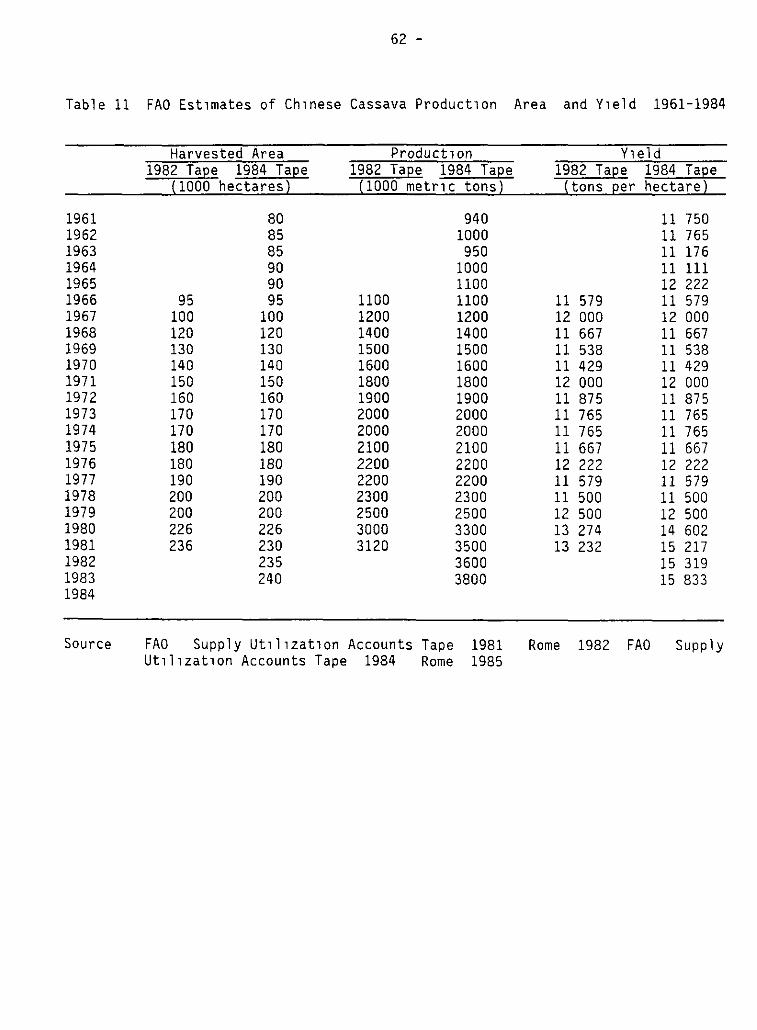
62 -
Table 11 FAO Est1mates of Ch1nese Cassava Product1on Are a and Y1eld 1961-1984
Harvested Area Product10n Y1eld 1982 Ta2e 1984 Ta2e 1982 Ta2e 1984 Ta2e 1982 Ta2e 1984 Ta2e
(1000 hectares) (1000 metr1c tons) (tons 2er hectare)
1961 80 940 11 750 1962 85 1000 11 765 1963 85 950 11 176 1964 90 1000 11111 1965 90 1100 12 222 1966 95 95 1100 1100 11 579 11 579 1967 100 100 1200 1200 12 000 12 000 1968 120 120 1400 1400 11 667 11 667 1969 130 130 1500 1500 11 538 11 538 1970 140 140 1600 1600 11 429 11 429 1971 150 150 1800 1800 12 000 12 000 1972 160 160 1900 1900 11 875 11 875 1973 170 170 2000 2000 11 765 11 765 1974 170 170 2000 2000 11 765 11 765 1975 180 180 2100 2100 11 667 11 667 1976 180 180 2200 2200 12 222 12 222 1977 190 190 2200 2200 11 579 11 579 1978 200 200 2300 2300 11 500 11 500 1979 200 200 2500 2500 12 500 12 500 1980 226 226 3000 3300 13 274 14 602 1981 236 230 3120 3500 13 232 15 217 1982 235 3600 15 319 1983 240 3800 15 833 1984
Source FAO Supply Ut1l1zat1on Accounts Tape 1981 Ro me 1982 FAO Supply Ut1l1zat1on Accounts Tape 1984 Ro me 1985
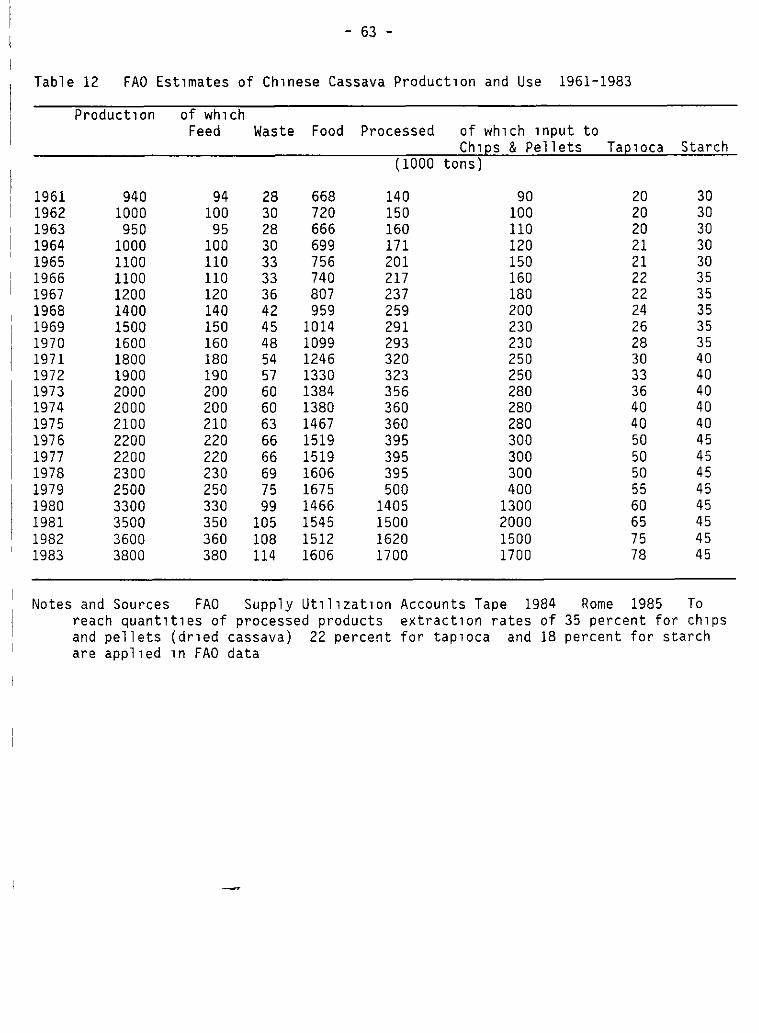
- 63 -
Table 12 FAO Est1mates of Ch1nese Cassava Product1on and Use 1961-1983
Product1on of wh1ch Feed Waste Food Processed of wh1ch 1nput te
Ch1es & Pellets Tae1oca Starch (1000 tons)
1961 940 94 28 668 140 90 20 30 1962 1000 100 30 720 150 100 20 30 1963 950 95 28 666 160 110 20 30 1964 1000 100 30 699 171 120 21 30 1965 1100 110 33 756 201 150 21 30 1966 1100 110 33 740 217 160 22 35 1967 1200 120 36 807 237 180 22 35 1968 1400 140 42 959 259 200 24 35 1969 1500 150 45 1014 291 230 26 35 1970 1600 160 48 1099 293 230 28 35 1971 1800 180 54 1246 320 250 30 40 1972 1900 190 57 1330 323 250 33 40 1973 2000 200 60 1384 356 280 36 40 1974 2000 200 60 1380 360 280 40 40 1975 2100 210 63 1467 360 280 40 40 1976 2200 220 66 1519 395 300 50 45 1977 2200 220 66 1519 395 300 50 45 1978 2300 230 69 1606 395 300 50 45 1979 2500 250 75 1675 500 400 55 45 1980 3300 330 99 1466 1405 1300 60 45 1981 3500 350 105 1545 1500 2000 65 45 1982 3600 360 108 1512 1620 1500 75 45 1983 3800 380 114 1606 1700 1700 78 45
Notes and Sources FAO Supply Ut1l1zat1on Accounts Tape 1984 Reme 1985 Te reach quant1t1es of processed products extract1on rates of 35 percent for ch1ps and pellets (dr1ed cassava) 22 percent for tap1oca and 18 percent for starch are appl1ed 1n FAO data
64 -
pellets for feed e1ther for dornest1c use or export) starts at 2/3 of
the processed arnount 1n 1962 and r1ses to 80 O percent 1n 1979
Cassava 1nput te starch product1on beg1ns at 20 O percent of the
processed amount 1n 1962 and decl1nesto 9 O percent 1n 1979 The
absolute quant1t1es 1n FAO data form a step funct1on rerna1n1ng
constant for flve-year per1ods then 1ncreas1ng by 5 thousand tons 1n
a s1ngle year then rerna1n1ng constant aga1n for f1ve years Cassava
1nput to tap1oca product1on cornpr1ses the rerna1nder w1th absolute
quant1t1es r1s1ng 1n s1rn1lar rnonot1cally non-decreaslng fash1on but
w1th shares decl1n1ng sl1ghtly to 11 percent by 1979
FAO data appear 1n other formats but the stat1st1cal base or
lack thereof rema1ns the sarne For exarnple the Standard1zed
Cornmod1ty Balances Tape 1984 (Rome 1985) 1ncludes ser1es for
ava1lab1l1ty (product1on m1nus exports) food (d1rect food
consurnpt1on plus cassava 1nput to tap1oca process1ng) and other
uses (waste plus cassava 1nput to starch process1ng) Because of
the rnass1ve 1ncrease 1n exports 1n 1979-81 the post 1979 FAO ser1es
exh1b1t sorne pecul1ar1t1es Dr1ed cassava 1nput on the Supply
Ut1l1zat1on Tape 1ncreases from 20 O percent to 42 6 percent of
product1on from 1979 to 1980 (Table 12) for exarnple and the prograrn
synthes1z1ng these ser1es generated large negat1ve nurnbers for other
uses 1n 1980 and 1984 on the Standard1zed Cornrnod1ty Balance Tape
Nevertheless these ser1es represent sorne 1rnprovernent 1n
cred1b1l1ty over the 1981 82 tapes The waste percentage has been
lowe1ed (to what 1s probably the rn1n1mum pararnetl 1c value used by
FAO) The est1rnated product1on shares of processed cassava have been
- 65 -
ra1sed very substant1ally and exh1b1t a r1s1ng trend 1nclud1ng
sl1ghtly r1s1ng then stagnat1ng absolute quant1t1es for starch
product1on and a mass1ve accelerat1on 1n dr1ed cassava to parallel
the appearance of lucrat1ve export opportun1t1es 1n the 1980s Food
uses exh1b1t a plaus1ble decl1n1ng share of cassava product1on and
the FAO trade data now 1ncludes the overwhelm1ngly 1mportant
movements 1n the dr1ed cassava trade s1nce 1979 But 1t must be
remembered that there 1s no actual stat1st1cal bas1s for these
ut1l1zat1on shares save a very 1nd1rect ene based on the fore1gn
trade data and all ser1es are essent1ally der1ved from the almost
wholly unrel1able product1on est1mates
Of course 1t 1s much eas1er to cr1t1c1ze than to suggest
super1or alternat1ves s1nce l1ttle quant1tat1ve 1nformat1on from
Ch1na 1s ava1lable But 1t may be reasonable to suggest that several
of the 1mprovements s1nce the 1981-82 tape d1d not go far enough
Ch1na has developed a cons1derable reputat1on for low food waste As
others have prev1ously 1nd1cated th1s reputat1on may be somewhat
exaggerated 62 But w1th a large proport1on of the cassava crop
allocated to same-farm an1mal feed and h1gh labor appl1cat1on per
hectare one may reasonably expect that at least cassava waste 1n
Ch1na 1s qu1te low
The 1982 CIAT delegat1on observed that the pr1mary use of
cassava was as an1mal feed Of course the1r sample was b1ased
toward more product1ve farms though they v1s1ted sorne very poor
62e 9 Compos1t1on
Vaclav Sm1l Prospects
Ch1na s Food Ava1lab1l1ty Requ1rements Food Pol1cy (May 1981) pp 67-77
66 -
communes where cassava was the pr1nc1pal human food source V1s1t1ng
any of the state farms 1mmed1ately b1ased the sample on such a br1ef
tr1p Based on Table 1 and other f1gures prov1ded above state farm
cassava plant1ngs could not have exceeded 3 5 percent of Guangx1
cassava area 1n 1984 although probably totall1ng 5-10 percent of
product1on In Guangdong the proport1ons could be sl1ghtly h1gher
but state farm cassava 1s clearly a m1nor share of the total
However the CIAT delegat1on found cassava pr1mar1ly grown for an1mal
feed on communes as well as on state farms
Accord1ng to the extens1ve surveys (also b1ased toward more
product1ve farms) conducted by NanJlng Un1vers1ty students superv1sed
by John Loss1ng Buck between 1929 and 1933 18 percent of the output
of sweet potatoes (generally a food preferred by Ch1nese to cassava)
was employed as an1mal feed 1n the reg1on The proport1on was almost
half 1n the more product1ve areas of eastern Guangdong Only 60
percent of the taro crop was used for human food 63 S1nce the 1930s
sw1ne stocks and gra1n and sugar product1on have 1ncreased more
rap1dly than the human populat1on 1n the reg1on (Table 13) and per
cap1ta 1ncomes have 1ncreased 01lseed and soybean product1on has
decl1ned 1n Guangx1 but 1n Guangdong product1on 1ncreased at about
the rate of populat1on growth over the 5 decade per1od g1ven that
1ncluded 1930s f1gures are somewhat prone to overest1mat1on Cattle
stocks decl1ned over the 1970s 1n Guangdong but dueto the1r smaller
numbers and d1et preference for leaves and grasses over roots th1s
63John Loss1ng Buck Land (Nank1ng Nank1ng Un1vers1ty
Ut1l1zat1on 1n Ch1na (Atlas and Study) 1937) Atlas pp 82 and 98
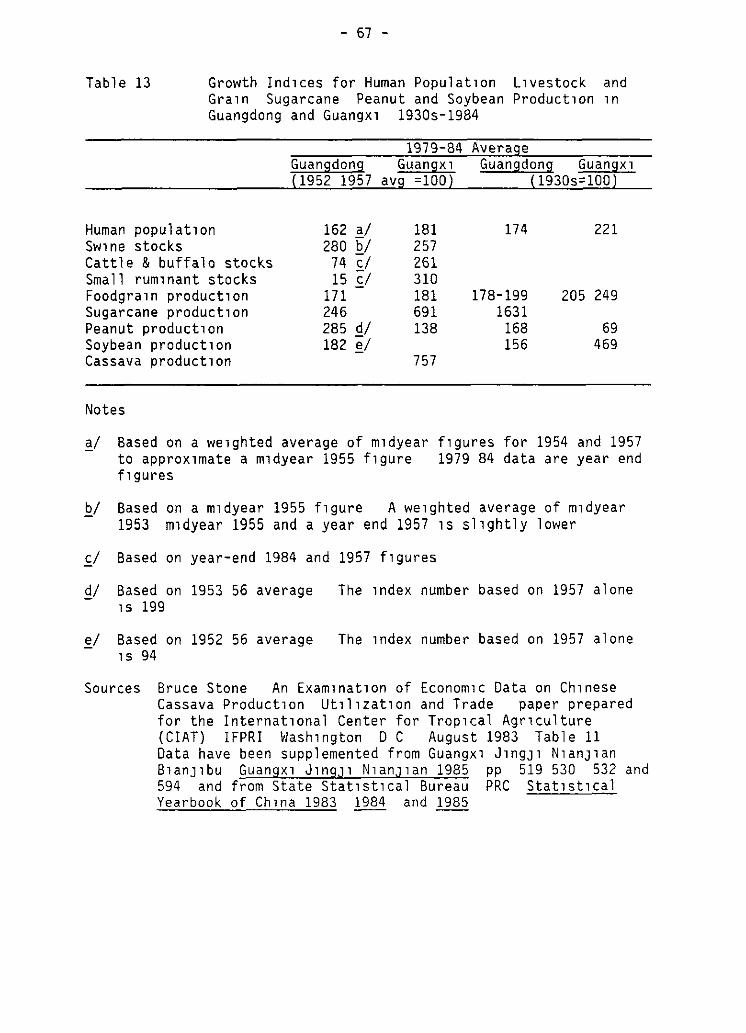
- 67 -
Table 13 Growth Ind1ces for Human Populat1on L1vestock and Gra1n Sugarcane Peanut and Soybean Product1on 1n Guangdong and Guangx1 1930s-1984
Human populat1on Sw1ne stocks Cattle & buffalo stocks Small rum1nant stocks Foodgra1n product1on Sugarcane product1on Peanut product1on Soybean product1on Cassava product1on
Notes
1979-84 Guangdong Guangx1 (1952 1957 avg =100)
162 a/ 280 b/
74 e/ 15 f/
171 246 285 d/ 182 g/
181 257 261 310 181 691 138
757
Average Guangdong Guangx1
(1930s=100)
174
178-199 1631
168 156
221
205 249
69 469
~/ Based on a we1ghted average of m1dyear to approx1mate a m1dyear 1955 f1gure f1gures
f1gures for 1954 and 1957 1979 84 data are year end
g/ Based on a m1dyear 1955 f1gure A we1ghted average of m1dyear 1953 m1dyear 1955 anda year end 1957 1s sl1ghtly lower
f/ Based on year-end 1984 and 1957 f1gures
g/ Based on 1953 56 average The 1ndex number based on 1957 alone lS 199
~/ Based on 1952 56 average The 1ndex number based on 1957 alone lS 94
Sources Bruce Stone An Exam1nat1on of Econom1c Data on Ch1nese Cassava Product1on Ut1l1zat1on and Trade paper prepared for the Internat1onal Center for Trop1cal Agr1culture (CIAT) IFPRI Wash1ngton D C August 1983 Table 11 Data have been supplemented from Guangxl J1ngJl N1anJ1an B1anJ1bu Guangx1 J1ngJ1 N1anJ1an 1985 pp 519 530 532 and 594 and from State Stat1st1cal Bureau PRC Stat1st1cal Yearbook of Ch1na 1983 1984 and 1985
- 68 -
decl1ne would have less effect on the allocat1on of the cassava root
1tself than would the sw1ne stock growth rate
Accord1ng to a 1980 survey of 15 914 households an average of
94 4 k1lograms of meat (mostly pork) 35 6 k1lograms of gra1ns and
126 k1lograms of vegetables were produced on pr1vate plots
Although hog feed1ng reg1mens 1n Ch1na have been concentrate poor
h1stor1cally the fatten1ng process would st1ll requ1re around 82
k1lograms of concentrate per hog and the requ1rement has been r1s1ng
Wlth greater peasant autonomy adJusted purchase pr1ce structure and
grow1ng acceptance that extremely concentrate poor d1ets are
uneconom1c 64 In Guangdong and Guangx1 a s1zable proport1on of
th1s concentrate cons1sts of cassava taro and sweet patato Of the
three cassava would be the crop w1th the h1ghest proport1on
allocated for feed One may conclude that even for domest1cally
ut1l1zed cassava 20-25 percent (for feed use plus dr1ed cassava
from 1961 79 1s probably too small a proport1on for feed and the
trend must have been r1s1ng more rap1dly over the per1od than assumed
by FAO When one cons1ders that from 1980 82 dr1ed cassava exports
must have const1tuted 30-60 percent of what the 1982 CJAT delegat1on
was told was nat1onal prod~ct1on and that exports may st1ll exceed
30 percent of annual output even the current FAO feed proport1ons of
50-55 percent ( dr1ed cassava plus feed ) may be too low
64see Stone Ch1na s 1985 Foodgra1n Product1on Target pp 99 103 The 1980 survey appeared 1n X1nhua [New Ch1na News Agency] news bullet1n June 16 1981
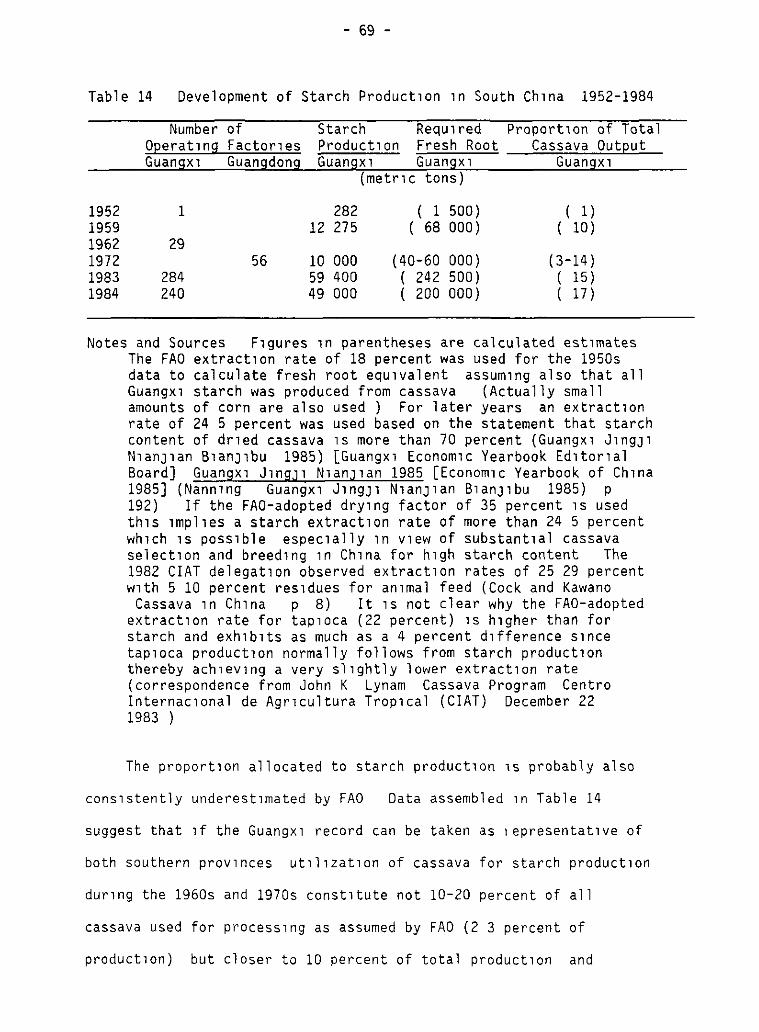
- 69 -
Table 14 Oevelopment of Starch Product1on 1n South Ch1na 1952-1984
Number of Starch Requ1red Proport1on of Total 0Eerat1ng Factor1es Product1on Fresh Root Cassava OutEut Guangx1 Guangdong Guangx1 Guangx1 Guangx1
(metr1c tons)
1952 1 282 ( 1 500) ( 1 ) 1959 12 275 ( 68 000) ( 10) 1962 29 1972 56 10 000 (40-60 000) (3-14) 1983 284 59 400 ( 242 500) ( 15) 1984 240 49 000 ( 200 000) ( 17)
Notes and Sources F1gures 1n parentheses are calculated est1mates The FAO extract1on rate of 18 percent was used for the 1950s data to calculate fresh root equ1valent assum1ng also that all Guangx1 starch was produced from cas5ava (Actually 5mall amounts of corn are al5o used ) For later year5 an extract1on rate of 24 5 percent was used based on the 5tatement that starch content of dr1ed ca55ava 15 more than 70 percent (Guangx1 J1n9J1 N1anJ1an B1anJ1bu 1985) [Guangx1 Econom1c Yearbook Ed1tor1al Board] Guangx1 J1ngJ1 N1anj1an 1985 [Econom1c Yearbook of Ch1na 1985] (Nann1ng Guangx1 J1ngJ1 N1anJ1an B1anJ1bu 1985) p 192) If the FAO-adopted dry1ng factor of 35 percent 15 used th15 1mpl1es a starch extract1on rate of more than 24 5 percent wh1ch 1s poss1ble espec1ally 1n v1ew of 5ubstant1al cas5ava select1on and breed1ng 1n Ch1na for h1gh 5tarch content The 1982 CIAT delegat1on observed extract1on rates of 25 29 percent w1th 5 10 percent re51dues for an1mal feed (Cock and Kawano
Cassava 1n Ch1na p 8) It 1s not clear why the FAO-adopted extract1on rate for tap1oca (22 percent) 1s h1gher than for starch and exh1b1ts as much as a 4 percent d1fference s1nce tap1oca product1on normally follows from starch product1on thereby ach1ev1ng a very sl1ghtly lower extract1on rate (correspondence from John K Lynam Cassava Program Centro Internac1onal de Agr1cultura Trop1cal (CIAT) Oecember 22 1983 )
The proport1on allocated to starch product1on 1s probably also
cons1stently underest1mated by FAO Data assembled 1n Table 14
suggest that 1f the Guangx1 record can be taken as 1epresentat1ve of
both southern prov1nces ut1l1zat1on of cassava for starch product1on
dur1ng the 1960s and 1970s const1tute not 10-20 percent of all
cassava used for process1ng as assumed by FAO (2 3 percent of
product1on) but closer to 10 percent of total product1on and
- 70 -
potent1ally h1gher 1n several low product1on years Assum1ng the
adopted extract1on rates and the Guangx1 ser1es are roughly correct
and that starch produced from raw mater1als other than cassava was
1ndeed very m1nor 1n Guangx1 then the starch 1ndustry cla1med more
than 15 percent of fresh root product1on 1n the Autonomous Reg1on 1n
1983 and 1984 The proport1on for Guangdong 1s probably somewhat
lower but appears to be r1s1ng at present
All 1n all 1f forced to est1mate current ut1l1zat1on of
Ch1nese cassava m1ght run 60-65 percent for feed (1nclud1ng dr1ed
cassava plus fresh feed exports and domest1c use) 15 20 percent
for the starch 1ndustry 2-4 percent for tap1oca product1on and as
l1ttle as 1-3 percent for waste leav1ng somewhere around 10-20
percent for d1rect human consumpt1on As suggested 1n earl1er papers
andas FAO seems to accept 1t 1s qu1te poss1ble that the 3 m1ll1on
ton c1rca 1980 81 product1on f1gure 1s an underest1mate but the
product1on trend for the last few years 1s almost certa1nly downward •
The Guangx1 starch product1on f1gure l1sted somewhat arb1trar1ly
for 1972 1s based on the statement that starch product1on 1n Guangx1
rema1ned at around 10 000 tons dur1ng the 1960s and 1970s (Guangxl
J¡ngJ1 N1an]1an 1985 p 192) Most data 1n the table appeared 1n
1b1d The number of starch factor1es operat1ng 1n Guangx1 1n 1962
and 1n Guangdong 1n 1972 are from L1ang Guangshang (ed ) t1u shu --Za1pe1 yu L1yong [Cassava Cult1vat1on and Use] (Guangzhou Guangdong
KeJ1 Chubanshe [Guangdong Sc1ent1f1c and Techn1cal Publ1sh1ng Housel
1980) p ~~ The proport1on of total Guangx1 cassava product1on was
calculated from data appear1ng 1n th1s table and 1n Table 2
- 71 -
Cassava for d1rect human consumpt1on
The prev1ous sect1on has concluded that cassava for d1rect human
consumpt1on probably compr1ses only 10-20 percent of current
product1on There appear to be four pr1nc1pal categor1es of d1rect
human consumpt1on of cassava 1n Ch1na consumpt1on related to ethn1c
m1nor1t1es where cassava has a trad1t1onal d1etary role consumpt1on
related to forest cult1vat1on 1n remate areas consumpt1on assoc1ated
w1th exceed1ngly poor and/or r1sk prone farm1ng areas consumpt1on
related to part1cular cu1s1ne and espec1ally seasonal preparat1ons
These four categor1es are not mutually exclus1ve but seem to
character1ze the d1rect human consumpt1on demand for cassava
L1ttle recent ethnograph1c 1nformat1on on m1nor1t1es 1n South
Ch1na seems to be ava1lable but taro and cassava are known to be
1mportant food 1tems among the Yao m1nor1ty 1n northern Guangdong 65
The 11ao people of Tha1land are also hab1tual consumers of cassava
Mao people 1n South Ch1na were l1kew1se reported to eat cassava and
mao potatoes dur1ng the 1950s 66 Even among Han Ch1nese (93 3
percent of Ch1na s populat1on) home processed cassava flour 1s often
used as a th1ckener 1n southern Ch1nese soups and 1n mak1ng spec1al
cakes at fest1val t1mes such as New Year s Eve 1n FUJ1an for
example 67
65suck Land Ut1l1zat1on 1n Ch1na (Atlas) p 98
66sun J1ngzh1 (ed ) Huanan D1chu J1ngJ1 0111 Bureau PRC Stat1st1cal Yearbook of Ch1na, 1985 p
State Stat1st1cal 195
67cock and Kawano Cassava 1n Ch1na Bureau PRC Stat1St1cal Yearbook of Ch1na,
p 11 1985
State Stat1st1cal p 195
- 72
Poorly developed and poorly 1ntegrated markets are almost a
def1n1ng characterlstlc of develop1ng countr1es and Ch1na 1s no
except1on In Ch1na market development was further retarded by a
number of factors F1rst for a th1rty year per1od c1v1l war and
World War II comb1ned to destroy normal market act1v1ty 1n many areas
of Ch1na Although Guangdong and Guangx1 were spared to a much
greater extent than North Ch1na the Northeast and the Yangz1 Valley
they were not unaffected by war and nearby cassava-grow1ng prov1nces
such as Yunnan and Hunan were d1rectly 1nvolved as was FuJlan
located d1rectly across the stra1ts from colon1al Ta1wan For
example transport veh1cles and draft an1mals were purchased or
commandeered for the war effort War t1me 1nflat1on sent market1ng
back to a seml-barter era and cred1t fac1l1t1es were severely
affected
In the l950s cond1t1ons stab1l1zed but the government soon
began to take over large segments of market1ng act1v1t1es W1th
gra1n cr1ses 1n 1953 and 1955 and the d1ff1cult1es the government was
exper1enc1ng w1th procurement of foodstuffs for c1t1es gra1n trad1ng
became a state monopoly 1n 1954 and by 1955 each un1t of land 1n
Ch1na was ass1gned a f1xed quota of (usually) gra1n to be del1vered
to state purchas1ng organ1zat1ons at low f1xed pr1ces Taxes were
also pa1d 1n k1nd but gra1n del1very obl1gat1ons d1d not end there
After reta1n1ng a prov1nc1ally determ1ned per cap1ta quant1ty to meet
1mmed1ate food feed and seed needs of rural farms and households
and even after tax and quota obl1gat1ons were met 80 90 percent of
all surplus gra1n was also to be sold to the state Not only was
pt 1vate gra1n trad1ng 1llegal and most gra1n 1n excess of a modest
- 73 -
standard for heme consumpt1on soaked up by government purchas1ng
organ1zat1on but pr1vate traders were des1gnated as class enem1es
The state for 1ts part was hav1ng enough trouble prov1d1ng for
urban and army consumpt1on as well as reserv1ng one-two m1ll1on tons
per year to export for fore1gn exchange For the most part only
relat1vely prom1nent rural areas exper1enc1ng natural d1sasters
rece1ved rel1ef gra1n More remete and most very peor areas were
left on the1r own w1thout access te gra1n suppl1es from the outs1de
After the fam1nes 1n 1960-61 and espec1ally dur1ng the Cultural
Revolut1on per1od (1966-76) th1s s1tuat1on was lnstltUtlonallzed as
a pol1cy of local self suff1c1ency w1th d1sastrous lmpl1cat1ons for
ga1ns from speclal1zat1on and trade and for exceed1ngly poor r1sk-
prone areas h1stor1cally dependent on trad1ng and non agr1cultural
act1v1t1es to garmer enough te eat W1th procurement problems
pers1st1ng the government further restr1cted non-farmlng act1v1t1es
and made m1grat1on 1llegal 1n arder to l1m1t the state s urban
obl1gat1ons but thereby b1nd1ng many farmers even more closely to
poor and r1sk prone agr1culture 68
68see Bruce Stone Relat1ve Foodgra1n Pr1ces 1n the People s Republ1c of Ch1na Extract1ve Rural Taxat1on Through Publ1c rlonopoly 1n John W Mellar and Ra1sudd1n Ahmed (eds ) Agr1cultural Pr1ce Pol1cy for Develop1ng Countr1es (Balt1more Johns Hopk1ns Un1vers1ty Press 1987) and Bruce Stone Ch1nese Soc1al1sm s Record en Food and Agr1culture Problems of Commun1sm vol 35 no 5 (Sept Oct ) 1986 pp 63-72 See also Tang and Stone Food Product1on 1n the People s Republ1c of Ch1na Kenneth \/alker Foodgra1n Procurement and Consumpt1on 1n Ch1na (Cambr1dge Cambr1dge Un1vers1ty Press 1984) and N1cholas Lardy Agr1culture 1n Ch1na s Modern Econom1c Development (Cambr1dge Cambr1dge Un1vers1ty Press 1983)
74
It 1s not d1ff1cult to 1mag1ne that w1th th1s 1nst1tut1onal
framework cassava at least 1n the south had a part1cularly
1mportant role to play Cassava was an 1deal crop for 1nsur1ng
m1n1mum levels of consumpt1on because 1t 1s a relat1vely drought-
res1stant stable y1eld1ng eas1ly stored crop prov1d1ng h1gh
calor1c levels per un1t area and performs well relat1ve to
alternat1ve crops even under poor agronom1c pract1ce and so1l
cond1t1ons As a crop cult1vable on forest lands and h1lls1des 1t
was also 1deal for susta1n1ng reclamat1on teams 1n remote areas
W1th the rap1d 1ncreases 1n South Ch1nese r1ce product1on dur1ng
the past decade (Table 5 6 and 13) the 1980s legal1zat1on of
pr1vate gra1n trad1ng and guaranteed state food del1ver1es for areas
concentrat1ng on the product1on of econom1c crops cassava s spec1al
1nst1tut1onally-,nduced 1mportance has been decl1n1ng However
cassava 1s st1ll grown 1n exceed1ngly poor areas 1n South Ch1na for
essent1ally the same reasons food secur1ty and easy prov1s1on of
needed calor1es under 1nopt1mal cond1t1ons lt should be emphas1zed
for example that seven count1es 1n Guangdong and e1ght 1n Guangx1
averaged per cap1ta collect1ve d1str1buted 1ncome 1n 1977 of less
than 50 yuan ($20 25 U S at concurrent off1c1al rates) 69 Wh1le
th1s category excludes 1mportant 1ncome sources such as p1 1vate plot
and s1del1ne product1on and sorne 1n k1nd payments from collect1ve
work 1t 1s 1nd1cat1ve of the amount of cash ava1lable for farmers
69Nongyebu Renm1n Gongshe GuanllJU [M1n1stry of Agr1culture Bureau of People s Commune Management] Y1J1uq1q1 zh1 Y1J1Uq1J1Unlan Quanguo Q1ongx1an Q1ngx1ng [The Cond1t1on of the Nat1on s Poor Count1es 1977 1979] X1nhua Yuebao [New Ch1na Monthly] no 2 1981 PP 117 120
- 75 -
from the1r pr1nc1pal assets 1n very poor local1t1es 70 The number
of count1es fall1ng below th1s lowest benchmark 1ncreased to 11 1n
Guangdong 1n 1978 but decl1ned to 7 1n 1979 (1n Guangx1 8 1n 1978
and 6 1n 1979) In Guangdong the very poorest reg1ons appear to be
1n the northeast such as Wuhua and Longchuan Count1es and on Ha1nan
Island 1n the South 1nclud1ng the known cassava area of Basuo
(Dongfang County) In Guangx1 such count1es seem to be clustered 1n
the north and west for example Du an Yaozu Autonomous County
Luocheng Donglan and Napo Count1es as well as Barna Yaozu
Autonomous County where cassava 1s known to be w1dely cult1vated 71
But w1th the except1on of the exceed1ngly product1ve Pearl R1ver
Delta no part of South Ch1na can be excluded as a reg1on where
d1rect consumpt1on of cassava 1s not 1mportant for sorne segment of
the poorer rural populat1on Areas were cassava 1s an 1mportant
d1rect calarle source need not be remate Even w1th1n the Ha1kou
Mun1c1pal Area on Ha1nan Island 11 percent of cult1vated area 1n the
Yong S1ng Townsh1p for example 1s planted w1th cassava two-thlrds
of wh1ch 1s consumed d1rectly as a staple 72 Th1s 1s because only 4
70D1str1buted collect1ve 1ncome averaged around two th1rds of the total 1nclud1ng pr1vate plot and s1del1ne 1ncome dur1ng those years accord1ng to a State Stat1st1cal Bureau (SSB) survey of 10 282 households (Zhongguo GUOJla TongJlJU Zhongguo TongJl N1anJ1an, 1981 pp 431) But th1s may have excluded 1n k1nd d1str1but1on of product1on from collect1ve lands For a full d1scuss1on of Ch1nese d1str1but1on data and 1ts problems see E B Vermeer Income D1fferent1als 1n Rural Ch1na The Ch1na Quarterly vol 89 (March) 1982 pp 1 21
71Nongyebu Renm1n Gongshe GuanllJU Q1ngx1ng X1nhua Yuebao no 2 1981
Cassava 1n Ch1na
1977-1979 Quanguo Q1ongx1an
pp 10 11
- 76
percent of the farmed area 1s su1table for r1ce cult1vat1on the
rema1nder be1ng rocky h1lls1des upon wh1ch fru1t tree hort1culture 1s
be1ng attempted Cassava plant1ng prov1des an econom1c hedge aga1nst
heavy market dependence
The Starch Market
What l1ttle quant1tat1ve 1nformat1on 1s ava1lable on starch
product1on 1n Guangdong and Guangx1 has been recorded 1n Table 14
H1stor1cally a s1gn1f1cant share of f1nanc1ng for capac1ty
construct1on andan 1mportant share of sales del1ver1es have been
assoc1ated w1th overseas Ch1nese espec1ally 1n nearby Hong Kong and
Macau In 1952 the Wuzhou Charcoal lndustry started Guangx1 s f1rst
starch factory (J1ul1an Crude Starch Factory later renamed the
Wuzhou Mun1c1pal Starch Factory) w1th f1nanc1al ass1stance from the
government and from overseas Ch1nese Its sanJ1aopa1 [Tr1angle
Brand] cassava starch was exported from Wuzhou 1n east central
Guangx1 to Hong Kong Macau Southeast As1a Japan and the M1ddle
East S1nce the m1d to late 1950s Be1ha1 1n the far south Barna
Yaozu Autonomous County 1n the northwest XlJlang Farm 1n the east
Wum1ng Overseas Ch1nese Farm 1n central Guangx1 N1ngm1ng Overseas
Ch1nese Farm 1n the southwest and other farm1ng areas set up f1xed
scale factor1es 73 The des1gnat1on Overseas Ch1nese Farm 1s an
1nd1cat1on that overseas Ch1nese f1nanc1al resources are 1nvolved 1n
the commune s development
73Guangx1 JlngJl N1anJ1an BlanJlbu Guangx1 Jln9Jl N1anJ1an 1985 p 192
- 77 -
In Guangdong cassava starch product1on may have begun even
earl1er but at least by the early 1970s 56 factor1es had been set
up 1n the prov1nce and hongpa1 [Red Brand] cassava starch from the
Dongguan Flour and Starch Factory on the Pearl R1ver Delta was sold
w1dely 1n Southeast As1a and Eastern Europe 74 Dur1ng the 1950s
1960s and 1970s 1t seems that product1on econom1es and the pr1ce
structure concertedly favored cassava as a raw mater1al for starch
product1on s1nce desp1te the prov1nc1al self-suff1c1ency 1mperat1ves
for the per1od Guangdong and Guangx1 exported starch not only to
Hong Kong Macau and fore1gn countr1es but to other Ch1nese
prov1nces as well
W1th l1beral1zat1on of rural econom1c act1v1t1es s1nce the late
1970s small scale starch process1ng plants have been establ1shed
espec1ally as townsh1p and v1llage enterpr1ses By 1983 the total
number of starch factor1es 1n Guangx1 had 1ncreased sharply to 284
though w1th comb1ned f1xed assets of only 25 m1ll1on yuan 75 But
e1ther product1on econom1es no longer so clearly favored the use of
cassava as a raw mater1al or cassava product1on 1n other prov1nces
was expand1ng to meet the1r demands for starch Th1s comb1nat1on of
overdevelopment of product1on capac1ty and loss of part of the
1nterprov1nc1al market brought about a contract1on 1n the South
Ch1nese statch 1ndustry 1n 1984 In Guangx1 the number of
enterpr1ses decl1ned by 17 percent and product1on fell by 16 percent
(Table 14) However part of th1s decl1ne may be dueto 1ntens1f1ed
74L1ang Guangshang (ed ) r1ushu Za1pe1 yu L1yong p 9
75Guangx1 J1ng]l N1an]1an 1985 p 192
- 78
~ compet1t1on from nearby Zhaoq1ng and Shaoquan Prefectures 1n
Guangdong where starch product1on has been 1ncreas1ng rap1dly 76
A var1ety of 1ndustr1es use cassava starch 1n Ch1na the most
trad1t1onal be1ng the cotton yarn 1ndustry wh1ch prov1ded demand for
the f1rst Guangx1 factory 1n Wuzhou 77 But the Wuzhou and Be1ha1
factor1es have expanded and d1vers1f1ed to use cassava starch as a
bas1s for glucose product1on In 1984 Guangx1 produced 7 800 tons
of glucose pr1mar1ly for the candy 1ndustry 80 percent of th1s
total was produced 1n the Wuzhou and Be1ha1 factor1es the latter
export1ng to Hong Kong Tha1land and other countr1es The Wuzhou
factory has also 1n1t1ated tr1al product1on of denatured starch and
w1th purchase of techn1cally super1or equ1pment from Japan has
1ncreased 1ts extract1on rate by more than 5 percent 78
In Guangdong the Dongguan Factory has also d1vers1f1ed and now
produces glucose brewer s yeast and w1ne 79 As early as 1972 1t
exported cassava-leaf starch to Japan and to England large
quant1t1es of glucose part1ally based on m1llet as well as
cassava 80 In Shaoauan and Zhaoq1ng Prefectures 1n add1t1on to
76oelphl survey response comments by Huang X1 agronom1st Inst1tute for Dryland Gra1n Crops Guangdong Prov1nce Academy of Agr1cultural Sc1ence Guangzhou June 28 1986
77sun J1ngzh1 Huanan J1ngJ1 D1chu pp 258 and 333 334
78Guangxl J1ngJ1 N1an]1an 1985, p 192
79correspondence from Graham Johnson Department of Anthropology and Soc1ology Vancouver Soptember 19 1983
Professor of Anthropology Un1vers1ty of Br1t1sh Columb1a
80L1ang Guangshang (ed ) Mushu Za1pe1 yu L1yong p 9
- 79 -
cassava starch factor1es a number of other process1ng 1ndustr1es
have been establ1shed wh1ch ut1l1ze cassava 1nclud1ng a monosod1um
glutamate factory molasses plants brewer1es and feed process1ng plants 81
81oelphl survey response from Huang X1 June 28 1986

IV
A Multi-Market
INDONESIA
1 Cassava Economy
In the 1960 s Indonesia and especially Java was portrayed as the epitome of the food crisis facing Asia The bleak prospects for 1ncreasing agricultural production on a very restricted farm-size base were most eloquently articulated in the agricultural involution thesis of Clifford Geertz (1963) in which a degrading resource base was accelerated by the increasing impoverishment of the agricultural population The low point for the agricultural sector was arguably reached in 1967 when per cap1ta rice availability reached its lowest level in the decade a situat1on compounded by a tight international rice market and severe foreign exchange constraints However during the next decade rice production grew by 4 2% per annum allowing per capita consumption levels to increase from 91 to 123 kg per year In the 1978-84 period growth in rice production accelerated even further to 6 7% per year High yielding rice variet1es investment in irrigation systems and subsidized fert1lizer prices resulted in dramatic increases in rice yields the principal source of growth in production A rev1talization of r1ce production together with the sound management of sharp increases in oil revenues resulted in an annual GDP growth rate of 7 6% throughout the 1970 s Indonesia had broken out of the low-income trap by focus1ng on domestic needs together with sound investment of export revenues
Rice has been the centerpiece of agricultural policy in Indonesia in the post-war period Rice is the principal source of farmer income the ma]or food source the dominant expenditure item in the consumers budget and therefore the maJor component in consumer price indices Any policies directed to farmer incomes rural employment nutrit1onal object1ves food security or control of 1nflat1on had to cons1der r1ce (Dorosh 1986) The policy thrusts 1n r1ce 1n the last two decades has had two princ1pal dimensiona First through the BIMAS program there has been a concerted effort to create a profitable environment for adoption of yield-increas1ng rice technology A massive extension effort focused on the irrigated sector combined w1th subsidized fertilizer and production cred1t have led to rapid adopt1on of improved technolog1es The second component has been management of domes tic rice prices through BULOG ( the national logistics agency) through support price operations control over importa and development of a buffer stock scheme Both these polic1es impinge on secondary carbohydrate crops such as cassava In the first instance cred1t and extension systems are focused on the 1rr1gated sector with few resources available for upland crops In the second place r1ce pr1ces have a large 1nfluence on the demand for secondary staples such as cassava and maize The 1980 s nevertheless has witnessed sorne tendency toward a more comprehens1ve and thus diversified approach to food and agr1cultural policies as w1tnessed by the 1nvolvement of BULOG 1n the ma1ze and soybean sectors
This chapter draws heavily on the work of the Food Research Institute Stanford Un1versity Many parts of the chapter amount to summaries of the research found 1n Falcon et al The Cassava Economy of Java and 1t 1s hoped the citat1ons are numerous enough to reflect this debt
IV - 2 -
While agricultura! growth on a very l~m~ted farm-size base was achieved through a focus on raising rice yields on Java a complementary strategy was area expansion on the low populated outer islands Th~s
involved providing incentives for people to move off Java and gave rise to the transm~gration projects Indonesian economic planning remains committed to transmigration to the outer islands snd while the initial per family settlement costs appear high the autonomous secondary migrat~on that is now apparent in some of the older projects on Sumatra appear to support this policy of developing the agricultura! frontier in Indonesia
Ironically cassava has remained outs~de the purv~ew of agr~cultural policy in Indonesia and yet the crop has played a s~gnif~cant role in underpinning key policy objectives (see Falcon et al p 165-69) This invisibüity to policy-makers ~s ~nteresting for a crop that is grown throughout Indones~a that has played a key role ~n transmigrat~on
proJects that historically has been an important export crop and that is the second most important calorie source in the diet It is a mark of cassava s inherent productivity and versatility that it has flour~shed
without government support However as pol~cy focus shifts to upland crops part~cularly maize and where there is substitut1on between maize and cassava on both the supply and demand side then there is a need to bring cassava into the policy framework
Markets and Demand
Indones1a is the premier example of a well integrated cassava economy The multi-use characteristics of cassava are fully exploited Cassava is consumed as food both in a fresh and dry form it is exported and a sign1f1cant portion is processed into starch (Table 4 1) Moreover a signif1cant difference in utilization patterns exists between Java and the outer islands On Java utilization forms are fairly balanced between fresh roots for human consumption gaplek and starch On the outer islands on the other hand fresh root consumption is by far the largest consumption form a not surprising fact given the lack of infrastructure and a pr1ncipal focus on subsistence consumption Understanding how cassava production is a;tlocated to these various markets each with relatively different growth potential will aid in developing a more effective planning frame for cassava in the Indonesian agricultura! sector
Cassava for direct human consumption
The food economy of Indonesia 1s based on r1ce Wh1le less preferred than rice cassava 1s the second most important carbohydrate source according to Susenas data (Table 4 2) although it still makes up no more than 10k of average calorie intake The successful extension 1n 1rrigated areas of the high y1elding rice varieties resulted in increas1ng per capita ava1lab1l1ties of the grain during the last decade and a half Trends in cassava consumption are more difficult to interpret The food balance estimates follow production trends and suggest a distinct increase in consumption s1nce 1973 on the other hand the Susenas est1mates suggest more or less stable consumption over the decade (Table 4 3) What is clear
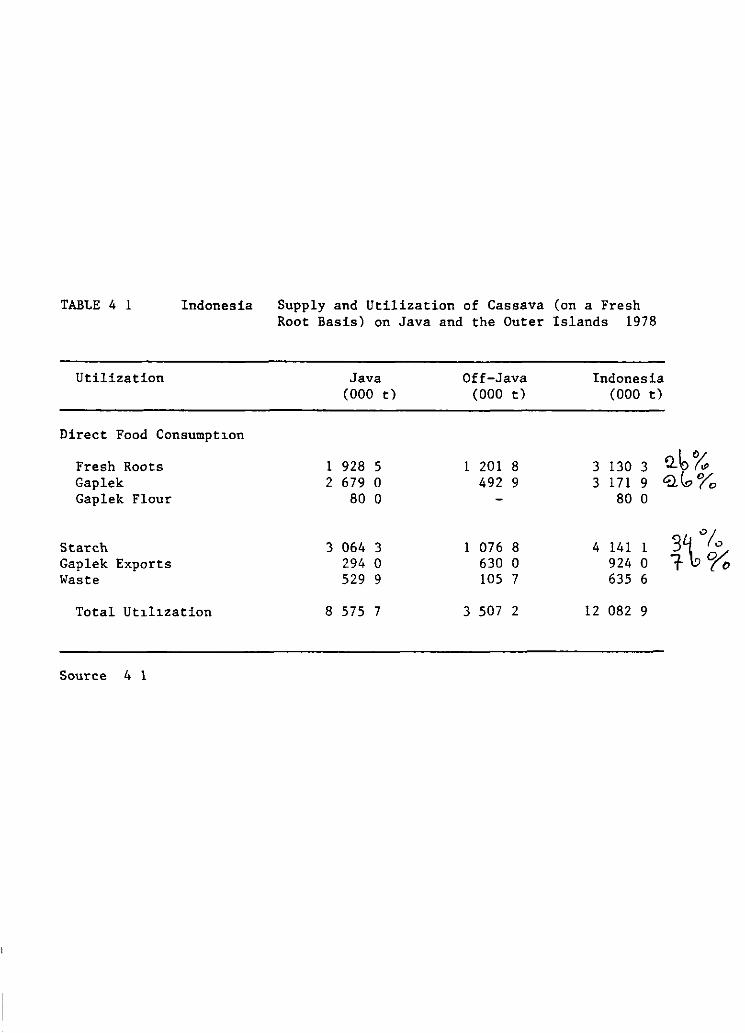
TABT..E 4 1 Indonesia Supply and Utilization of Cassava (on a Fresh Root Basis) on Java and the Outer Islands 1978
Utilization Java Off-Java Indonesia (000 t) (000 t) (000 t)
Direct Food Consumpt~on
Fresh Roots 1 928 S 1 201 8 3 130 3 Q.b% Gaplek 2 679 o 492 9 3 171 9 <:Llo% Gaplek Flour 80 o 80 o
Starch 3 064 3 1 076 8 4 141 1 3\"1.:, Gap le k Exports 294 o 630 o 924 o t % Waste 529 9 105 7 635 6
Total Ut~l~zation 8 575 7 3 507 2 12 082 9
Source 4 1
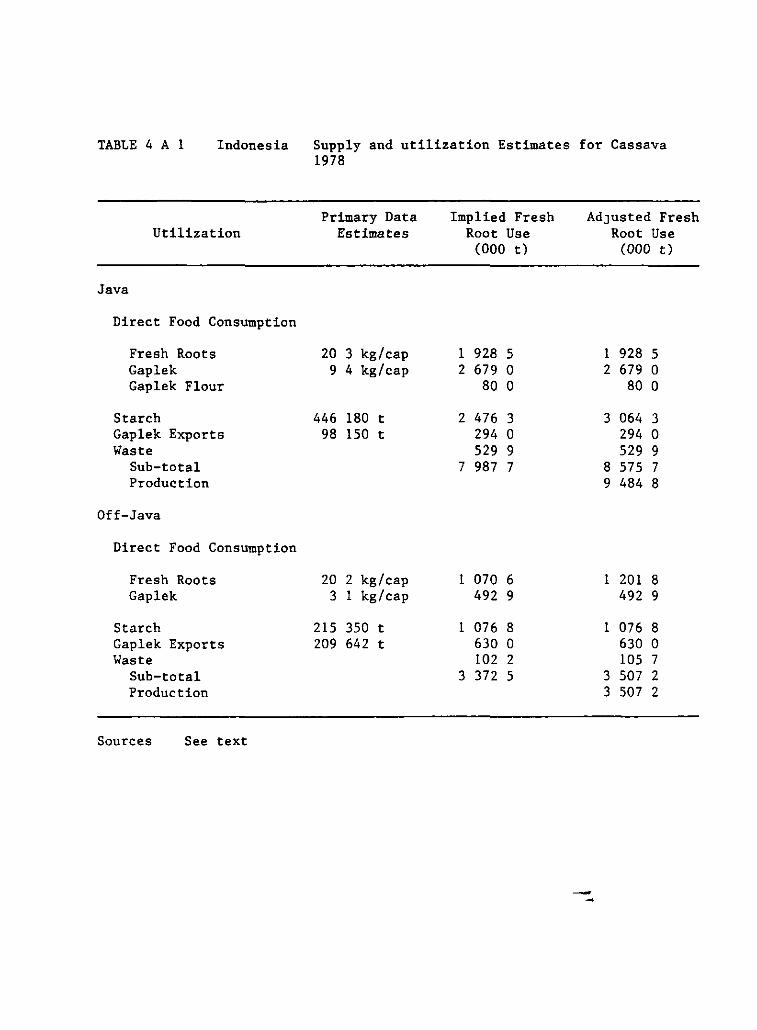
TABLE 4 A 1 Indonesia
Utilization
Java
Direct Food Consumption
Fresh Roots Gap le k Gaplek Flour
Starch Gaplek Exporta Waste
Sub-total Production
Off-Java
Direct Food Consumption
Fresh Roots Gap le k
Starch Gaplek Exports Waste
Sub-total Production
Sources See text
Supply and utilization Estimates for Cassava 1978
Primary Data Estima tes
20 3 kg/cap 9 4 kg/cap
446 180 t 98 150 t
20 2 kg/cap 3 1 kg/cap
215 350 t 209 642 t
Implied Fresh Root Use
(000 t)
1 928 5 2 679 o
80 o
2 476 3 294 o 529 9
7 987 7
1 070 6 492 9
1 076 8 630 o 102 2
3 372 5
AdJUSted Fresh Root Use
(000 t)
1 928 5 2 679 o
80 o
3 064 3 294 o 529 9
8 575 7 9 484 8
1 201 8 492 9
1 076 8 630 o 105 7
3 507 2 3 507 2
--
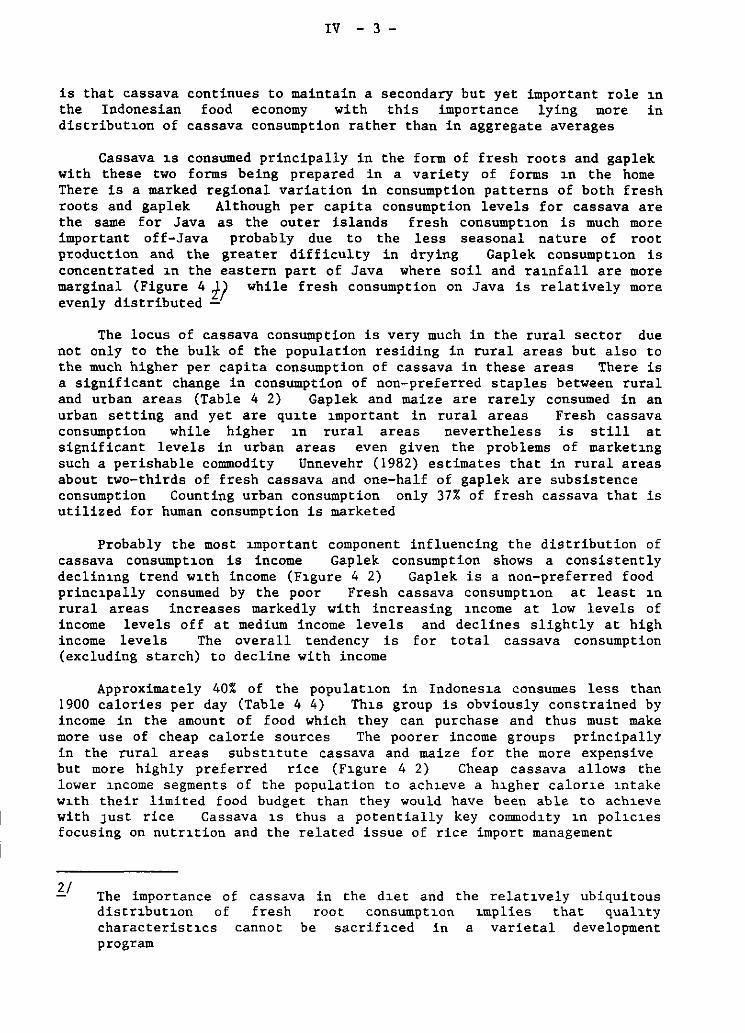
IV - 3 -
is that cassava continues to maintain a secondary but yet important role ~n the Indonesian food economy with this importance lying more in distribut~on of cassava consumption rather than in aggregate averages
Cassava ~s consumed principally in the form of fresh roots and gaplek with these two forms being prepared in a variety of forms ~n the home There is a marked regional variation in consumption patterns of both fresh roots and gaplek Although per capita consumption levels for cassava are the same for Java as the outer islands fresh consumpt~on is much more important off-Java probably due to the less seasonal nature of root production and the greater difficulty in drying Gaplek consumpt~on is concentrated ~n the eastern part of Java where soil and ra~nfall are more marginal (Figure 4 tf while fresh consumption on Java is relatively more evenly distributed -
The locus of cassava consumption is very much in the rural sector due not only to the bulk of the population residing in rural areas but also to the much higher per capita consumption of cassava in these areas There is a significant change in consumption of non-preferred staples between rural and urban areas (Table 4 2) Gaplek and maize are rarely consumed in an urban setting and yet are qu~te ~mportant in rural areas Fresh cassava consumption while higher ~n rural areas nevertheless is still at significant levels in urban areas even given the problems of market~ng such a perishable commodity Unnevehr (1982) estimates that in rural areas about two-thirds of fresh cassava and one-half of gaplek are subsistence consumption Counting urban consumption only 37% of fresh cassava that is utilized for human consumption is marketed
Probably the most ~mportant component influencing the distribution of cassava consumpt~on is income Gaplek consumption shows a consistently declin~ng trend w~th income (F~gure 4 2) Gaplek is a non-preferred food princ~pally consumed by the poor Fresh cassava consumpt~on at least ~n rural areas increases markedly with increasing ~ncome at low levels of income levels off at medium income levels and declines slightly at high income levels The overall tendency is for total cassava consumption (excluding starch) to decline with income
Approximately 40% of the populat~on in Indones~a consumes less than 1900 calories per day (Table 4 4) Th~s group is obviously constrained by income in the amount of food which they can purchase and thus must make more use of cheap calorie sources The poorer income groups principally in the rural areas subst~tute cassava and maize for the more expensive but more highly preferred rice (F~gure 4 2) Cheap cassava allows the lower ~ncome segments of the population to ach~eve a h~gher calor~e ~ntake w~th their limited food budget than they would have been able to ach~eve with Just rice Cassava ~s thus a potentially key commod~ty ~n pol~c~es
focusing on nutr~tion and the related issue of rice import management
The importance of cassava in the d~et and the relat~vely ubiquitous distr~but~on of fresh root consumpt~on ~mplies that qual~ty
characterist~cs cannot be sacrif~ced in a varietal development program
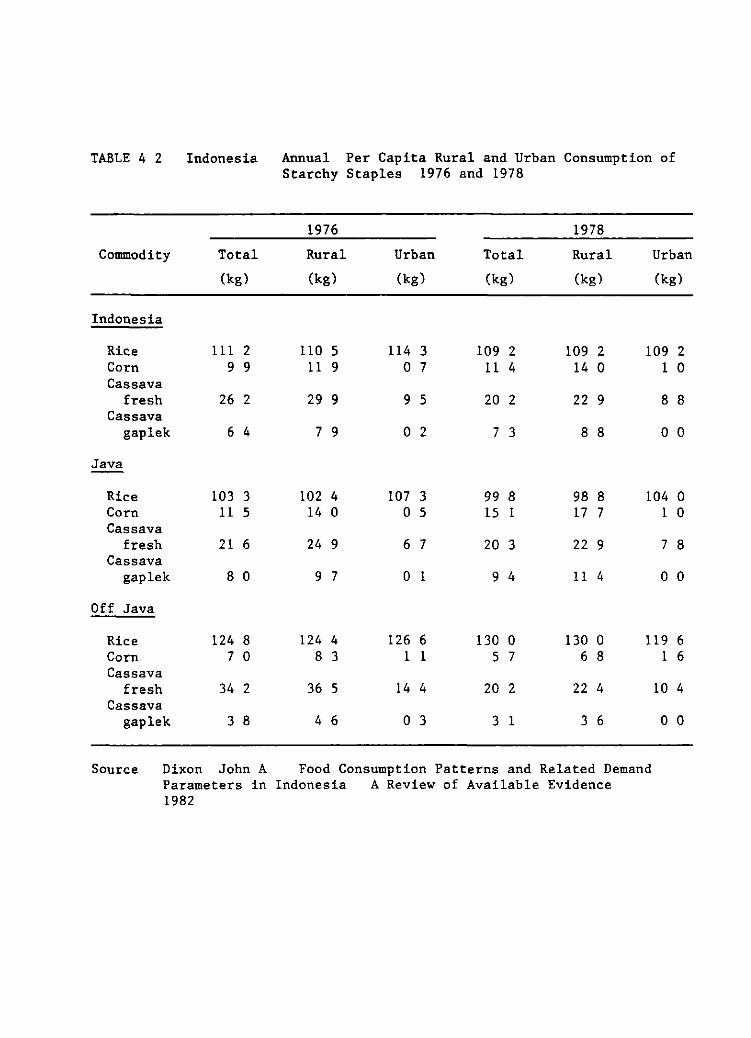
TABLE 4 2 Indonesia Annual Per Capita Rural and Urban Consumption of Starchy Staples 1976 and 1978
1976 1978
Commodity Total Rural Urban Total Rural Urban
(kg) (kg) (kg) (kg) (kg) (kg)
Indonesia
Rice 111 2 110 S 114 3 109 2 109 2 109 2 Corn 9 9 11 9 o 7 11 4 14 o 1 o Cassava
fresh 26 2 29 9 9 S 20 2 22 9 8 8 Cassava
gap le k 6 4 7 9 o 2 7 3 8 8 o o
Java
Rice 103 3 102 4 107 3 99 8 98 8 104 o Corn 11 S 14 o o S 15 1 17 7 1 o Cassava
fresh 21 6 24 9 6 7 20 3 22 9 7 8 Cassava
gap le k 8 o 9 7 o 1 9 4 11 4 o o
Off Java
Rice 124 8 124 4 126 6 130 o 130 o 119 6 Corn 7 o 8 3 1 1 S 7 6 8 1 6 Cassava
fresh 34 2 36 S 14 4 20 2 22 4 10 4 Cassava
gap le k 3 8 4 6 o 3 3 1 3 6 o o
Source Dixon John A Food Consumption Patterns and Related Demand Parameters in Indonesia A Review of Available Evidence 1982
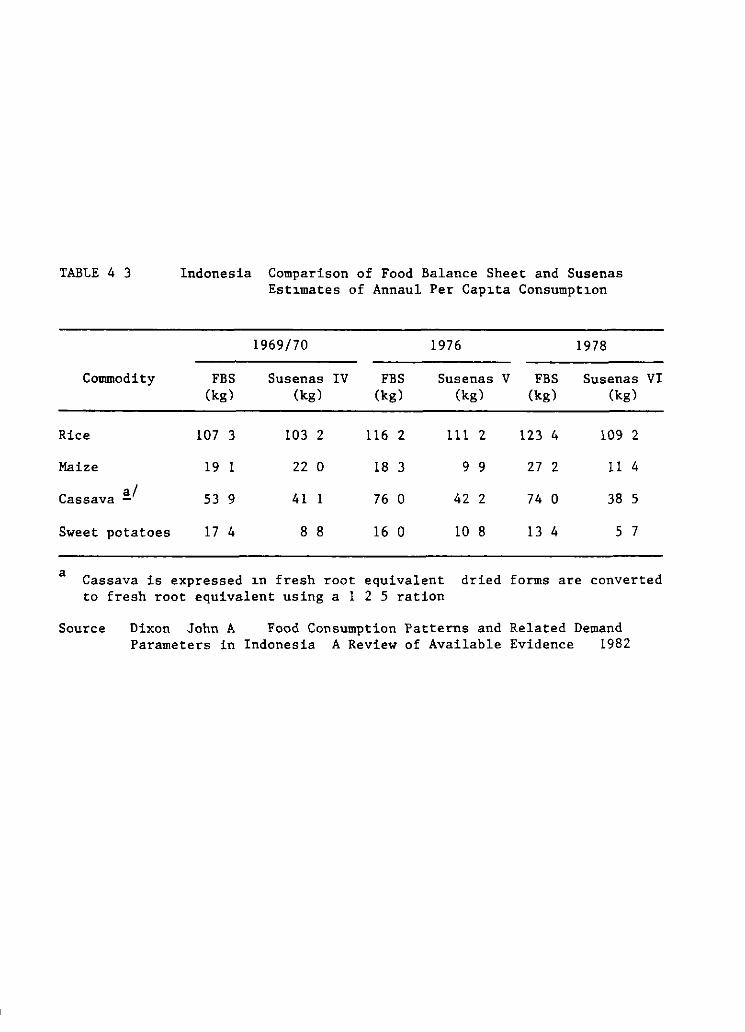
TABLE 4 3
Commodity
Rice
Maize
Cassava !!./
Sweet potatoes
Indonesia Comparison of Food Balance Sheet and Susenas Est1mates of Annaul Per Cap1ta Consumpt1on
FBS (kg)
107 3
19 1
53 9
17 4
1969/70
Susenas IV (kg)
103 2
22 o
41 1
8 8
FBS (kg)
116 2
18 3
76 o
16 o
1976
Susenas V (kg)
111 2
9 9
42 2
10 8
FBS (kg)
123 4
27 2
74 o
13 4
1978
Susenas VI (kg)
109 2
11 4
38 S
S 7
a Cassava is expressed 1n fresh root equivalent to fresh root equivalent using a 1 2 5 ration
dried forms are converted
Source Dixon John A Food Consumption Patterns and Related Demand Parameters in Indonesia A Review of Available Evidence 1982
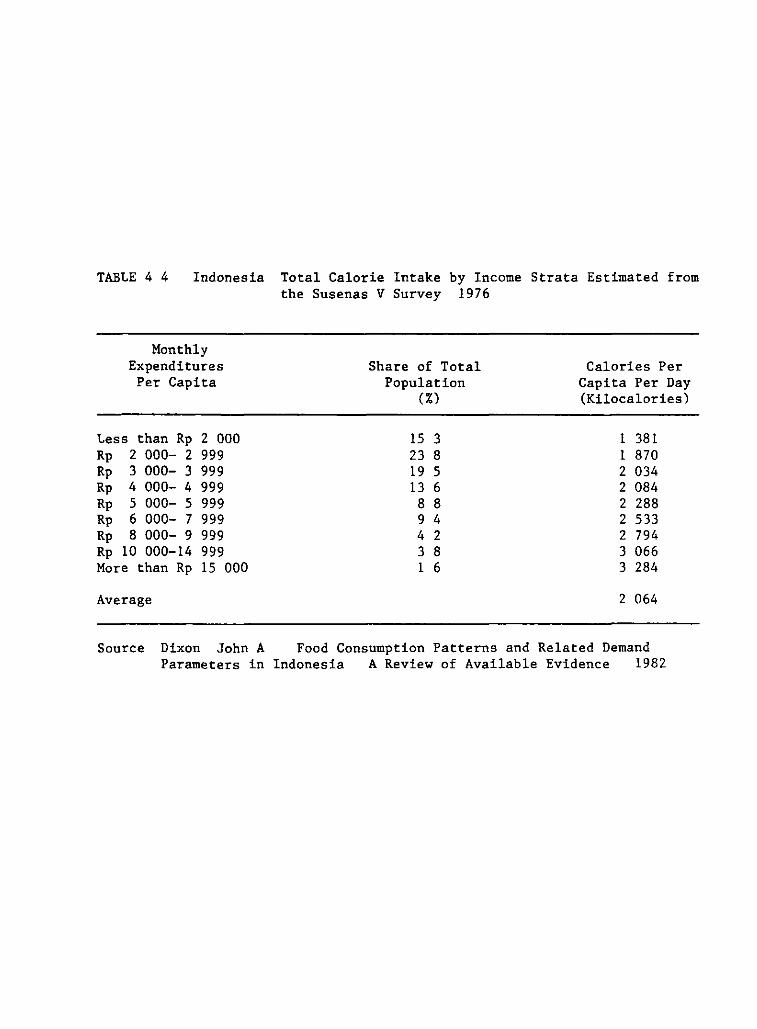
TABLE 4 4 Indonesia Total Calorie Intake by Income Strata Estimated from the Susenas V Survey 1976
Monthly Expenditures
Per Capita
Less than Rp 2 000 Rp 2 000- 2 999 Rp 3 000- 3 999 Rp 4 000- 4 999 Rp 5 000- 5 999 Rp 6 000- 7 999 Rp 8 000- 9 999 Rp 10 000-14 999 More than Rp 15 000
Share of Total Population
(%)
15 3 23 8 19 5 13 6
8 8 9 4 4 2 3 8 1 6
Calories Per Capita Per Day (Kilocalories)
1 381 1 870 2 034 2 084 2 288 2 533 2 794 3 066 3 284
Average 2 064
Source Dixon John A Food Consumption Patterns and Related Demand Parameters in Indonesia A Review of Available Evidence 1982
IV - 4 -
The role of cassava within an overall nutr1t1on policy follows from an analysis of demand parameters Estimates of 1ncome elasticities by Dixon (1982) show that among the poo-re-r income strata there is a significant increase in cassava consumption both as fresh and gaplek with increases in income (Table 4 5) Such changes in cassava consumption could come from real increases in income or from changes in the rice price since expenditure on rice makes up such a large part of the consumer budget Substantial substitution between caloric staples would be expected depending on Telative prices and in fact elasticity estimates suggest substantial responsiveness to p-rice changes Timmer (1980) reports a cross price elasticity of fresh cassava with rice ~7 O 77 showing a ve-ry marked effect of rice prices on cassava consumption -
Cassava s role in the Indonesian food economy wh1le not central is nevertheless critica! to the support of that proport1on of the populat1on facing a risk of not meeting thei-r caloric needs from rice suppl1es This population is essentially defined by low incomes and in years of poor rice ha-rvest their nutritional status can be put fu-rther at risk by rising rice prices The gove-rnment 1 s policy has been to try to mainta1n stable rice prices and this task is vested in the government grain marketing agency BULOG which attempts to stabilize rice prices through rice importa and to a more limited extent through wheat importa
BULOG was aided in this effort in the last decade and a half by the widesp-read adopt1on in the irrigated areas of the high-yielding r1ce var1eties Neve-rtheless rice imports have almost consistently exceeded one million tons up to 1980 and have occasionally reached two mill1on tons At these levels Indonesia can account for as much as a third of the world export market having a pronounced affect on world r1ce prices and therefore the fore1gn exchange costs necessa-ry to meet import requirements Since 1980 importa have been around half a mill1on tons although levels rose to 1 2 million tons 1n 1983 As the benefits of the new rice technologies start almost certa1nly to plateau Indonesia will again be faced with high 1mport requ1rements 1n a world r1ce market that 1s very thin To resolve th1s dilemma Indones1a has increas1ngly turned to wheat importa which are cheaper and where Indonesia forms a minar percentage of the world market
However Indonesia has on the whole failed to consider the potential role of the seconda-ry staples cassava and maize Total consumption of both of these commodities has essent1ally been static over the past decade and a half implying a declining contribut1on to total calor1c consumpt1on s1nce r1ce consumpt1on has risen dramat1cally S1nce there are real supply-side constra1nts on meeting future nutr1t1onal ob]ectives with rice since the locus of wheat consumption is pr1ncipally in urban areas and since cassava and maize are already important staples for the rural poor a strategy to increase production of these crops at lower pr1ces (that is techn1cal change) would contr1bute directly to increased calorie
]_/ D1xon (1982) on the other hand could find no sign1f1cant c-ross price elastic1t1es but based h1s estimat1on only on Java whereas T1mmer s was based on Indonesia as a whole
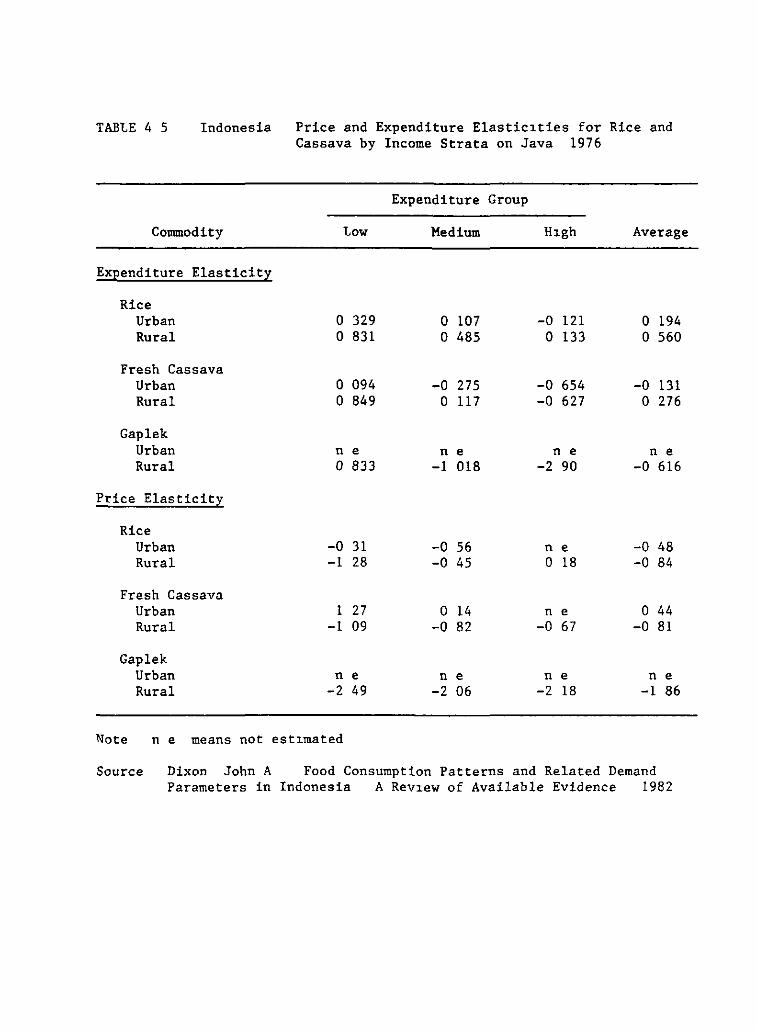
TABtE 4 5 Indonesia
Commodity
Expenditure Elasticity
Rice Urban Rural
Fresh Cassava Urban Rural
Gap le k Urban Rural
Price Elasticity
Rice Urban Rural
Fresh Cassava Urban Rural
Gaplek Urban Rural
Price and Expenditure Elastic1ties for Rice and Cassava by Income Strata on Java 1976
tow
o 329 o 831
o 094 o 849
n e o 833
-o 31 -1 28
1 27 -1 09
n e -2 49
Expenditure Group
Medium
o 107 o 485
-0 275 o 117
n e -1 018
-0 56 -0 45
o 14 -0 82
n e -2 06
-0 121 o 133
-0 654 -0 627
n e -2 90
n e o 18
n e -0 67
n e -2 18
Average
o 194 o 560
-0 131 o 276
n e -0 616
-o 48 -o 84
o 44 -0 81
n e -1 86
Note n e means not est~mated
So urce Dixon John A Food Consumption Patterns and Related Demand Parameters in Indonesia A Rev1ew of Available Evidence 1982
IV - S -
consumption of the most vulnerable pupulation By integrating cassava ~nto overall food policy BULOG would have considerable more flexibil~ty in managing r~ce imports and prices However because of the overall inelast~city in food demand for cassava th~s flexibility ~s dependent on some divers~fication in end markets That is diversifying end uses as the product~on base expands not only provides a certain market stability for farmers but as well ensures alternat~ve food supplies when rice is in short supply
The starch market
Starch is the largest s~ngle market (on a root equivalent bas~s) for cassava in Indonesia A cassava starch ~ndustry has existed on Java since the turn of the century Prior to World War II and independence this industry was based principally on plantations and was geared principally to export The recovery from the damage incurred during the war precipitated a shift from foreign to domestic ownership and from export to domest~c markets Indonesia is currently the largest producer of cassava starch ~n the world and essentially all the production is destined to domestic markets Unlike othe41 countr~es in Asia there ~s v~rtually no production of starch from maize -
The structure of the cassava starch industry is characterized by great diversity Starch factories are spread throughout Java and Sumatra but with a part~cular concentration in West Java Location of the starch ~ndustry is primar~ly dependent on access to a ready water supply to a sufficient concentration of root production to adequate transport ~nfrastructure and to non-seasonality of root supply These factors have until recently given the edge to West Java as the center of starch production However as transport infrastructure has improved on Sumatra part~cularly in Lampung starch product~on has expanded rapidly Th~s has been enhanced by the less seasonal supply of roots on Lampung From virtually no production ~n the early 1960 s the starch industry on Lampung has expanded rapidly especially in the 1970 s to become the second largest starch-producing province after West Java
Diversity is also a character~st~c of the scale of process~ng
Rudimentary household processing techniques co-exist with large-scale capital intensive factories with a s~gn~ficant range of plant sizes between these two extremes Nelson (1984) has recently analyzed the economics of starch production in Indonesia At 1980 prices all processing modes were found to be profitable (Table 4 6) The large m~lls were found to be most profitable but only because the tax incidence was much less than on household production and med~um-scale factor~es To mot~vate
investment the government has ~nstituted tax holidays for three to s1x years for large-scale firms Th1s together with a subs~dy on d~esel fue! and exemption from duty for imports of processing equipment g~ve a distinct advantage to insuring the prof~tabil~ty of the large scale plant However from a social point of v~ew Nelson finds that the household
!!_/ A single starch/corn o~l plant It pr~ncipally rel~es on maize in operat~on ~n 1984
Indocorn ~s operating in Indones~a ~mports for its operation and was not
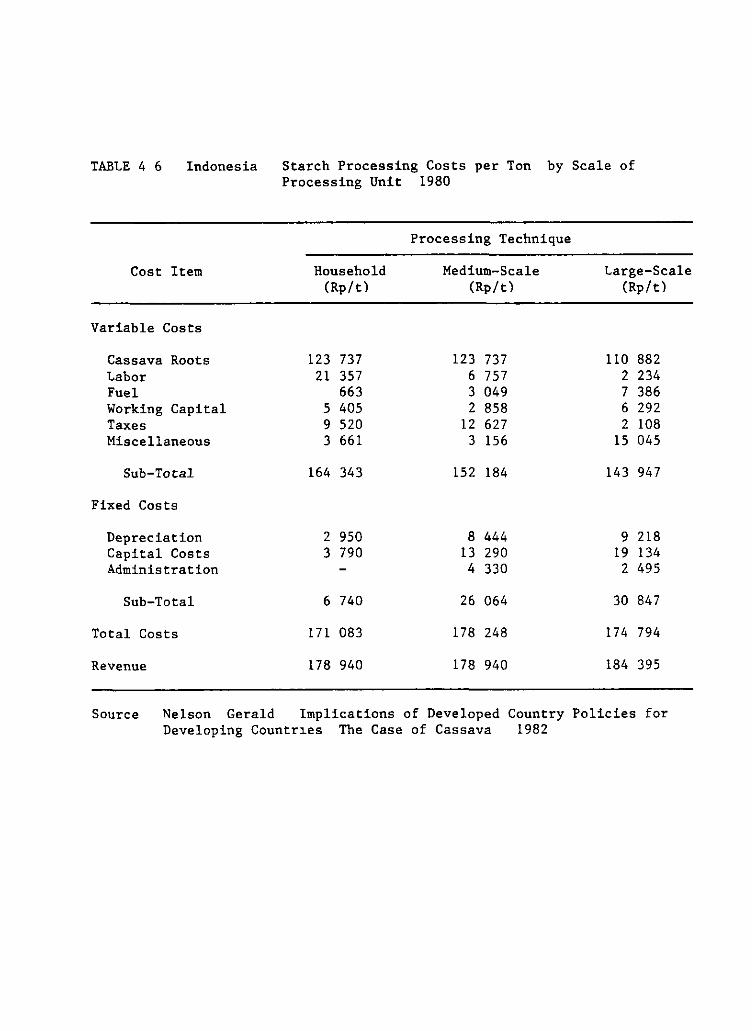
TABLE 4 6 Indonesia Starch Processing Costs per Ton by Scale of Processing Unit 1980
Cost Item
Variable Costs
Cassava Roots Labor Fuel Working Capital Taxes Miscellaneous
Sub-Total
Fixed Costs
Depreciation Capital Costs Administration
Sub-Total
Total Costs
Revenue
Source Nelson Gerald
Household (Rp/t)
123 737 21 357
663 5 405 9 520 3 661
164 343
2 950 3 790
6 740
171 083
178 940
Processing Technique
Medium-Scale (Rp/t)
123 737 6 757 3 049 2 858
12 627 3 156
152 184
8 444 13 290 4 330
26 064
178 248
178 940
Implications of Developed Country Developing Countr~es The Case of Cassava 1982
Large-Scale (Rp/t)
110 882 2 234 7 386 6 292 2 108
15 045
143 947
9 218 19 134
2 495
30 847
174 794
184 395
Policies for
IV - 6 -
production generates both the highest level of social profit as well as the most employment Nelson further reporta that household starch production has expanded rapidly in the 1970's motivated by increased capac~ty utilization with the introduction of mechanical graters
The few figures on starch suggest that production has ~ncreased rap~dly through the 1970's (Table 4 7) This growth was characterized by significant increases in household production on Java and very rapid growth of large-scale processing on Lampung The starch market was both large and growing providing quite strong demand for cassava roots Root product~on at least on Lampung responded accordingly
The factors that were driving this increased demand for cassava starch are less well documented Concensus seems to exist that the largest end use for starch is as krupuk a crispy wafer consumed as a snack food Nelson reporta that this industry takes as much as 657 of total starch production -- this implies an annual per capita consumption figure of 2 9 kg -- while the rest goes into other food processing ~ndustries (15k) the textile industry (10%) and glucose product~on (3%) The only complementary data comes from the SUSENAS consumer budget surveys The 1976 survey reporta an average annual per capita consumption level of starch of 1 4 kg on rural Java and O l kg in urban areas of Java (Dixon 1984) However Dixon considera th~s to be a significant underestimate because it does not include d~rect purchases of krupuk or other bakery products using starch He suggests that a more reasonable per cap~ta
estimate for Java's is 2 4 kg for rural areas and 1 O kg for urban areas i e an average of 2 1 kg These est~mates however appear to discount the data from the 1978 survey for krupuk consumption which suggests per capita consumption levels of krupuk alone of 2 5 kg in rural Java and 6 6 kg in urban Java Per capita starch consumption may be as high as 5 kg per cap ita (see Append= 4 1) which means that cassava starch ~s a more important food item than is often considered
Starch is the dominant end market for cassava in Indonesia moreover the l~m~ted evidence on demand suggests that this market w~ll continue to grow for a signif~cant period into the future Most of this growth comes from the use of starch as a food source with consumption in this case being skewed toward the higher income strata Dixon (1984) est~mates
~ncome elasticities for krupuk of 1 56 in rural areas and 1 35 in urban areas Significantly consumption patterns for cassava starch skewed as they are toward the rich are the mirror image of those for gaplek which are highly skewed toward the peor Product differentiation and market segmentation allows cassava 1n this case to serve two very d1stinct roles as a bas~c secondary staple for the peor and as someth~ng of a luxury food for h~gher ~ncome groups
A feature of the cassava starch industry 1n Indonesia compared to that of some other countries in Asia is that there 1s no effect1ve competit~on from maize starch even though maize ~s a maJar crop in Indones~a The situation is further confounded by the fact that ma1ze is at least 1ntermittently exported at world pr1ces wh~le gaplek while also exported competes at the h~gher pr~ce levels set in the European Community Maize should thus be more compet1t~ve as a raw material source
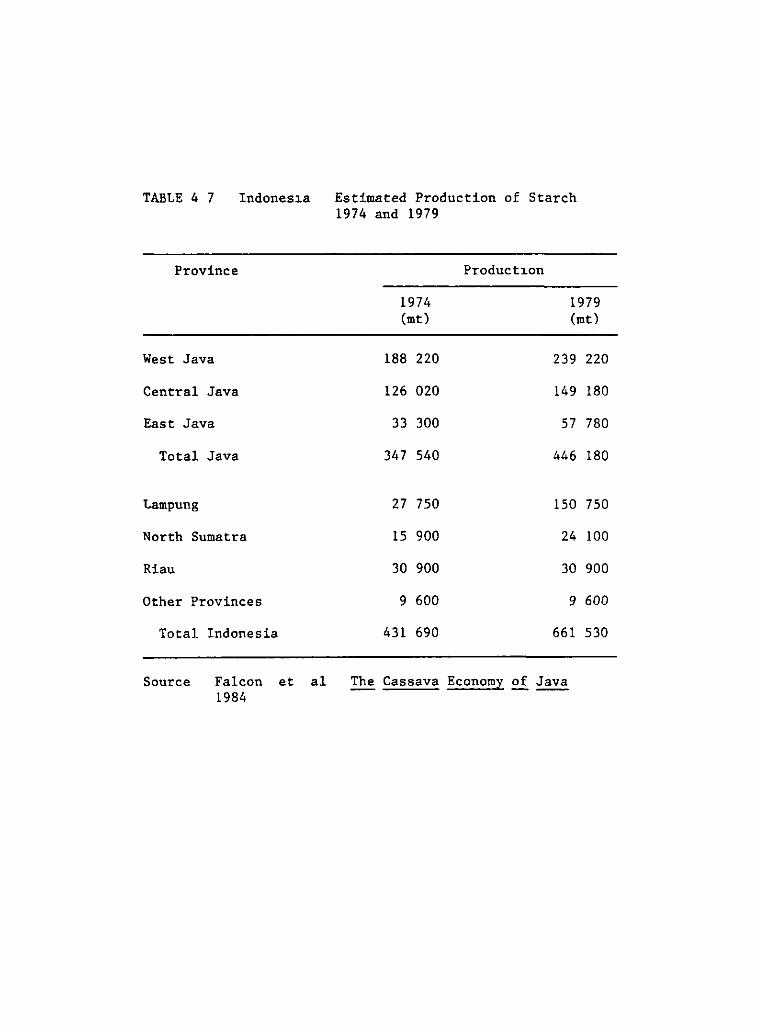
TABLE 4 7 Indones~a Estimated Production of Starch 1974 and 1979
Provine e Product~on
1974 1979 (mt) (mt)
West Java 188 220 239 220
Central Java 126 020 149 180
East Java 33 300 57 780
Total Java 347 540 446 180
Lampung 27 750 150 750
North Sumatra 15 900 24 100
Riau 30 900 30 900
Other Provinces 9 600 9 600
Total Indonesia 431 690 661 530
Source Falcon et al The Cassava Economy of Java 1984
IV - 7 -
for starch productJ.on than cassava However in the particular case of Indonesia starch substitution is limited by quality factors and in particular course sun-dried starch is necessary in preparJ.ng krupuk the dominant 111arket The fine flashdried starch cannot be used J.n krupuk unless mixed with the coarser starch Thus maize starch is constrained to competJ.ng in the much s~~~aller industrial market with cassava starch produced in the larger factories and given the scale econ0111ies J.n wet lllilling 111aize could not establish a large enough 111arket to JUStify a factory
Nevertheless the competition between ~~~aize and cassava becomes a factor in the recent interest in the production of hJ.gh fructose sweetners (HFS) Indonesia has over the past decade consJ.stently increased its imports of sugar to the point that imports now total between 500 to 700 thousand tons a year Not only are l.mports increasing but Indonesia maintains hJ.gh interna! sugar prices to support producers on the one hand and to limit consumptJ.on on the other hand A polJ.cy directed at self-sufficiency J.n sugar is limJ.ted by the availability of land suitable for sugar cane and the competition between rice and cane for this land Therefore producing high fructose sweetners from either 111aize or cassava in upland areas holds some attraction
However the substitution of lJ.quid high fructose sweetners for sugar occurs over only a limited range of end uses of sugar The largest market direct human consumption has limJ.ted possibilJ.ties for substJ.tution at this stage of market development Development of the HFS market depends on exploitJ.ng industrial uses especially food processJ.ng and bottled beverages Estimates on the size of this market are based on scanty data two sources put the potentJ.al consumption at between 220 and 500 thousand tons per year (Argento and Wardrip 1983 Tate and Lyle 1981) Nevertheless this market is expected to grow at a estimated rate of 5-' through the rest of the century (Pearson 1984)
IndonesJ.a has already committed itself to producing hJ.gh fructose sweetners A cassava-based factory J.S already in operat1.on in Malang on Java Licenses for the constructJ.on of 4 more factories have been J.ssued to bring total productJ.on capacity to 110 thousand tons of HFS Nevertheless two basic factors will largely determine the future of thJ.s industry First the economJ.c viability of h1.gh fructose sweetner production will necessarily rest on the maintenance of the high domestJ.c prJ.ce leve! for sugar Domestic wholesale prices for sugar in 1984 were Rp 575 per kg (US$0 57) compared to a world market price of US$0 26 per kg (Pearson 1984) Second lJ.censJ.ng procedures and subsJ.dies on capital investments will be critJ.cal J.n determJ.nJ.ng >.hether sweetner production is based on cassava or maJ.ze This is because maJ.ze plants are based on very large capJ.tal investments whereas thJ.s is not necessary for cassava
The economic advantage of one crop over the other J. S dJ.f f icul t to proJect WJ.th ~ny degree of certainty but the most complete cost analysis to date is that of Pearson (1984) Pearson concluded that maize would be a lower cost alternativa than cassava in HFS production due to three prl.nCJ.pal tenets First there are signJ.fJ.cant econom1.es of scale in the maJ.ze wet m1lling process while in cassava these are mJ.nJ.mal Second the
IV - 8 -
price dJ.stortions in the world market for cassava relative to maize are assumed to pers1st and Wl.ll in turn influence domestic profJ.tability Third the domestic marketing system and/or BULOG are able to assemble the supplies necessary to maintain a large-scale maize plant in operation BULOG s control over imports may provide the supply stab1lity necessary for continuJ.ty of operation
Nevertheless planning of the HFS industry has been based on cassava for severa! practica! reasons First HFS production based on cassava is profitable under present domestl.c sugar prices as set by BULOG Second expansion of cassava productJ.on does not depend on yield increases as is the case for maJ.ze but can be based on further area expansion in the off J.slands especially those with good infrastructure as in south Sumatra A supply response is much more assured in the cassava case Third capital requirements for HFS production are significantly less in the cassava case as a HFS production line can be added to existJ.ng cassava starch factorJ.es as was done in the Malang case Conversely the smaller scale maize well milling plant was not profitable at existing sugar prices (Pearson 1984) A focus on small-scale cassava plants allows a more evolutionary and less risky approach to market development since production can 1nit1ally be based on relatively small scale plants that have alternativa product lines and not on major capital investments in large-scale maize wet milling plants
The key factor in the choice between maize and cassava is the relative price of the raw material Pearson bases his analysJ.s on relative prl.ces l.n the world market that is a relative price of dried cassava to maize of 92 However as portrayed J.n Figure 4 3 only very rarely during the
1970 s and 1980 s has relative prices of the two crops been that high Cassava usually trades at a significantly larger discount to maize in Indonesia and is often at the break-even price ratio of 64 calculated by Pearson for cassava to compete with large scale maize wet-milling plants The reasons for thJ.s larger price discount are (1) maize prices are often not in line with world market prices (Dorosh 1986) and (2) world cassava prices have often been below the US$110/t figure used in the analysis Because of the EEC import quota the prospect is for f o b cassava pr1ces to be below this level in the medium term future (see Chapter VIII)
Basing HFS production on cassava allows significantly more flexibility l.n market development than does maize The profitability of cassava-based HFS does not depend on the economl.es of scale necessary for maize-based HFS to be profitable This allows greater flexibility in investments in capacJ.ty and in plant location For cassava-based HFS factorJ.es can be located l.n cassava production areas and based on starch slurries from the direct root processing or alternatively can be located next to major market areas and use processed starch as a raw material Relativa transport costs and control over raw material costs will determine the choice Maize wet ml.lling plants on the other hand will probably be located near to consumption points that is Jakarta and w1ll depend on steady supplies of maize from ma)or storage facilities or imports A single large-scale wet ml.lling plant operat1ng for 300 days per year requJ.res about 275 thousand tons of maize per annum This greatly exceeds eJ.ther annual export or import volumes over the past two decades and l.S far above total annual
IV - 9 -
maize sales by BULOG Moreover ma~ze-based HFS will be competing with the animal feed industry for raw material supplies most of which is currently supplied to the concentrate industry from BULOG stocks which are often imports (Table 4 8) Cassava s potential role ~n this industcy will thus be based on BULOG s sugar price policy and on the future ab~hty of the Indonesian maize economy to generate and assemble significant surpluses of this commodity (see Dorosh et al for such an assessment)
In summary the cassava starch market remains very dynamic and representa the largest end use for cassava in Indonesia (Table 4 1) With the high income elasticity for krupuk the potential in the h~gh fructose sweetner market and any increases in the textile paper or plywood industries the demand for starch will continue to ~ncrease There is some indication that demand is outstripping supply since in both 1982 and 1983 Indonesia had to import over 50 thousand tons of starch each year (Table 4 9) These are very signif~cant volumes which were primarily caused by below trend production levels in those two years but are nonetheless indicative of the relative size and importance of the starch market in Indonesia
Gaplek in Feed Markets
Gaplek forms an integral part of cassava production and market systems m Indonesia When properly dried gaplek is a stable commodity and provides the farmer the option of harvesting and storing bis cassava especially when there is a time premium on harvesting the cassava to plant the next crop Moreover gaplek since it can be stored and transported provides a means of integrating cassava markets Finally gaplek has mult~ple uses it can be used directly for human consumption can be ground into flour for noodle product~on or can be a raw material source for feed concentrate product~on or even for manufacture of low quality starch and its derivatives such as glucose or fructose sweetners
Gaplek ~s currently used principally for human food espec~ally by the lower income consumers ~n rural areas Indonesia is also a consistent although h~ghly variable exporter of gaplek to the European Community This export market serves the very important function of setting a price floor under domestic pr~ces for gaplek and in turn cassava in general (Unnevehr 1982) The export market is effective in setting this pr~ce
floor even though this market rarely accounts for more than IOk of cassava production Only twice since 1970 have gaplek exports exceeded 400 thousand tons (Table 9) and export levels more generally oscillate between ISO and 350 thousand tons
Interna! gaplek pr~ces have ~n general followed the general ris~ng
trend ~n world pr~ces (Figure 4 4) with exports being particularly respons1ve to the devaluation of the rupiah in 1978 A sim~lar devaluat~on in 1983 did not produce such a response due to a t~ght domest~c market Th~s apparent tighten~ng of domest1c markets is especially evident in Lampung where the gaplek export market was the engine of growth for the cassava ~ndustry in the first half of the 1970 s Gaplek exports from Lampung stagnated after 1975 and have decl~ned markedly s~nce 1981 The gaplek industry has had diff~culty compet1ng w1th the expanding starch
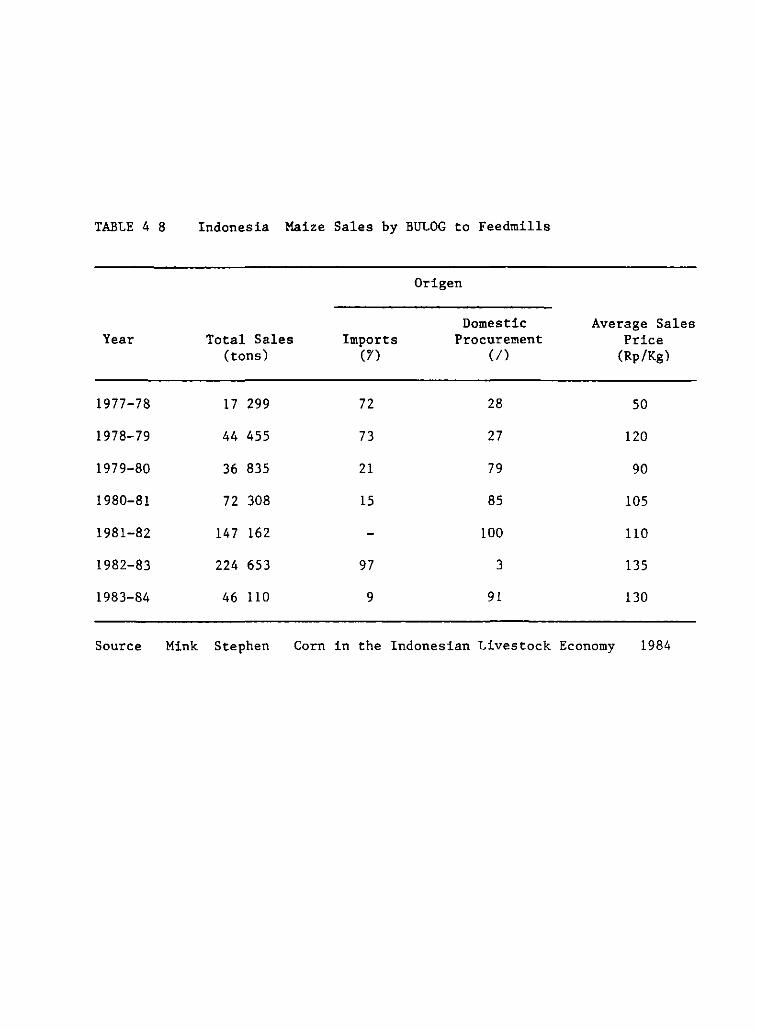
TABLE 4 8 Indonesia Maize Sales by BULOG to Feedmills
Origen
Domes tic Average Sales Year Total Sales Imports Procurement Price
(tons) (rl (!) (Rp/Kg)
1977-78 17 299 72 28 so
1978-79 44 455 73 27 120
1979-80 36 835 21 79 90
1980-81 72 308 15 85 105
1981-82 147 162 100 110
1982-83 224 653 97 3 135
1983-84 46 110 9 91 130
Source Mink Stephen Corn in the Indonesian Livestock Economy 1984
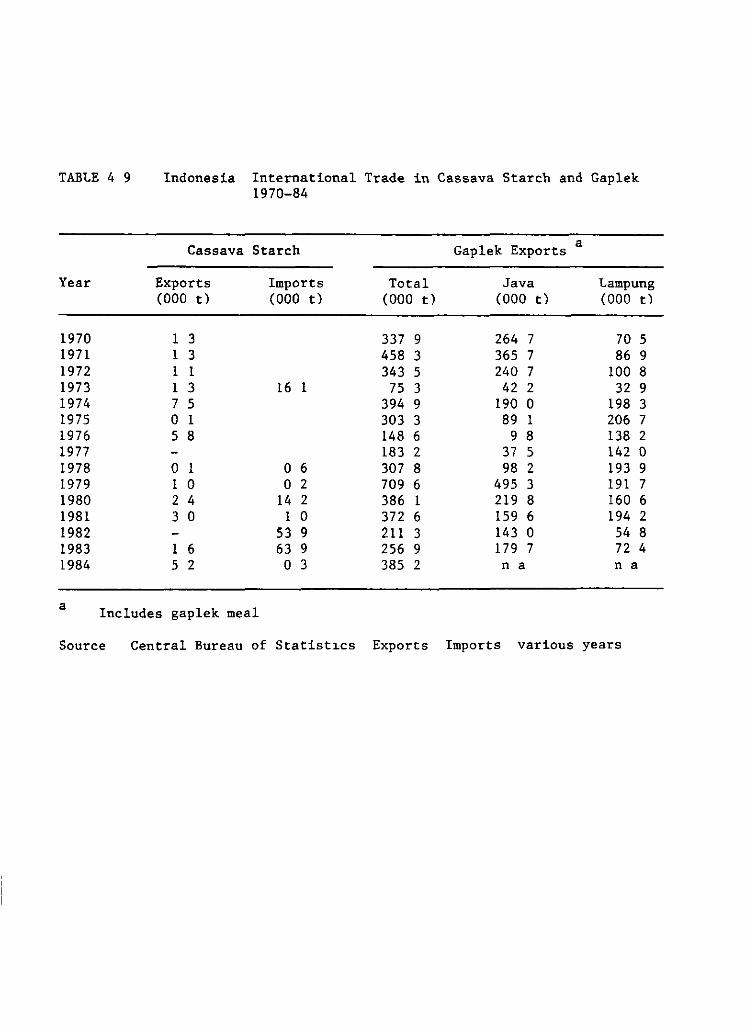
TABLE 4 9
Year
1970 1971 1972 1973 1974 1975 1976 1977 1978 1979 1980 1981 1982 1983 1984
Indonesia lnternational Trade in Cassava Starch and Gaplek 1970-84
Cassava Starch Gaplek Exports a
Exports lmports Total Java Lampung (000 t) (000 t) (000 t) (000 t) (000 tl
1 3 337 9 264 7 70 5 1 3 458 3 365 7 86 9 1 1 343 5 240 7 lOO 8 1 3 16 1 75 3 42 2 32 9 7 5 394 9 190 o 198 3 o 1 303 3 89 1 206 7 5 8 148 6 9 8 138 2
183 2 37 5 142 o o 1 o 6 307 8 98 2 193 9 1 o o 2 709 6 495 3 191 7 2 4 14 2 386 1 219 8 160 6 3 o 1 o 372 6 159 6 194 2
53 9 211 3 143 o 54 8 1 6 63 9 256 9 179 7 724 5 2 o 3 385 2 n a n a
a lncludes gaplek meal
Source Central Bureau of Statistl.cs Exports lmports various years
IV - 10 -
industry on Lumpung even when world prices were recently relatively high This declining trend was exacerbated by the peor crop years in 1982 and 1983
The tighten~ng of export suppl~es of gaplek have made the voluntary quotas formalizad with the EC in 1982 rather superfluous The quota was set at 500 thousand tons in 1982 rising to 825 thousand tons by 1986 when the agreement ended Compared to the Thai quota which declinad over the period the Indonesian agreement was very much largesse but in principal only There is very little potential for meeting the quota volumes even with the 1983 devaluation The advantages of the latter were negated by a bad crop year and the 1984 fall in the world price brought on by the effect of the quota on the Thai cassava industry
Netherless the current level of the gaplek export market undervalues its importance An export price floor set in the EC not only earns Indonesia a significant economic rent but also serves to maintain pr~ce
incent~ves should future production growth increase New cassava production technology or further transport infrastructure development on Sumatra could bring about such growth and the export market could serve to buffer farmer prices were production growth significant The short term problem with current strong domestic markets for cassava is to maintain sufficient pelleting and export capacity to ~nsure the world price linkage The med~um term problem is to insure that a sufficiently large quota ~n the EC market is mainta~ned to allow the cassava ~ndustry to expand without s1gnificant price instabil1ty Certainly should there be any renegot~at~on of the quota agreement the negotiations should balance the short-term constra~nts on exportable surpluses with the longer term ga~ns from maintenance of export flexibil~ty
The ma~ntenance of this world price export floor for gaplek however would be expected to inhibit the development of gaplek as a carbohydrate source in domestic mixed feed production If gaplek prices are set ~n the EC and maHe prices are linked to the world coarse gra~n market gaplek prices would be expected to be out of line with maize in domest~c feed rations (see for example World Bank 1984) Th~s argument however holds less often than not If a competitiva rat~o of relat~ve pr~ces of maHe and gaplek is taken as 70 then gaplek should have been very competit~ve with maize through much of the 1970 s and 1980 s (Figure 4 3) As explained above the principal reason why price relat~ves have favored cassava is that domestic maize prices are not well l~nked to the international market and are often above ~mpl~cit export pr~ces (Dorosh 1986) Least-cost feed formulation models demonstrate that gaplek was competitiva in poultry rations at 1984 pr1ces (Table 4 10) However what is suprizing is that gaplek does not d1splace more maize at th~s price rat~o of 52 This is due to the high internal price for soybean meal (Nelson 1986) S1nce 1982 BULOG has been the so le 1mporter of soybean meal and since Indonesia has no soybean crushing fac1l1ties most soybean meal 1s 1mported Moreover soybean meal prices have been kept high to mot~vate a shift to domestic protein sources such as copra meal However in 1983 when BULOG cut soybean meal 1mports in half to save fore1gn exchange feed m~lls imported rapeseed and sunflower seed meals which were not under BULOG control Two additional factors militate against gaplek
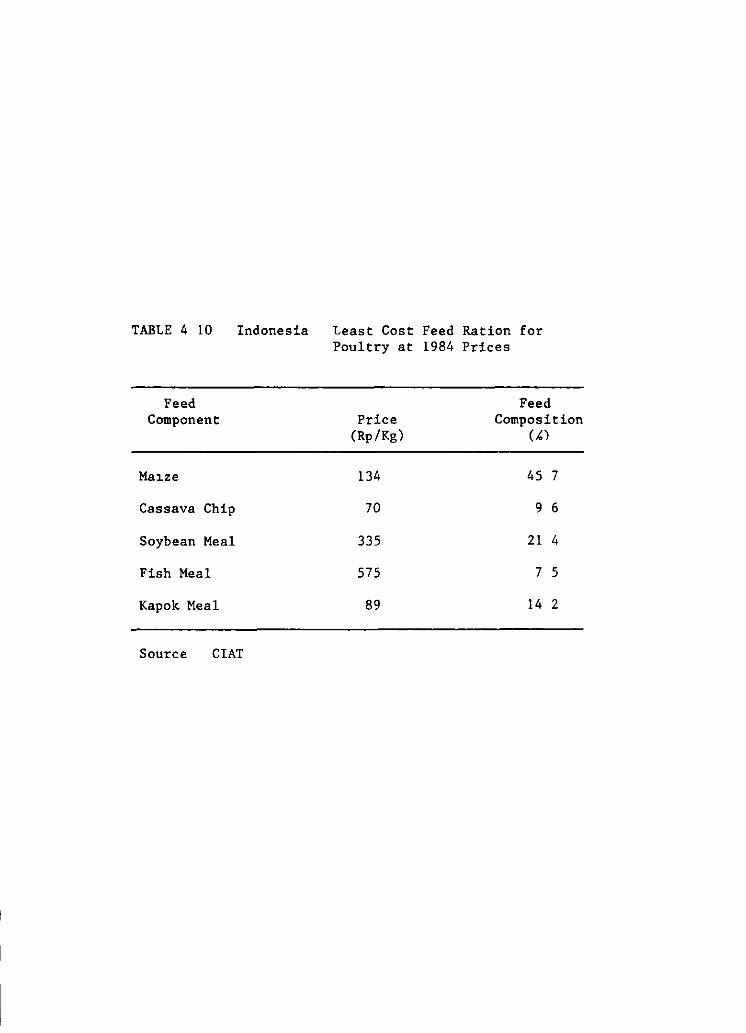
TABLE 4 10 Indonesia
Feed Component
Mal.ze
Cassava Chip
Soybean Me al
Fish Meal
Kapok Meal
Source CIAT
Least Cost Feed Ration for Poultry at 1984 Prices
Feed Price Composition
(Rp/Kg) (,0
134 45 7
70 9 6
335 21 4
575 7 5
89 14 2
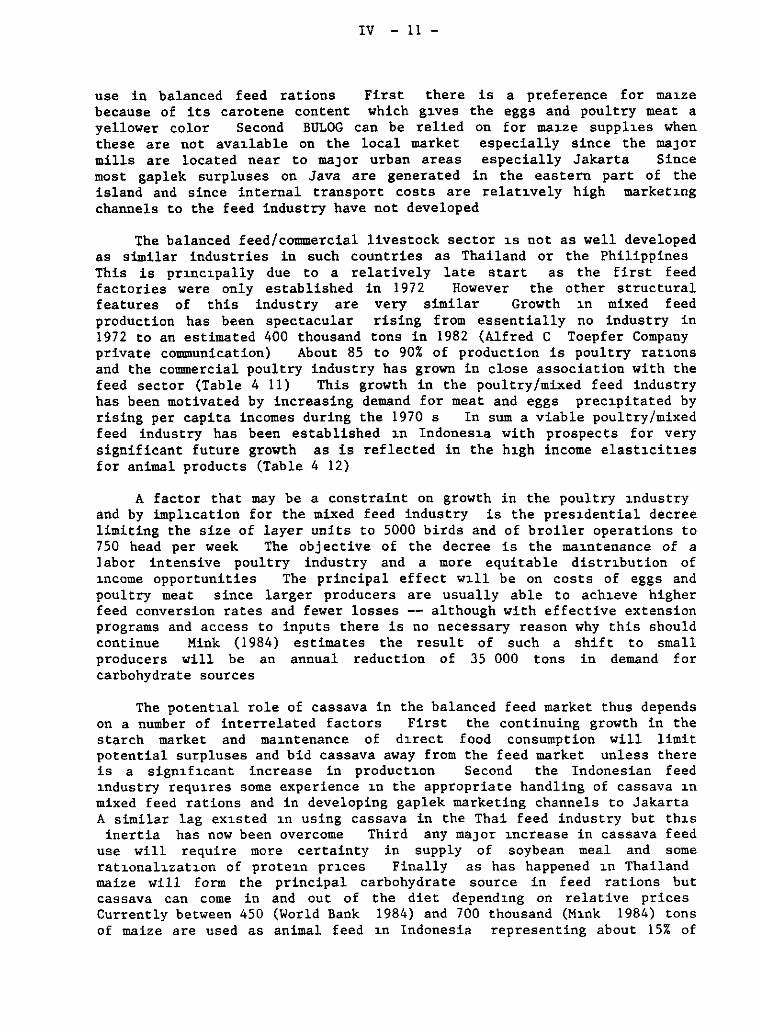
IV - 11 -
use in balanced feed rations First there is a preference for ma~ze
because of its carotene content which g~ves the eggs and poultry meat a yellower color Second BULOG can be relied on for ma~ze suppl~es when these are not ava~lable on the local market especially since the maJor mills are located near to maJor urban areas especially Jakarta Since most gaplek surpluses on Java are generated in the eastern part of the island and since interna! transport costs are relat~vely high market~ng
channels to the feed industry have not developed
The balanced feed/commercial livestock sector ~s not as well developed as similar industries in such countries as Thailand or the Philippines This is pr~nc~pally due to a relatively late start as the first feed factories were only established in 1972 However the other structural features of this industry are very similar Growth ~n mixed feed production has been spectacular rising from essentially no industry in 1972 to an estimated 400 thousand tons in 1982 (Alfred C Toepfer Company private communication) About 85 to 90% of production is poultry rat~ons and the commercial poultry industry has grown in clnse association with the feed sector (Table 4 11) This growth in the poultry/mixed feed industry has been motivated by increasing demand for meat and eggs prec~pitated by rising per capita incomes during the 1970 s In sum a viable poultry/mixed feed industry has been established ~n Indones~a with prospects for very significant future growth as is reflected in the h1gh income elast1cit~es for animal products (Table 4 12)
A factor that may be a constraint on growth in the poultry ~ndustry and by impl~cation for the mixed feed industry is the pres~dential decree limiting the size of layer units to 5000 birds and of broiler operations to 750 head per week The objective of the decree is the ma~ntenance of a labor intensive poultry industry and a more equitable distr~bution of ~ncome opportunities The principal effect w~ll be on costs of eggs and poultry meat since larger producers are usually able to ach~eve higher feed conversion rates and fewer losses -- although with effective extension programs and access to inputs there is no necessary reason why this should continue Mink (1984) estima tes the result of such a shift to small producers will be an annual reduction of 35 000 tons in demand for carbohydrate sources
The potent~al role of cassava in the balanced feed market thus depends on a number of interrelated factors First the continuing growth in the starch market and ma~ntenance of d~rect food consumption will limit potential surpluses and bid cassava away from the feed market unless there is a sign1f1cant increase in product1on Second the Indonesian feed 1ndustry requ1res some experience 1n the appropriate handling of cassava 1n mixed feed rations and in developing gaplek marketing channels to Jakarta A similar lag ex1sted 1n using cassava in the Thai feed industry but th1s inertia has now been overcome Third any maJar 1ncrease in cassava feed
use will require more certainty in supply of soybean meal and some rat1onal~zat1on of prote1n pr1ces Finally as has happened 1n Thailand maize will form the principal carbohydrate source in feed rations but cassava can come in and out of the diet depend1ng on relative prices Currently between 450 (World Bank 1984) and 700 thousand (M1nk 1984) tons of maize are used as animal feed 1n Indonesia representing about 15% of
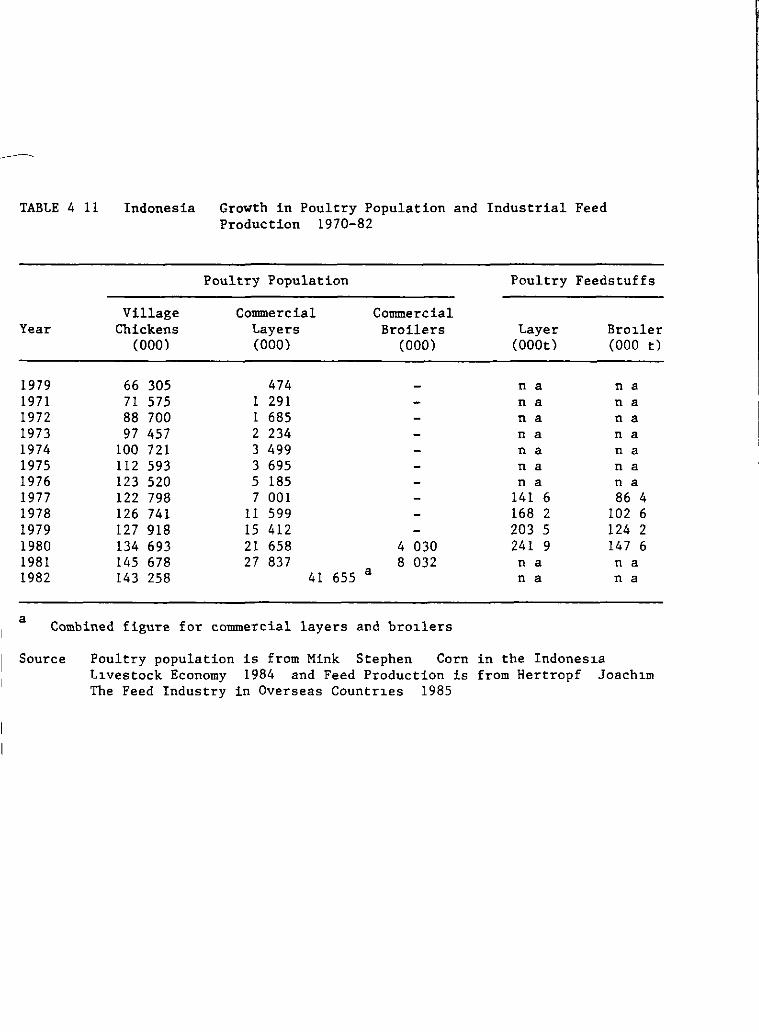
TABl..E 4 11 Indonesia Growth in Poultry Population and Industrial Feed Production 1970-82
Poultry Population Poultry Feedstuffs
Village Commercial Commercial Year Chickens l..ayers Broilers l..ayer Bro~ler
(000) (000) (000) (OOOtl (000 t)
1979 66 305 474 n a n a 1971 71 575 1 291 n a n a 1972 88 700 1 685 n a na 1973 97 457 2 234 na n a 1974 100 721 3 499 n a n a 1975 112 593 3 695 n a n a 1976 123 520 S 185 n a na 1977 122 798 7 001 141 6 86 4 1978 126 741 11 599 168 2 102 6 1979 127 918 15 412 203 5 124 2 1980 134 693 21 658 4 030 241 9 147 6 1981 145 678 27 837 8 032 n a n a 1982 143 258 41 655 a na n a
a Combined figure for commercial layers and bro~lers
Source Poultry population is from Mink Stephen Corn in the Indones~a L~vestock Economy 1984 and Feed Production is from Hertropf Joach~m The Feed Industry in Overseas Countr~es 1985
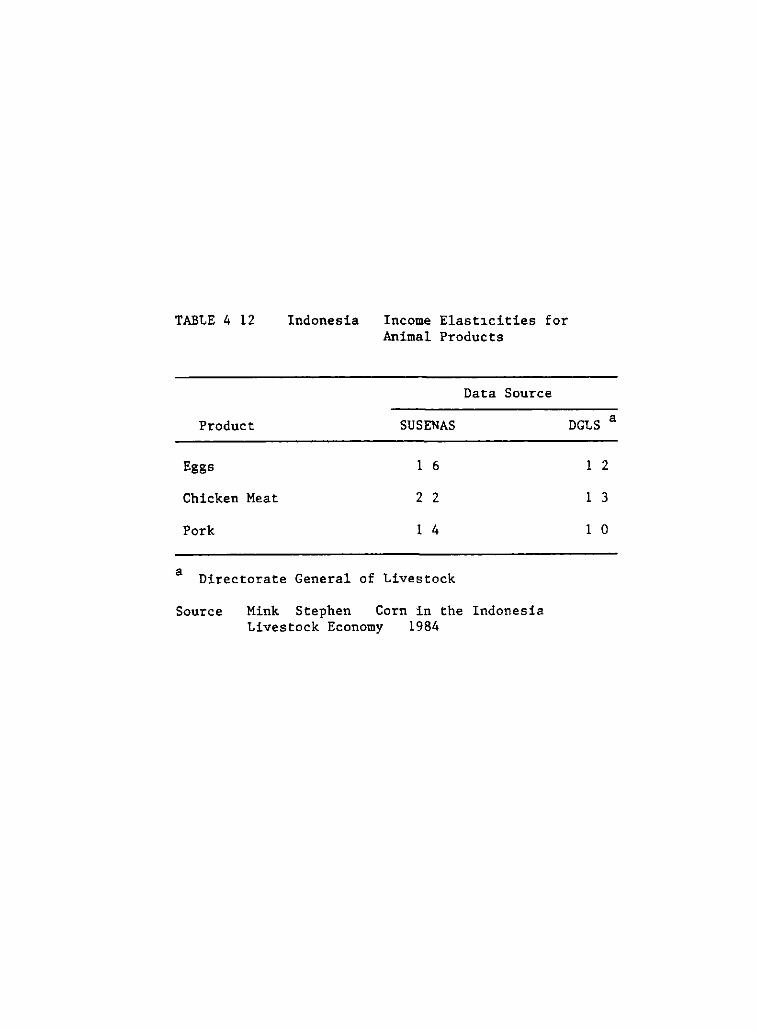
TABLE 4 12 Indonesia
Product
Eggs
Chicken Meat
Por k
a Directora te General
Source Mink Stephen
Income Elast1cities for Animal Products
Data Source
SU SENAS
1 6
2 2
1 4
of Livestock
Corn in the Indonesia Livestock Economy 1984
DGLS a
1 2
1 3
1 o
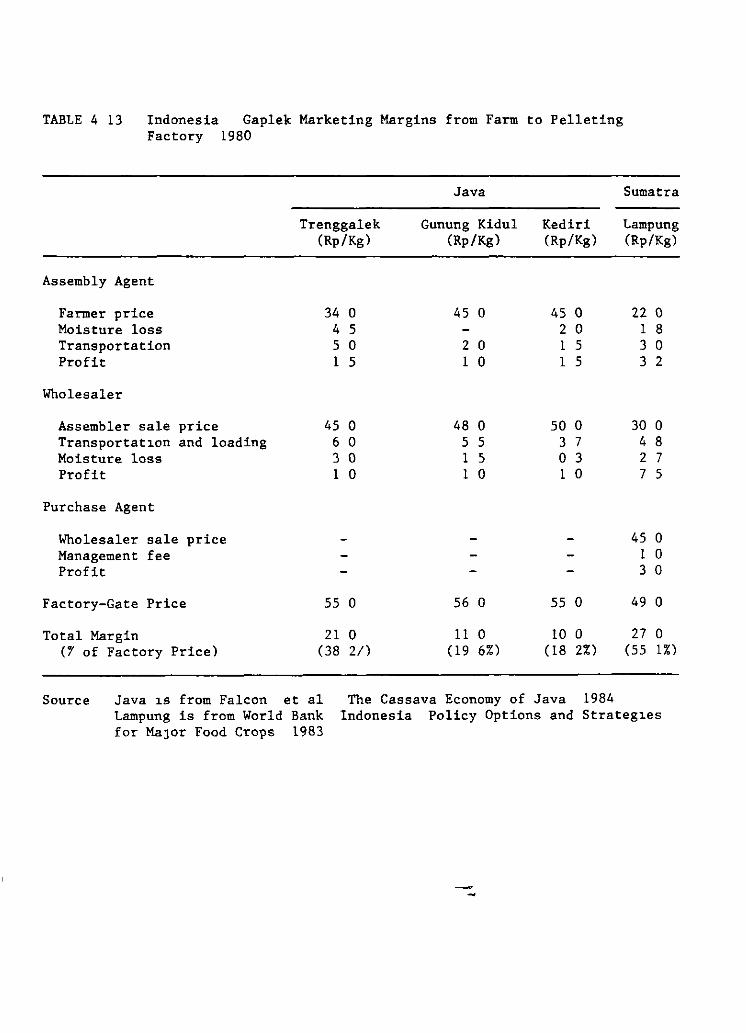
TABLE 4 13 Indonesia Gaplek Marketing Margins from Farm to Pelleting Factory 1980
Assembly Agent
Farmer price Moisture loss Transportation Profit
Wholesaler
Assembler sale price Transportat1on and loading Moisture loss Profit
Purchase Agent
Wholesaler sale price Management fee Profit
Factory-Gate Price
Total Margin (r of Factory Price)
Trenggalek (Rp/Kg)
34 o 4 S S O 1 S
45 o 6 o 3 o 1 o
SS o
21 o (38 2/)
Java
Gunung Kidul (Rp/Kg)
45 o
2 o 1 o
48 o S S 1 S 1 o
56 o
11 o (19 6%)
Kediri (Rp/Kg)
45 o 2 o 1 S 1 S
50 o 3 7 o 3 1 o
SS O
10 o (18 2%)
Sumatra
Lampung (Rp/Kg)
22 o 1 8 3 o 3 2
30 o 4 8 2 7 7 S
45 o 1 o 3 o
49 o
27 o (SS 1%)
Source Java 1s from Falcon et al Lampung is from World Bank for MaJar Food Crops 1983
The Cassava Economy of Java 1984 Indonesia Policy Options and Strateg1es
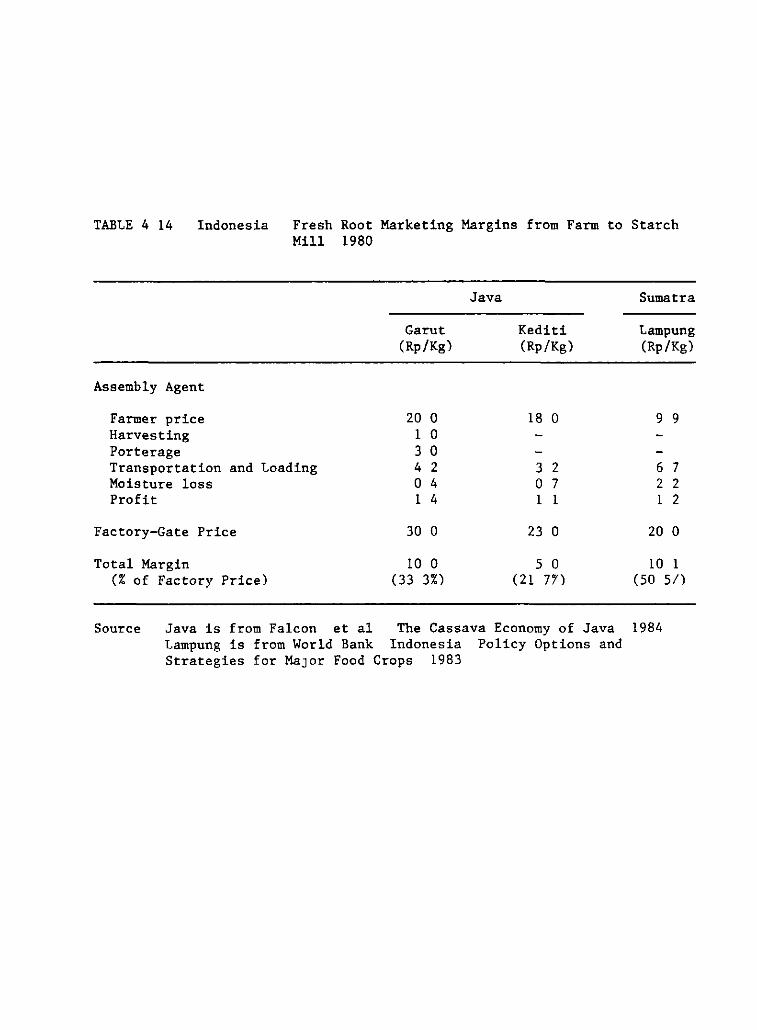
TABLE 4 14 Indonesia Fresh Root Marketing Margins from Farm to Starch Mill 1980
Assembly Agent
Farmer price Harvesting Porterage Transportation and Loading Moisture loss Profit
Factory-Gate Price
Total Margin (% of Factory Price)
Garut (Rp/Kg)
20 o 1 o 3 o 4 2 o 4 1 4
30 o
10 o (33 3%)
Java
Kediti (Rp/Kg)
18 o
3 2 o 7 1 1
23 o
S O (21 7"/)
Source Java is from Falcon et al The Cassava Economy of Java Lampung is from World Bank Indonesia Policy Options and Strategies for MaJor Food Crops 1983
Sumatra
Lampung (Rp/Kg)
9 9
6 7 2 2 1 2
20 o
10 1 (SO SI)
1984
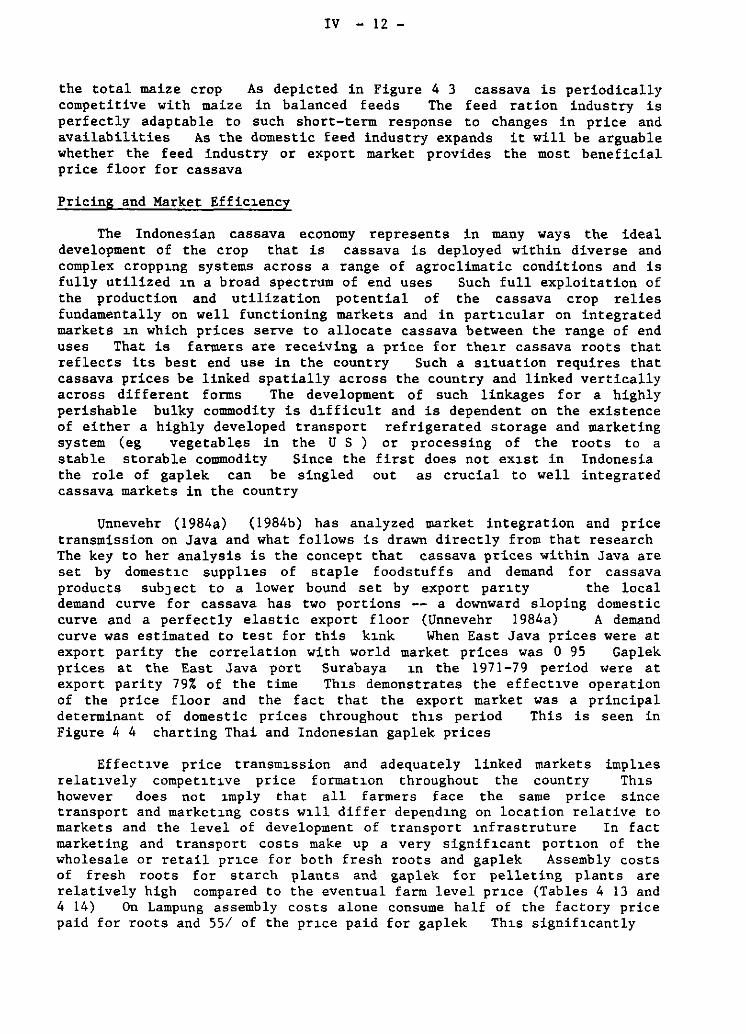
IV - 12 -
the total maize crop As depicted in Figure 4 3 cassava is periodically competitive with maize in balanced feeds The feed ration industry is perfectly adaptable to such short-term response to changes in price and availabilities As the domestic feed industry expands it will be arguable whether the feed industry or export market provides the most beneficia! price floor for cassava
Pricing and Market Effic~ency
The Indonesian cassava economy representa in many ways the ideal development of the crop that is cassava is deployed within diverse and complex cropp~ng systems across a range of agroclimatic conditions and is fully utilized ~n a broad spectrum of end uses Such full exploitation of the production and utilization potencial of the cassava crop relies fundamentally on well functioning markets and in part~cular on integrated markets ~n which prices serve to allocate cassava between the range of end uses That is farmers are receiving a price for the~r cassava roots that reflects its best end use in the country Such a s~tuation requires that cassava prices be linked spatially across the country and linked vertically across different forms The development of such linkages for a highly perishable bulky commodity is d~fficult and is dependent on the existence of either a highly developed transport refrigerated storage and marketing system (eg vegetables in the U S ) or processing of the roots to a stable storable commodity Since the first does not ex~st in Indonesia the role of gaplek can be singled out as crucial to well integrated cassava markets in the country
Unnevehr (1984a) ( 1984b) has analyzed ¡parket integration and price transmission on Java and what follows is drawn directly from that research The key to her analysis is the concept that cassava prices within Java are set by domest~c suppl~es of staple foodstuffs and demand for cassava produces subJ ect to a lower bound set by export par~ty the local demand curve for cassava has two portions -- a downward sloping domestic curve and a perfectly elastic export floor (Unnevehr 1984a) A demand curve was estimated to test for this k~nk When East Java prices were at export parity the correlation with world market prices was O 95 Gaplek prices at the East Java port Surabaya ~n the 1971-79 period were at export parity 79% of the time Th~s demonstrates the effect~ve operation of the price floor and the fact that the export market was a principal determinant of domestic prices throughout th~s period This is seen in Figure 4 4 charting Thai and Indonesian gaplek prices
Effect~ve price transm~ssion and adequately linked markets impl~es
relat~vely compet~t~ve price format~on throughout the country Th~s
however does not 1mply that all farmers face the same price since transport and market1ng costs w1ll differ depend~ng on location relative to markets and the leve! of development of transport 1nfrastruture In fact marketing and transport costs make up a very signif1cant port1on of the wholesale or retail pr1ce for both fresh roots and gaplek Assembly costs of fresh roots for starch plants and gaple\<. for pelleting plants are relatively high compared to the eventual farm level pr1ce (Tables 4 13 and 4 14) On Lampung assembly costs alone consume half of the factory price paid for roots and 55/ of the pr1ce paid for gaplek Th1s signif1cantly
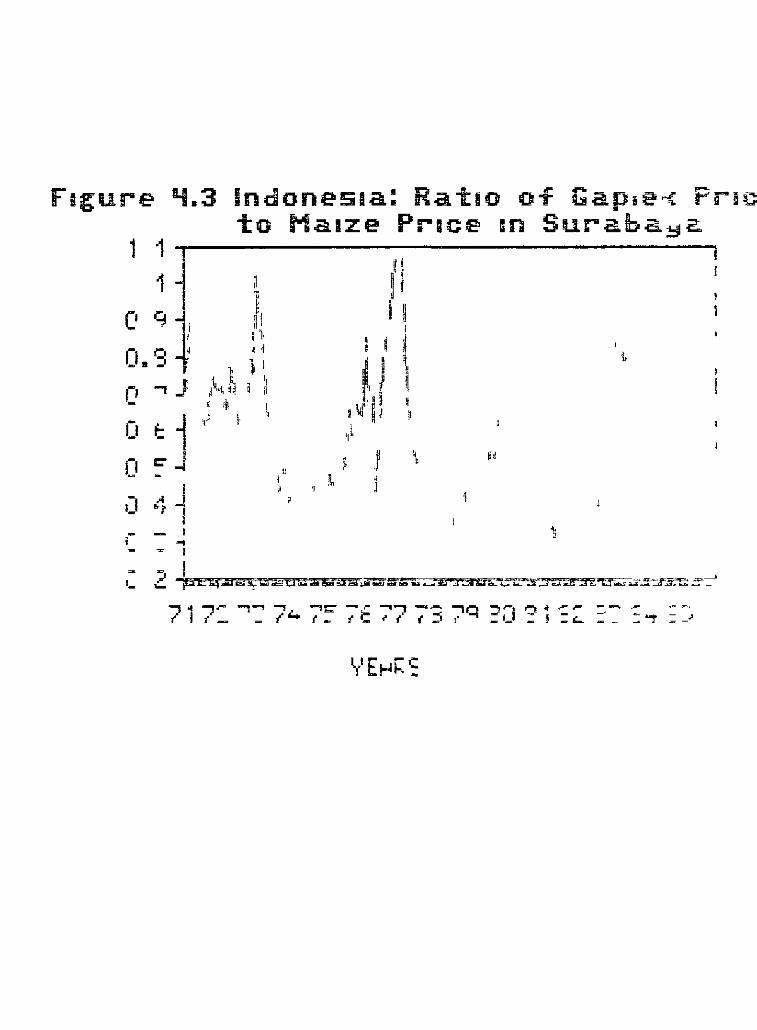
Fagure ILI.3 lndonesaa: Ra tao of Gap. e"{ Frac to Ma.1ze Pr-ace sn StH"'a.ba:!::l1a
1 1 ' 1 "
1 i ~ ij "
/1 " j
1 1 i o q~ 1
n o ~ ~ ' ' i J 4 4 B n 1
) 1
f 1 l t
- • ..! ' -,J i··\ f~
,, (' ij
' IÚ ~~~n ij
ti ,J f ~ o ~l
c:-_J p • ,, o J •
11 - 1 ~ A l ' ¡) '"r ..J !
~- - 1 ~ .... - 1
7 o4! ..,.- ...,..., ..., -tr= - /"' -..., --- .,Q ~-¡ ,-.. "' -.- ::.. - -- - ....... 1 ( - - (.:... f- ( 0: ' f ( :; ( :;:._ : l : .:.._ - - ::.,. ;;; _;
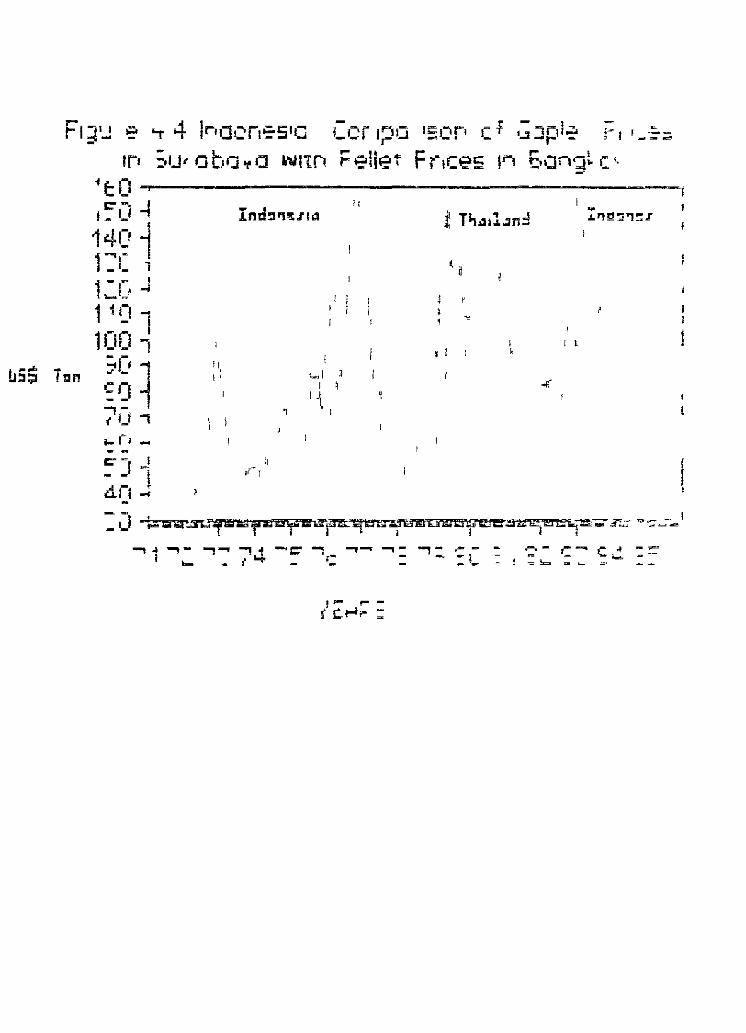
Ft ;i'J .::.
T11n
IP
itO e-¡-¡ ~ ¡_ -
1~::' i 1- ,_ 1
1 :e~ _J 11rt ...
10Ó ~ 3oü 1 cq-' -- 1 .,¡-¡ ., ( -i- (; -
"T 4 I••Cl•::r,o:-s•c l_Cí t;:'G •ser• e -F
;u, .:J bo 't' a wnn ¡::: eller F r.ces 1"
.::; Jpl~ ¡- 1 1---,... 1
!.:nJ ¡-¡-;¡. e '
11 11
Ind'l'l'UI.:I
1 1
,_¡ ' 1 ~
11 , ' 1
,,
' 1 l ' 1 1
-:_!_- - .-..- r:- C.,! : ..... -~=b. .. ._=
IV - 13 -
reduces price incentives for farmers since the complete marketing margin (farmer te reta1l) for money alternative grain crops en Lampung is only around 20 te 30% (Word Bank 1983)
The effective operation throughout Indonesia of the export price floor under domestic cassava prices however depends crit1cally en spatial integrat1on of the various cassava markets Such integration relies en two components first integration between fresh root and gaplek prices and second between gaplek prices 1n different markets throughout the country In terms of the linkage between fresh root and gaplek prices variation in fresh root pr1ces explained over 90 percent of the variation in gaplek prices in 7 of 19 markets en Java and over 80 percent of the variation in 18 of the 19 markets (Unnevehr 1982)
Not only were gaplek and fresh roce prices strongly l1nked but there was also a strong l1nkage of gaplek prices between markets across Java and this linkage was principally due te the operation of the export price floor Thus when domestic prices were at export parity the correlation coefficient of gaplek prices in the 19 different markets was greater than or equal te O 90 for 106 of 171 potencial pa1rs On the other hand when domestic prices were above export parity only prices in 27 pairs of markets were correlated at the level of O 90 (Table 4 1S) When domestic prices were at export parity domestic price variation of gaplek was due almost completely te variation in the export price (Unnevehr 1982) Since there was a generalized price linkage both between markets and between roots and gaplek the operation of an effective pr1ce floor was demonstrated for Java as a whole
When domest1c prices rose above export parity price variation was much more influenced by regional supply and demand conditions for cassava Moreover interna! transportat1on costs tended te lower the export floor for more remete markets 1ncreasing the influence of local supply and demand conditions Thus the number of months the pr1ces at 19 internal markets were at export parity varied from 32 te 70~ of the time all less than the 78% at Surabaya
Nevertheless what is remarkable is how often domest1c prices have been at the price floor In the period 1971 te 1979 monthly prices 1n maJar markets were at export parity between a third te four-f1fths of the time Production in this period grew at an annual rate of approximately 2 8~ at a t1me when populat1on growth was 2 0% and income growth was S 3/ Normal growth in food demand for cassava (assuming a combined 1ncome elast1c1ty of O 1) and the rapid growth in starch production should have put sorne upward pressure en cassava prices Moreover never more than 1S/ of domest1c product1on was exported and the f1gure was usually less than 10/ Surpluses at export prices thus were never that large Part of the reason was that there was a general upward trend in export prices
However the other majar factor affect1ng cassava prices is the domest1c price of rice and over th1s per1od the real price of r1ce fell substant1ally (Figure 4 S) due te the 1mpact of improved rice technology and import pol1cy Timmer (1980) finds a cross-pr1ce elast1city between cassava and rice of O 77 indicating s1gnificant decreases 1n cassava
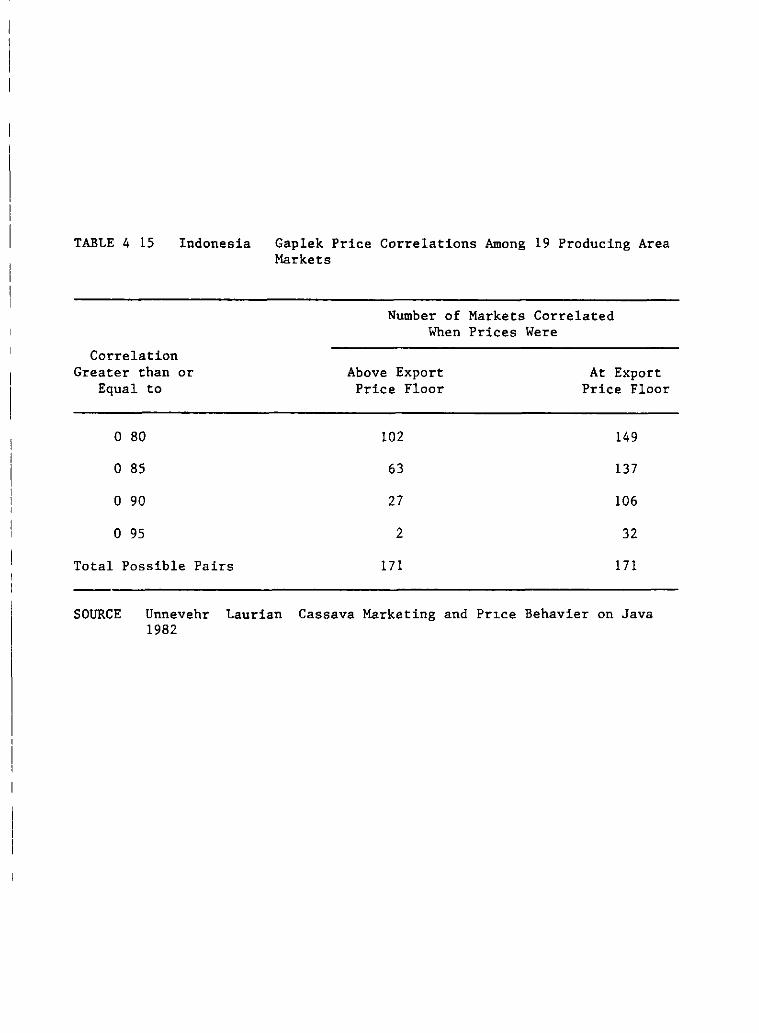
TABLE 4 15 Indonesia
Correlation Greater than or
Equal to
o 80
o 85
o 90
o 95
Total Possible Pairs
Gaplek Price Correlations Among 19 Producing Area Markets
Number of Markets Correlated When Prices Were
Above Export At Export Price Floor Price Floor
102 149
63 137
27 106
2 32
171 171
SOURCE Unnevehr Laurian Cassava Marketing and Pr~ce Behavier on Java 1982
IV - 14 -
consumption for a decline in rice prices During the period of rapid expansion in rice supplies the cassava export market served a critical function of providing an effective price floor and thus maintaining incomes of cassava farmers As Indonesia exploits most of the yield gain possible from the rice technology domestic rice prices and rice imports are again likely to become important policy issues Cassava because of this price linkage to r1ce allows additional flexibility in meeting r1ce pr1ce policy objectives In the future improving cassava production may be a far less expensive means of maintaining rice prices than r1ce imports
Any cost reductions in transport or scale economies in assembly will tend to favor cassava over other crops On the other hand to assembly costs must be added processing costs Both the gaplek and starch processing industry has been found to be socially efficient (Nelson 1982) Less than a quarter of the export parity price for both starch and pellets 1s consumed by processing costs (Table 4 16) The cassava processing industry is relatively dynamic and as well perm1ts a significant degree of diversity Labor intensive household starch production co-exists with capital intensive large scale factories All are profitable although government tax and capital credit policies tend to favor the large-scale plants when the household units are socially more eff1c1ent and employ significantly more labor (Nelson 1982)
Cassava marketing systems in Indones1a have evolved in response to transport infrastructure development and changes in market demand There has been almost no 1ntervention by government agencies apart from the tax credits for large scale processing plants and the import tax on starch As the evidence suggests cassava markets function very efficiently in Indonesia g1ven the constraints imposed by infrastructure There is not only little need for gove~ment involvement in cassava markets but unl1ke rice any such intervent1on 1n a commodity w1th mult1ple markets would be counter-productive without a comprehensive policy and this would be difficult to atta1n Unlike many other countries 1n Asia Indones1an cassava markets reflect nat1onal supply and demand conditions with a buffer provided by the export market Further development of cassava 1n Indonesia will be relat1vely easy given such a well funct1oning marketing system
PRODUCTION
Demand for cassava rema1ns very dynamic in Indonesia especially as markets have cont1nued to divers1fy and cassava demand is not dependent on just food demand for fresh roots and gaplek Potential markets in the area of h1gh fructose sweetners and balanced feeds rema1n untapped due to lock of sufficient production and Indones1a has not come close to meeting the 1mport quota set in the EEC With such a strong demand s1tuat1on the questions naturally turn to production and the means of 1ncreas1ng an already sign1ficant growth rate
Production trends and distribut1on
Cassava was introduced into Indones1a through early Portuguese trade w1th the Sp1ce Islands but did not become well established as a maJor crop until the m1d to late 1800 s The spread of cassava was promoted by the
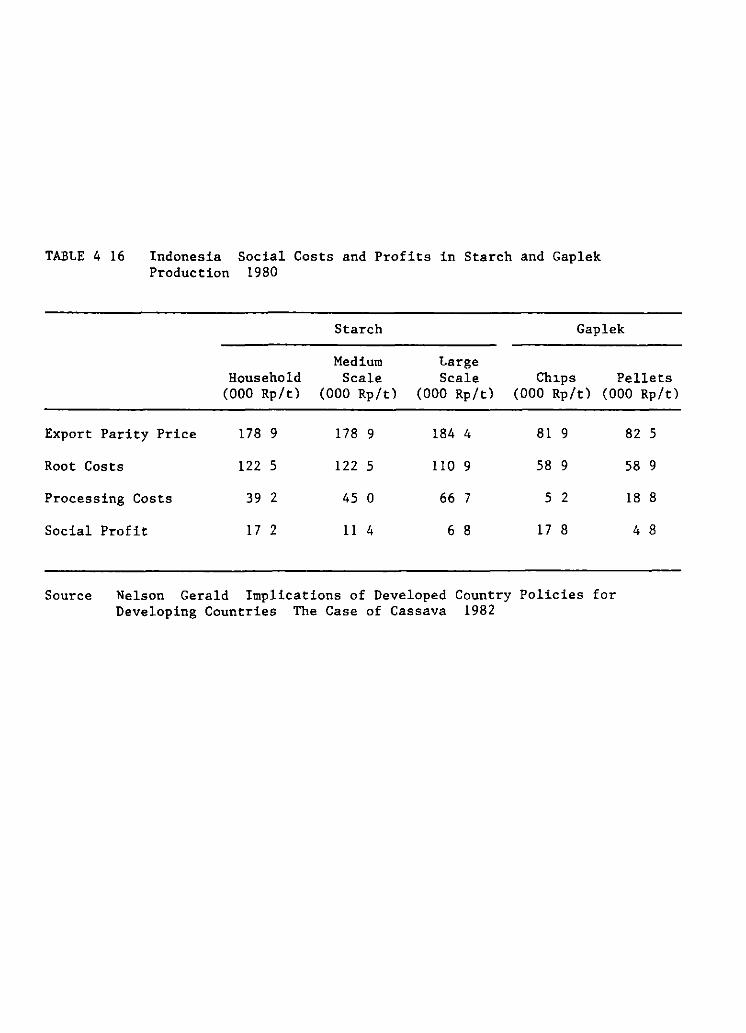
TABtE 4 16 Indonesia Social Costs and Profits in Starch and Gaplek Production 1980
Starch Gaplek
Medium targe Household S cale S cale Ch1ps Pellets
(000 Rp/t) (000 Rp/t) (000 Rp/t) (000 Rp/t) (000 Rp/t)
Export Parity Price 178 9 178 9 184 4 81 9
Root Costs 122 S 122 S 110 9 58 9
Processing Costs 39 2 45 o 66 7 S 2
Social Profit 17 2 11 4 6 8 17 8
Source Nelson Gerald Implications of Developed Country Policies for Developing Countries The Case of Cassava 1982
82 S
58 9
18 8
4 8
IV - 15 -
Dutch as a famine reserve Also by the turn of the century the Dutch had developed a large cassava starch industry on Java directed towards export which also provided incentives for expansion of cassava production By the mid-1960 s area sown to cassava on Java reached a peak of 1 4 million hectares and has since declined (Table 4 17) S~nce 1975 cassava area on Java has been relatively atable at an even ene million hectares Cassava area on the off-islands remained static through the 1960 s and early 1970 s Only in the later part of the 1970 s has area in the off-islands shown a significant increase due to the transmigrat~on proJects and the expansion of the gaplek trade and starch on Lampung
The distribution of cassava production in Indonesia to a large extent corresponda w~th the distribution of population About 70% of the cassava is produced on Java Java is followed by Sumatra which accounts for a little over 10% The rest of the production is distributed throughout the other islands (Table 4 18) Cassava is thus grown throughout Indones~a almost wholly in upland areas and has established itself as a major palawi]a (secondary upland food) crop in Indonesia Over the decade of the sevent~es cassava production grew at annual rate of 2 7% per annum in Indones~a However this production growth was marked by very different rates of growth between regions On Java cassava product~on grew at an annual rate of 1 8% while off-Java the growth rate was 5 2% Even on Java growth occurred only in Central and Eastern Java while production was stagnate ~n Western Java By far the most rapid rate of growth occurred in Lampung on Sumatra where production grew at a 12 2% annual rate tr~pling in the space of a decade
The faster rate of growth on the off-islands than on Java would be expected part~cularly given the severe land constraint on Java versus the outer islands and the policy to settle populations on the outer ~slands The 1 8% growth rate in production on Java in the 1970 s was due to a decli~1 in area of O 9-' per year and an annual ~ncrease in y~elds of 2 8% - Historically yields on Java had been stat~c at a little over 7 t/ha since the 1920 s (Roche 1983) and only since 1973 have yields levels shown a consistent rising trend The natural quest~on is what are the factors that have precipitated this relatively sudden and rapid rise in yields? A corrollary however would be the ~dentification of the factors that have kept yields on Java much lower than other ma]or producing countries in Southeast Asia that is about half the yield levels in India and Thailand The intensity of production systems on Java and the favorable agro-climatic conditions would suggest s~milar or higher y~eld
potent~al These issues shall be explored in the follow~ng two sections
Product~on growth on the outer islands during the 1970 s showed a distinctly d~fferent pattern to that on Java The pr~nc~pal factor responsible for the S 2/ production growth rate was the 3 2r annual expansion in area This is similar to the population growth rate off-Java of 3 0-' in the 1971-80 per~od However most of th~s expans~on was
See Roche (1983) for a discussion of factors contributing to decl~n~ng area planted to cassava
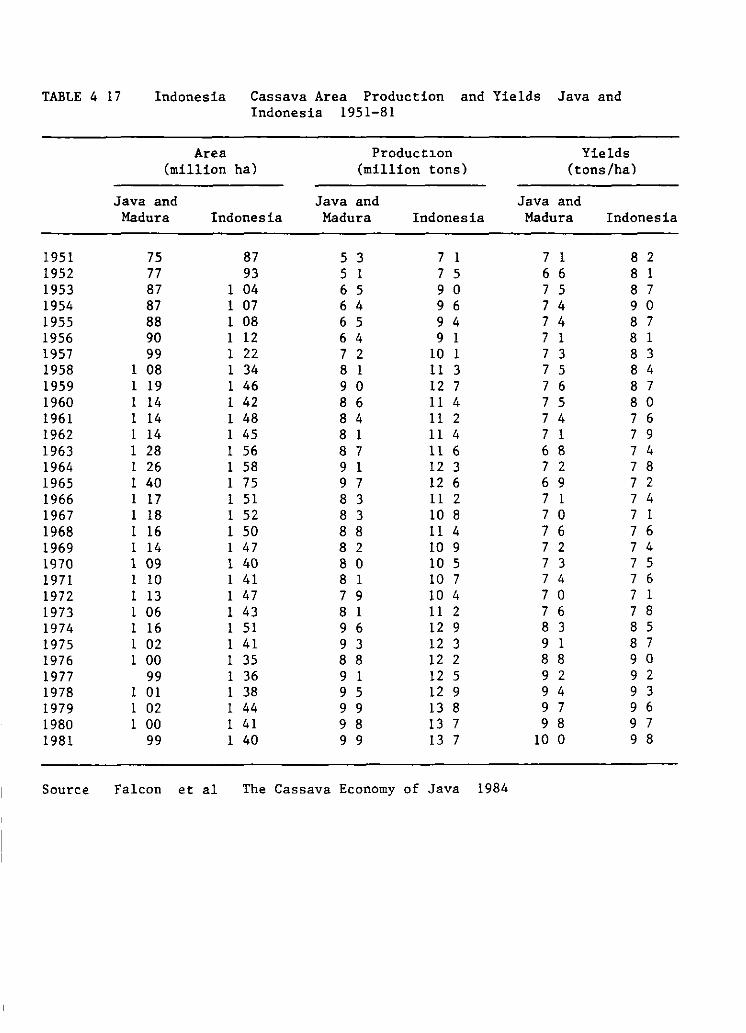
TABLE 4 17 Indonesia Cassava Area Production and Yields Java and Indonesia 1951-81
Are a Productl.on Yields (million ha) (million tons) (tons/ha)
Java and Java and Java and Madura Indonesia Madura Indonesia Madura Indonesia
1951 75 87 5 3 7 1 7 1 8 2 1952 77 93 5 1 7 5 6 6 8 1 1953 87 1 04 6 5 9 o 7 5 8 7 1954 87 1 07 6 4 9 6 7 4 9 o 1955 88 1 08 6 5 9 4 7 4 8 7 1956 90 1 12 6 4 9 1 7 1 8 1 1957 99 1 22 7 2 10 1 7 3 8 3 1958 1 08 1 34 8 1 11 3 7 5 8 4 1959 1 19 1 46 9 o 12 7 7 6 8 7 1960 1 14 1 42 8 6 11 4 7 5 8 o 1961 1 14 1 48 8 4 11 2 7 4 7 6 1962 1 14 1 45 8 1 11 4 7 1 7 9 1963 1 28 1 56 8 7 11 6 6 8 7 4 1964 1 26 1 58 9 1 12 3 7 2 7 8 1965 1 40 1 75 9 7 12 6 6 9 7 2 1966 1 17 1 51 8 3 11 2 7 1 7 4 1967 1 18 1 52 8 3 10 8 7 o 7 1 1968 1 16 1 50 8 8 11 4 7 6 7 6 1969 1 14 1 47 8 2 10 9 7 2 7 4 1970 1 09 1 40 8 o 10 5 7 3 7 5 1971 1 10 1 41 8 1 10 7 7 4 7 6 1972 1 13 1 47 7 9 10 4 7 o 7 1 1973 1 06 1 43 8 1 11 2 7 6 7 8 1974 1 16 1 51 9 6 12 9 8 3 8 5 1975 1 02 1 41 9 3 12 3 9 1 8 7 1976 1 00 1 35 8 8 12 2 8 8 9 o 1977 99 1 36 9 1 12 5 9 2 9 2 1978 1 01 1 38 9 5 12 9 9 4 9 3 1979 1 02 1 44 9 9 13 8 9 7 9 6 1980 1 00 1 41 9 8 13 7 9 8 9 7 1981 99 1 40 9 9 13 7 10 o 9 8
Source Falcon et al The Cassava Economy of Java 1984
IV - 16 -
concentrated on Sumatra and particularly in Lampung Area and production expansion thus appeared to be related more to expanding infrastructure and market possibilities than to expanding population However expand1ng area was not extensive in nature since cassava yields as well rose at a rate of 2 O% per annum on the outer islands
Thus trends in cassava product1on in Indonesia over the past decade have been favorable particularly given the severe land constraint on Java where the bulk of the cassava is produced Nevertheless cassava production on the outer islands is growing much faster due in part to the unexplo1ted land resources there Th1s creates someth1ng of a d1chotomy 1n any further expansion of cassava wh1ch as w1ll be seen in the succeeding analysis is reinforced by other majar differences in production systems between Java and the outer islands
Cassava production systems
Cassava production systems in Indones1a unlike other maJ or cassava producing countries 1n Asia are complex Complexity in th1s case introduces diversity and across Indonesia there 1s substant1al variation 1n product1on systems based on agro-climatic condit1ons land availability and market access (Table 4 19) Unfortunately there has been only one maJ or attempt to study these production systems in depth and as a result this section will by necessity principally summarize the research of Rache (1983) in h1s analysis of cassava cropping systems in three regions of Java Moreover because of the differences in land/labor ratios between Java and the outer islands product1on systems on Java w1ll be considered independently of those off-Java
The complexity of cassava production systems on Java derives from 1ntercropping and rotat1on systems and from double-cropping with rice in certa1n land types Because med1an farm size on Java 1s only O 4 hectares farmers seek to opt1m1ze returns to this limited resource Over half of cassava grown on Java is intercropped (Table 4 20) with the princ1pal intercrops being ma1ze and upland rice and in West Java legumes such a peanuts and soybeans In certain areas clase to urban areas where fresh market prices are sufficiently high cassava 1n monoculture will follow rice on irrigated land particularly where there is not suffic1ent water for a second rice crop Finally although cassava will in most cases not complete for land w1th r1ce it will have to compete for labor and capital resources so that appropr1ate timing of cassava cultural practices is a majar factor 1n production systems
Agro-climatic conditions particularly rainfall distribution so1l type and soil fert1l1ty together with 1rrigation availab1lity are determ1n1ng factors 1n the choice of cassava cropping system Rainfall 1s adequate for cassava all over Java but in certa1n ra1nfed areas is l1m1t1ng for other crops Thus as rainfall reliability declines from west to east (Figure 4 6) cassava product1on tends to be concentrated more in the eastern part of Java and on the island of Madura (Figure 4 7) even though cassava is grown throughout Java apart from the 1rr1gated areas of the northern pla1ns
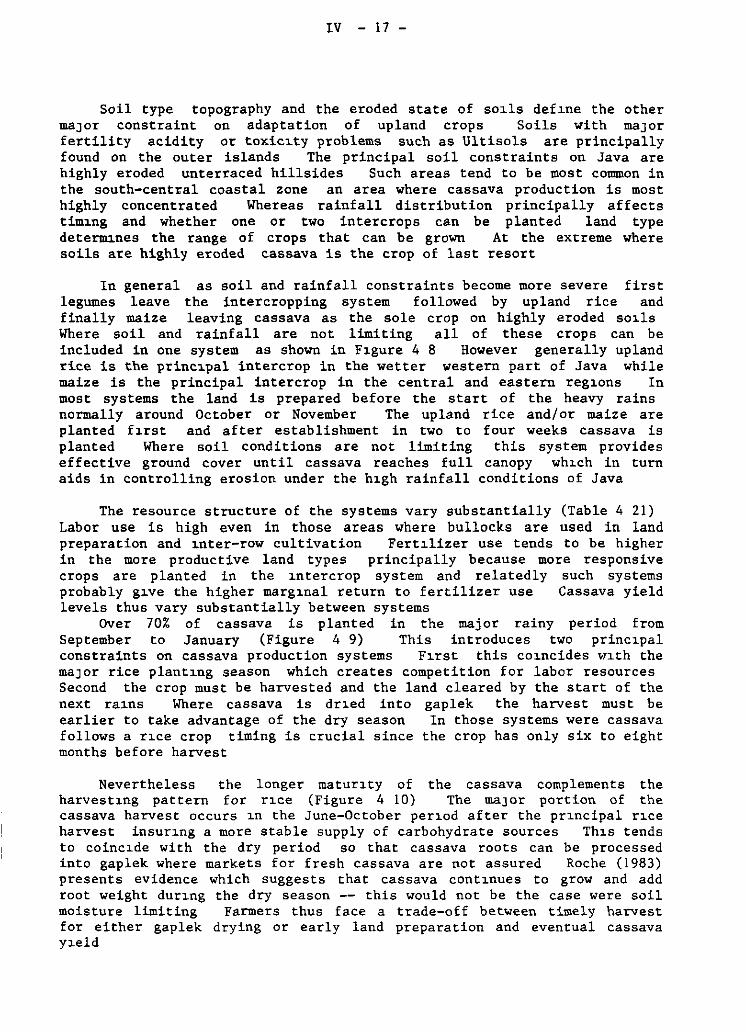
IV - 17 -
Soil type topography and the eroded state of so~ls def~ne the other maJor constraint on adaptation of upland crops Soils with ma]or fertility acidity or toxic~ty problems such as Ultisols are principally found on the outer islands The principal soil constraints on Java are highly eroded unterraced hillsides Such areas tend to be most common in the south-cent-ral coastal zone an area where cassava production is most highly concentrated Whereas rainfall distribution principally affects tim~ng and whether one or two intercrops can be planted land type determ~nes the range of crops that can be grown At the extreme where soils are highly eroded cassava is the crop of last resort
In general as soil and rainfall constraints become more severe first legumes leave the intercropping system followed by upland rice and finally maize leaving cassava as the sale crop on highly eroded so~ls
Where soil and rainfall are not limiting all of these crops can be included in one system as shown in F~gure 4 8 However generally upland rice is the princ~pal intercrop in the wetter western part of Java while maize is the principal intercrop in the central and eastern reg~ons In most systems the land is prepared befare the start of the heavy rains normally around October or November The upland rice and/or maize are planted f~rst and after establishment in two to four weeks cassava is planted Where soil conditions are not limiting this system provides effective ground cover until cassava reaches full canopy wh~ch in turn aids in controlling erosion under the h~gh rainfall conditions of Java
The resource structure of the systems vary substantially (Table 4 21) Labor use is high even in those areas where bullocks are used in land preparation and ~nter-row cultivation Fert~lizer use tends to be higher in the more productive land types principally because more responsive crops are planted in the ~ntercrop system and relatedly such systems probably g~ve the higher marg~nal return to fertilizer use Cassava yield levels thus vary substantially between systems
Over 70% of cassava is planted in the major rainy period from September to January (Figure 4 9) This introduces two princ1pal constraints on cassava production systems F1rst this co1ncides >11th the maJar rice plant1ng season which creates competition for labor resources Second the crop must be harvested and the land cleared by the start of the next ra1ns Where cassava is dr1ed into gaplek the harvest must be earlier to take advantage of the dry season In those systems were cassava follows a r1ce crop timing is crucial since the crop has only six to eight months befare harvest
Nevertheless the longer matur1ty of the cassava complements the harvest1ng pattern for r1ce (Figure 4 JO) The maJar portian of the cassava harvest occurs 1n the June-October per1od after the pr1ncipal r1ce harvest insur1ng a more stable supply of carbohydrate sources Th1s tends to coinc1de with the dry period so that cassava roots can be processed into gaplek where market.s for fresh cassava are not. assured Rache (1983) presents evidence which suggest.s that cassava cont1nues to grow and add root weight dur1ng the dry season -- this would not be the case were soil moisture limiting Farmers thus face a trade-off between t.imely harvest. for either gaplek drying or early land preparation and eventual cassava y1eld
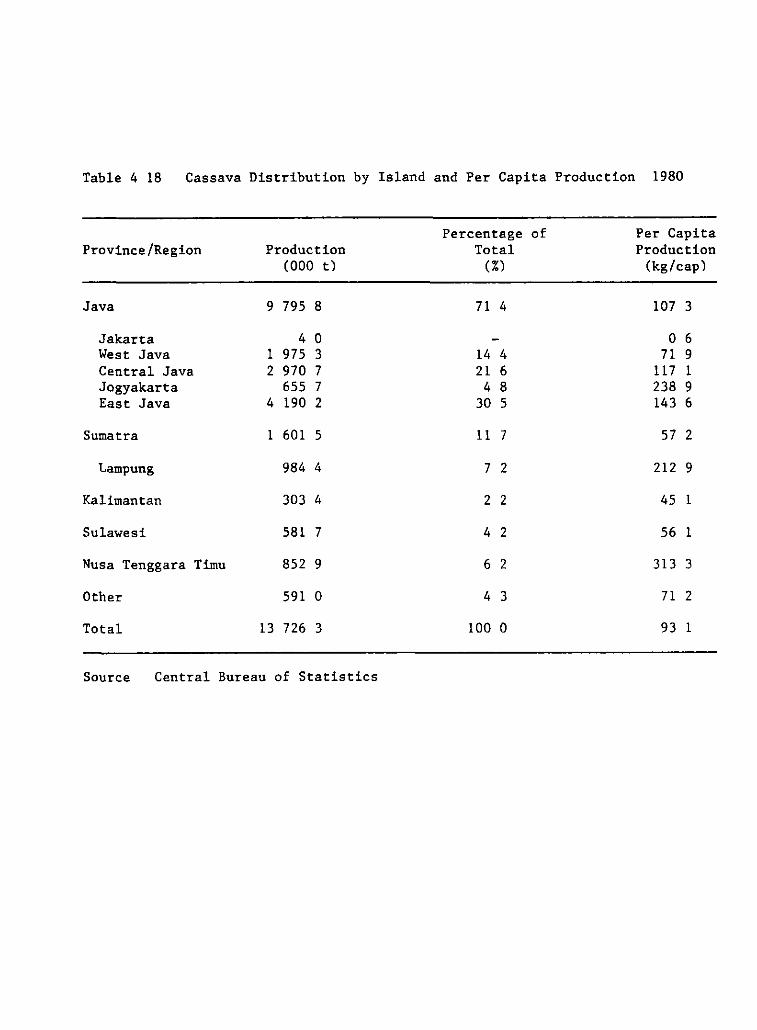
Table 4 18 Cassava Distribution by Island and Per Capita Production 1980
Percentage of Per Capita Province/Region Production Total Production
(000 t) (%) (kg/cap)
Java 9 795 8 71 4 107 3
Jakarta 4 o o 6 West Java 1 975 3 14 4 71 9 Central Java 2 970 7 21 6 117 1 Jogyakarta 655 7 4 8 238 9 East Java 4 190 2 30 S 143 6
Sumatra 1 601 S 11 7 57 2
Lampung 984 4 7 2 212 9
Kalimantan 303 4 2 2 45 1
Sulawesi 581 7 4 2 56 1
Nusa Tenggara Timu 852 9 6 2 313 3
Other 591 o 4 3 71 2
Total 13 726 3 lOO O 93 1
Source Central Bureau of Statistics
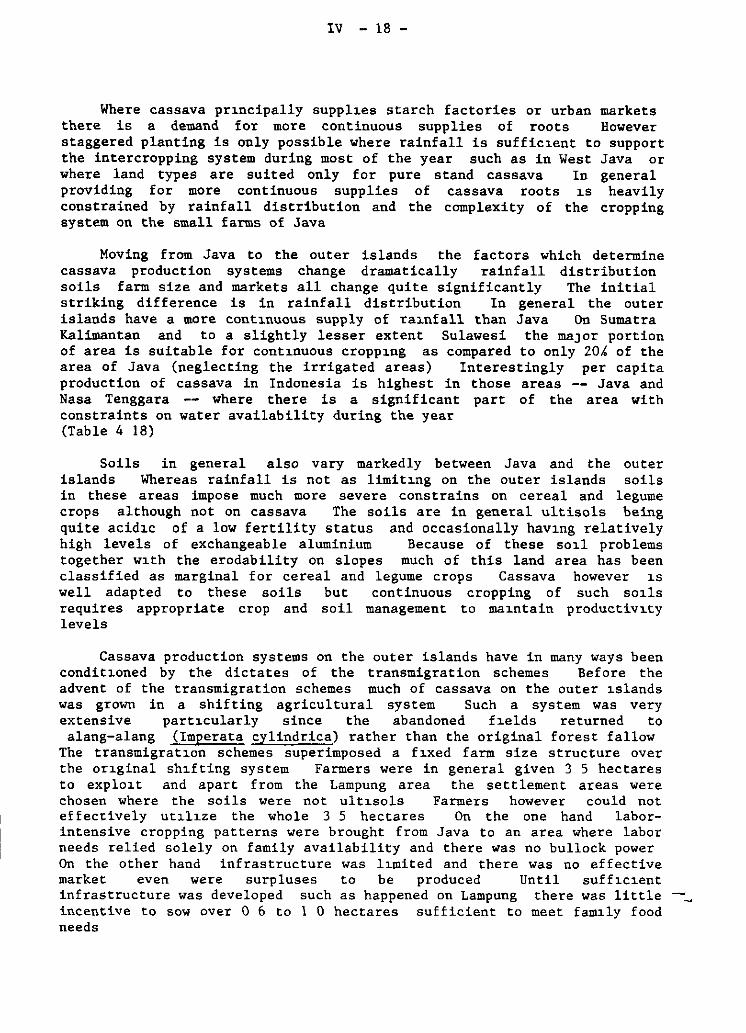
IV - 18 -
Where cassava pr1ncipally suppl1es starch factories or urban markets there is a demand for more continuous supplies of roots However staggered planting is only possible where rainfall is suffic1ent to support the intercropping system during most of the year such as in West Java or where land types are suited only for pure stand cassava In general providing for more continuous supplies of cassava roots 1s heavily constrained by rainfall distribution and the complexity of the cropping system on the small farms of Java
Moving from Java to the outer islands the factors which determine cassava production systems change dramatically rainfall distribution soils farm size and markets all change quite significantly The initial stril<ing difference is in rainfall distribution In general the outer islands have a more cont1nuous supply of ra1nfall tban Java On Sumatra Kalimantan and to a slightly lesser extent Sulawesi the maJor portien of area is suitable for cont1nuous cropp1ng as compared to only 20~ of the area of Java (neglecting the irrigated areas) Interestingly per capita production of cassava in Indonesia is highest in those areas -- Java and Nasa Tenggara -- where tbere is a significant part of tbe area with constraints on water availability during the year (Table 4 18)
Soils in general also vary markedly between Java and the outer islands Whereas rainfall is not as limit1ng on tbe outer islands soils in tbese areas impose much more severe constrains on cereal and legume crops although not on cassava The soils are in general ultisols being quite acid1c of a low fertility status and occasionally hav1ng relatively high levels of exchangeable aluminium Because of these so1l problems together w1th the erodability on slopes much of this land area has been classified as marginal for cereal and legume crops Cassava however 1s well adapted to these soils but continuous cropping of such so1ls requires appropriate crop and soil management to ma1ntain productiv1ty levels
Cassava production systems on the outer islands have in many ways been condit1oned by the dictates of the transmigration schemes Before the advent of the transmigration schemes much of cassava on the outer 1slands was grown in a shifting agricultura! system Such a system was very extensive part1cularly since the abandoned f1elds returned to alang-alang (Imperata cylindrica) rather than the original forest fallow
The transmigrat1on schemes superimposed a f1xed farm size structure over the or1ginal sh1fting system Farmers were in general given 3 S hectares to explo1t and apart from the Lampung area the settlement areas were chosen where the soils were not ult1sols Farmers however could not effectively ut1lue the whole 3 S hectares On the one hand laborintensive cropping patterns were brought from Java to an area where labor needs relied solely on family availability and there was no bullock power On the other hand infrastructure was l1mited and there was no effective market even were surpluses to be produced Until suff1c1ent infrastructure was developed such as happened on Lampung there was little incentive to sow over O 6 to l O hectares sufficient to meet fam1ly food needs
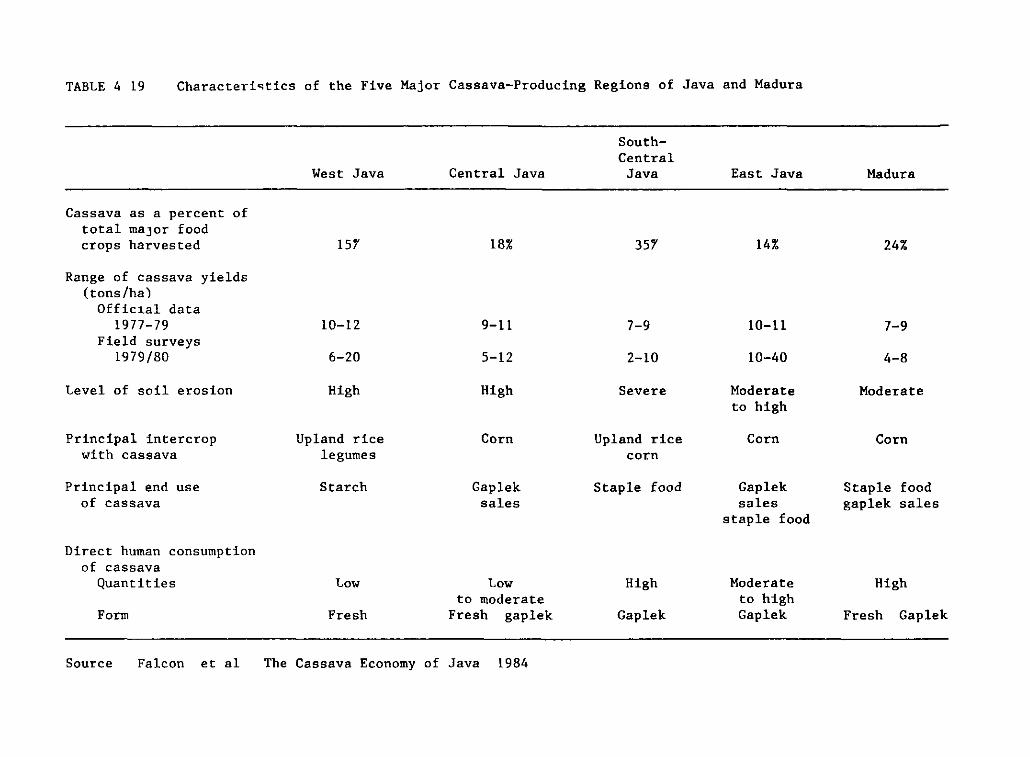
TABLE 4 19 Characteri~tics of the Five Major Cassava-Producing Regions of Java and Madura
Cassava as a percent of total rnaJor food crops harvested
Range of cassava yields (tons/ha)
Offic1al data 1977-79
Field surveys 1979/80
Level of soil erosion
Principal intercrop with cassava
Principal end use of cassava
Direct human consumption of cassava
Quantities
Fom
Source Falcon et al
West Java
1sr
10-12
6-20
High
Upland rice legurnes
Starch
Low
Fresh
Central Java
18%
9-ll
5-12
High
Corn
Gap le k sales
Low to rnoderate
Fresh gaplek
The Cassava Economy of Java 1984
SouthCentral
Java
3sr
7-9
2-10
Severe
Upland rice corn
Staple food
High
Gap le k
East Java
14%
10-ll
10-40
Modera te to high
Corn
Gap le k sales
staple food
Modera te to high Gap le k
Madura
24%
7-9
4-8
Moderate
Corn
Staple food gaplek sales
High
Fresh Gaplek
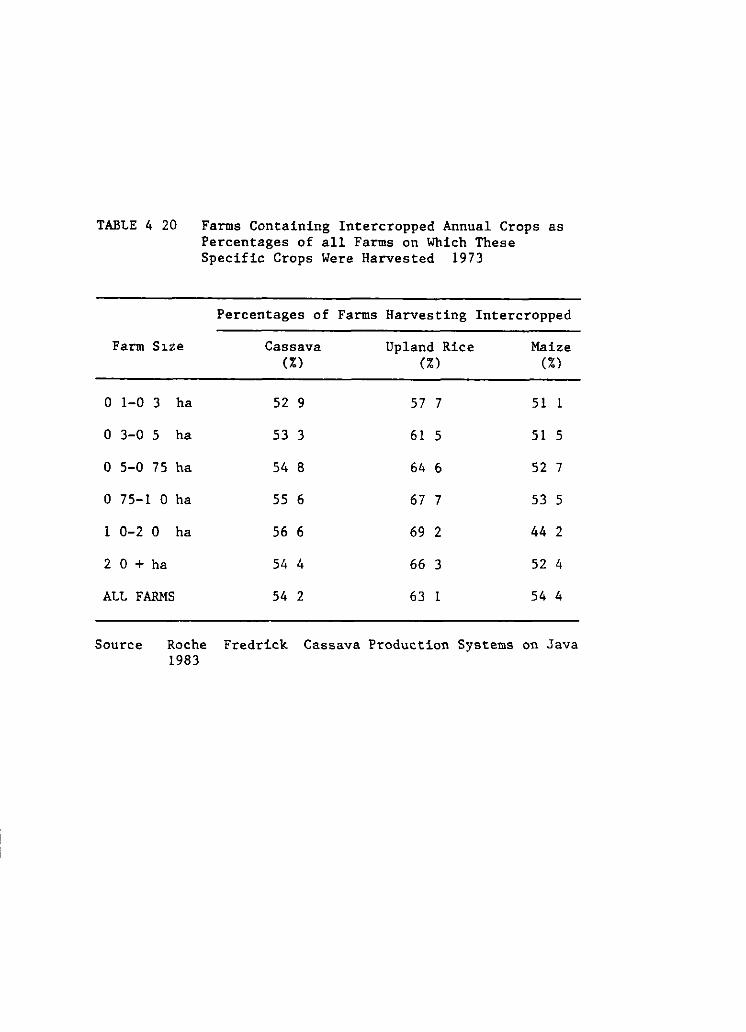
TABLE 4 20 Farms Containing Intercropped Annual Crops as Percentages of all Farms on Which These Specific Crops Were Harvested 1973
Percentages of Farms Harvesting Intercropped
Farm S1ze Cassava Upland Rice Maize (%) (%) (%)
o 1-0 3 ha 52 9 57 7 51 1
o 3-0 5 ha 53 3 61 5 51 5
o 5-0 75 ha 54 8 64 6 52 7
o 75-1 o ha 55 6 67 7 53 S
1 0-2 o ha 56 6 69 2 44 2
2 o + ha 54 4 66 3 52 4
ALL FARMS 54 2 63 1 54 4
Source Ro che Fredrick Cassava Production Systems on Java 1983
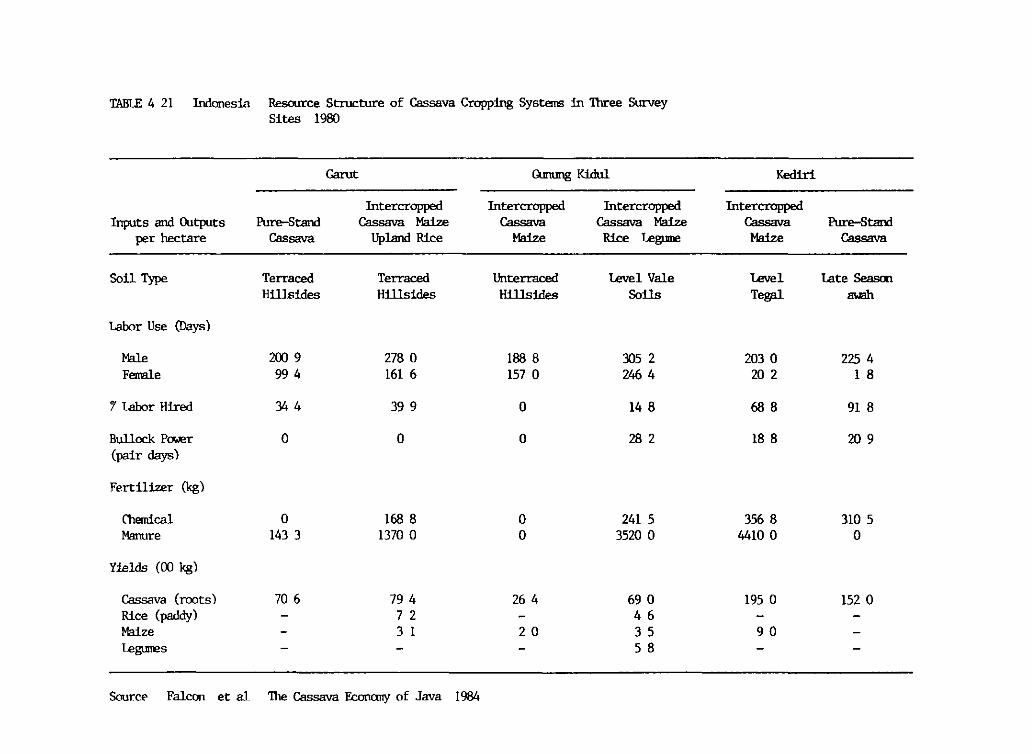
TABI.E 4 21 Indonesia Resource Structure of Cassava Cropp:!ng Syst:ems :In Three Survey Sites 1980
Garut Qmung Kidul Kedirl
Intercropped Intercropped Intercropped Intercropped Inputs and Outputs Pure-Stand Cassava Mai2.e Cassava Cassava Mai2.e Cassava Pure-Stand
per hectare Cassava Upland Rice Maize Rice tegume Maize Cassava
Soil Type Terraced Terraced Unterraced level Vale tevel Late Season Hills:!des Hillsides Hills:!des Soils Tegal ....m
Labor Use (Days)
Male 200 9 278 o 188 8 30S 2 203 o 225 4 Female 994 161 6 1S7 o 246 4 20 2 1 8
"/ Labor Hired 344 39 9 o 14 8 688 91 8
Bullock Power o o o 282 18 8 20 9 (pair days)
Fertilizer (kg)
Cbem:!cal o 168 8 o 241 S 3S6 8 310 S Manure 143 3 1370 o o 3S20 o 4410 o o
Yields (00 kg)
Cassava ( roots) 70 6 79 4 26 4 69 o 19S o 1S2 o Rice (paddy) - 7 2 - 4 6 Maize - 3 1 2 o 3 S 9 o legumes - - - S 8
Sourc<' Falcon et al The Cassava Fl:onany of Java 1984
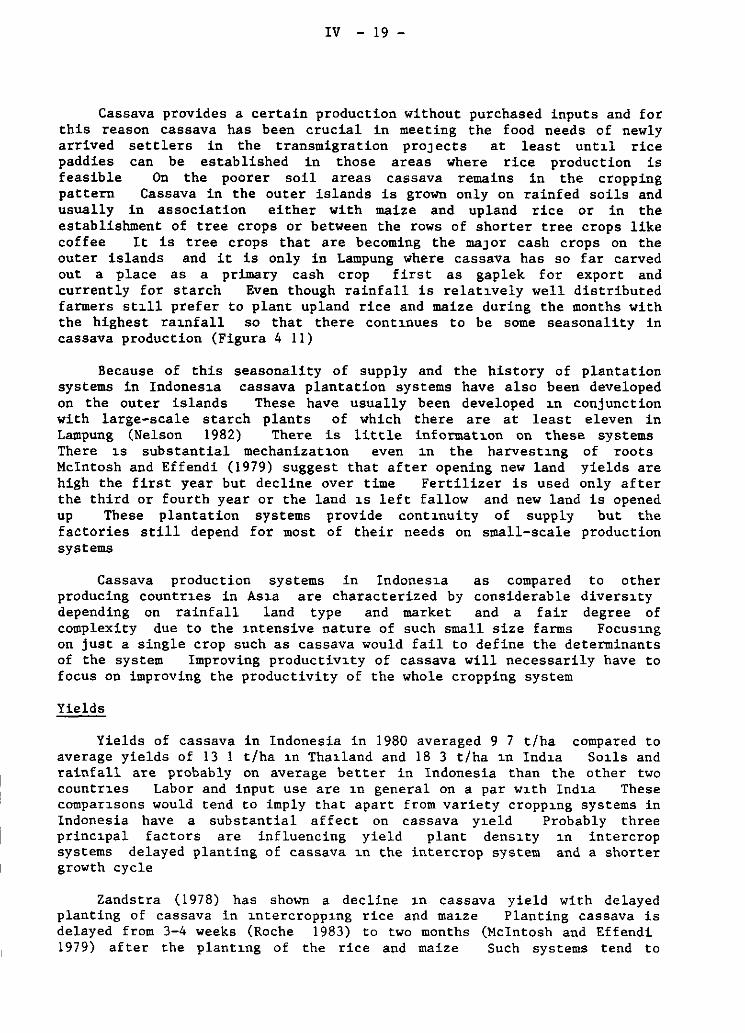
IV - 19 -
Cassava provides a certain production without purchased inputs and for this reason cassava has been crucial in meeting the food needs of newly arrived settlers in the transmigration proJects at least untLl rice paddies can be established in those areas where rice production is feasible On the poorer soil areas cassava remains in the cropping pattern Cassava in the outer islands is grown only on rainfed soils and usually in association either with maize and upland rice or in the establishment of tree crops or between the rows of shorter tree crops like coffee It is tree crops that are becoming the maJor cash crops on the outer islands and it is only in Lampung where cassava has so far carved out a place as a primary cash crop first as gaplek for export and currently for starch Even though rainfall is relatLvely well distributed farmers stLll prefer to plant upland rice and maize during the months with the highest raLnfall so that there contLnues to be some seasonality in cassava production (Figura 4 11)
Because of this seasonality of supply and the history of plantation systems in IndonesLa cassava plantation systems have also been developed on the outer islands These have usually been developed Ln conjunction with large-scale starch plants of which there are at least eleven in Lampung (Nelson 1982) There is little informatLon on these systems There LS substantial mechanizatLon even Ln the harvestLng of roots Mclntosh and Effendi (1979) suggest that after opening new land yields are high the first year but decline over time Fertilizer is used only after the third or fourth year or the land LS left fallow and new land is opened up These plantation systems provide contLnuity of supply but the factories still depend for most of their needs on small-scale production systems
Cassava production systems in IndonesLa as compared to other producing countrLes in AsLa are characterized by considerable diversLty depending on rainfall land type and market and a fair degree of complexity due to the 1ntensive nature of such small size farms FocusLng on just a single crop such as cassava would fail to define the determinants of the system Improving productiVLty of cassava will necessarily have to focus on improving the productivity of the whole cropping system
Yields
Yields of cassava in Indonesia in 1980 averaged 9 7 t/ha compared to average yields of 13 1 t/ha Ln ThaLland and 18 3 t/ha Ln IndLa SoLls and rainfall are probably on average better in Indonesia than the other two countrLes Labor and input use are Ln general on a par WLth IndLa These comparLsons would tend to imply that apart from variety croppLng systems in Indonesia have a substantial affect on cassava yLeld Probably three princLpal factors are influencing yield plant densLty Ln intercrop systems delayed planting of cassava Ln the intercrop system and a shorter growth cycle
Zandstra (1978) has shown a decline 1n cassava yield with delayed planting of cassava in LntercroppLng rice and maLze Planting cassava is delayed from 3-4 weeks (Roche 1983) to two months (Mcintosh and Effendi 1979) after the plantLng of the rice and maize Such systems tend to
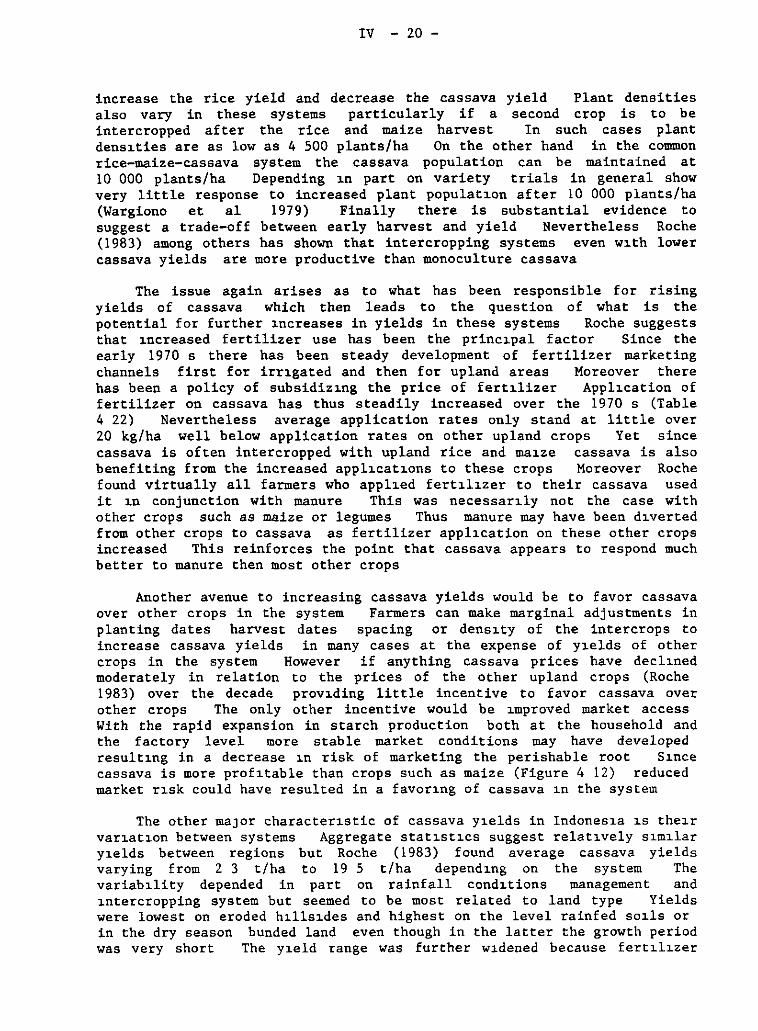
IV - 20 -
increase the rice yield and decrease the cassava yield Plant densities also vary in these systems particularly if a second crop is to be intercropped after the rice and maize harvest In such cases plant dens~ties are as low as 4 500 plants/ha On the other hand in the common rice-maize-cassava system the cassava population can be maintained at 10 000 plants/ha Depending ~n part on variety trials in general show very little response to increased plant populat~on after 10 000 plants/ha (Wargiono et al 1979) Finally there is substantial evidence to suggest a trade-off between early harvest and yield Nevertheless Rache (1983) among others has shown that intercropping systems even w~th lower cassava yields are more productive than monoculture cassava
The issue again arises as to what has been responsible for rising yields of cassava which then leads to the question of what is the potential for further ~ncreases in yields in these systems Rache suggests that ~ncreased fertilizer use has been the princ~pal factor Since the early 1970 s there has been steady development of fertilizer marketing channels first for irr~gated and then for upland areas Moreover there has been a policy of subsidiz~ng the price of fert~lizer Appl~cation of fertilizer on cassava has thus steadily increased over the 1970 s (Table 4 22) Nevertheless average application rates only stand at little over 20 kg/ha well below application rates on other upland crops Yet since cassava is often intercropped with upland rice and ma~ze cassava is also benefiting from the increased appl~cat~ons to these crops Moreover Rache found virtually all farmers who appl~ed fert~l~zer to their cassava used it ~n conjunction with manure This was necessar~ly not the case with other crops such as maize or legumes Thus manure may have been d~verted from other crops to cassava as fertilizer appl~cation on these other crops increased This reinforces the point that cassava appears to respond much better to manure then most other crops
Another avenue to increasing cassava yields would be to favor cassava over other crops in the system Farmers can make marginal adjustments in planting dates harvest dates spacing or dens~ty of the intercrops to increase cassava yields in many cases at the expense of y~elds of other crops in the system However if anything cassava prices have decl~ned
moderately in relation to the prices of the other upland crops (Rache 1983) over the decade prov~ding little incentive to favor cassava over other crops The only other incentive would be ~mproved market access With the rapid expansion in starch production both at the household and the factory level more stable market conditions may have developed result~ng in a decrease ~n risk of marketing the perishable root s~nce
cassava is more prof~table than crops such as maize (Figure 4 12) reduced market r~sk could have resulted in a favor1ng of cassava 1n the system
The other maJar character1stic of cassava y1elds in Indones1a ~s the1r var~at~on between systems Aggregate stat~st~cs suggest relat1vely s1m1lar y1elds between regions but Rache (1983) found average cassava yields varying from 2 3 t/ha to 19 5 t/ha depend~ng on the system The variab1lity depended in part on rainfall cond~tions management and 1ntercropping system but seemed to be most related to land type Yields were lowest on eroded h1lls~des and highest on the level rainfed so~ls or in the dry season bunded land even though in the latter the growth period was very short The y1eld range was further w1dened because fert1l~zer
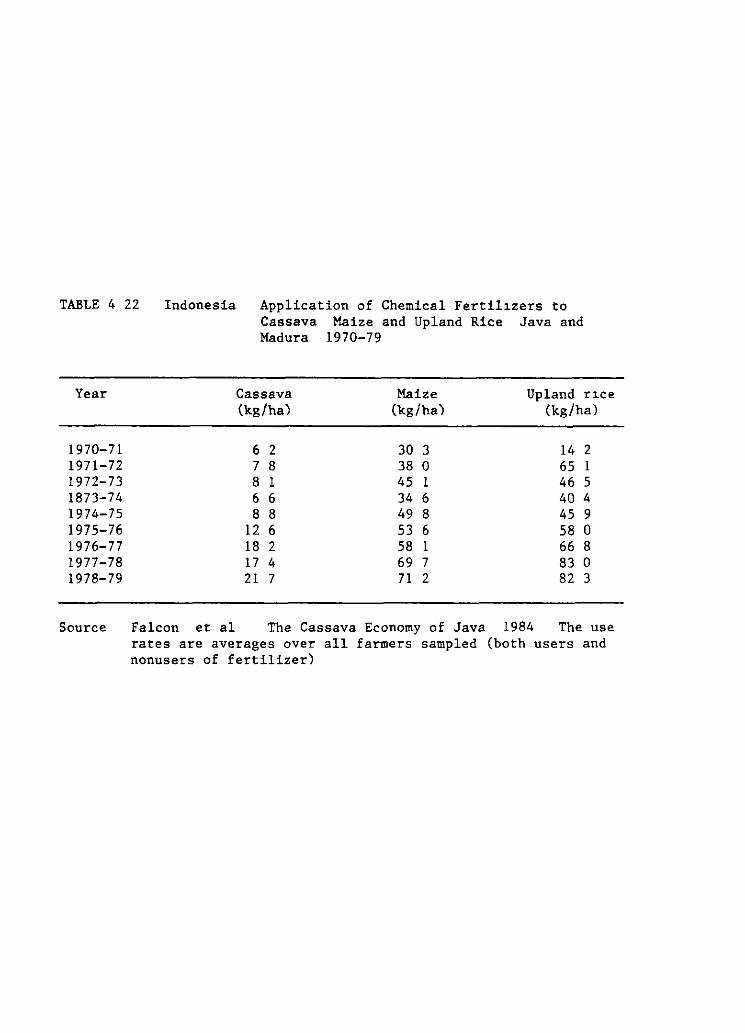
TABLE 4 22 Indonesia Application of Chemical Fertil1zers to Cassava Maize and Upland Rice Java and Madura 1970-79
Year
1970-71 1971-72 1972-73 1873-74 1974-75 1975-76 1976-77 1977-78 1978-79
Cassava (kg/ha)
6 2 7 8 8 1 6 6 8 8
12 6 18 2 17 4 21 7
Maize Upland r1ce (kg/ha) (kg/ha)
30 3 14 2 38 o 65 1 45 1 46 S 34 6 40 4 49 8 45 9 53 6 58 o 58 1 66 8 69 7 83 o 71 2 82 3
Source Falcon et al The Cassava Economy of Java 1984 The use rates are averages over all farmers sampled (both users and nonusers of fertilizer)
IV - 21 -
tended to be appll.ed to the better soils Two points arise in regard to the yield var~ation between systems First rising y~elds could be due to a relative shift ~n area to the more productive systems Aga~n this would be motivated by changing market conditions for the cassava crop Second yield constra~nts in these systems are so different that increasing yields w~ll in large part depend on adapting technology to distinct land systems
this ~s a principal feature of IRRI s cropping systems research methodology (Zandstra et al 1981)
Costs of production and labor utilizat~on
Compared to other countries in Asia labor use in cassava production systems in Indonesia is h~gh in general double or triple per hectare labor inputs in most other countr~es Th~s reflects the very low land/labor ratios on Java on the one hand and the more complex cropping systems on the other hand Nevertheless even in monoculture cassava systems where bullocks are used ~n land preparation labor input exceeds 200 mandays/ha (Roche 1983) Even more striking is the fact that labor ~nput off-Java remains h~gh In a survey by Hambrect (personal communication) labor input ~n Gedony Tatson distr~ct ~n Sumatra averaged 354 mandays/ha of which 61 mandays were for peeling and drying into gaplek Wardhani (1976) cites a figure of 424 man-days per hectare for the upland-rice-maize-cassava system found in southern Sumatra Even on the off islands labor intensity of the production systems is not radically al te red
Labor thus forros a major component in costs of production however the proportion varies markedly with the inherent productivity of the land system On the eroded hillsides of Gunung K~dul labor is pract~cally the only input while on the level ra~nfed soils of Ked~ri lat-or costs are higher than Gunung K~dul but still forro less than half of total variable costs (Table 4 23) Higher levels of purchased inputs are applied to the more productive land systems so that naturally higher yields are achieved w~th higher per hectare costs
The costing of cassava production on Java ~s complicated by the characterist~cs of the agricultural economy particularly the substant~al underemployment in labor markets the high pr~or~ty given to subsistence needs and the diversity in land and cropping systems How the farroer Judges the relative profitability of crops deterro~nes to a signif~cant extent bis choice of cropping pattern The central issues ~n th~s regard are how the farroer costs fam~ly labor (i e the opportunity cost of fam~ly labor in a labor market where the costs of JOb search can be high relat~ve to the wage) and how the farroer evaluates a normal return to land (~ e rental rates may be h~gh but assuring subsistence needs is a pr~or~ty
obJective) Roche (1984) and M~nk (1985) both calculate alternative measures of eHher profitability or returns on farroer-owned resources ~n
order to evaluate the relative profitabil~ty of d~fferent cropping systems
As ~s apparent in the summary of Roche s data ~n Table 4 23 cassava -based systems prov~de a significant return on cash outlays (ProfH I) often h1gher than returns on other palawiJ a crops (Roche 1983 M1nk 1985) Moreover these systems also provl.de positive returns for land and management after fam1ly labor has been costed out at market wage rates
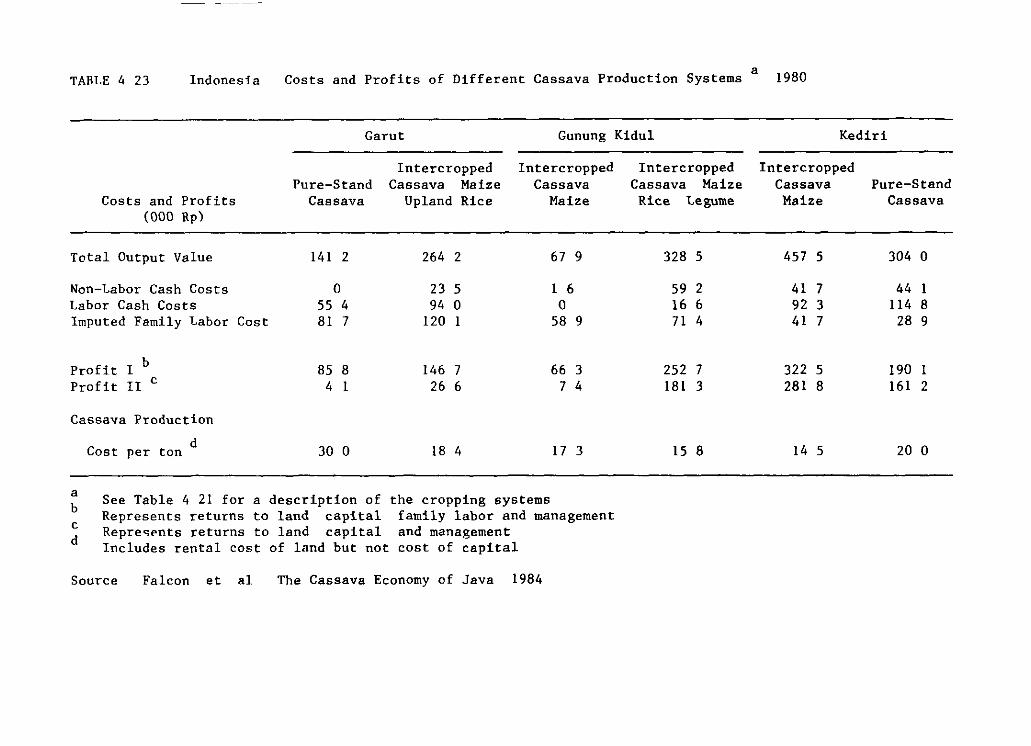
TABLE 4 23 Indonesia a
Costs and Profits of Different Cassava Production Systems 1980
Garut Gunung Kidul
Costs and Profits (000 Rp)
Total Output Value
Non-Labor Cash Costs Labor Cash Costs lmputed Family Labor
Profit I b Profit II e
Cassava Prorluction
d Cost per ton
Cost
Intercropped Pure-Stand Cassava Maize
Cassava Upland Rice
141 2 264 2
o 23 5 55 4 94 o 81 7 120 1
85 8 146 7 4 1 26 6
30 o 18 4
Intercropped Cassava
Maize
67 9
1 6 o
58 9
66 3 7 4
17 3
a See Table 4 21 for a description of the cropping systems b Representa returns to land capital family labor and management e d
RepreGPnts returns to land capital and management Includes rental cost of land but not cost of capital
Source Falcon et al The Cassava Economy of Java 1984
Intercropped Cassava Maize Rice Legume
328 5
59 2 16 6 71 4
252 7 181 3
15 8
Kediri
Intercropped Cassava Maize
457 5
41 7 92 3 41 7
322 5 281 8
14 5
Pure-Stand Cassava
304 o
44 1 114 8
28 9
190 1 161 2
20 o
IV - 22 -
(Profit II) Finally if the opportunity costs of land are added and costs of cassava production are c'67culated on a per ton basis these per ton costs (except in one cas~} are in general equal to or less than the 1980 farm-level price Cassava-based systems generate sufficient profit to cover the market costs of the factors of production a fact of some significance in such intensive systems The maintenance of normal profl.t levels for cassava is reflected in both the importance of the cassava as a cash crop and its relative stability in the cropping systems of Java and Southern Sumatra over the last severa! decades
Technology development
Since the constra~nts on cassava yields are both not fully understood and vary substantially across Indonesia a research program to develop yield-increasing cassava technology needs both a close linkage to farmer production systems and a quite extensive testing system Moreover ra~sing
cassava yields will have to be done within intercropping systems and it will not be possible to heavily sacrifice yields of other crops in increasing cassava yields especially that of upland rice F~nally yield potent~al will be heavily c~rcumscribed by climatic and soil condit~ons so that any yield gap analysis will have to be defined in terms of locat~on
and land system
Such a research focus requires a certain critica! level of resources yet research resources for palawija crops have traditionally been limited as most resources have been devoted to rice Agricultura! research ~s
relatively centralized in Indonesia and comes under the responsibility of the Agency for Agr~cultural Research and Development (AARD) AARD is div~ded ~nto seven major research centers of which cassava comes under the Central Research Institute for Food Crops These central research institutes are ~n fact a coordinating body for a set of reg~onally based research centers of which there are seven under the Central Research Institute for Food Crops Cassava research in Indones~a ~s centered in the Root Crop Improvement Program which is under the Bogor Research Institute for Food Crops There is some consideration of plans for decentraliz~ng
research decision-making and making the seven research ~nstitutes semiautonomous wh~ch could mean that cassava research could be done in more of these ~nstitutes However currently cassava research is centered at Bogor which focuses on more basic research Thus all of the cassava breeding research is done at Bogor Agronomic research and advanced selection of clones are done at some of the other research centers
IJ
The one exception is one of the terraced h~lls~de systems in Garut s~nce th~s system was unfert~l~zed monoculture cassava this probably indicates land of inferior quality and therefore of a lower opportun~ty cost Nevertheless a constant rental value was appl~ed
to all systems thereby probably overestimating costs for th~s system
The 1980 price was exactly equal to the average (on a deflated price basis) of the per~od 1969-81 This is based on the rural market pr~ce ser~es for fresh roots for Java and Madura publ~shed by the Central Bureau of Statistics
IV - 23 -
Cassava technology development in Indonesia in the postwar period has principally focused on varietal development and fertill.zer trials Two varieties Adira I and II were released in 1978 Adira I has a lower HCN content shorter maturity higher starch content and about the same yield potent1al (35 t/ha) as Adira II Adira I is apparently grown quite widely on Lampung (Roberto Soenaryo private communication) but its adoption on Java has not been widespread Understanding why farmers have not adopted Adira I could offer valuable ins1ghts into whether the problem is the variety or its extension Clearly in Indonesian cassava systems yield 1s only one criterion among many that will motivate farmer adoption
Roche (1983) argues that the most immed1ate avenue to 1ncreas1ng cassava yields is through a combination of the Adira I var1ety and appropr1ate fert1lization In the longer term more f1nely tuned varietal development together with integrated fert1lization rotation seed management and intercropp1ng practices designed for homogenous land systems w1ll probably be the pr1ncipal means to achieving signihcant increases in cassava yields Certainly the objective will be a stable continuous cropping system in upland areas with cassava as a s1gnificant component
Another considerat1on is whether a distinct1on should be made 1n a casssava research strategy for Java versus the outer 1slands Resolut1on of th1s issue to a large extent will depend on whether research is decentralized and on land policy and the ava1lability of labor-saving technology in the transmigration schemes Currently cassava and other food crop product1on on the outer islands depends on the very labor-intensive production systems developed on Java Farmers usually cannot ut1lize all the land allocated to them because of the lack of labor and/or tenant markets (Wardhani 1976) Research in the outer 1slands to date has focused primarily on further 1ntensif1cation of intercropping systems with principal focus on resolving part1cular so1l constraints A broader setting of research obJectives might cons1der whether h1gher farmer incomes could be achieved with a continued focus on just land productivity or whether the focus should be on technolog1es that require less intensive labor use lead1ng to the cult1vation of more land
A focus on less-labor intensive cropp1ng systems for the outer islands would re1nforce cassava s role as a cash crop at least 1n those areas where infrastructure is suffic1ently well developed However the important role of cassava as a food crop where it is principally consumed in the fresh form should not be sacrificed A s1ngular focus on mechanizat1on and var1eties for the industrial starch market would favor primarily the plantation systems without attendant benef1ts for food consumpt1on of cassava A research strategy for cassava 1n Indonesia significant level of diversificat1on and a clearly defined linkage between requ1res a product1on constraints and end use In part1cular in any var1etal development the focus should be on the development of dual-purpose varieties where food quality parameters are ma1nta1ned in the select1on procesa Th1s is cr1t1cal to the maintenance of pr1ce 1ntegration wh1ch has been so 1mportant to the growth of cassava in Indonesia
IV - 24 -
Conclusions
Growth Ln the Indonesia economy has been impressLve over the decade of the 1970 s continuing through to 1982 GDP growth averaged 7 6% per annum Ln the 1970 s and was above that mark in 1980 and 1981 These growth rates were well above the average for either industrial or developing countries Only in 1982 did the economy start to be affected by the international economic recession and GDP growth fell to 2 3% rebounding to around 4% the following year The decline in oil prLces and demand for agrLcultural exports led to a significant decline in the foreign exchange reserve position culminatLng in a devaluation of the rupLah in 1983 and 1986 and tighter controls on imports Future growth in the Indonesian economy LS highly dependent on what happens in the petroleum export market nevertheless the economy is projected to grow by 5% per year through the rest of the decade (World Bank 1984)
Such sLgnifLcant growth in incomes have a marked impact on food demand Estimated annual per capLta consumption of rice increased from 107 kg in 1970 to 145 kg in 1983 Fortunately rapid demand growth corresponded with the rapid adoption of short stature rice technology and rice production almost doubled in this period even with very mLnor change in the land area planted to rice Nevertheless IndonesLa remained a majar net importer of rice importing as much as 2 million tons Ln 1980 Growth in production of rice is expected to slow somewhat through the end of the decade as the growth rate in yields declines Nevertheless IndonesLa is expected to remain at or near self-sufficiency in rice while continu1ng to maintain some capacity to import when productLon deviates from trend (World Bank 1984)
Indonesia has been relatively successful Ln attaLnLng self-suffLciency Ln the production of basic foodstuffs and in maintaLnLng relatively stable consumer prices especially for rice While the government has been successful in meetLng two of its food policy obJeCtLves Lmpact on raLsing farmers incomes the thLrd prLncipal food polLcy ob]ective has been less widespread This LS because the income generation from the new rLce technologies was dLrected almost exclusively toward the irrigated sector The benefits from the new rice technology have been inequitably dLstributed between regions and since the bulk of the population contLnues to depend on agrLculture for theLr income contLnued neglect of the upland areas will further increase these dLsparitLes
Two princLpal concerns should govern polLcy toward the upland sector The first is the relative priority between development of the upland areas on Java and those on the outer islands Java accounts for 47k of Indonesia s GDP 62% of the population and only 7/ of the land area The soLls on Java are relatively fertLle transport infrastructure 1s relatLvely well developed and very labor intensLve production systems have evolved to suit the extremely small average farm sue On the outer islands on the other hand the soils tend to be Lnfertile and highly acidLc and Lnfrastructure is not as highly developed Land is relatively plentiful The population distribution between Java and the outer islands creates a situatLon where both land and labor resources are underutilLzed and the transmigration projects were established to remedy this imbalance
IV - 25 -
Between 1971 and 1980 approxLmately 2 1 millLon migrants resettled Ln the outer islands of which one million were resettled through the transmigration program ThLs program had a signifLcant impact on agricultural employment Of the 1 8 million increase in agricultural employment Ln this period 1 4 million was off Java (World Bank 1982) Certainly any increase in area planted to crops will have to come on the outer islands and the government LS currently attempting through agricultural research estate development and the transmLgration projects to establish a base for future growth on the outer Lslands
The second issue LS the choice of crops where technology can be expected to raise productivity and markets are suffLciently expansive to absorb the increases in production thereby leadLng to increases Ln farmer Lncome Certainly cassava must be considered as a principal choice for both Java and the outer islands Maize is an alternatLve choice on Java and tree crops -- and maize in selected areas -- are an alternative on the outer Lslands Cassava could have a signifLcant potential impact given a higher committment of resources to support research on the crop
As a crop for development of the upland areas cassava has several advantages Most importantly the cassava marketing system in Indonesia LS probably the best developed in Asia w1th the possible exception of the larger but more specialLzed system in Thailand Prices efficiently allocate cassava between regions across different end uses and over time Moreover an effective price floor is provided by the gaplek export market Efficient markets together with the multiple end uses for cassava partLcularly the high consumption of gaplek and fresh cassava by the poor allows the 1ntroduction of improved production technology to achieve the dual policy objectLve of increasing farmers Lncomes and LmprovLng calorie intake of the rural poor Moreover the rapidly growing starch market with potential under current policies for the development of high fructose sweetners provides scope for the absorption of significant increases Ln production and any further surpluses could be exported at least upto the 825 thousand ton quota
Nevertheless the very uncertain sLtuation in the EC market for cassava pellets wLll contLnue to affect the Indonesian cassava economy if not Ln lower import quotas after 1986 then in the Lmpact on world prices and the impact that lower world prices wLll have on Indonesia farmers There is some opinLon (World Bank 1984) that IndonesLan wül be in a surplus position in both maize and cassava by the end of the decade with lLttle hope of absorbLng these production increases in domestic markets For cassava the report overlooked the large and dynamLc starch market but certainly any maJor productivity increases will probably result in internal prices remainLng effectLvely tied to the export prLce with the accompanying need to maintain some flexLbLlLty Ln the export market
More than anything else a dynamic cassava sector provides flexLbLlLty in Indonesia s food and agr:ccultural polLcy When r1ce yields start to plateau out at the end of the decade cassava can add flexibLlity to prLce and import polLcy for rice Moreover the starch high fructose sweetner and when necessary the export and/or domestLc feed markets can be a basLs

IV - 26 -
for expanding cassava on the outer islands agricultural areas where a well adapted cash crop for smallholders has been difficult to identify This type of flexibility w~ll be key for balanced agricultural and industr~al
development in Indonesia s future
IV - 27 -
Appendix 4 1 A synthesis of production and ut1lization
Th1s appendix reviews the consistency between production and consumption estimates for cassava in Indonesia and develops a supply and utilization table for the year 1978 The table disaggregates the data for Java and the outer islands Two other estimates of cassava supply and distribution exist one is the food balance sheets for Indonesia put out by the Central Bureau of Statistics and the other is an estimate by Laurian Unnevehr (1982) for Java only These estimates will be used as a point of reference in developing the supply and distribut1on estimates
Food uses are a dominant form of utilizat1on of cassava in Indonesia The most systemat1c estimates of cassava consumption patterns comes from the periodic National Socioeconomic Expend1ture Survey (Susenas) -- see Dixon (1982) for a discussion of the structure of the surveys The 1978 survey (Susenas V) found an average per capita consumpt1on of 20 3 kg of fresh roots and 9 4 kg of gaplek on Java and 20 2 kg of fresh roots and 3 1 kg of gaplek on the outer islands This resulted in an average for Indonesia as a whole of 20 2 kg of fresh roots and 7 3 kg of gaplek or an average of 42 1 kg of cassava on a fresh equivalent basis
A standard rate for convert1ng fresh roots to gaplek 1s more complex in Indonesia than Tha1land because roots are peeled and gaplek is not dr1ed to a standard percentage This introduces peeling loss moisture content and dry matter content as var1ables in the determination of the conversion rate Field observations suggest a peeling loss of 207 (Unnevehr 1982) which is 1n accord with standard percentages of peel to root weight of 15 to 20% found at CIAT (Rupert Best private communication) Moisture content of gaplek is apparently highly variable F1eld observation by Unnevehr suggests levels as high as 25% Studies at CIAT (Rupert Best private communication) have found problems of continu1ng phys1ological deter1oration and heavy fungal growth on cassava chips with h1gher than 18~ moisture even after one week Drying to mo1sture levels of 20~ or above the storage l1fe of cassava is not substantially extended unless there are alternative means of controlling fungal growth Unnevehr did f1nd relatively high losses 1n gaplek storage but only after relatively long periods What average moisture content of gaplek is at the point of consumpt1on remains somewhat of a question So also does the average dry matter content of cassava roots
Dixon (1982) and Unnevehr (1982) both employ a conversion rate of roots to gaplek of 2 S to 1 Assuming a 207 weight loss due to peeling gaplek at a 257 moisture content 1mplies a dry matter content of 37 57 wh1le at 18~ mo1sture a 41~ dry matter content is implied These dry matter percentages are above the normal range at least when compared to d1fferent genotypes evaluated at Bogar A more reasonable assumption 1s a 187 moisture content and a 33% dry matter content wh1ch g1ves a convers1on rate of 3 O to 1 for fresh roots to peeled gaplek
The 42 1 kg average leve! of cassava consumpt1on from the expend1ture surveys compares to an estimate from the food balance sheets of 74 O kg per espita Food consumpt1on 1n the food balance sheets is estimated as a residual after all other uses have been deducted The d1screpancy between
IV - 28 -
the two estimares is significant and provides the first 1ndication of some inconsistenc1es in e1ther the production estimates or the est1mates of other end uses To evaluate such discrepancies the data on the different end uses is first reviewed
The estimates of gaplek and fresh cassava consumption from the SUSENAS surveys are accepted as the best est1mate of d1rect food consumption although if anything these should probably be seen as m1nimum estimates Gaplek is not only used directly for human consumption but is also exported and Unnevehr (1982) found some gaplek being milled into flour by wholesalers and used in bakery products Gaplek exports from Indonesia are highly variable and in 1978 exports particularly from Java were on the low side Nevertheless export levels for the year 1978 were used Cassava flour on the other hand is assumed to be produced only on Java and Unnevehr s estimate is used
Starch is a ma]or utilization form in Indones1a and although 1t principally goes into food uses starch consumption is not included in the human consumption estimates Utilization of cassava as starch comes from starch production estimates The most rigorous evaluation of these estimates is provided by Nelson (1982) for the years 1973 and 1979 His estimates for 1979 are used as the best measure of roots being processed for starch
An1mal feed provides the only other poss1ble end use of cassava Roche s (1983) survey of cassava production systems suggested no feeding of fresh roots to animals Given the lim1ted 1mportance of sw1ne the dom1nance of ruminant animals and their ability to utilize lower cost feedstuffs and cassava s role either as a cash or food crop any on-farm feeding of cassava roots would be expected to be l1m1ted although there are no reports to conf1rm this assessment Incorporation of gaplek into balanced feeds is also thought to be limited given that market channels for gaplek are directed principally to export Unnevehr 1n her study of gaplek market1ng channels ment1ons no movement of gaplek into what is in many respects a very limited feed concentrate industry The assumption w1ll be made then that any use of cassava in animal feed 1s l1mited
Assessing a waste component is problemat1c Given the intensive nature of product1on systems the close integration with markets and because of the very limited incomes the tendency for both farmers and middlemen to be very consc1ous of loss waste on Indonesia would be expected to be lower than in other countries In market1ng channels for fresh roots Unnevehr (1982) reports losses of around 8k The more sign1f1cant losses occur in the storage of gaplek from the ma1n product1on period for consumpt1on 1n the per1od of high r1ce pr1ces Unnevehr reports losses 1n this context of from 10 to 20/ A f1gure of 8r losses is appl1ed to marketed cassava and 15/ to all gaplek for human consumption -- the lower mo1sture and better storage facilities would m1l1tate against such losses in the export trade
Ut1l1zat1on figures are compared to product1on figures in Table 4A 1 For the outer islands there is a reasonable correspondence between product1on and utilization f1gures The slight d1screpancy is probably due
IV - 29 -
to estimates for fresh cassava consumption Applying this difference to fresh human consumption yields an annual per capita consumption estimate of 24 7 kg This is only slightly above the 1978 SUSENAS estimate of 20 2 and well below the 1976 estimate of 34 2 kg
On Java however the production estimate is almost 20% higher than the consumpt1on estima te Unnevehr (! 982) in her estima te of cassava utilization on Java for 1976 found an even larger difference Rache (! 984) suggests a number of problems with the absolute values of the production estimates but cannot deduce any basis for either an upward or downward bias Village level record keeping and crop cutt1ng surveys probably provide one of the more accurate estimates of cassava production in Asia Further disaggregation of supply and util1zation of cassava on Java reveals that the unexplained production occurs essentially in East and Central Java Rache (! 984 Table 2 6) provides some evidence to suggest that yields may be overest1mated in Central Java Moreover Mink (1984) found an overestimation of maize y1elds in official statistics in East and Central Java Attr1buting all the d1.fference to yield overestimation imphes a reduction of yield of 30% from 9 4 to 7 2 t/ha in Central Java and a reduction of 20% from 9 15 to 7 6 t/ha 1n East Java For mal.Ze 1n
1978 M1.nk found an overestimation of yield of 14% in Central Java and 29% in East Java Reduction in y1eld levels are not completely out of the question
On the other hand the other maJar area of uncertainty is the size of household starch production The 1976 and 1978 SUSENAS consumer budget surveys show h1.gh rates of starch consumption 1n rural areas of Central and East Java (Dixon 1984) Lmplying consumption from home or nearby production un1.ts In other areas direct consumpt1on 1s low imply1.ng purchases of krupuk If the higher figure for rural consumption is assumed and 1t is also assumed that this comes solely from household production then household starch product1.on 1s at the minimum underestimated by 40 thousand tons in Central Java and 58 thousand tons in East Java Th1s assumes that no household starch production goes into markets for krupuk production Th1.s would account for one third and one half of the d1.screpancy in Central and East Java if a conversion rate of 6 to 1 were assumed Making this adjustment in starch product1.on results in a discrepancy of about 900 thousand tons Attributing th1s to yield overestimation implies a reduct1.on in average yields on Java from 9 4 to 8 S t/ha a not unrealistic adjustment On the other hand 900 thousand tons represente only a 7% error in the total production est1.mate and could as easily be attributed to underestimates 1.n consumption At this po1.nt the cho1.ce is arbitrary and Table 4A 1 reflects the ad]ustment in yield levels

V MALAYSIA
Cassava vs Tree Crops 1n the Competition for Land
The agricultura! economy of Malaysia like that of Thailand has traditionally been export-oriented Export growth has relied on the fact that Malaysia has always been a land surplus economy and at several points in its history even had to rely on immigration of both Chinese and Ind1ans to meet rising labor demand in agriculture and mining Export orientation within a land surplus economy put a premium on the development of an effective land policy In this aspect Malaysia differed from Tha1land in that the focus of land policy was on promoting large-scale plantation agriculture with a secondary emphasis on the development of smallholder agriculture both for the production of rice and export crops A focus on plantation agriculture has remained a primary component of agricultura! policy to the present
Cassava was the first of the series of export crops that have spread across Malaysian agriculture The establishment of the first tap1oca factory in Malacca in the early 1850 s coincided with the rapidly expanding use of commercial steamships The evolution in sea transport together with the opening of the Suez Canal in 1869 opened European markets to agricultura! commodit1es other than JUSt high valued spices The tap1oca industry expanded rapidly and relied on cassava s particular advantages as a frontier crop The forest was cleared to feed the steam engines of the processing plant while cassava was planted in a shifting cultivat1on system character1stic of a land-surplus labor-scarce economy This production system wh:~.ch ostensibly took place with1n a plantatl.on-type land concession but where the land was abandoned to lalang when so1l fert1lity declined to unprofitable levels gave cassava the image of a soil-depleting crop espec1ally compared to the rap1dly 1ncreas1ng tree crops Although soil depletion was due more to the shifting cult1vation system than to the crop itself th1s image has rema1ned upto the present resulting in controls on cassava expansion through restrict1ons on land concessions and leases The osc1llations in the export market for tapioca and starch land policy and compet1tion with export-oriented tree crops have remained the key factors influencing the Malaysian cassava 1ndustry to the present
Production Trends
Cassava production in Malaysia has never repeated the boom period of 1860-1890 In Malacca cassava area climbed from virtually nothing to around a peak of 30 thousand hectares in 1882 In the 1870 s cassava area had also began to expand 1nto ne1ghboring Negri Sembilan reaching 1ts peak areas 1n the 1890 s (Jackson 1968) Area planted to cassava 1n th1s early period probably did not exceed 45 thousand hectares The cassava industry fluctuated with the prices on the world market through to the turn of the century but then got caught 1n a squeeze between the rap1dly expand1ng rubber industry in Malacca and the development of an export oriented cassava industry on Java These trends were remarkably rapid In 1906 there was 15 thousand hectares planted to rubber 1n the Straits Settlement Provinces (Malacca and Province Wellesley and Penang) versus 43 thousand hectares planted to cassava In the same year Java exported a l1ttle over
V - 2 -
19 thousand tons of cassava products By 1913 rubber area had expanded to 64 thousand hectares in the Straits Settlements and Javanese exports had increased to over 90 thousand tons Cassava area Ln the Straits Settlements declined to only 6 thousand hectares (Greenstreet and Lambourne 1933)
After this maJor structural shift cassava area oscillated between 10 and 20 thousand hectares over the next 70 years till the present (Table S 1) The other maJor element in this stagnation of the cassava Lndustry was the restrictions on land concessLons and actual planting of cassava by many of the states Thus Negri Sembilan prohibited planting of cassava in 1912 Perak restricted plantings in 1909 and Selangor did the same in 192S In Kedah Ln 190S cassava was allowed only as a catch crop for tree crop establishment (Greenstreet and Lambourne 1933) Thus in the period between the two world wars the cassava Lndustry shLfted to Johore where there were no restrictions on cassava and Kedah where it was grown as a catch crop
The shifting nature of the cassava industry contLnued since followLng the Second World War and especially after the 19S8 Emergency cassava rapidly shLfted to Perak which is the locus of the industry today Nevertheless land polLcy continued to play a dominate role in the organization of production In particular Aw-Yong and Mooi (1973) estLmated that Ln the mid-1960 s approxLmately 7S% of the cassava Ln Perak was planted illegally on unalienated state land or forest railway or minLng reserves As a result shifting cultivation remained the dominant production system for cassava
ShiftLng cultivation systems and the uncertainty of access to land for cassava are possibly reflected in recent trends in production (Table S 2) In cassava area there is signLfLcant variation around a relatLvely stable trend of 16 thousand hectares Yields also are hLghly variable rangLng from 11 to 37 t/ha with no necessary tendency for variatLon Lo area to compensate varLation in yield Production as a result is highly variable However this year-to-year variabilLty LS not reflected in the output of cassava products Converting starch and chip production to fresh root equivalent shows a consLstent rise in root utLlLzation through the early seventies and a decline from the 1976 peak over the latter part of the decade (Table S 3) A comparison of the two series suggests much more stabLlity in the utilization series and a consistent underestimation of utilization when using the production serLes Given the large percentage of illegal plantings the production series probably does not capture all the actual area planted to cassava On balance there is probably much more stabilLty underlyLng the Malaysian cassava industry than is reflected in production statistLcs on the other hand over the last half of the decade of the 1970 s there has been a persistent declining trend Ln cassava production
Cassava ProductLon Systems
Cassava s principal comparatLve advantage vis-a-vis other crops is its adaptation to relatLvely margLnal agro-clLmatic condLtions and therefore Lts exploitatLon of land with a low opportunity cost Because there LS no clLmatLc constraLnts on crop production in Malaysia and tree crops are well
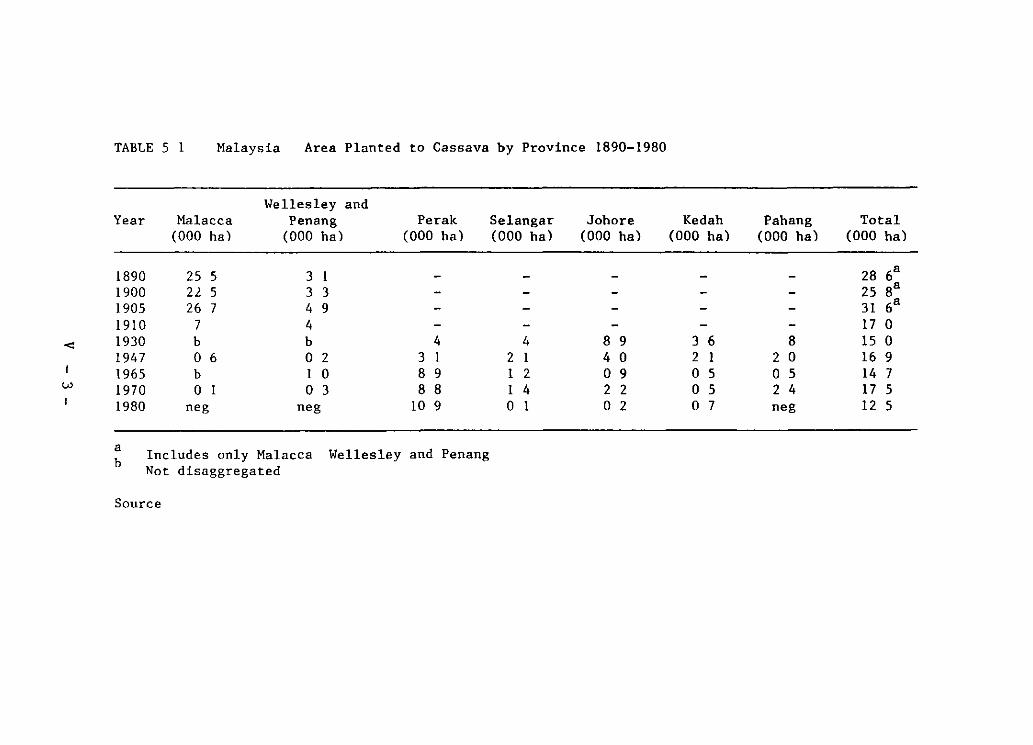
TABLE 5 1 Malaysia Area Planted to Cassava by Province 1890-1980
Wellesley and Year Mala cea Penang Perak Selangar Johore Kedah Pahang Total
(000 ha) (000 ha) (000 ha) (000 ha) (000 ha) (000 ha) (000 ha) (000 ha)
1890 25 5 3 1 - - - - - 28 6a 1900 22 5 3 3 - - - - - 25 8a 1905 26 7 4 9 - - - - - 31 6a 1910 7 4 - - - - - 17 o
< 1930 b b 4 4 8 9 3 6 8 15 o 1947 o 6 o 2 3 1 2 1 4 o 2 1 2 o 16 9 1965 b 1 o 8 9 1 2 o 9 o 5 o 5 14 7
w 1970 o 1 o 3 8 8 1 4 2 2 o 5 2 4 17 5 1 1980 neg neg 10 9 o 1 o 2 o 7 neg 12 5
a Includes only Malacca Wellesley and Penang b Not disaggregated
Source
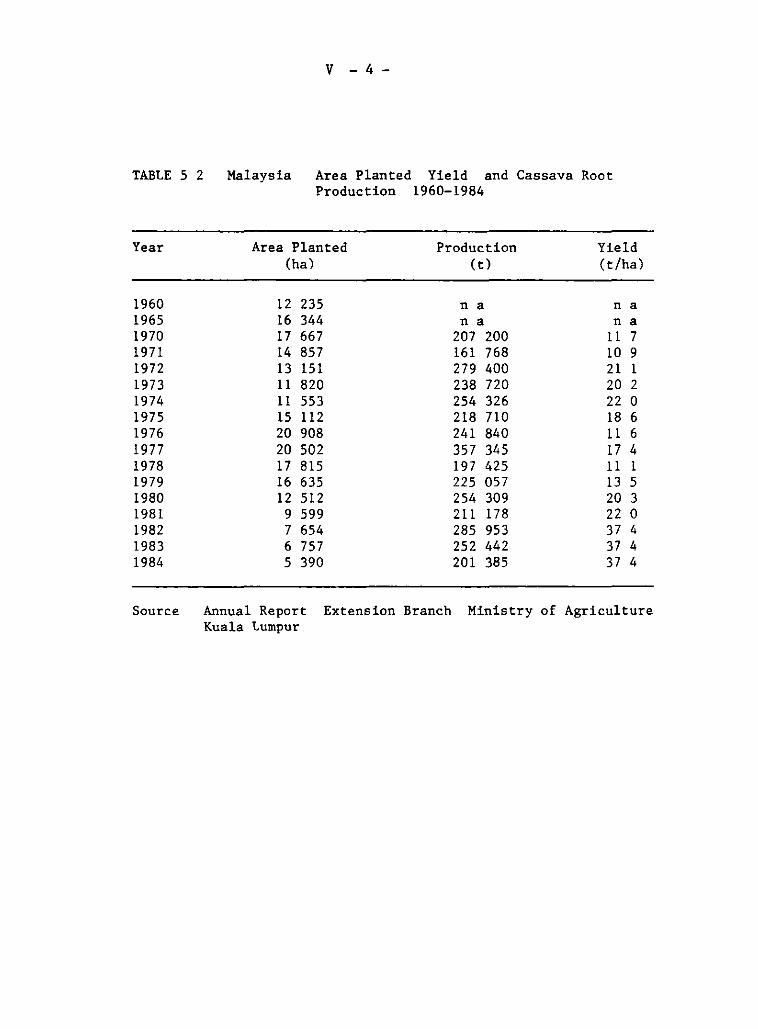
V - 4 -
TABLE S 2 Malaysia Area Planted Yield and Cassava Root Production 1960-1984
Year Area Planted Production Yield (ha) (t) ( t/ha)
1960 12 23S n a n a 196S 16 344 n a na 1970 17 667 207 200 11 7 1971 14 8S7 161 768 10 9 1972 13 1S1 279 400 21 1 1973 11 820 238 720 20 2 1974 11 SS3 2S4 326 22 o 197S 1S 112 218 710 18 6 1976 20 908 241 840 11 6 1977 20 S02 3S7 34S 17 4 1978 17 81S 197 42S 111 1979 16 63S 22S OS7 13 S 1980 12 S12 2S4 309 20 3 1981 9 S99 211 178 22 o 1982 7 6S4 28S 9S3 37 4 1983 6 7S7 2S2 442 37 4 1984 S 390 201 38S 37 4
Source Annual Report Extension Branch Ministry of Agriculture Kuala Lumpur
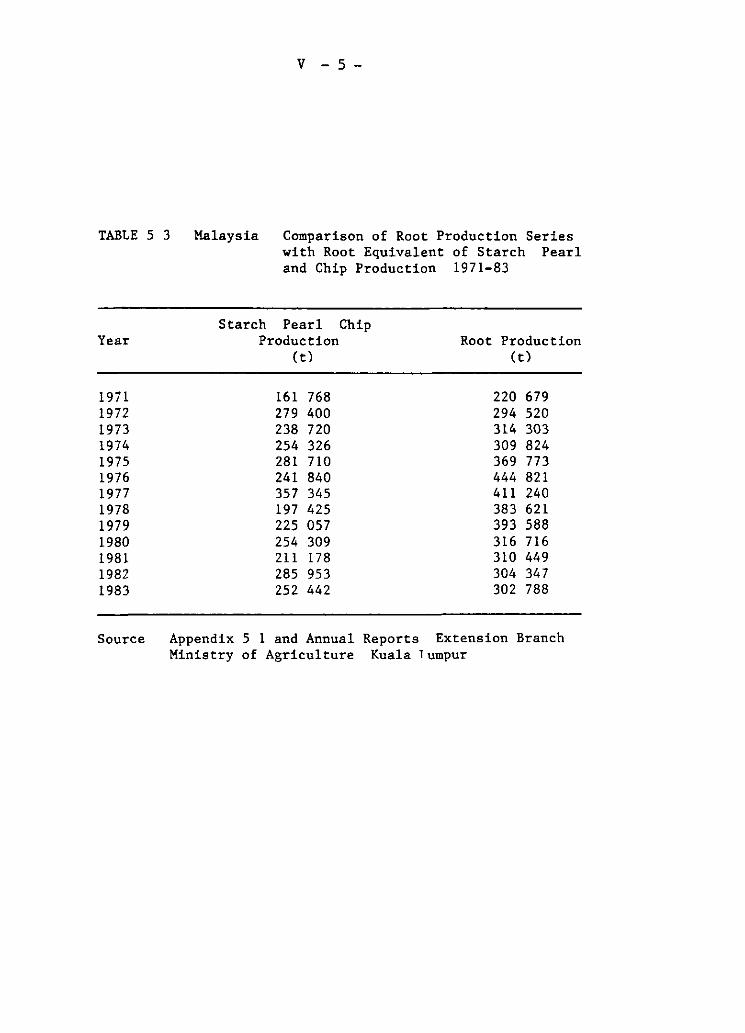
V - S -
TABLE 5 3 Malaysia Comparison of Root Production Series with Root Equivalent of Starch Pearl and Chip Production 1971-83
Year
1971 1972 1973 1974 1975 1976 1977 1978 1979 1980 1981 1982 1983
Starch Pearl Chip Production
(t)
161 768 279 400 238 720 254 326 281 710 241 840 357 345 197 425 225 057 254 309 211 178 285 953 252 442
Root Production (t)
220 679 294 520 314 303 309 824 369 773 444 821 411 240 383 621 393 588 316 716 310 449 304 347 302 788
Source Appendix 5 1 and Annual Reports Extension Branch Ministry of Agriculture Kuala Tumpur
V - 6 -
adapted to a wide spectrum of tropical soils cassava has no particular niche to exploit in the agricultura! economy and must compete with tree crops for land Thus of the 25% of Malaysian land under cultivation well over 80% is planted to the three principal tree crops rubber oil palm and coconut Paddy land accounts for another 10% leaving under 10% for all other crops Tree crops are by far the most profitable agricultura! actJ.vities and in fact cassava is primarily grown in those areas where farmers do not have the option of planting oil palm or rubber Land tenure primarily influences where and the type of production system that cassava is grown under in Malaysia
The more minor area where cassava is cultivated is as a catch crop J.n the establishment of oil palm or rubber Thl.s is done pnncipally by smallholders although some planting of cassava as a catch crop by tree crop estates has also been reported (Lulofs 1970) The cassava is planted for 2 or 3 seasons as a source of income until the tree crop is established However this l.S not a WJ.despread practice and is limited to those areas which have access to cassava processing plants
The major portien of the cassava is grown in monoculture This is J.n part due to the fact that a large portien of the crop J.s planted on land where the grower has no usufruct rights Aw-Yong and Mooi (1973) in a study of cassava productJ.on in Perak J.n the mid 1960 s found that over 70% of cassava area was planted illegally Illegal planting of cassava J.S done on a much more extensive basis than legal cultivatJ.on (Table 5 4) Area planted is often done on a large-scale sometJ.mes exceedJ.ng 50 hectares Where virgin Jungle is cleared all work is done by hand However with the risJ.ng costs of labor areas covered with lalang whJ.ch have the possibJ.lity of mechanized land preparatJ.on are now cultivated more generally than virgin forest This early study reports that most J.llegal cultivatJ.on l.S done withJ.n a system of shifting agriculture where the land is planted two or three tJ.mes to cassava WJ.thout application of fertilJ.zer and then a new area is opened up and brought under production Whether the rising labor costs of openJ.ng new land has caused even illegal planting to shift to a more permanent cultivation system is only open to hypothesis but certainly the J.ncentives are increasingly to shift to more continuous cropping even within an insecure tenure situatJ.on
Legal productJ.on on the other hand is concentrated in the hands of smallholders Area planted in casssava averages less than 2 hectares and cassava is usually only one of severa! crops cultJ.vated Even J.n thJ.s situatJ.on cassava J.s often grown on rented land or on state land wJ.th temporary occupational lJ.cences That is there J.s suffJ.cJ.ent uncertainly J.n tenure not to plant tree crops Also cassava is often a component J.n the initJ.al croppl.ng system in those areas where farmers have recently been settled but have not yet invested J.n tree crops Thus even for the legal planting cassava is only planted in that land where investment J.n tree crops is rJ.sky
Nevertheless production systems are much more stable Rotational systems with other annual crops are often practiced along WJ.th application of fertJ.lJ.zer or manures Over the last couple decades fertJ.lJ.zatJ.on has apparently shJ.fted from farmyard manure and woodash (Aw-Young and Mooi 1973) to reliance on chemical fertilizers (Tunku Mahmud 1979) Moreover with the risJ.ng cost of labor farmers have as well moved to the application
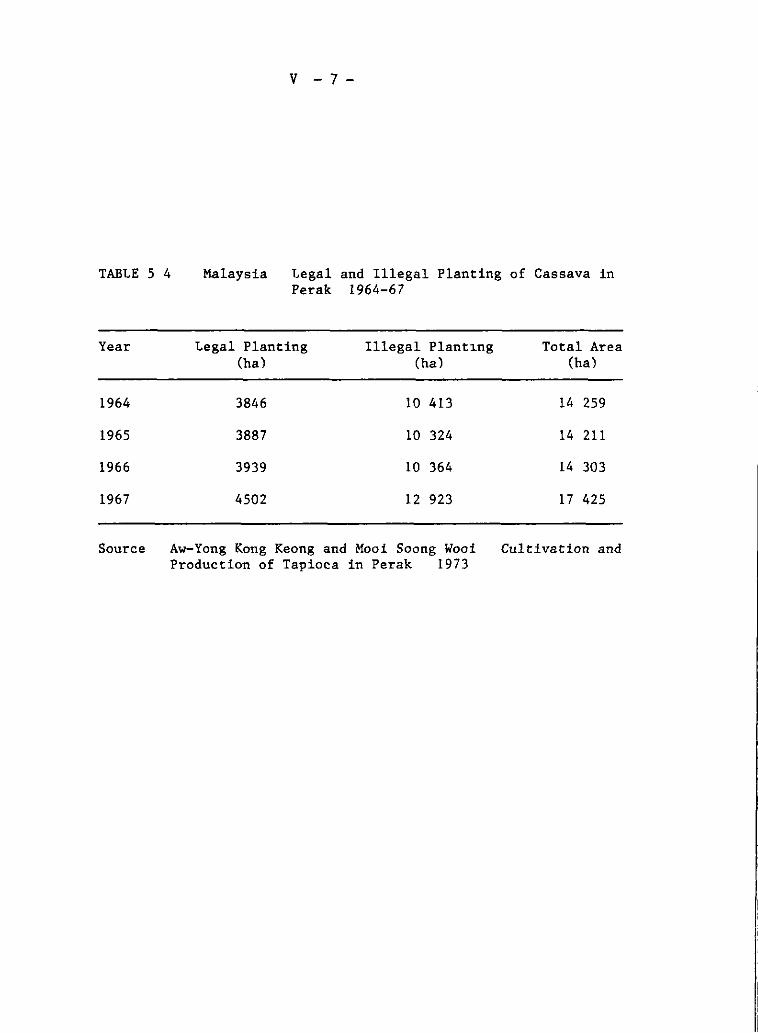
V - 7-
TABLE 5 4 Malaysia Legal and Illegal Planting of Cassava in Perak 1964-67
Year Legal Planting Illegal Plant~ng Total Area (ha) (ha) (ha)
1964 3846 10 413 14 259
1965 3887 10 324 14 211
1966 3939 10 364 14 303
1967 4502 12 923 17 425
Source Aw-Yong Kong Keong and Mooi Soong Wooi Cultivation and Production of Tapioca in Perak 1973
V - 8 -
of herbicides in order to control weeds Rising labor costs and the competition with tree crops for land have put a premium on ach~eving low costs of production per ton Land preparation is often mechanized and in Perak ridiging is widely practiced to control root rot under these high ra~nfall conditions More intensive production methods are now more economic than extensive production methods as the emphasis has sh~fted to lower labor costs and higher yields In effect sh~ft~ng production systems have become increasingly uneconom~c in Malaysia making cassava s reputation for soil impoverishment more of an historical red herring rather than a point in fact
The other maJor production system for cassava is plantations In the early stages of the cassava industry these systems had their impetus in the form of land concess~ons allocated by the state governments However root production operated on a basis of shifting agriculture and it was not till the advent of rubber at the turn of the century that plantations based on permanent production systems were established At this stage production of cassava en a large scale decl~ned However in the post-war period more permanent cassava plantations have been established usually under government sponsorship The motivation for plantations ~s usually to assure regular suppl~es to relatively large-scale starch factories However the operations of large-scale cassava plantations have not met with much success Of four plantations that have been operat~ng in the last decade only one ~s still operating High labor and overhead costs make plantation production much more costly than smallholder product~on
with~n an industry that ~s highly competitive both from other domestic producers and international competit~on from Thailand
Yields
Cassava is grown purely as a commercial crop in Malaysia and moreover must compete w~th tree crops for both land and labor Yields are therefore a primary determinant of cassava s economic v~ability in the country s agricultura! economy Not surpris~ngly average yields in Malays~a are high by world standards or even by comparison te other As~an countries National production statistics suggest an average yield in the range of 11 te 37 t/ha As has been suggested the reliability of these estimates are open to question Nevertheless the few surveys of cassava producers that have been carried out do support the h~gher end of this range of y~eld estimates Tunku Mahmud (1979) found an average y~eld of 28 t/ha ~n the Manong area of Perak Rahman Bint~ Adam (1974) found an average yield of 18 t/ha ~n a survey of farmers in Pahang Chan et al (1983) report average yields of 12-20 t/ha in Perak and 20-3S t/ha in Kedah
The point where these survey areas reside with~n the overall yield d~stribution for the country cannot be specif~ed Aw-Young and Mooi (1973) suggest in Perak a very bread yield variation of from 7 te over 40 t/ha based on differences in so~l and production system where the prodt.ct~on
system as well reflects pr~nc~pally variat~on ~n so~l fertility (Table S S) Chan et al (1983) report that in Perak less effic~ent farmers achieve yields in the 6-10 t/ha range while the better farmers plots y~eld 22 5-37 t/ha occasionally reaching levels as high as 4S-60 t/ha The fact that cassava is not grown ~n continuous production sytems as ~n other parts of Asia contr~buted te the high yields obtainable in Malaysia
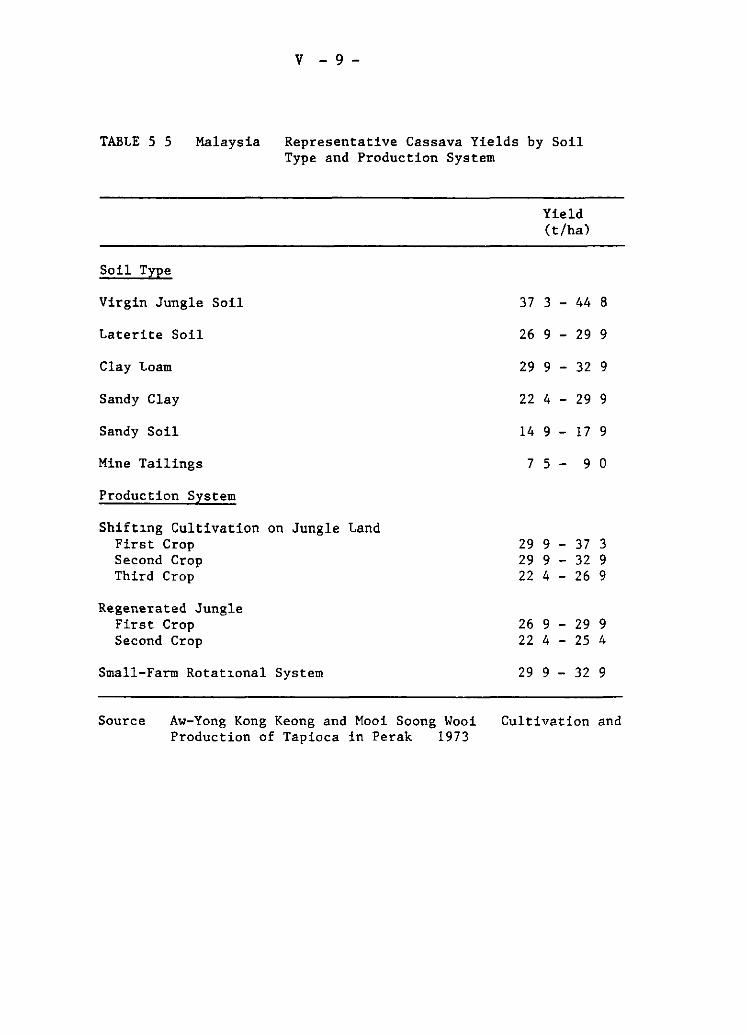
V - 9 -
TABLE 5 5 Malaysia Representative Cassava Yields by Soil Type and Production System
Soil Type
Virgin Jungle Soil
Laterite Soil
Clay Loam
Sandy Clay
Sandy Soil
Mine Tailings
Production System
Shift1ng Cultivation on Jungle Land First Crop Second Crop Third Crop
Regenerated Jungle First Crop Second Crop
Small-Farm Rotat1onal System
Source Aw-Yong Kong Keong and Mooi Soong Wooi Production of Tapioca in Perak 1973
Yield (t/ha)
37 3 - 44 8
26 9 - 29 9
29 9 - 32 9
22 4 - 29 9
14 9 - 17 9
7 5 - 9 o
29 9 - 37 3 29 9 - 32 9 22 4 - 26 9
26 9 - 29 9 22 4 - 25 4
29 9 - 32 9
Cultivation and
V - 10-
Other factors are the favorable rainfall and growing season the existence of relatively high yielding var~eties and the apparently wide use of fertilizer on cassava However defining the gap between average yields and the potential productivity of the crop remains uncertain due to lack of sufficient farm-level data -- see Tan and Chan (1986) for a very good first approximation
Costs of Production and Labor Utilization
Cassava is a highly commercialized crop in Malaysia The crop is fully marketed usually for industrial process~ng Moreover cash costs form a high percentage of total costs because most labor is hired land preparation ~s mechanized and ~nput use is relatively high Cassava farmers are thus responsive to changes in input or output prices and likely to adopt technical innovations Production costs and root prices are therefore principal indicators of economic incentives that cassava producers face
Technology development and the evolution of costs have reflected the relative scarcity of labor in the agricultura! economy Where possible land preparation is mechanized and tractor services are provided by farmers cooperatives Moreover herb~c~des have assumed ~ncreased
importance in cassava cultivat~on in order to reduce labor costs Weed~ng
and harvest~ng are usually done on a contract bas~s With th~s tendency to reduce labor use as much as possible labor input ~s relat~vely low A survey in Perak (Tunku Mahmud 1979) found an average labor use of 62 mandays/hectare (Table S 6) Any further reductions will require the mechanization of the harvest
Labor costs make up JUSt less than half of total production costs for cassava Malays~a prov~des a counter example to the normal tendency for labor to make up the maJor portian of total product~on costs ~n cassava Moreover weed~ng ~s one of the more minor costs items again runn~ng
contrary to normal patterns Land preparation fertil~zer costs and harvest~ng all are usually larger cost l.tems (Table S 7) The tendency toward labor substitution is clear in the cost structure however the scarcity of land forced both by government land pol~cy and by h~gh
opportun~ty costs has also put a premium on y~eld per hectare as ~s
reflected in the high costs for fertilizer
H~gh yields low labor input and moderate input use which is often subs~dized by the farmer cooperatives result in a very low var~able cost of production per ton of roots comparable to that of Thailand However farm-level prices of roots are normally h~gher ~n Halays~a than ~n
Thailand This is princ~pally due to the high opportunity cost of land The annual net ~ncome for rubber was H$36S1 (at a rubber price of H$2 40/kg) and for oil palm was H$S030 (at an oil price of H$1200/ton) (Tunku Hanour and St Clair-George 1979) This compares to an average net income for cassava 1n Perak of H$979 (at a root price of M$74/tons) (Tunku Mahmud 1979) High supply prices for cassava in Malays~a reflect the profitab~l~ty of alternative crops which has provided some ~mpetus to the search for higher yields and lower production costs but is primar~ly
reflected in the utilization of land w~th a relatively low opportunity cost
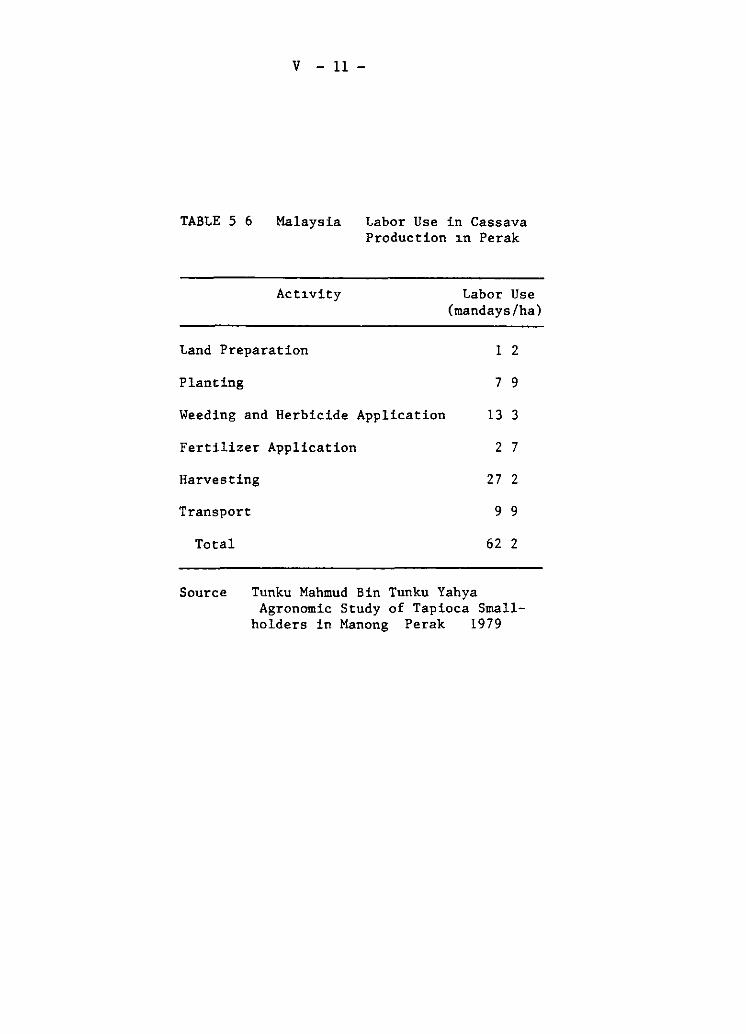
V - 11 -
TABLE S 6 Malaysia
ActLvity
Land Preparation
Planting
Labor Use in Cassava Production Ln Perak
Labor Use (mandays/ha)
1 2
7 9
Weeding and Herbicide Application 13 3
Fertilizer Application 2 7
Harvesting 27 2
Transport
Total
Source
9 9
62 2
Tunku Mahmud Bin Tunku Yahya Agronomic Study of Tapioca Small
holders in Manong Perak 1979
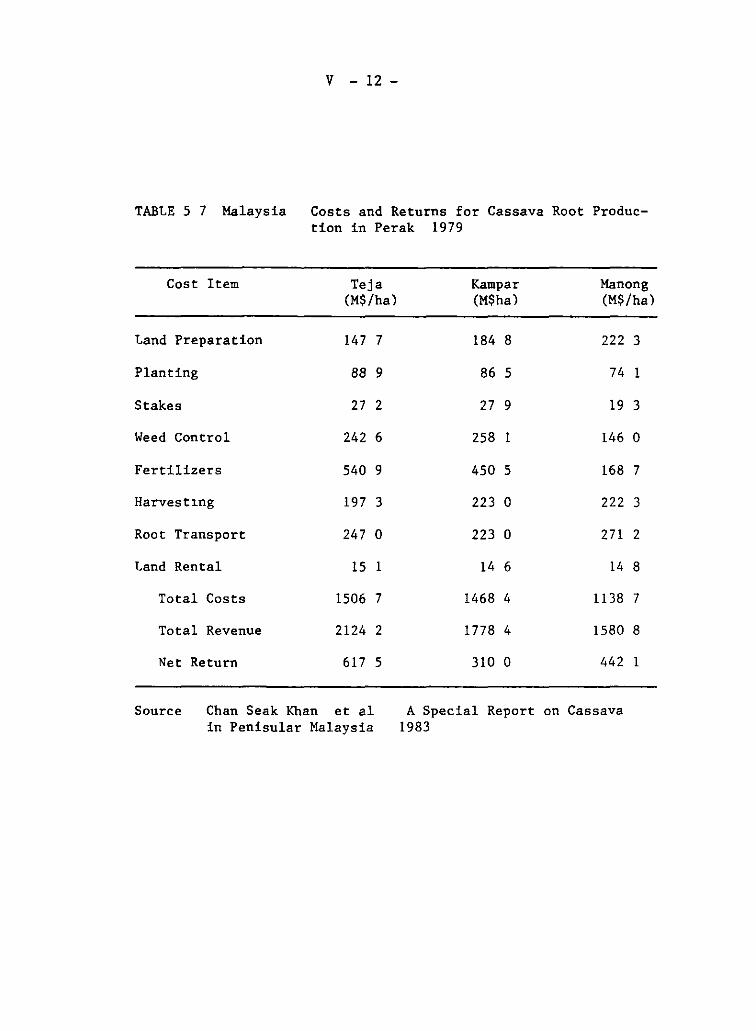
V - 12 -
TABLE 5 7 Malaysia Costs and Returns for Cassava Root Production in Perak 1979
Cost Item Teja Kampar Manong (M$/ha) (M$ha) (M$/ha)
Land Preparation 147 7 184 8 222 3
Planting 88 9 86 S 74 1
Stakes 27 2 27 9 19 3
Weed Control 242 6 258 1 146 o
Fertilizers 540 9 450 5 168 7
Harvest~ng 197 3 223 o 222 3
Root Transport 247 o 223 o 271 2
Land Rental 15 1 14 6 14 8
Total Costs 1506 7 1468 4 1138 7
Total Revenue 2124 2 1778 4 1580 8
Net Return 617 5 310 o 442 1
Source Chan Seak Khan et al A Special Report on Cassava in Penisular Malaysia 1983
V - 13-
Technology Development
Research of a rather sporadic nature has been carried out on cassava since at least the 1920 s The focus of th1s research was principally oriented a to evaluat1on and character1zation of imported clones and to appropriate fertilizat1on of the crop In the 1970 s a cassava research program was established within the Malaysian Agricultura! Research and Development Institute (MARDI) Cassava research broadened in scope at MARDI but continued to maintain traditional lines of emphasis Germplasm evaluat1on was expanded to include a ma]or crossing and selection program The principal breeding obJeCtives were high y1eld and and high starch content of roots reflecting the demands made by the starch and chip markets Agronom1c research continued the long tradition of focusing on plant nutrition and maintenance of soil fertility Long-term fertility trials and evaluation of nutritional requirements of cassava grown on peat soils became principal lines of investigation The few diseases of any potential significance were incorporated 1nto the program as secondary screening obJectives (Tan and Chan 1986)
Little direct impact of th1s research is yet visible on cassava y1elds Fert1lizer and herbicide use by farmers has significantly increased but th1s is due as much to subs1d1es on these inputs as to the research that has been carried out Breeding on the other hand is a longer term investment and while some lines have been identif1ed which give superior yields to the dominant variety Black Twig none of these as yet has been released as a new variety Emphas1s on increas1ng yields 1s a well JUStif1ed strategy under Malaysian cond1tions given the need to achieve higher returns to land A complementary strategy on which there has been some research is to direct technology to low opportunity cost land areas Peat soils have been one area where there has been some research The other area is as a catch crop 1n the establ1shment of tree crops Little research exists on competitive 1nteractions between these two crops in association and the means to minimize them Certainly shade tolerance w1ll be a pr1ncipal issue in such research
Markets and Demand
Cassava has been cultivated pr1mar1ly as an industrial crop since 1ts introduction The crop is grown as a food source by a few of the hill tribes such as the Seroi Semai (Hohnholz 1980) but in general a food market for cassava has not developed in Malaysia Moreover cassava markets have histor1cally been export or1ented as 1nternal demand d1d not prov1de a s1gn1f1cant base on wh1ch to bu1ld a cassava 1ndustry However with Malays1a s recent industrial growth and ris1ng per cap1ta incomes the 1970 s has seen a sh1ft from dependence on export markets to meet1ng rising demand in domestic markets Th1s sh1ft coinc1des w1th a r~cent emphasis in Malays1an agricultura! policy in meeting domest1c requirements in key sectors pr1ncipally r1ce and to a certain extent sugar Nevertheless such a focus on domestic markets must still recognize the dominance of the export tree sector en factor pr1ces 1n the Malays1an agricultura! sector
V - 14 -
The Domestic and Export Market for Starch
Starch has always dom~nated the cassava economy of Malaysia Moreover starch production has traditionally been oriented toward export ~n line with most of the rest of the agricultura! economy Finally the history of the starch industry in Malaysia has been one of constant movement in search of areas where cassava roots could be produced most cheaply i e where competition with tree crops was least or where illegal land use was not rig~dly enforced In the post-war period the starch ~ndustry settled in Perak and the following analysis will focus on starch production in that state
Only two starch factories existed in Perak prior to 1945 By 1968 19 plants were operating in the state with most of the growth coming in the 1950 s when JO factories were set up (Table 5 8) At this point starch production depended primarily on the sedimentation method as only two plants were using centrifuges Production from these latter plants was h~gher than for the sed~entation plants (Table 5 9) even though the centrifuga! plants were only operating at 30~ capac~ty Also the centrifuga! plants obta~ned an extraction rate of between 20 to 23% wh~le the sed~entation plants averaged between 13 to 18% (Onn and Yet 1971) With continuing problems w~th root supply and increas~ng compet~t~on from Thailand it is not surprizing that a shake-out of the industry would occur ~n so competitive an environment Thus by 1982 only eight starch factories were operating in Perak (Table 5 10)
What is clear however is that this shake-out did not occur unt~l the late 1970's Prior to that and contrary to the root production statistics -- the starch industry showed steady growth ~n the post-war per~od Starch exporta increased steadily through the 1950 s and 1960 s and peaked in 1976 (Table 5 11) The shorter series on starch production complementa these export trends and suggests that total starch production also peaked in 1976 at 68 thousand tons Production declined from that level and has been stable at about 50 thousand tons through the 1980 s Exports however declined much more dramatically and Malaysia became a net ~mporter of starch in 1981 (Table 5 12) Two factors were responsible for this reversal rapidly increas~ng domestic consumption and increased price compet~tion from Thailand
Domestic starch consumpt~on in Malaysia increased very rap~dly during the 1970 s rising from less than 20 thousand tons in 1971 -- Onn and Yet (1971) estimate domestic consumption at 16 3 thousand tons ~n 1967 -- to about 50 thousand tons by the end of the decade Major users of cassava starch are monosodium glutamate and glucose producers and the textile industry As industrialization proceeds ~n Malaysia starch demand ~s
certain to continue to ~ncrease Particularly any future developments in either the plywood or paper industry should lead to s~gnficant increases in consumpt1on
A market w~th significant potential ~s the sweetner market This market ~as expanded rapidly ~n Japan and Taiwan while Indonesia is currently starting a sweetner industry Malaysia imports about 85% of ~ts consumption requirements of sugar even though domestic sugar prices are maintained at levels well above world market prices in arder to cover
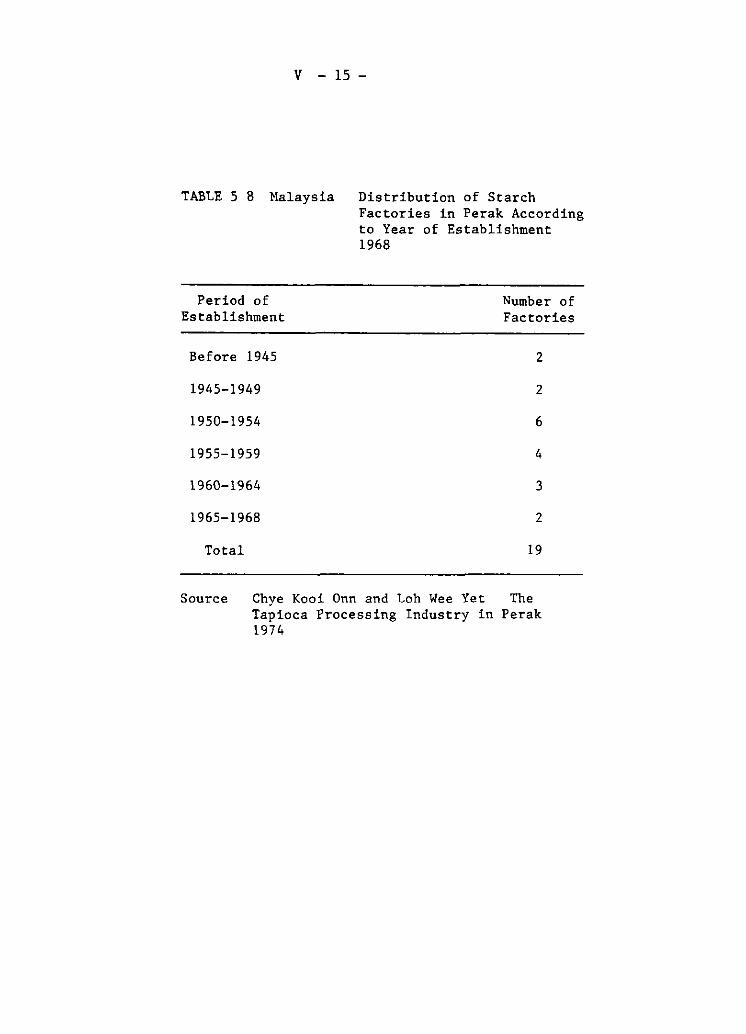
V - 15 -
TABLE S 8 Malaysia Distribution of Starch Factories in Perak According to Year of Establishment 1968
Period of Number of Establishment Factories
Befare 1945 2
1945-1949 2
1950-1954 6
1955-1959 4
1960-1964 3
1965-1968 2
Total 19
Source Chye Kooi Onn and Loh Wee Yet The Tapioca Processing Industry in Perak 1974
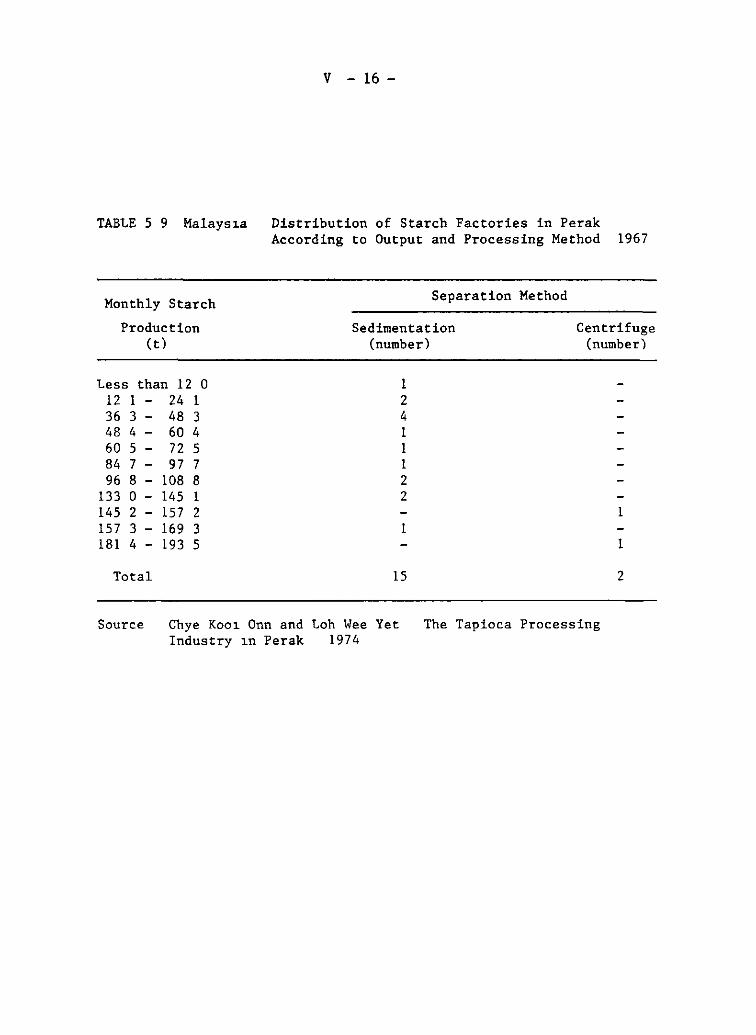
TAB~E 5 9 Malays1a
Monthly Starch
Production (t)
~ess than 12 O 12 1 - 24 1 36 3 - 48 3 48 4 - 60 4 60 5 - 72 5 84 7 - 97 7 96 8 - 108 8
133 o - 145 1 145 2 - 157 2 157 3 - 169 3 181 4 - 193 5
Total
V - 16 -
Distribution of Starch Factories in Perak According to Output and Processing Method 1967
Separation Method
Sedimentation Centrifuge (number) (number)
1 2 4 1 1 1 2 2
1 1
1
15 2
Source Chye Koo1 Onn and Loh Wee Yet Industry 1n Perak 1974
The Tapioca Processing
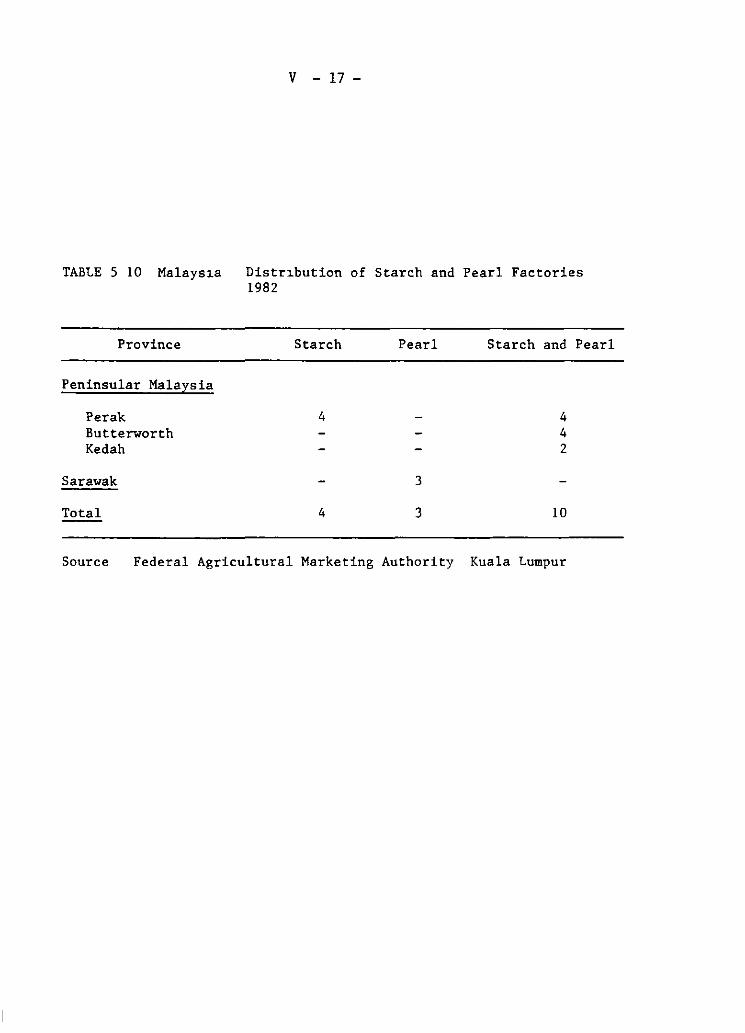
TABLE S 10 Malays~a
Provine e
Peninsular Malaysia
Pera k Butterworth Kedah
Sarawak
Total ---
V - 17 -
Distr~bution of Starch and Pearl Factories 1982
Starch Pearl Starch and Pearl
4 4 4 2
3
4 3 10
Source Federal Agricultura! Marketing Authority Kuala Lumpur
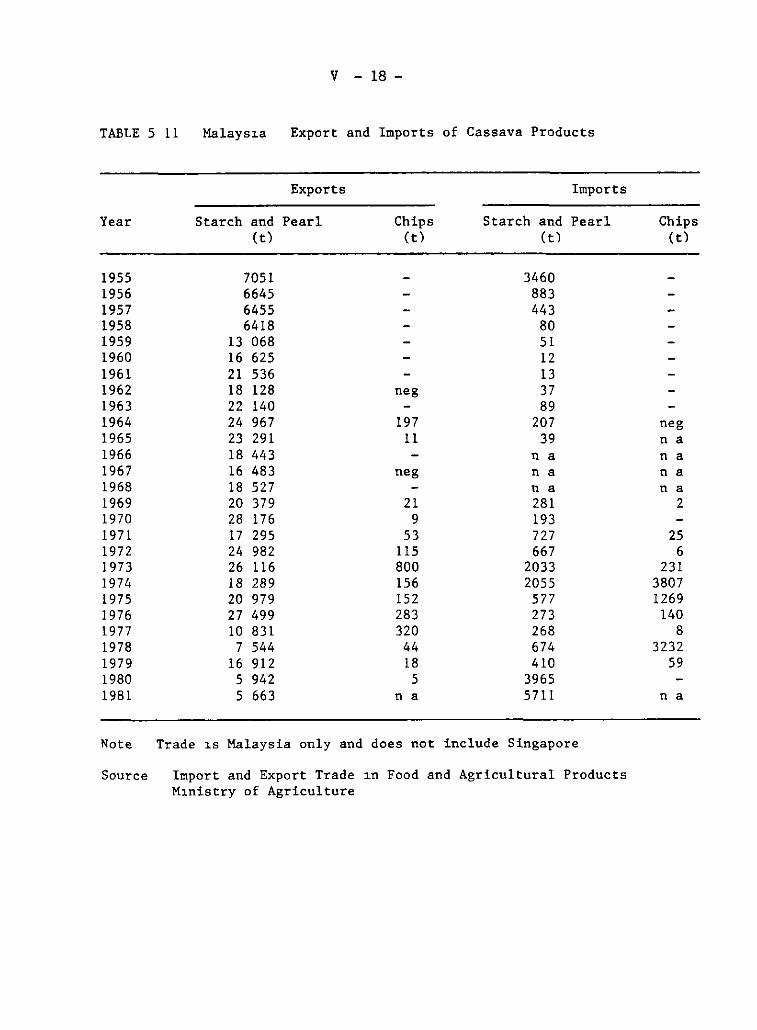
V - 18-
TABLE 5 11 Malays~a Export and Imports of Cassava Products
Exports Imports
Year Starch and Pearl Chips Starch and Pearl Chips (t) (t) (t) (t)
1955 7051 3460 1956 6645 883 1957 6455 443 1958 6418 80 1959 13 068 51 1960 16 625 12 1961 21 536 13 1962 18 128 neg 37 1963 22 140 89 1964 24 967 197 207 neg 1965 23 291 11 39 n a 1966 18 443 n a n a 1967 16 483 neg n a n a 1968 18 527 n a n a 1969 20 379 21 281 2 1970 28 176 9 193 1971 17 295 53 727 25 1972 24 982 115 667 6 1973 26 116 800 2033 231 1974 18 289 156 2055 3807 1975 20 979 152 577 1269 1976 27 499 283 273 140 1977 10 831 320 268 8 1978 7 544 44 674 3232 1979 16 912 18 410 59 1980 5 942 5 3965 1981 5 663 n a 5711 na
Note Trade ~s Malaysia only and does not include Singapore
Source Import and Export Trade ~n Food and Agricultural Products M~nistry of Agriculture
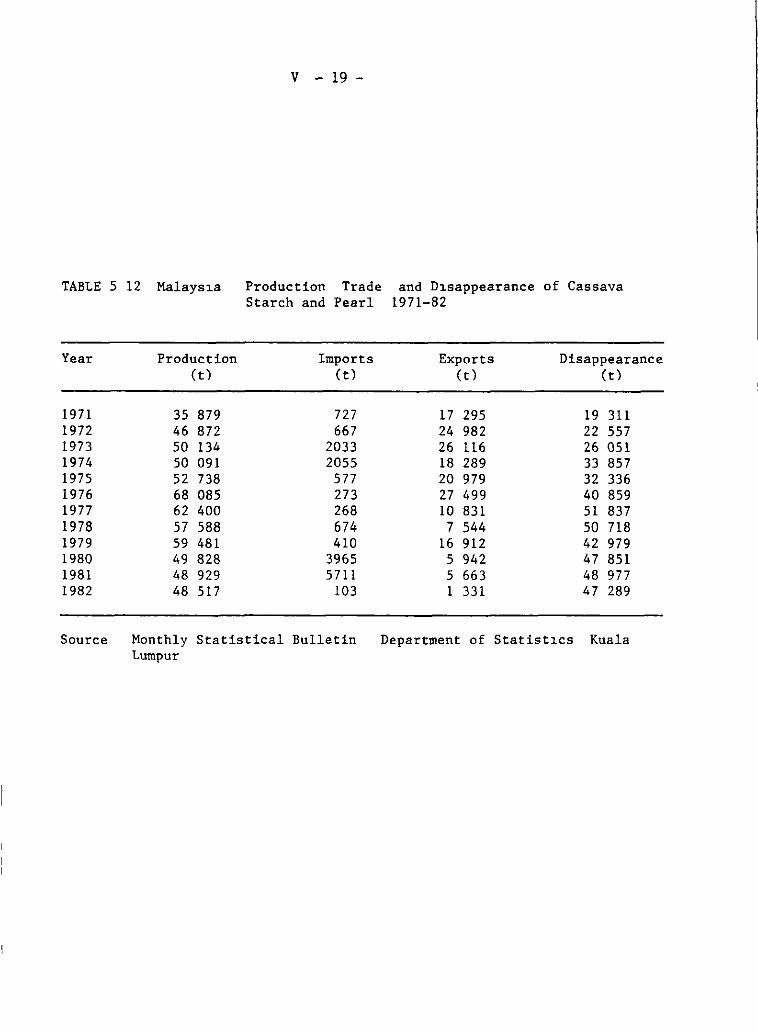
V - 19 -
TABLE S 12 Malays1a Production Trade and D1sappearance of Cassava Starch and Pearl 1971-82
Year Production Imports Exports Disappearance (t) (t) (t) (t)
1971 35 879 727 17 295 19 311 1972 46 872 667 24 982 22 557 1973 so 134 2033 26 116 26 051 1974 so 091 2055 18 289 33 857 1975 52 738 577 20 979 32 336 1976 68 085 273 27 499 40 859 1977 62 400 268 10 831 51 837 1978 57 588 674 7 544 so 718 1979 59 481 410 16 912 42 979 1980 49 828 3965 S 942 47 851 1981 48 929 5711 5 663 48 977 1982 48 517 103 1 331 47 289
Source Monthly Statistical Bulletin Department of Statist1cs Kuala Lumpur
V - 20 -
Malaysian costs of production Sugar imports of S61 thousand tons 1n 1984 and a protected domestic sugar market offer scope for the development of a high fructuose sweetner industry based on cassava starch Moreover development of th1s industry requires relatively moderate investment s1nce present starch processing factories can form the basis for an integrated starch-sweetner operation However domestic starch production is the l1miting factor 1n the development of this 1ndustry
The other factor influenc1ng recent production and export trends is mcreasing price competition from Thailand This price competition is amply portrayed in Figure S 1 Before 1976 wholesale starch pr1ces in Ipoh Perak were well below Thai wholesale prices This coincided with the per1od of expanding starch production in Malaysia From 1976 to 1981 Malaysia starch pr1ces in Perak were more or less on a par w1th Bangkok wholesale prices During th1s period Malaysia lost export markets even though pr1ces in general were rising In 1981 Malaysian starch became more expensive than Thai starch and }!alaysia become a net importer of starch The situation was compounded by a falling price level Thus after two decades of growth the Malaysia starch industry stagnated caught between the high supply price for roots and the prices of 1mported Thai starch For Malaysia to rema1n competitive in starch would require further cost reductions in the product1on of cassava roots
The Domestic Animal Feed Market
The development of the Malaysian livestock industry is typical of that of Japan Taiwan and South Korea in that to meet rising meat demand Malaysia has developed an intensive pork and poultry industry based on balanced feed rations these feed components in turn are essentially imported In Malaysia s case the reason for 1mport dependence rests with the export or1entation of its agricultura! sector and 1ts comparat1ve advantage 1n tree crops The agr1cultural economy cont1nues to respond princ1pally to international rather than domestic markets and coarse gra1ns are virtually not produced Thus Malaysia has met its grow1ng demand for feed components through rapidly rising 1mports of ma1ze
Malaysia s animal industry never rel1ed on a large production capacity at the village level essent1ally because there were limited grains or grain by-products available to sustain a large v1llage-level an1mal population Sw1ne product;1on for example was usually associated with larger scale units linked to the by products of process1ng plants such as cassava starch plants The swine industry was thus the first to develop dependent only on the domestic Chinese market The princ1pal growth occurred dur1ng the 1960 s as the industry sw1tched to low-fat 1mported breeds and there was a sign1f1cant 1ncrease of scale in production units (Hertrampf 198S) The maJor growth 1n the poultry 1ndustry on the other hand occurred in the 1970 s with the rise of 1ntensive large-scale production systems Although the domest1cation of the chicken occurred 1n Halaysia not unt1l che 1970 s did poultry start to become an important component in the d1et
The development of the l1vestock-feed sector over the last decade and a half (Table S 13) demonstrates the dom1nance that the poultry sector can ach1eve even where the sw1ne sector has already undergone signif1cant techn1cal change Part of this difference 1n growth 1s due to the larger
F
l¡~f; T--~-~
~ ~ r(J•..~f ::· '=' n -t-r.ces r-¡
V - 21 -
J ii _,.., ~UT:.il-'
e..::..-.-1 - ...il
... '::3
_cr e: <J +1- F • '171 1
CT -- J• - L l
-~e: --- ... , 40:1 ~---------------------------------------------
:::¡ - r·,-· ._ __
-.C'---- ---UU
"1=¡-¡_ -
1 1
--1
1 1 .... i 1
-- -,- ,..,.. ...
t--
V -22 -
market for poultry in Malaysia s1nce pork consumpt1on is restricted exclus1vely to the Chinese population The other factor however is the larger efficiency ga1ns possible with poultry especially for the pr1ncipal cost component feed These eff1c1ency gains are further reflected in the location of the poultry and feed ration industry The poultry industry is are imported These two coincide in Kuala Lumpur Malacca and Penang where both the feed and poultry 1ndustries are concentrated Transport assembly and distribution costs are kept to a minimum
The growth in production of balanced feeds over the period 1970-83 has been at a rate of 7 9% per annuam which is somewhat below the 10 4% growth rate in feedgrain imports In fact feedgrain imports are larger than industrial feed product1on due to the growth in feed mixing by the an1mal product1on units More than half of feed product1on is 1n independently mixed in swine and poultry units Malaysia is already the largest feedgra1n importer in tropical Southeast Asia and with trends in livestock production likely to continue through the end of the decade feedgrain 1mport levels will continue to increase relying on maize imports from Thaüand
Cassava has been used in the animal feed industry since the mid-1960 s but 1ts role has always been minar Use of cassava ch1ps in an1mal feeds reached a peak of 23 thousand tons in the m1d-1970 s but has s1nce declined from that point (Table S 14) Although the market for feedstufs has witnessed tremendous growth the cassava chip industry has failed to respond The reason for this was the price squeeze between the price of roots which was determ1ned principally by the starch market and the output pr1ce determined by the pr1ce of maize As shown 1n Figure S 2 the price of chips var1ed s1gnificantly in relation to the maize price from as low as 43% of the maize price in 1972 to as high as 86% in 1984 As impl1ed by these stat1stics cassava ch1ps because less and less competit1ve 1n feed rat1ons over th1s per1od
Cassava enters into least cost broiler rations -- the most ex1gent for cassava -- at about 68% of the ma1ze pr1ce Through most of the 1970 s cassava was competitive with maize 1n poultry rations Cassava use 1n animal feeds made two big jumps 1n 1972 and 197S at penods when the cassava-maize price ratio was low Cassava sold at significant d1scounts to the ma1ze price in these two periods in arder to mot1vate 1nitial use -some ad]ustments 1n equipment are usually necessary to effectively utilize cassava in feed plants Cassava feed use stab1l1zed from 1976 through 1979 as the cassava pr1ce rema1ned at about 6S7 of the maize pr1ce The year 1980 witnessed the sharp rise in starch prices and a resultant rise 1n root pr1ces Even though cassava ch1p pr1ces remained more or less in line with ma1ze prices due to increases as well in the ma1ze price chip production fell due to a lack of cassava roots and compet1tion w1th the starch industry In 1983 the ma1ze remained constant chip prices 1ncreased and the soybean meal price rose due to the initiat1on of tar1ff and import l1censing to protect a nascent soybean crushing industry (U S D A 1986) Cassava chip prices became uncompetitive and production levels reverted to pre-1972 levels The cassava chip industry much like the starch industry was caught between a relat1vely h1gh supply pr1ce for roots and 1ncreasing pr1ce compet1t1on from 1mports as the 1nternat1onal maize price fell 1n the mid-1980 s
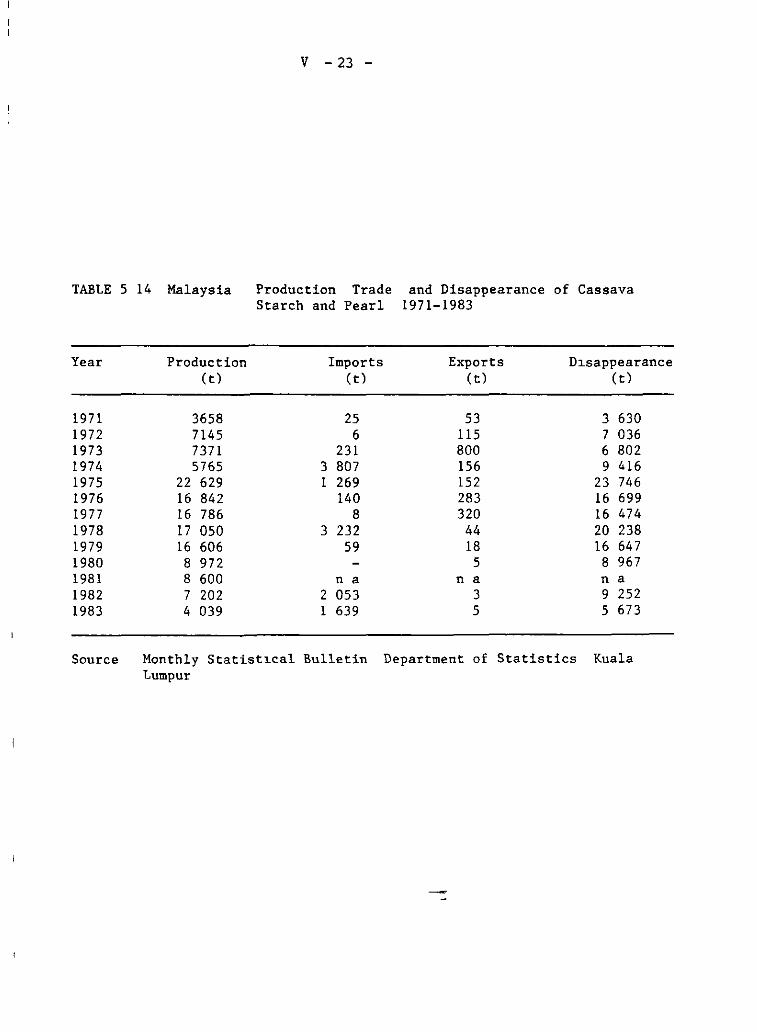
V -23 -
TABLE S 14 Malaysia Production Trade and Disappearance of Cassava Starch and Pearl 1971-1983
Year Production Imports Exports D1sappearance (t) (t) (t) (t)
1971 3658 25 53 3 630 1972 7145 6 115 7 036 1973 7371 231 800 6 802 1974 5765 3 807 156 9 416 1975 22 629 1 269 152 23 746 1976 16 842 140 283 16 699 1977 16 786 8 320 16 474 1978 17 oso 3 232 44 20 238 1979 16 606 59 18 16 647 1980 8972 S 8 967 1981 8 600 n a n a n a 1982 7 202 2 053 3 9 252 1983 4 039 1 639 S S 673
Source Monthly Statist1cal Bulletin Department of Statistics Kuala Lumpur
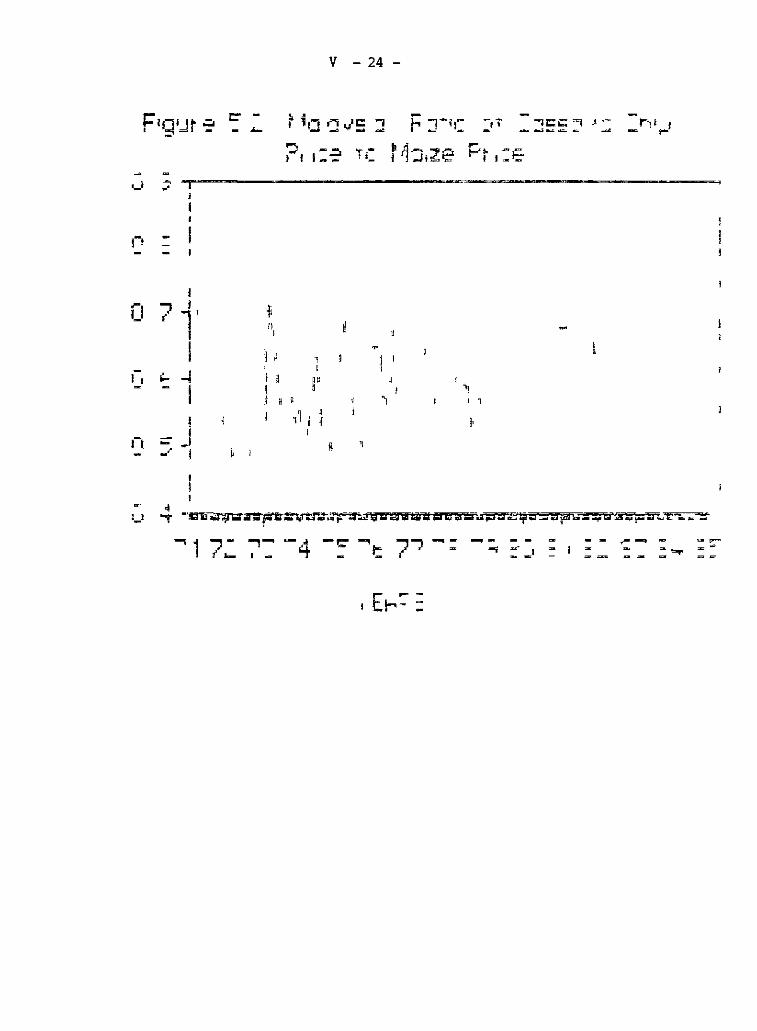
V - 24 -
- - ,-,, 1 - ,.. -- ..... '=' -.::. T ,-_ 1 1 1--
~-·
1 .-1 7 i' f¡ 1_
fl 1 1
1 l J ~
1 l 1
....¡ \ 1 1
1' .:... ~·
1
1 11 1 ~ ¡l ' ' 'i 1 1
l , 1 ~
n - J ~ _.. l ~ 1
,_,
- ¡ -.., 1 -,- ..,~ -4 ( .._ t - -'= """t 7"' --
E --1 ¡-.-:
V - 25-
Pricing and Market Efficiency
The Malaysian agricultura! economy is driven by international commodity markets and the small cassava sector is no different Over the post-war period the Thai export pr~ce for starch has been the dominant influence on domes tic cassava prices (Figure S 1) since starch was the
concentrated around the maJ or population centers and the feed industry around the principal ports since the maJar portien of the feed components principal market and upto 1980 Malaysia was a net starch exporter What ~s
of interest here is the influence of this market structure on format~on of root and chip pr~ces
The hypothesis is that starch prices -- set ~n the ~nternational
market upto 1980 and ~n domestic markets after that point -- set within a competitive market environment will together with processing costs and conversion rates determine root prices Thus regressing starch prices in Peray on root prices in Perak yields the equation
Root = 1 406 + O 1448 Starch (O 189) ( 0043)
= 9049
The intercept term (in Malaysian Dollars per lOO kg) should measure the normal profits and process~ng costs and in this spec~f~cation should be negative (see Chapter VII) The pr~ce transmission equation thus reflects low convers~on rates (6 9 to 1) and resultant operating los ses Th~s conversion rate is well below the 17 - 18 estimate for sed~mentation
plants and 20 - 23 for centrifuga! plants given by industry sources This difference in conversion rates would compensate for the losses in the operat~ng marg~n Thus the price transm~ssion equat~on captures the nature of the price formation process but does not exactly distinguish the real values of the parameters ~n the profit equation
Price formation in the ch~p market however is much better defined The hypothesis ~n this case l.n that the chip industry must take the root pr1ce as given In thl.S case the estimated equation l.S as follows
Chips = 4 28 + 2 34 Roots (O 47) (O 06)
926
The equation reflects a technically very effic1ent convers1on rate -in line Wl.th the h1gh dry matter content of Black Twig -- and a competit1ve operatl.ng margin (US$17 per ton of chl.ps) Chip producers thus face a h1ghly competl.tive market Sl.tuatl.on caught as they are between the starch market and the maize market It is not surprl.zl.ng then that chip productl.On has not expanded g1ven both the low average profitabl.ll.ty and the uncertal.nty 1n the sl.ze of the operat1ng margin In fact many chip plants are an extension of a starch operatl.on where the starch operators will move l.nto chl.p productl.on when marg1ns are adequate
The l.ssue currently fac1ng the Malaysian cassava industry is the 1mpact of the shift to the domestl.c market as the pr1ncipal determl.nate of cassava pr1ces However this sh1ft does not represent a break w1th the
V -26 -
international market but a widening of the band with Thai export prices as Malaysia shLfts to being a net importer Thus in 1984 Malaysia imported 10 5 thousand tons of starch from ThaLland and in 1985 5 1 thousand tons (Thai Tapwca Trade AssocLation 1985) In the 1980's it wül be the starch import prLce that will be the prLncLpal determinant of prLce formation in the Malaysian cassava sector
V - 27 -
Conclusions
Malays~a much like Tha~land has based its post-war agricultural economy on exports and yet ~n the 1980 s finds domestic markets for agricultural products reach~ng significant size due to rising incomes ~ndustrialization and urbanization Three export crops palm oil rubber and coconut make up 85% of cult~vated area moreover Malaysia ~s by far the largest exporter of both rubber and palm o~l and thus has a s~gnificant impact on world price levels An interesting policy question for Malaysia ~s the extent to which growth in the agricultural sector w~ll continue to be based on a few export corps in which the country has a comparative advantage or whether attention should be turned to meeting rising domest~c demand for a diversity of agr~cultural products
Malaysu has much more flexibility in its agricultural policy than other Asian countries Export markets are well developed The population pressure on land does not exist since only 25k of the country s land area ~s cult~vated Moreover transport infrastructure ~s relatively well developed Therefore it ~s somewhat ~ronJ.cal that in an agricultural economy where labor is the l~miting constraint that an estimated 46% (in 1980) of the agr~cultural population falls below the official absolute poverty l~ne Most of these agricultural households exist in the smallholder rubber and rice sectors Policy has been directed to resolving th~s poverty problem -- the inc~dence of poverty fell from 687 in 1970 to 46/ in 1980 -- through two principal avenues through resettlement schemes in large land development pro] ects and through production subs~dies -fertilizer credit agricultural chemicals -- through farmer cooperatives Both avenues however focus on increased production of export crops -- and in certain cases r~ce -- as the means of generating ~ncreased incomes
Although Malaysia has been very successful with ~ts export strategy th~s success now br~ngs certain uncertaint~es because of its dom~nant
market share Malaysia accounts for 44% of the world s rubber exports and two-thirds of palm oil exporta Palm o~l ~s qu~te subst~tutable with other vegetable oils but palm oil is now the maJor oil that moves in world trade and Malays~an palm o~l makes up over 20k of the world vegetable oil market Future expansiona in production and exports must thus consider the ~mpact
of world pr~ces and demand In this Malaysia has adopted a two prong strategy diversification and ~ncreased productiv~ty in exist~ng crops D~vers~f~cat~on has continued to focus on tree crops particularly cocea and to a certa~n extent bananas and coconut However all of these are crops where there are a large number of competing exporters
Malays~a s Nat~onal Agr~cultural Pol~cy Through the Year 2000 focuses on enchanc~ng ~ts comparative advantage in tree crop exports through ~ncreased productivity w~th a part~cular focus on mechan~zation Malays~a s strategy is thus to capture a larger market share in princ~pal exports Malaysia is a~ded in th~s by ~ts proxim~ty to the growing markets of Asia For example Malays~a has a transport advantage to the two largest vegetable o~l ~mporters India and Pah.~stan Thus expansion ~n
production area w~ll be based on export crops but with an emphas~s on labor and land product~vity Land allocation pol~C) w~ll cont~nue to play a dom~nant role ~n the rate of expans~on ~n product~on and as ~n the past will provide the government wJ.th some control over regulat~ng future growth in export suppl~es
V - 28 -
The mark of this policy committment to export crops is the dropping of the long-held goal of self-sufficiency in r~ce ~n the National Agr~cultural Plan Moreover planting crops for animal feed are discouraged in the plan Malaysia will thus rely on importa to serv~ce growing domest~c
markets It is symptomatic of cassava s future in Malaysia that it has turned from an export crop to supplying only domestic markets and in do~ng so has lost its ability to compete in ~nternat~onal cassava markets Given Malaysia 1 s agricultura! policy this fact would seem to sea! the fa te of cassava in the future of the country s agricultura! sector
However the mere fact that a profitable cassava industry has operated in Malaysia throughout this century is some testimony to cassava s inherent productl.vHy since cassava had to compete not with grain crops but w~th much more productive tree crops Cassava was disadvantaged by the production structure which favored centrally processed tree crops Cassava product~on is not well suited to plantation systems and yet smallholder cassava systems could not compete with smallholder tree crop production Cassava could have potent~ally competed w~thin a sem~-mechan~zed
medium-scale (20 hectares) product~on system along the lines of that exist~ng in Thailand Th~s type of production scale seems to dominate ~n
the ~llega! plant~ngs ~n Perak Cassava was thus relegated to a particular n~che in th~s land surplus agricultura! economy formed by pockets of smallholders with constraints on access to land The growing urban sector -- two-thirds of the growth of the rural labor force ~n the 1970 s was absorbed in the urban sector -- and the continued expansion of land development proj ects should cont~nue ~n the future to reduce this n1.che In the end the future of cassava ~n Malays~a will depend on the international market for palm o~l and rubber and ~n th~s Malaysia s agricultura! policies insure that the country w~ll be a dominant player in these markets to the end of the century
V -29 -
Append:Lx S 1 A synthesis of production and utilizat1on
Collection of accurate production statistics for cassava in Malaysia is hampered by the illegal nature of a sign1ficant percentage of the area planted to the crop In consequence a suspected downward bias exists in estimates of area and product1on However since bas1cally all the crop is sold for processing and data are collected on production of cassava starch and chips an alternat1ve production series can he constructed (Table SA 1) The utilization series in fact is cons1stently higher than the root production series Since the downward bias in the product1on series can be 1dent1fied there is suff1c1ent reason to suggest that the utilization series gives a much more accurate picture of cassava production trends in Malaysia
The two series offer quite contrasting views of trends in cassava production The ser1es developed by the extens1on department shows little trend and very substant1al variability On the other hand the ut1lization ser1es displays a steady 1ncrease 1n the first half of the 1970 s to a peak of almost 450 thousand tons of roots in 1976 Production then declined to about 300 thousand tons in 1980 where it has remained through 1983 The latter ser1es expla1ns very well trends in exports and pr1ces The ut1lization series is therefore considered as the best est1mate of cassava production 1n Malaysia

VI PHILIPPINES
Inertia in Market Development
Like Indonesia the Ph~lippines is a mult~-island economy yet unlike Indonesia the Philippines has maJor populat~on concentrations on all the maJor islands although Luzon still figures as the economic center The agricultura! economy is dom~nated by two grains rice and maize and two principal export crops coconut and sugarcane Grain and food product~on in general are concentrated in the small farm sector while the export crops tend to be dominated by plantation systems although smallholder production of copra is also important The Philippines has an apparent comparative advantage in the product~on of copra and is by far the dominant exporter of th~s product This agricultura! structure has created something of a dual approach to policy The export crops have attracted increasing government involvement since the early 1970 s part~cularly as a source of tax revenue and as a means of controlling consumer prices at least for sugar and vegetable o~l Moreover the government has attempted to stimulate the coconut industry to develop its own crushing capacity often with s~gnificant protection The government has generally reduced incent~ves to the export sector
In the food sector on the other hand incentives have in general been pos~t~ve Three themes run through agricultura! policy for grains a commitment to self-sufficiency in grain product~on apart from wheat very heavy intervention in setting domestic prices and commitment to increasing productiv~ty in the smallholder sector The achievement of self-sufficiency is seen as being dependent on price policy and small farm programa Control over domestic pr~ces is in the hands of the Nat~onal Food Author~ty (NFA) wh~ch has authority to control ~mports and exporta to huy in the domest~c market and to set both support prices and ce~ling pr~ces Trade ~n foodgrains and domestic prices as a result are to a large extent administratively determ~ned Policy toward the small farm sector on the other hand has included land reform investment in ~rrigation
infrastructure and special~zed credit and extension schemes
The stage was thus appropriately set for the advent of the h~gh
yielding rice varieties Under the Masagana 99 Program the Philippines went from a consistent net importer to a net exporter of rice ~n the m~d-1970 s This success has led to the recent development of the Maisan 99 Program wh~ch hopes to ach~eve self-sufficiency in ma~ze in three years Concern also runs to the large and growing wheat imports and ident~fy~ng means of either controlling such imports or subst~tut~ng for wheat flour
Cassava fits well ~nto th~s policy conteAt The crop ~s essent~ally
grown by smallholders although some plantation production does ex~st
Moreover cassava can be a domestically-produced subst1tute for imported grains This concern for self-suff~ciency has even extended to tne development of a national alcohol program based on sugarcane and cassava however with the recent fall in world oil pr~ces the program has been scrapped Nevertheless cassava ~s sean as a crop that can contr~bute to meeting the ~ncreas~ng demand for carbohydrate sources s~nce cassava ~s
only a very m~nor crop ~n the Ph~l~pp1nes and since the crop has received
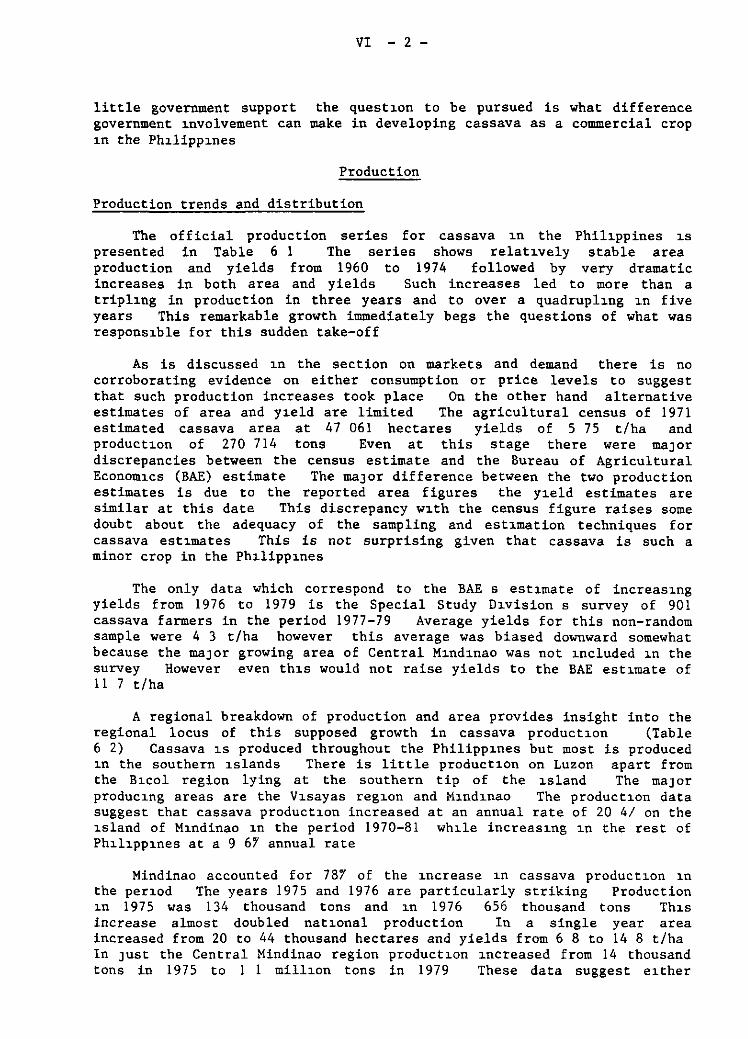
VI - 2 -
little government support the questJ.on te be pursued is what difference government J.nvolvement can make in developing cassava as a commercial crop J.n the PhJ.lippl.nes
Production
Production trends and distribution
The official production series for cassava J.n the Phill.ppines J.s presented in Table 6 1 The series shows relatJ.vely stable area production and yields from 1960 te 1974 followed by very dramatic increases in both area and yields Such increases led te more than a triplJ.ng in production in three years and te over a quadrupll.ng J.n five years This remarkable growth immediately begs the questions of what was responsJ.ble for this sudden take-off
As is discussed J.n the section en markets and demand there is no corroborating evidence en either consumption or price levels te suggest that such production increases took place On the other hand alternative estimates of area and yJ.eld are limited The agricultura! census of 1971 estimated cassava area at 47 061 hectares yields of S 75 t/ha and productJ.on of 270 714 tons Even at this stage there were maJor discrepancies between the census estimate and the Bureau of Agricultura! EconomJ.cs (BAE) estimate The maJor difference between the two production estimates is due te the reported area figures the yJ.eld estimates are similar at this date This discrepancy WJ.th the census figure raises some doubt about the adequacy of the sampling and estJ.mation techniques for cassava estJ.mates This is not surprising given that cassava is such a minor crop in the PhJ.lippl.nes
The only data which correspond te the BAE s estJ.mate of increasJ.ng yields from 1976 te 1979 is the Special Study DJ.vision s survey of 901 cassava farmers in the period 1977-79 Average yields for this non-random sample were 4 3 t/ha however this average was biased downward somewhat because the maJor growing area of Central MJ.ndJ.nao was not J.ncluded J.n the survey However even thJ.s would not raise yields te the BAE estJ.mate of 11 7 t/ha
A regional breakdown of production and area provides insight into the regional locus of this supposed growth in cassava productJ.on (Table 6 2) Cassava J.s produced throughout the Philippl.nes but most is produced J.n the southern J.slands There is little productJ.on en Luzon apart from the BJ.col region lying at the southern tip of the J.sland The maJar producJ.ng areas are the VJ.sayas regJ.on and MJ.ndJ.nao The productJ.on data suggest that cassava productJ.on increased at an annual rate of 20 4/ en the J.sland of MJ.ndinao J.n the period 1970-81 whJ.le increasJ.ng J.n the rest of Phl.ll.ppl.nes at a 9 67 annual rate
Mindinao accounted for 787 of the J.ncrease J.n cassava productJ.on J.n the perJ.od The years 1975 and 1976 are particularly striking Production J.n 1975 was 134 thousand tons and J.n 1976 656 thousand tons Thl.s increase almost doubled natJ.onal production In a single year area increased from 20 te 44 thousand hectares and yields from 6 8 to 14 8 t/ha In JUSt the Central Mindinao region productJ.on J.ncreased from 14 thousand tons in 1975 te 1 1 milll.on tons in 1979 These data suggest eJ.ther
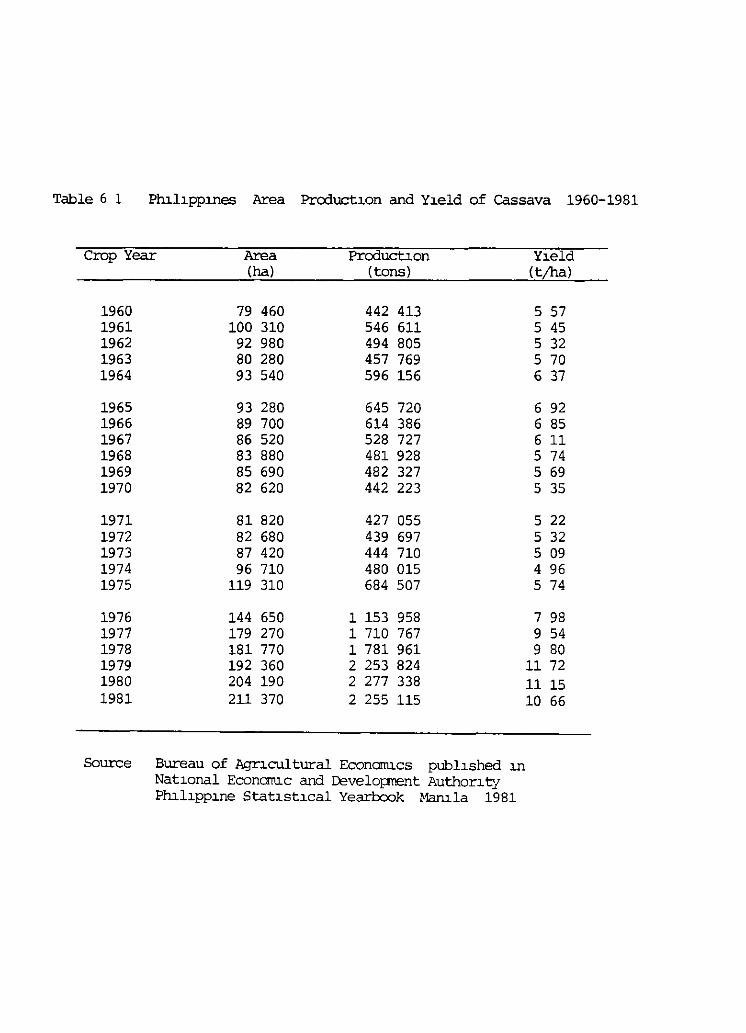
Table 6 1 Pluhppllles Area Product:J.on and YJ.eld of Cassava 1960-1981
Crop Year Area ProductJ.on (ha) (tons)
1960 79 460 442 413 1961 100 310 546 611 1962 92 980 494 805 1963 80 280 457 769 1964 93 540 596 156
1965 93 280 645 720 1966 89 700 614 386 1967 86 520 528 727 1968 83 880 481 928 1969 85 690 482 327 1970 82 620 442 223
1971 81 820 427 055 1972 82 680 439 697 1973 87 420 444 710 1974 96 710 480 015 1975 119 310 684 507
1976 144 650 1 153 958 1977 179 270 1 710 767 1978 181 770 1 781 961 1979 192 360 2 253 824 1980 204 190 2 277 338 1981 211 370 2 255 115
Source Bureau of AgrJ.cultural Econorrucs publJ.shed J.n Natwnal Econarm.c and Develo¡:rnent Authon t:'J PlulJ.ppllle StatJ.stJ.cal Yearbook ManJ.la 1981
YJ.eld (t¡ha)
5 57 5 45 5 32 5 70 6 37
6 92 6 85 611 5 74 5 69 5 35
5 22 5 32 5 09 4 96 5 74
7 98 9 54 9 80
1172 11 15 10 66
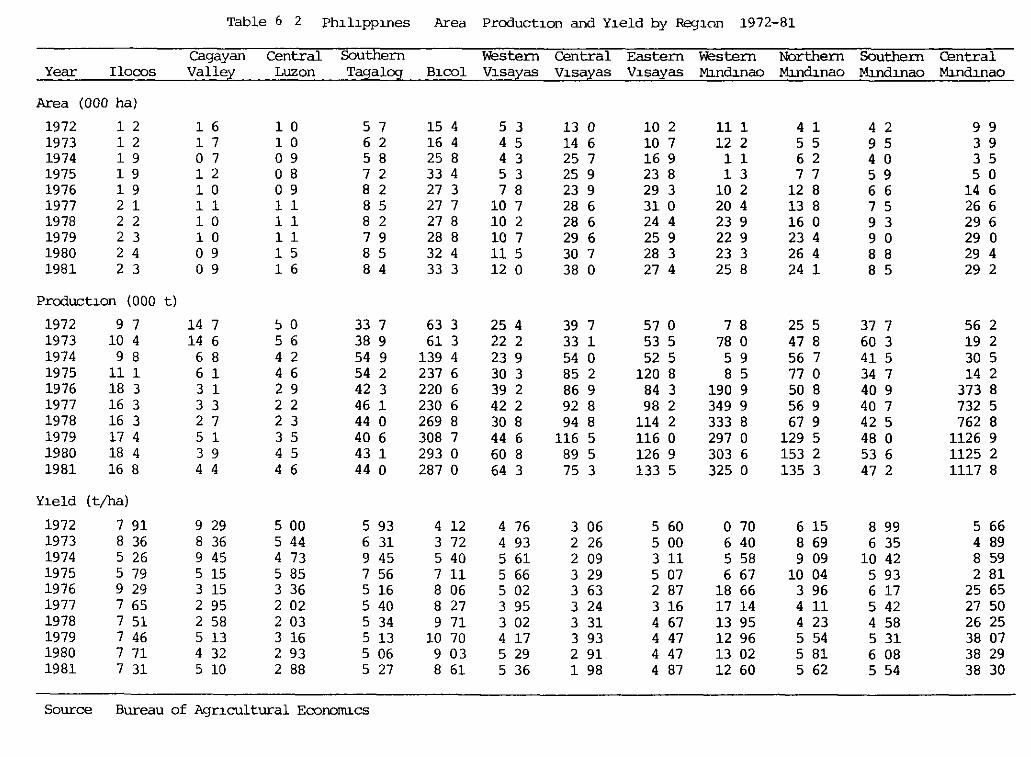
Table 6 2 PhJ.lJ.ppl.nes Area ProductJ.on and YJ.eld by RegJ.on 1972-81
Cagayan Central Southern Western Central Eastern Western Northern Southern -Central Year Ilo=s Valley Luzon Tagalog BJ.=l VJ.sayas VJ.sayas V J. sayas MJ.ndJ.nao Ml.nfunao Ml.ndJ.nao Ml.ndJ.nao
Area (000 ha)
1972 1 2 1 6 1 o 5 7 15 4 5 3 13 o 10 2 111 4 1 4 2 9 9 1973 1 2 1 7 1 o 6 2 16 4 4 5 14 6 10 7 12 2 5 5 9 5 3 9 1974 1 9 o 7 o 9 5 8 25 8 4 3 25 7 16 9 1 1 6 2 4 o 3 5 1975 1 9 1 2 o 8 7 2 33 4 5 3 25 9 23 8 1 3 7 7 5 9 5 o 1976 1 9 1 o o 9 8 2 27 3 7 8 23 9 29 3 10 2 12 8 6 6 14 6 1977 2 1 1 1 1 1 8 5 27 7 10 7 28 6 31 o 20 4 13 8 7 5 26 6 1978 2 2 1 o 1 1 8 2 27 8 10 2 28 6 24 4 23 9 16 o 9 3 29 6 1979 2 3 1 o 1 1 7 9 28 8 10 7 29 6 25 9 22 9 23 4 9 o 29 o 1980 2 4 o 9 1 5 8 5 32 4 115 30 7 28 3 23 3 26 4 8 8 29 4 1981 2 3 o 9 1 6 8 4 33 3 12 o 38 o 27 4 25 8 24 1 8 5 29 2
ProductJ.on (000 t)
1972 9 7 14 7 ~ o 33 7 63 3 25 4 39 7 57 o 7 8 25 5 37 7 56 2 1973 10 4 14 6 5 6 38 9 61 3 22 2 33 1 53 5 78 o 47 8 60 3 19 2 1974 9 8 6 8 4 2 54 9 139 4 23 9 54 o 52 5 5 9 56 7 41 5 30 5 1975 111 6 1 4 6 54 2 237 6 30 3 85 2 120 8 8 5 770 34 7 14 2 1976 18 3 3 1 2 9 42 3 220 6 39 2 86 9 84 3 190 9 50 8 40 9 373 8 1977 16 3 3 3 2 2 46 1 230 6 42 2 92 8 98 2 349 9 56 9 40 7 732 5 1978 16 3 2 7 2 3 44 o 269 8 30 8 94 8 114 2 333 8 67 9 42 5 762 8 1979 17 4 5 1 3 5 40 6 308 7 44 6 116 5 1160 297 o 129 5 48 o 1126 9 1980 18 4 3 9 4 5 43 1 293 o 60 8 89 5 126 9 303 6 153 2 53 6 1125 2 1981 16 8 4 4 4 6 44 o 287 o 64 3 75 3 133 5 325 o 135 3 47 2 1117 8
YJ.eld ( t/ha)
1972 7 91 9 29 5 00 5 93 4 12 4 76 3 06 5 60 o 70 6 15 8 99 5 66 1973 8 36 8 36 5 44 6 31 3 72 4 93 2 26 5 00 6 40 8 69 6 35 4 89 1974 5 26 9 45 4 73 9 45 5 40 5 61 2 09 311 5 58 9 09 10 42 8 59 1975 5 79 5 15 5 85 7 56 711 5 66 3 29 5 07 6 67 10 04 5 93 2 81 1976 9 29 3 15 3 36 5 16 8 06 5 02 3 63 2 87 18 66 3 96 6 17 25 65 1977 7 65 2 95 2 02 5 40 8 27 3 95 3 24 3 16 17 14 411 5 42 27 50 1978 7 51 2 58 2 03 5 34 971 3 02 3 31 4 67 13 95 4 23 4 58 26 25 1979 7 46 513 3 16 513 10 70 4 17 3 93 4 47 12 96 5 54 5 31 38 07 1980 771 4 32 2 93 5 06 9 03 5 29 2 91 4 47 13 02 5 81 6 08 38 29 1981 7 31 5 10 2 88 5 27 8 61 5 36 1 98 4 87 12 60 5 62 5 54 38 30
So urce Bureau of AgrJ.cultural E=nonucs
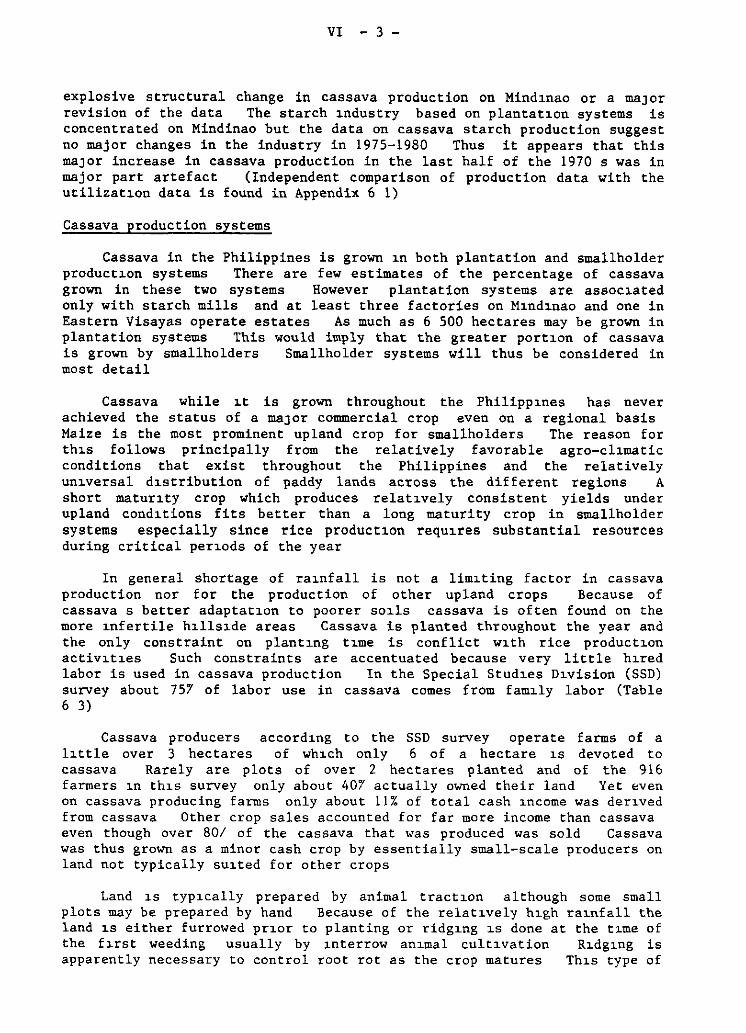
VI - 3 -
explosive structural change in cassava production on Mindl.nao or a maJ or revision of the data The starch l.ndustry based on plantatJ.on systems is concentrated on Mindinao but the data on cassava starch production suggest no major changes in the industry in 1975-1980 Thus it appears that this ma]or increase in cassava production in the last half of the 1970 s was in major part artefact (Independent comparison of production data with the utilizatJ.on data is found in Appendix 6 1)
Cassava production systems
Cassava in the Philippines is grown l.n both plantation and smallholder productl.on systems There are few estimates of the percentage of cassava grown in these two systems However plantation systems are assocJ.ated only with starch mills and at least three factories on MJ.ndJ.nao and one in Eastern Visayas operate estates As much as 6 500 hectares may be grown in plantation systems This would imply that the greater portJ.on of cassava is grown by smallholders Smallholder systems will thus be considered in most detail
Cassava while J.t is grown throughout the Philippl.nes has never achieved the status of a maJor commercial crop even on a regional basis Maize is the most prominent upland crop for smallholders The reason for thl.s follows principally from the relatively favorable agro-cll.matic conditions that exist throughout the Philippines and the relatively unJ.versal dJ.stribution of paddy lands across the different regions A short maturl.ty crop which produces relatJ.vely consistent yields under upland condl.tions fits better than a long maturity crop in smallholder systems especially since rice productl.on requJ.res substantial resources during critica! perJ.ods of the year
In general shortage of raJ.nfall is not a limJ.ting factor in cassava production nor for the production of other upland crops Because of cassava s better adaptatl.on to poorer so1ls cassava is often found on the more J.nfertile hJ.llsJ.de areas Cassava is planted throughout the year and the only constraint on plantl.ng tJ.me is conflict WJ.th rice productJ.on activJ.tJ.es Such constraints are accentuated because very little h1.red labor is used in cassava production In the Special Stud1.es D1vision (SSD) survey about 75'7 of labor use in cassava comes from fam1.ly labor (Table 6 3)
Cassava producers accord1.ng to the SSD survey operate farms of a l1.ttle over 3 hectares of wh1.ch only 6 of a hectare l.S devoted to cassava Rarely are plots of over 2 hectares planted and of the 916 farmers l.n th1s survey only about 407 actually owned their land Yet ~ven on cassava producing farms only about 11% of total cash 1.ncome was der1.ved from cassava Other crop sales accounted for far more income than cassava even though over 80/ of the cassava that was produced was sold Cassava was thus grown as a minar cash crop by essentially small-scale producers on land not typically su1.ted for other crops
Land l.S typl.cally prepared by animal tract1.on although sorne small plots may be prepared by hand Because of the relat1.vely h1gh ra1.nfall the land l.S either furrowed pr1.or to planting or ridg1ng l.S done at the tl.me of the f1rst weeding usually by 1.nterrow an1.mal cultl.vation R1dg1.ng is apparently necessary to control root rot as the crop matures Thl.s type of
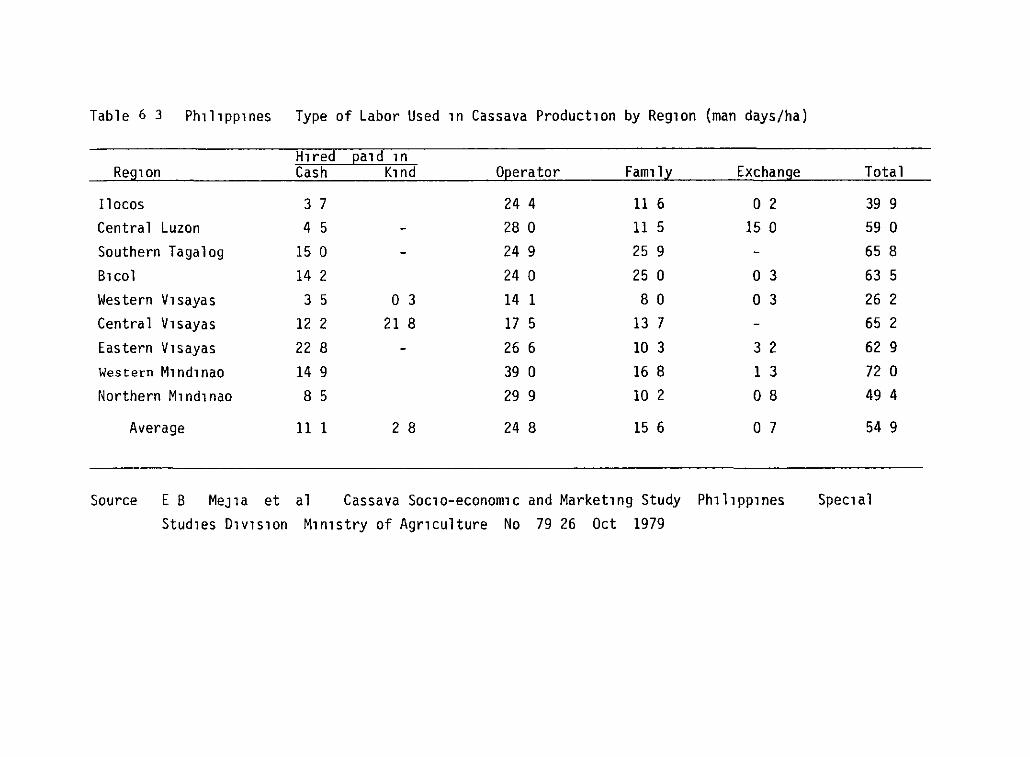
Table 6 3 Ph1l1pp1nes Type of Labor Used 1n Cassava Product1on by Reg1on (man days/ha)
Hired ~a1 d 1 n Reg1on Cash K1nd O~erator Fam1ly Exchange Total
!locos 3 7 24 4 11 6 o 2 39 9
Central Luzon 4 5 - 28 o 11 5 15 o 59 o Southern Tagalog 15 o - 24 9 25 9 - 65 8
B1col 14 2 24 o 25 o o 3 63 5
Western V1sayas 3 5 o 3 14 1 8 o o 3 26 2
Central V1sayas 12 2 21 8 17 5 13 7 - 65 2
Eastern V1sayas 22 8 - 26 6 10 3 3 2 62 9
Western M1nd1nao 14 9 39 o 16 8 1 3 720
Northern M1nd1nao 8 5 29 9 10 2 o 8 49 4
Average 11 1 2 8 24 8 15 6 o 7 54 9
Source E B MeJla et al Cassava SocJo-economlc and Market1ng Study Ph1l1pp1nes Spec1al
Stud1es D1v1S10n M1n1stry of Agr1culture No 79 26 Oct 1979
VI - 4 -
weeding lim~ts any type of ~ntercropping and cassava is usually found planted in monoculture
Although a substantial range of varieties are found in the Ph~lippines --the SSD survey found 22 d~fferent variet~es-- about half the farmers 1n the survey grew a var~ety named white wh~le two-th~rds of farmers grew either white or yellow (Table 6 4) These varieties are apparently selected for their good eating quality
The one peculiar feature of cassava production systems ~n the Ph~lippines 1s the very low labor input devoted to weeding (Table 6 5) This partly reflects the use of animal cultivation but an1mals can be used at most tw1ce for weeding and are often ineffective at controll1ng weeds within the rows Moreover weed control would be expected to be a problem under such relatively high rainfall cond1tions Low labor 1nput for weed1ng thus reflects other factors 1ncluding the rel1ance on fam1ly labor competition with other crops for labor resources and the relatively low commercial status of cassava
This same phenomenon applies to other input use In the survey only 18 of 916 farmers or 2 percent used fertilizer on the1r cassava plots For those farmers who did apply fertilizer the average application rate was about 125 kg/ha of chemical fertilizers For smallholder cassava production cash expenses were kept to very low levels which may reflect the risky nature of marketing the crop
The riskiness is as well reflected ~n harvesting patterns Cassava in general ~n the Philippines can be harvested anytime after six or seven months Farmers 1n general harvest in small lots partly for home consumption but princ1pally as a means of ~nsuring d1sposal at a remunerative price in the market Substant1al labor is as well expended on trimming cleaning and packing the roots for sale At least one study has shown that there ~s no loss in yield when harvesting in small lots between 6 and 9 months as compared to a single harvest at n~ne months (Villamajor 1980) -- the border effect may act as a y~eld compensation mechanism
Cassava plantation systems in the Ph~l~pp~nes are normally in the range of one to 1 5 thousand hectares in size Plant~ng and harvest are staggered to prov~de a continuous supply of cassava to the starch factories This production is as well supplemented by purchases from smallholders However in such large estates it has been d1ff~cult to achieve any s~gnif1cant econom1es of scale in cassava product~on The only s~gnif1cant changes are that land preparat~on ~s done by tractor rather than by animal traction and that herbicides are used in weed control The rest of the operat~ons are performed by hand labor usually on a p~ece rate by farmers contracted 1n the area A 1978 survey of starch plants suggested that the h1gher overhead costs resulted ~n substant~ally higher own product~on costs as compared to purchase pr~ces from local farmers -249 pesos/t versus 174 pesos/t (V~llanueva and Laguna 1979)
Yields
Compared to standards elsewhere 1n As~a cassava y~elds
Ph1l~pp1nes are low even though agro-cl~matic condit~ons are in more favorable The 1977-79 survey of 916 smallholder found an
in the general average
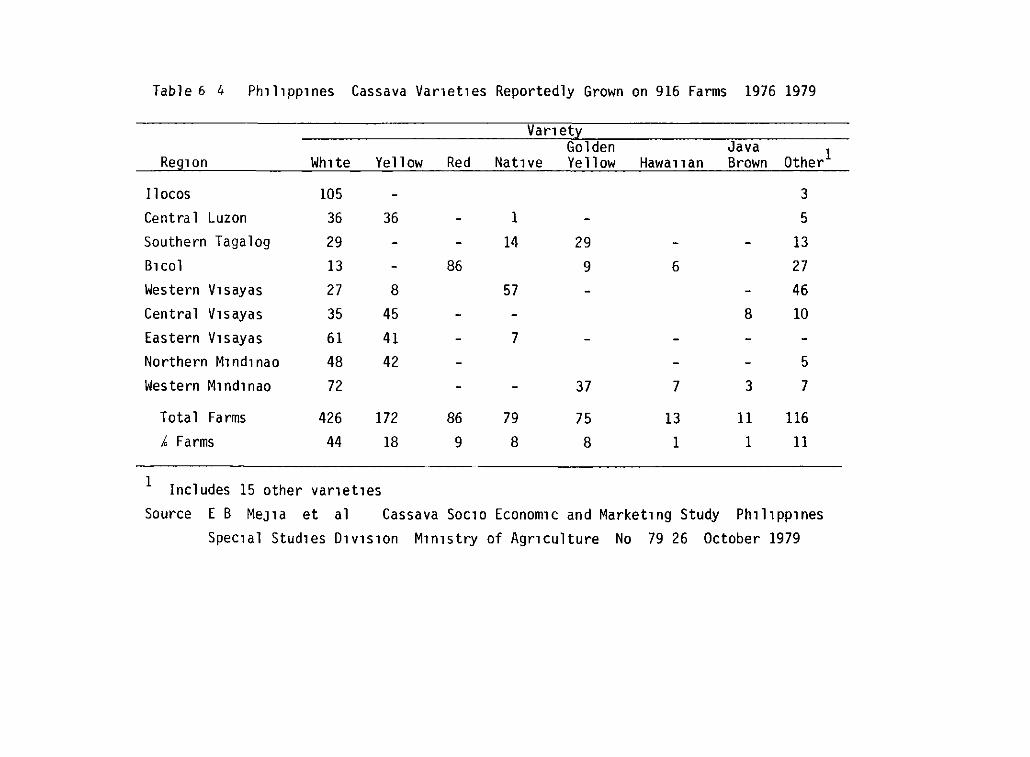
Table 6 4 Ph1llpp1nes Cassava Vanet1es Reportedly Grown on 916 Farms 1976 1979
Van ety
Reg1on Golden Java 1 Wh1te Yellow Red Nat1ve Yellow Hawa11an Brown Other
!locos Central Luzon Southern Tagalog B1col
Western V1 sayas Central V1sayas Eastern V1sayas Northern M1nd1nao Western M1nd1nao
Total Farms
~ Farms
105
36
29
13
27
35
61
48
72
426
44
36
8
45
41
42
172
18
1 Includes 15 other var1et1es
86
86
9
1
14
57
7
79
8
29
9
37
75
8
6
7
13
1
8
3
11
1
3
5
13
27
46
lO
5
7
116
11
Source E B MeJla et al Cassava Soc1o Econom1c and Market1ng Study Ph1l1pp1nes
Spec1al Stud1es Dlvlslon M1n1stry of Agr1culture No 79 26 October 1979
harvestLng and marketLng cassava crop
VI - 6 -
LLttle labor is expended on maLntenance of the
The impression is that resources with a low opportunity cost are princLpally employed Ln cassava family labor and animal power in the slack seasons and either marginal land or excess land which cannot be planted to more labor intensive crops given the stock of family labor Scarce resources such as capital are used only when absolutely necessary Cassava is able to yield under such extensive conditions although not at high levels If thLs is so then the costs of productLon derived by the SSD may be overestimated since family labor and land were costed at average market prLces
Just less than 80% of varLable production costs LS made up by labor charges (Table 6 6) of the wage bill 704 is imputed to famLly labor The rest of variable costs are principally delivery and transport charges and for the 19% of farmers who were share tenants the payment in kind to landlords The other prLncLpal cost is the interest charged against fixed assets devoted to cassava In the SSD study land was not costed at its renta! value but rather as an interest payment (124) on Lts value This interest charge to land forms the other maJar cost component For per hectare production costs there is a certain stabilLty Ln total cost across the different regLons
What LS substantially more variable between regions is yield levels and this results Ln a substantial varLabLlLty Ln per ton productLon costs from 160 pesos/t Ln Western MindLnao to 338 pesos/t Ln BLcol Ir fact four of the nLne region were producing cassava at a higher productLon cost per ton than farmers were receiv1ng as a market price (Table 6 6) However in all cases except region VIII cash 1ncome was greater than cash expenses Costing ind1genous farm resources at their opportun1ty cost could make cassava prof1table 1n these other regions as well However what 1s striking is that farm-level pr1ces to a substant1al degree natched product1on costs and that profit or loss depended crit1cally on y1eld leve! A yield less than 3 5 t/ha was Just not remunerative at least when costed at market prices
Technology development
Design1ng approprLate technology for cassava 1n the Philippines w1ll not be an easy task since the process is dependent on answers to several unknowns The basic questLon 1s why cassava is grown 1n such extens1ve production systems when the average farm s1ze of cassava producers 1s JUSt over 3 hectares If cultural practices are the pr1ncipal constra1nt on y1elds modifying cultural pract1ces is going to requ1re e1ther prov1d1ng farmers wLth further 1ncent1ves to grow cassava (either higher prices or more assured markets) and/or rel1ev1ng what may be s1gn1ficant resource constraLnts with1n the farm Answers to these questions can only come from a more extens1ve study of cassava wLth1n the complete farm system Moreover although cassava 1s clearly a commercial crop in these systems what 1s not clear 1s the type of market toward which increased product1on can be d1rected The two issues of farm1ng systems and markets together define the appropr1ate design parameters for the development of 1mproved technology
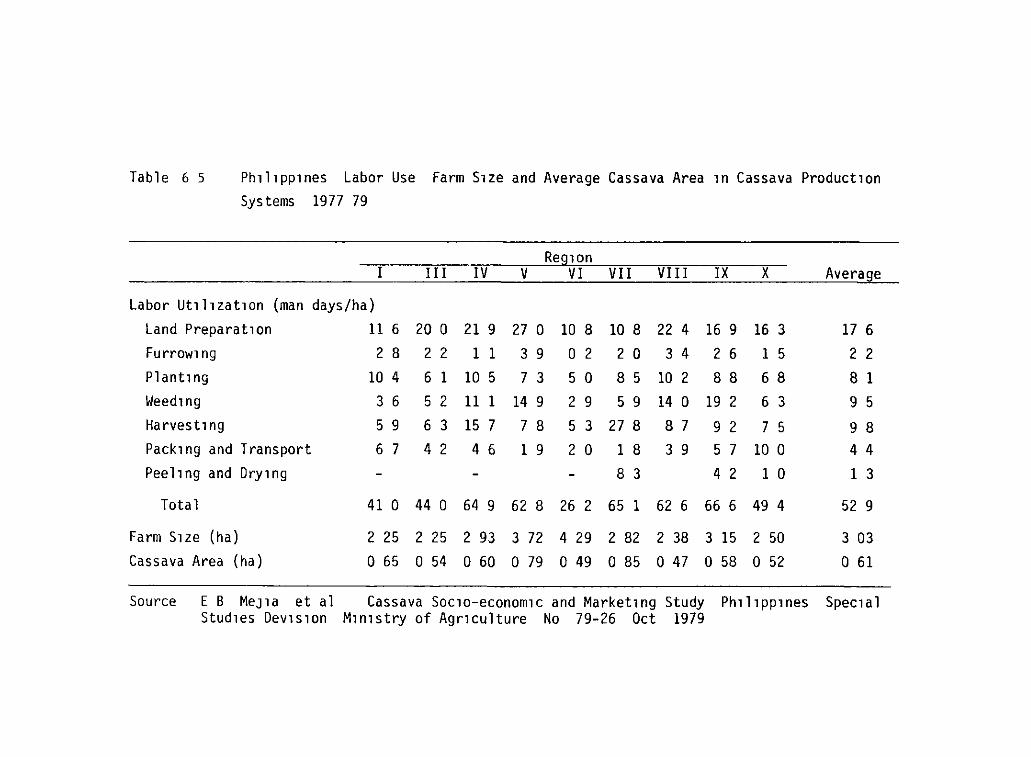
Table 6 5 Ph1l1pp1nes Labor Use Farm S1ze and Average Cassava Area 1n Cassava Product1on Sys tems 1977 79
Reg10n r Tn-- IV V VI VII VIII IX ---x- Average
Labor Ut1l1zat1on (man days/ha) Land Preparat1on 11 6 20 o 21 9 27 o 10 8 10 8 22 4 16 9 16 3 17 6 Furrow1 ng 2 8 2 2 1 1 3 9 o 2 2 o 3 4 2 6 1 5 2 2 Plant1ng 10 4 6 1 105 7 3 5 o 8 5 10 2 8 8 6 8 8 1 Weed1ng 3 6 5 2 11 1 14 9 2 9 5 9 14 o 19 2 6 3 9 5 Harvest1ng 5 9 6 3 15 7 7 8 5 3 27 8 8 7 9 2 7 5 9 8 Pack1ng and Transport 6 7 4 2 4 6 1 9 2 o 1 8 3 9 5 7 10 o 4 4 Peel1ng and Dry1ng - - - 8 3 4 2 1 o 1 3
Total 41 o 44 o 64 9 62 8 26 2 65 1 62 6 66 6 49 4 52 9
Farm SlZe (ha) 2 25 2 25 2 93 372 4 29 2 82 2 38 3 15 2 50 3 03 Cassava Area (ha) o 65 o 54 o 60 o 79 o 49 o 85 o 47 o 58 o 52 o 61
So urce E B MeJ 1a et al Cassava Soc1o-economlC and Market1ng Study Ph1l1pp1nes Spec1al Stud1es Dev1S1on M1n1stry of Agr1culture No 79-26 Oct 1979
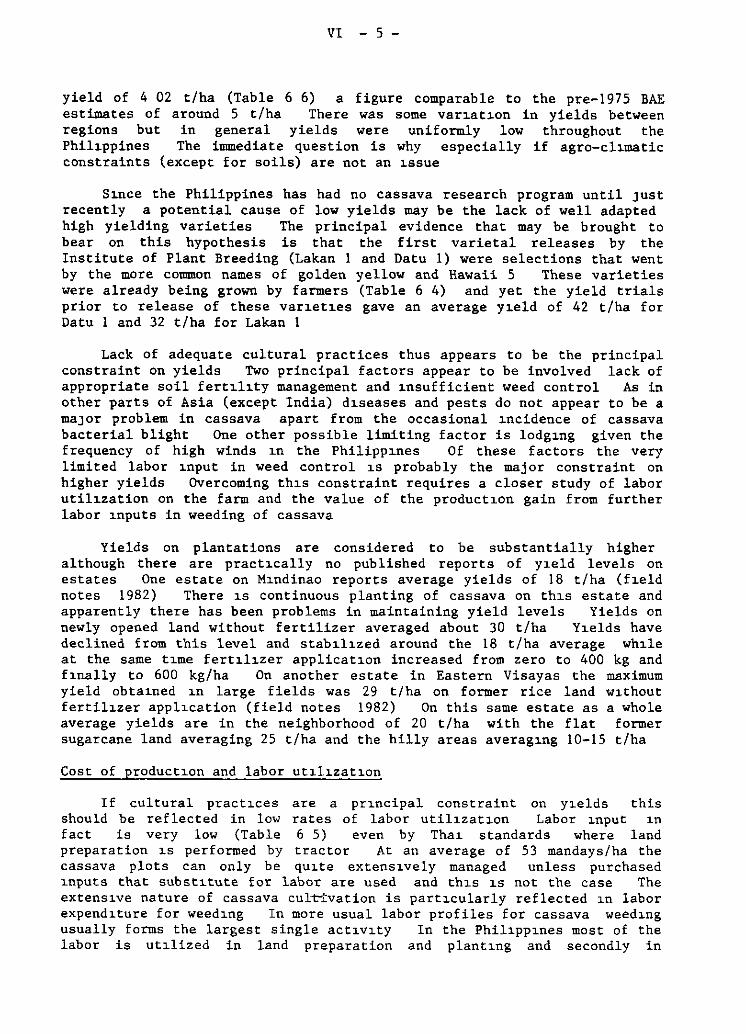
VI - 5 -
yield of 4 02 t/ha (Table 6 6) a figure comparable to the pre-1975 BAE estimates of around 5 t/ha There was some var~at~on in yields between regions but in general yields were uniformly low throughout the Phihppines The immediate question is why especially if agro-chmatic constraints (except for soils) are not an ~ssue
S~nce the Philippines has had no cassava research program until JUSt recently a potential cause of low yields may be the lack of well adapted high yielding varieties The principal evidence that may be brought to bear on this hypothesis is that the first varietal releases by the Institute of Plant Breeding (Lakan 1 and Datu 1) were selections that went by the more common names of golden yellow and Hawaii S These varieties were already being grown by farmers (Table 6 4) and yet the yield trials prior to release of these var~et~es gave an average y~eld of 42 t/ha for Datu 1 and 32 t/ha for Lakan 1
Lack of adequate cultural practices thus appears to be the principal constraint on yields Two principal factors appear to be involved lack of appropriate soil fert~l~ty management and ~nsufficient weed control As in other parts of Asia (except India) d~seases and pests do not appear to be a maJar problem in cassava apart from the occasional ~ncidence of cassava bacteria! blight One other possible limiting factor is lodg~ng given the frequency of high winds w the Philipp~nes Of these factors the very limited labor ~nput in weed control ~s probably the major constraint on higher yields Overcoming th~s constraint requires a closer study of labor util~zation on the farm and the value of the product~on gain from further labor ~nputs in weeding of cassava
Yields on plantations are considered to be substantially higher although there are pract~cally no published reports of y~eld levels on estates One estate on M~ndinao reports average yields of 18 t/ha (f~eld
notes 1982) There ~s continuous planting of cassava on th~s estate and apparently there has been problems in maintaining yield levels Yields on newly opened land without fertilizer averaged about 30 t/ha Y~elds have declined from this level and stab~l1zed around the 18 t/ha average wh1le at the same t1me fert~l1zer applicat1on increased from zero to 400 kg and f1nally to 600 kg/ha On another estate in Eastern Visayas the maximum yield obta1ned ~n large fields was 29 t/ha on former rice land w1thout fertil~zer appl1cation (field notes 1982) On this same estate as a whole average yields are in the neighborhood of 20 t/ha with the flat former sugarcane land averaging 25 t/ha and the hilly areas averag1ng 10-15 t/ha
Cost of product1on and labor ut~l1zat1on
If cultural pract1ces are a pr~ncipal constraint on y~elds this should be reflected in low rates of labor util1zat1on Labor 1nput 1n fact is very low (Table 6 5) even by Tha1 standards where land preparation ~s performed by tractor At an average of 53 mandays/ha the cassava plots can only be qu~te extens1vely managed unless purchased ~nputs that subst1tute for labor are used and th~s 1s not the case The extens1ve nature of cassava cult1vation is part~cularly reflected ~n labor expend1ture for weed~ng In more usual labor profiles for cassava weed~ng
usually forms the largest single act~v~ty In the Phil1pp1nes most of the labor is ut~lized in land preparation and plant1ng and secondly in
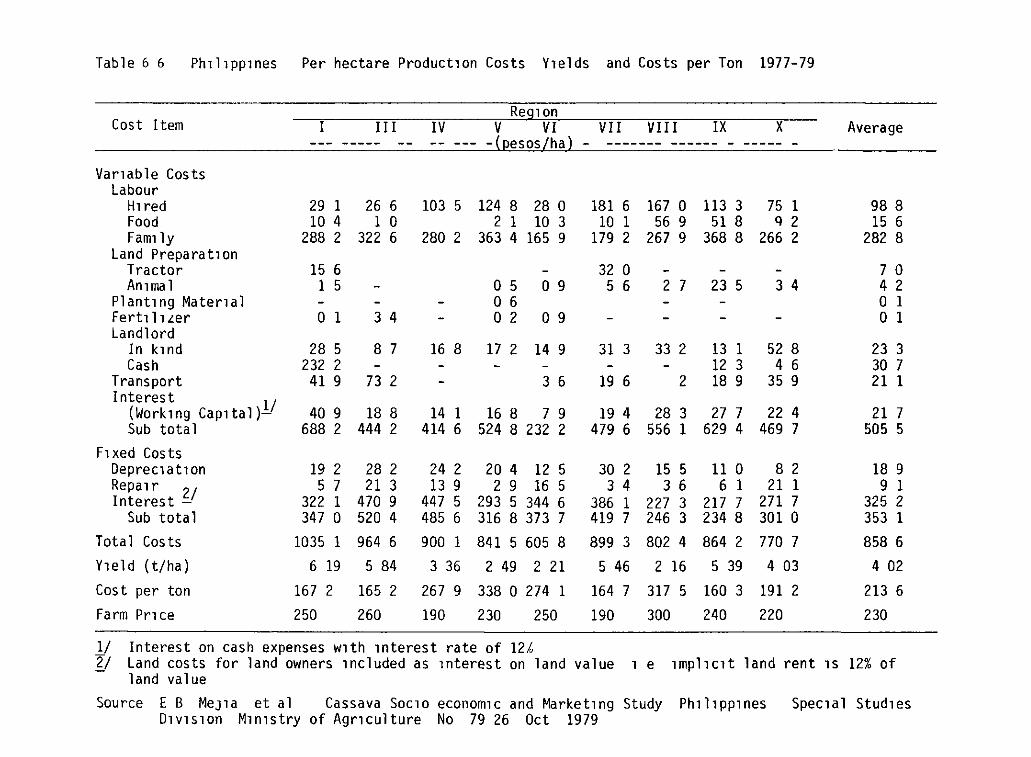
Table 6 6 Ph1l1pp1nes Per hectare Product1on Costs Y1elds and Costs per Ton 1977-79
Cost Item
Vanable Costs Labour
Hned Food Fam1ly
Land Preparat1on Tractor An1 ma 1
Plant1ng Mater1al Fert1l1Ler Landlord
In k1nd Cash
Transport Interest 11 (Work1ng Capltal)
Sub total FJXed Costs
Deprec1 a t 10n Repa1r 21 Interest -
Sub total
Total Costs Y1eld (t/ha)
Cost per ton
Farm Pnce
I III
29 1 26 6 10 4 1 o
288 2 322 6
15 6 1 5 - -o 1 3 4
28 5 8 7 232 2
41 9 73 2
40 9 18 8 688 2 444 2
19 2 5 7
322 1 347 o
28 2 21 3
470 9 520 4
Reg10n IV V VI
-(pesos/ha) -
103 5 124 8 28 o 2 1 10 3
280 2 363 4 165 9
o 5 o 9 o 6 o 2 o 9
16 8 17 2 14 9
3 6
14 1 16 8 7 9 414 6 524 8 232 2
24 2 13 9
447 5 485 6
20 4 12 5 2 9 16 5
293 5 344 6 316 8 373 7
VII VIII IX
181 6 10 1
179 2
32 o 5 6
31 3
19 6
167 o 56 9
267 9
2 7
33 2
2
113 3 51 8
368 8
23 5
13 1 12 3 18 9
X
75 1 Q 2
266 2
3 4
52 8 4 6
35 9
19 4 28 3 27 7 22 4 479 6 556 1 629 4 469 7
30 2 3 4
386 1 419 7
15 5 3 6
227 3 246 3
110 6 1
217 7 234 8
8 2 21 1
271 7 301 o
1035 1 964 6 900 1 841 5 605 8 899 3 802 4 864 2 770 7
6 19 5 84 3 36 2 49 2 21 5 46 2 16 5 39 4 03
167 2 165 2 267 9 338 o 274 1 164 7 317 5 160 3 191 2
250 260 190 230 250 190 300 240 220
Average
98 8 15 6
282 8
7 o 4 2 o 1 o 1
23 3 30 7 21 1
21 7 505 5
18 9 9 1
325 2 353 1
858 6
4 02
213 6
230
1/ Interest on cash expenses w1th 1nterest rate of 12h ~/ Land costs for land owners 1ncluded as 1nterest on land value 1 e 1mpl1clt land rent 1s 12% of
land value Source E 8 MeJla et al Cassava Soc1o econom1c and Market1ng Study Ph1l1pp1nes Spec1al Stud1es
Dlvlslon M1n1stry of Agr1culture No 79 26 Oct 1979
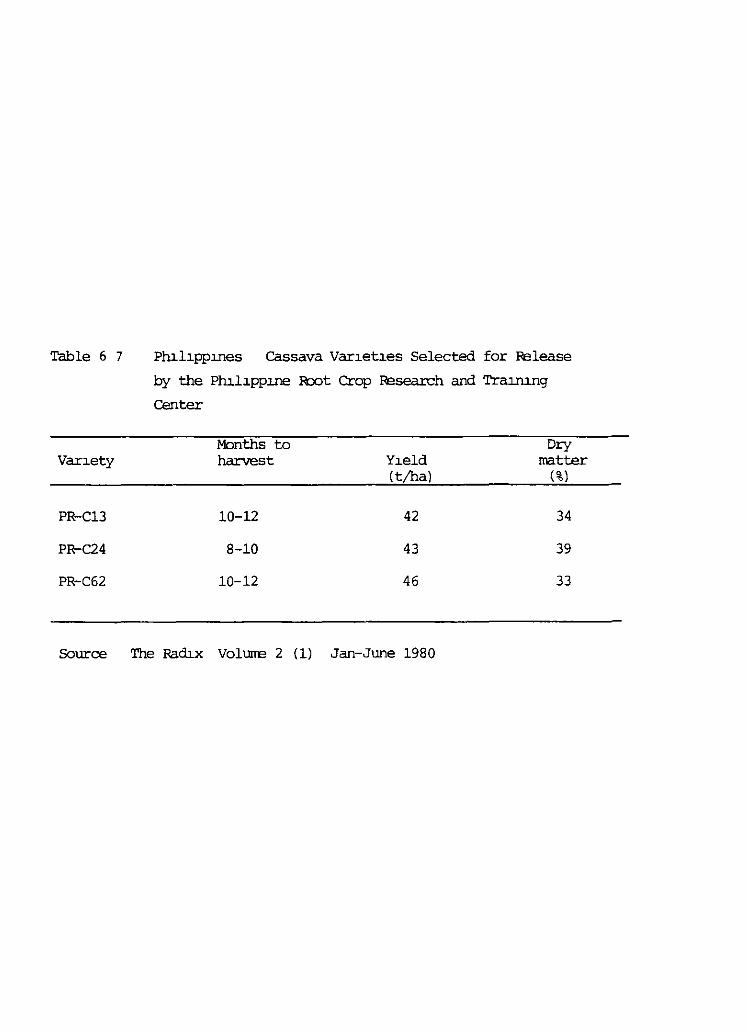
Table 6 7
Var1ety
PR:-C13
PR:-C24
PR-C62
Ph111ppLnes Cassava Var1et1es Selected for Release
by the Phü1ppLne Root Crop Research and TraJ..JUng
Center
Months to harvest
10-12
8-10
10-12
Y1eld (t/hal
42
43
46
Dry rnatter
(%)
34
39
33
Source The Ramx VolllllE 2 (1) Jan-Jl.llle 1980
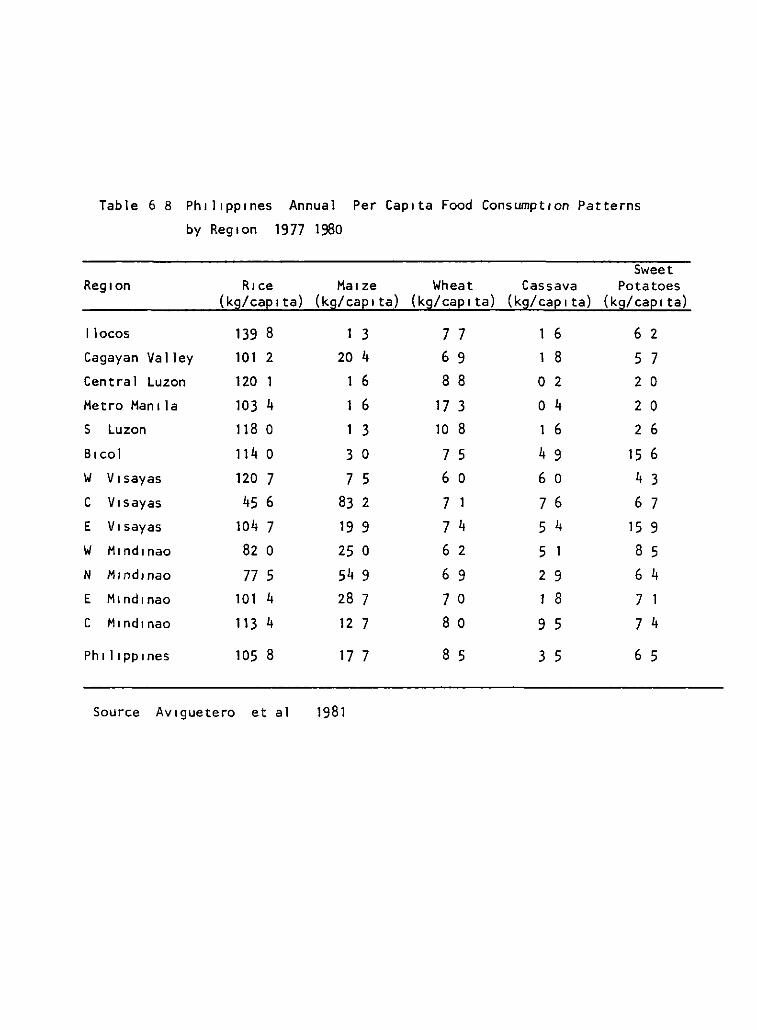
Table 6 8 Ph 1 1 1 pp 1 nes Annual Per Cap1ta Food Consumpt1on Patterns
by Reg1on 1977 1980
Sweet Reg1on R1ce Ma1ze Wheat Cassava Pota toes
( kg/ cap 1 ta) (kg/caplta) ( kg/ cap 1 ta) (kg/cap 1 ta) (k g/ cap 1 ta)
llocos 139 8 3 7 7 6 6 2
Cagayan Val ley 101 2 20 4 6 9 8 5 7 Central Luzon 120 1 1 6 8 8 o 2 2 o Metro Man 1 la 103 4 1 6 17 3 o 4 2 o S Luzon 118 o 3 10 8 6 2 6
B1col 114 o 3 o 7 5 4 9 15 6
w V 1 sayas 120 7 7 5 6 o 6 o 4 3
e V 1 sayas 45 6 83 2 7 1 7 6 6 7
E V1sayas 104 7 19 9 7 4 5 4 15 9
w M1nd1nao 82 o 25 o 6 2 5 8 5
N M1nd1nao 775 54 9 6 9 2 9 6 4
E M1nd1nao 101 4 28 7 7 o 8 7 e M1nd1nao 113 4 12 7 8 o 9 5 7 4
Ph 1 1 1 pp 1 nes 105 8 17 7 8 5 3 5 6 5
Source Av1guetero et al 1981
VI - 7 -
There had been little research on cassava in the Philippines until the formation 1n 1977 of the Philippines Root Crop Research and Training Center (PRCRTC) The center is located on the campus of the Visayas State College of Agriculture and besides a staff of 15 researchers the center draws on the staff of the College to assist on research proJects Besides cassava the center does research on sweet potatoes yam and taro There is no cassava program as such s1nce the different d1scipl1nes divide their t1me between the different root crops except for a breeder whose sole responsib1lity is cassava breeding Research on cassava extends from breed1ng through crop protect1on and management to post-harvest util1zation
The center in its few years of operat1on has princ1pally been 1nvolved in defining research strategy and research prior1ties between root crops Research by each discipline is dehned on a project basis which can be influenced by outside funding espec1ally the funding from the Ph1lippine Counc1l for Agr1culture and Resources Research (PCARR) Policy development can have a marked influence on research d1rection s.1ch as was the case w1th the abortive alcohol program
The center st1ll is 1n the process of completing the development of a fully structured breed1ng selection and varietal testing program A germplasm bank has been assembled and evaluated and at least three select1ons have been suggested as recommended variet1es for release (Radix 1980) A cross1ng and selection program has been started The breeding focus is on h1gher yield w1th starch content be1ng a secondary obJective This program 1s complemented by some cassava breeding which 1s done at the Institute of Plant Breeding (IPB) at the University of the Ph1l1pp1nes at Los Baños A nat1onal varietal testing system has recently been set up with var1etal input from PRCRTC IPB-UPLB and the Bureau of Plant Industry Trials are carr1ed out on s1x different experimental stat1ons
Def1nit1on of the potencial yield gap that may be explo1ted rema1ns as yet relat1vely undefined The y1eld data on the first three select1ons released by PRCRTC ( two are already grown by farmers) show the almost tradicional y1eld of promising varieties under experimental condit1ons of over 40 t/ha (Table 6 7) Defin1ng what potential yield levels are at the farm level is more diff1cult as well as the even more cr1tical que5t1on of how to increase farm-level y1elds with1n farmer resource ava1lab1lit1es What probably can be sa1d 1s that a target of 15 t/ha for 5mallholder5 15 realistic wh1ch for the Philippines amounts to a tripling 1n average y1elds
Harl-ets and Demand
Cassava 15 grown throughout the Ph1l1pp1nes but only 1n Central M1nd1nao may 1t be 8aid to be a maJar crop Moreover production tends to be larger 1n area8 where there 18 acce88 to well developed markets In the Phihppines cas8ava appear8 to be con8trained by what could be termed market 1nert1a That 18 production 1ncentive5 are «eak due to poorly developed market8 for ca88ava lead1ng to ex~081Ve production 8Y8tem8 and low y1elds In turn h1gh per ton product1on C08t5 provide little incent1ve for further market development Def1n1ng the mechan1sm for
VI - 8 -
breaking th1s inertia requires an evaluation of the present and potent1al markets for cassava 1n the Phil1pp1nes
Cassava for d1rect human consumption
Where cassava is consumed as a food source 1n trop1cal Asia it is usually in areas where there 1s a shortfall in rice availab1lit1es e1ther because of limited purchasing power and/or insuff1c1ent product1on levels Cassava has not been incorporated as a maJar component 1n the Ph1l1ppine diet because rice production is in general relatively evenly distributed throughout the islands and in reg1ons where rice suppl1es are short carbohydrate requirements are supplemented by maize (Table 6 8) Moreover consumpt1on of wheat products has stead1ly increased in the post-war per1od and has reached quite significant levels in urban areas
Root crops are of secondary importance as carbohydrate sources in the diet with cassava and sweet potatoes being of more or less equal rank There is sorne difference between sources 1n estimates of actual consumpt1on of cassava Bennagen (1982) reviews these estimates (Table 6 9) and finds an average annual per capita consumption lying somewhere between 4 and 9 kg The locus of cassava consumption is essent1ally off-Luzon in the southern islands (Table 6 8) and in rural areas (Table 6 10) St1ll even in the h1gh consuming areas cassava is st1ll of only secondary importance in the diet Cassava consumpt1on in general coinc1des with the consumpt1on pattern for maize Thus rural households eat twice the amount of less-preferred staples (maize and root crops) than urban households (Bennagen 1982)
There 1s something of a dual1ty in consumption forms for cassava In most rural areas cassava is consumed as a caloric staple The roots are e1ther cubed and steamed 1n the same manner as rice is prepared or peeled and boiled Prepared and eaten in this way cassava 1s a subst1tute for r1ce On the other hand the roots 1s m1lled fresh and used to produce a type of cake or other processed snack 1tems The latter 1s probably the principal form in which cassava is consumed 1n urban areas and reflecta the fact that the price of cassava is much higher in urban compared to rural areas Demand for cassava should behave more as a caloric staple in rural areas and as a vegetable crop in urban areas
The staple nature of cassava demand is reflected in the seasonality of prices and consumption In the main rice grow1ng areas on Luzon there is l1ttle seasonal1ty to either cassava prices or consumption and consumpt1on levels are relat1vely low However to the south 1n Visayas and Mind1nao where there are shortfalls in r1ce production there is a more seasonal pattern to both prices and consumption (Table 6 11) On Mind1nao cassava consumpt1on sends to be h1ghest in September wh1le on V1sayas 1t tends to be h1gher 1n March These are per1ods wh1ch l1e outside the r1ce harvest wh1ch occur pr1ncipally 1n the May-June per1od and 1n December Cassava consumption tends to be lowest 1n the main r1ce harvest 1n December There thus appears to be substitut1on between rice and cassava depend1ng on ava1lab1lities
Th1s substitut1on by r1ce and the fact that r1ce 1s the preferred staple is fully reflected 1n demand parameter est1mates for cassava (Table
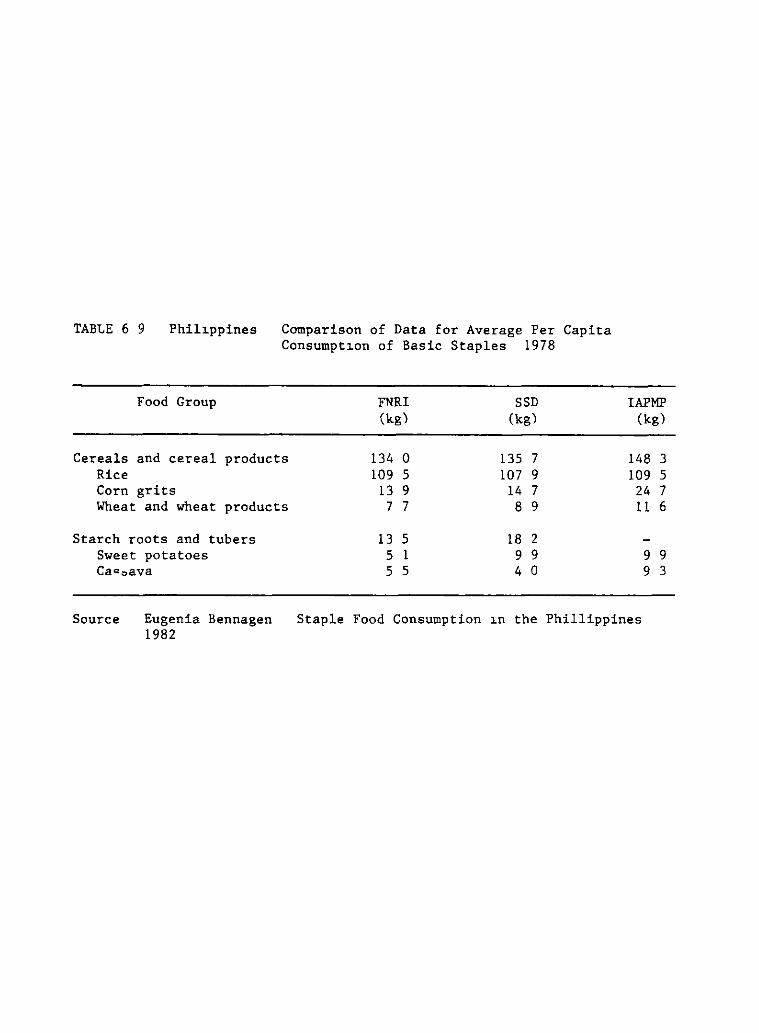
TABLE 6 9 Phil~ppines Comparison of Data for Average Per Capita Consumpt~on of Basic Staples 1978
Food Group
Cereals and cereal products Rice Corn grits Wheat and wheat products
Starch roots and tubers Sweet potatoes Cac:!,:)ava
FNRI (kg)
134 o 109 5
13 9 7 7
13 5 5 1 5 5
SSD (kg)
135 7 107 9
14 7 8 9
18 2 9 9 4 o
IAPMP (kg)
148 3 109 5
24 7 11 6
9 9 9 3
Source Eugenia Bennagen 1982
Staple Food Consumption ~n the Phillippines
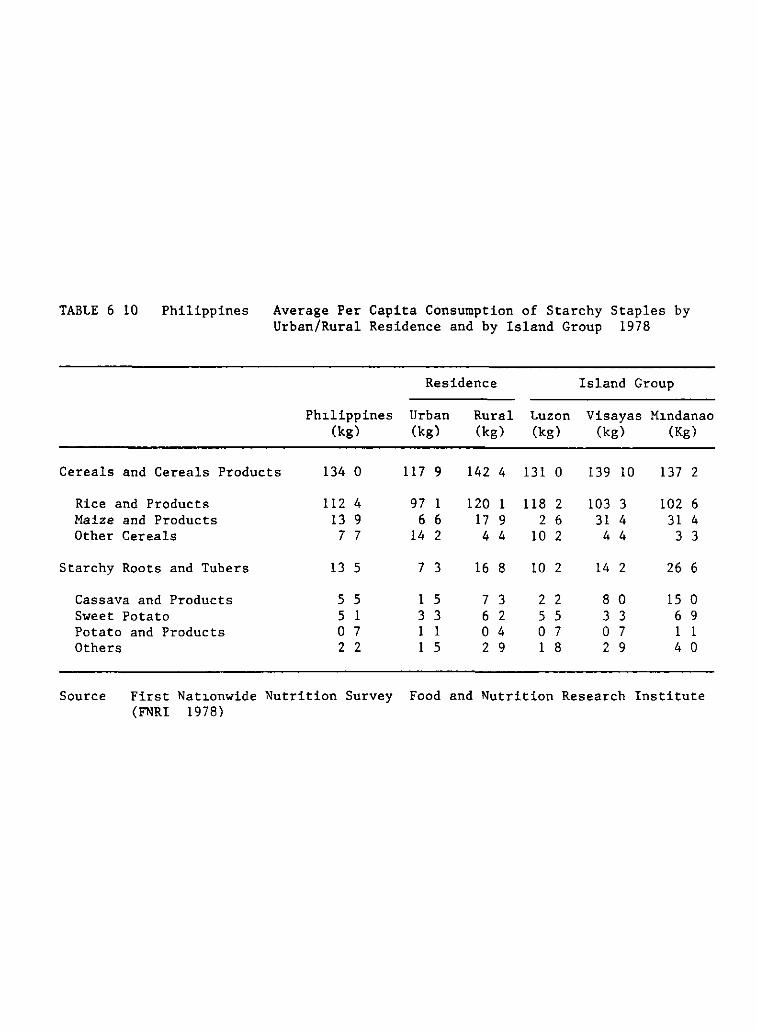
TABLE 6 10 Philippines Average Per Capita Consumption of Starchy Staples by Urban/Rural Residence and by Island Group 1978
Residence Island Group
Phüippines Urban Rural Luzon Visayas M1ndanao (kg) (kg) (kg) (kg) (kg) (Kg)
Cereals and Cereals Products 134 o 117 9 142 4 131 o 139 10 137 2
Rice and Products 112 4 97 1 120 1 118 2 103 3 102 6 Maize and Products 13 9 6 6 17 9 2 6 31 4 31 4 Other Cereals 7 7 14 2 4 4 10 2 4 4 3 3
Starchy Roots and Tubers 13 5 7 3 16 8 10 2 14 2 26 6
Cassava and Products 5 5 1 5 7 3 2 2 8 o 15 o Sweet Patato 5 1 3 3 6 2 5 5 3 3 6 9 Patato and Products o 7 1 1 o 4 o 7 o 7 1 1 Others 2 2 1 5 2 9 1 8 2 9 4 o
Source First Nat10nwide Nutrition Survey Food and Nutrition Research Institute (FNRI 1978)
VI - 9 -
6 12) The elast~city estimates in general suggest that cassava is an infer~or good i e that consumpt~on actually decl~nes w~th increasing income and that there ~s a very strong substitution between cassava and rice and to a more minar degree subst~tution between cassava and maize These results conform to expectat~on and coincide with results for the other less-preferred staples Ma~ze in fact appears to be even more inferior a good than cassava (Bennagen 1982)
These demand parameters underlie trends in consumption of basic staples in the Ph~lipp~nes (Figure 6 1) The trend in per capita consumption of rice has been relatively constant w~th a marked tendency for there to be less year-to-year variability The pr~ncipal effect of the high-y~elding r~ce var~eties has not been on average consumption levels but rather to shift the Philippines from a net importer to a net exporter of rice The constancy in consumption could represent an increase in consumption by the poorer income strata and a decrease by the higher income strata However Bennagen (1982) presents data that does not support this Also there was a shift in relat~ve prices of rice in relation to the non-preferred staples The effect in the 1970's has been to induce a decl~n~ng trend in per capita consumption of both cassava and maize Ma~ze
consumption in fact has declined more rapidly than cassava consumpt~on The Phil~ppines food economy appears to be reaching that stage where there ~s a d~vers~fication in the d~et away from a basic dependence on caloric staples
The fresh food market is currently the dom~nant market for cassava in the Philipp~nes In the best of circumstances ~t is difficult to build a relat~vely expansive production base purely dependent on the fresh food market Given the long h~story of cassava ~n the Ph~l~ppines it is highly unlikely that cassava will ever develop as a ma]or staple In part this was because agroclimatic cond~tions were not poor enough to favor cassava in any part of the Phil~ppines maize a short cycle crop could always be grown as a secondary staple to rice Recent trends ~n consumption of non-preferred staples ~ncluding cassava ~ndicate limited future growth in this market Developing cassava as a majar commercial crop will thus depend on the development of other alternat~ve markets for the crop
The starch market
The princ~pal existing alternative market for cassava in the Philipp~nes ~s for starch product~on Cassava starch product~on through the last decade has been relat~vely stagnant (Table 6 13) At the same time net ~mports of cassava starch wh~le never large have declined to relat~vely ~ns~gn~f~cant levels V~ewed 1n ~solat1on these trends would appear to imply a relat1vely stagnant market for starch yet while cassava starch product~on has been stationary maize starch production has been 1ncreasing (F1gure 6 2) ind1cating qu1te s1gnif1cant growth 1n total starch demand At issue then 1s the competit1on between maize and cassava starch for a grow1ng but not expans1ve market
The major part of the cassava starch industry 1s located on Mind1nao together with part of the ma1ze starch industry The 1ndustry is by nature large-scale and 1n 1984 cons1sted of ten plants with a combined annual
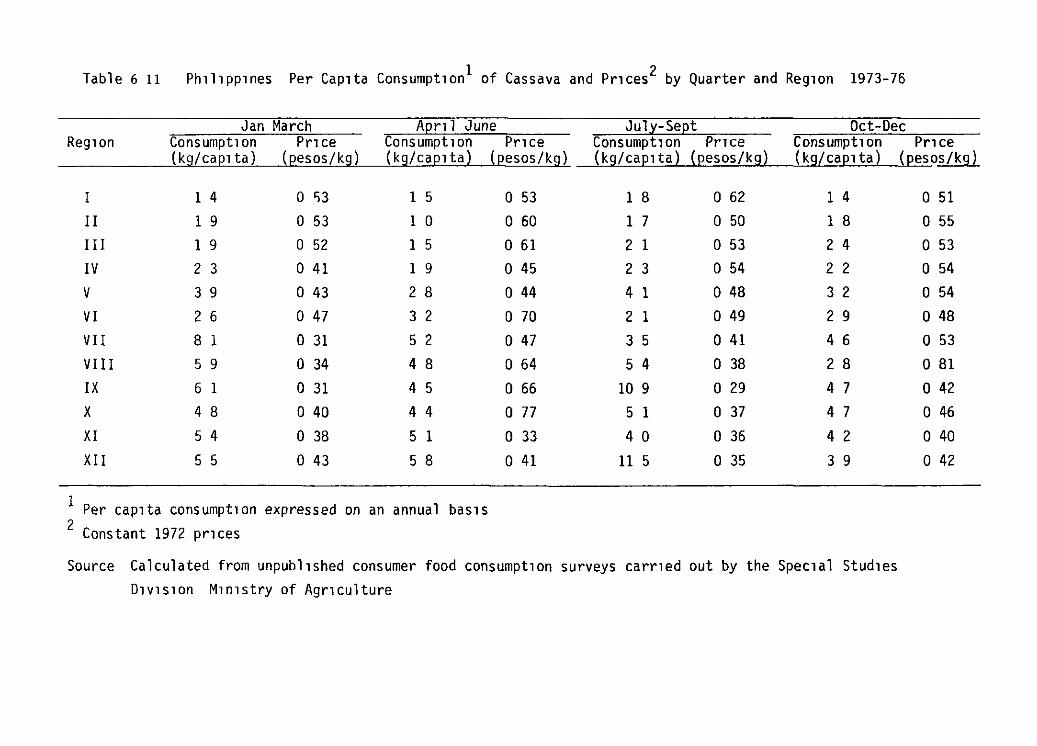
Table 6 11 Ph1l1pp1nes Per Cap1ta Consumpt1on1 of Cassava and Pr1ces2 by Quarter and Reg1on 1973-76
Jan March AQnl June Jul~-SeQt Oct-Dec Reg1on Consumpt10n Pnce Consumpt10n Pnce Consumpt1on Pnce Consumpt10n Pnce
(kg/caQl ta) (Qesos/kg) (kg/caQlta) (Qesos/kg) (kg/caQlta) (Qesos/kg) (kg/caQlta) (QeSOS/kg)
I 1 4 O S3 1 5 o 53 1 8 o 62 1 4 ¡¡ 1 9 o 53 1 o o 60 1 7 o 50 1 8
I I I 1 9 o 52 1 5 o 61 2 1 o 53 2 4
IV 2 3 o 41 1 9 o 45 2 3 o 54 2 2
V 3 9 o 43 2 8 o 44 4 1 o 48 3 2
VI 2 6 o 47 3 2 o 70 2 1 o 49 2 9
VII 8 1 o 31 5 2 o 47 3 5 o 41 4 6
VIII 5 9 o 34 4 8 o 64 5 4 o 38 2 8
IX 6 1 o 31 4 5 o 66 10 9 o 29 4 7
X 4 8 o 40 4 4 o 77 5 1 o 37 4 7
XI 5 4 o 38 5 1 o 33 4 o o 36 4 2
XII 5 5 o 43 5 8 o 41 11 5 o 35 3 9
1 Per cap1ta consumpt1on expressed on an annual bas1s 2 Constant 1972 pr1ces
Source Calculated from unpubl1shed consumer food consumpt1on surveys carr1ed out by the Spec1al Stud1es DlVlSlOn M1n1stry of Agr1culture
o 51
o 55 o 53 o 54
o 54
o 48
o 53
o 81
o 42
o 46
o 40
o 42
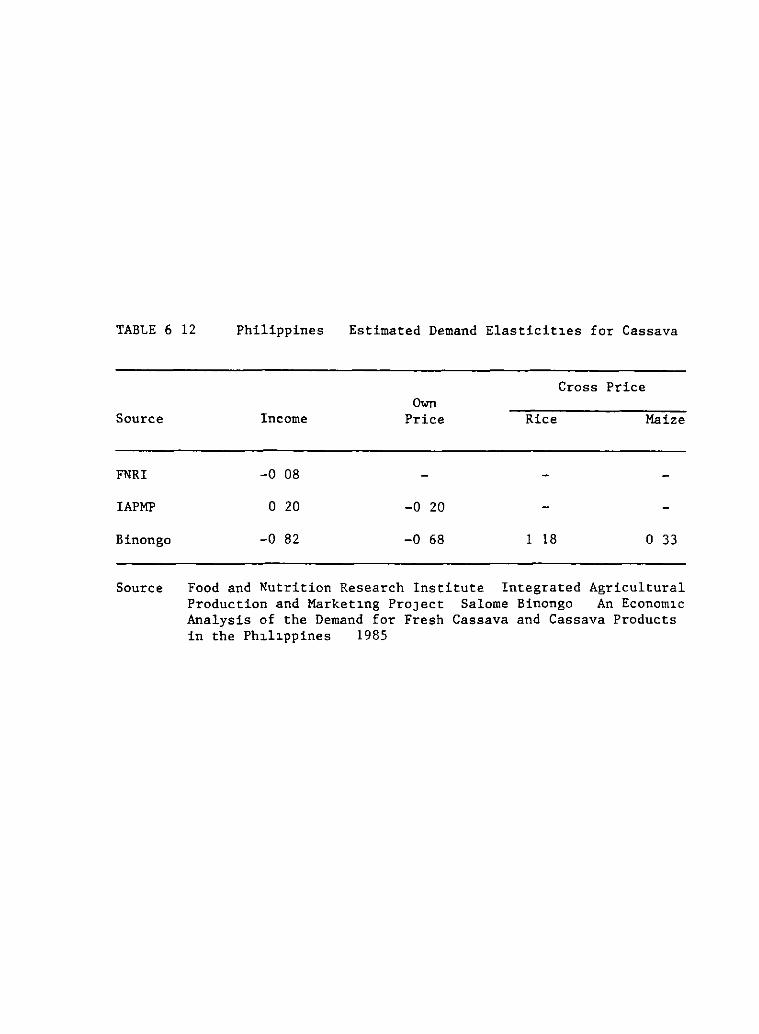
TABLE 6 12 Philippines Estimated Demand Elasticit1es for Cassava
Source
FNRI
IAPMP
Binongo
Source
Income
-0 08
o 20
-0 82
Own Price
-0 20
-0 68
Cross Price
Rice Maize
1 18 o 33
Food and Nutrition Research Institute Integrated Agricultural Production and Market1ng ProJect Salome Binongo An Econom1c Analysis of the Demand for Fresh Cassava and Cassava Products in the Ph1l1ppines 1985
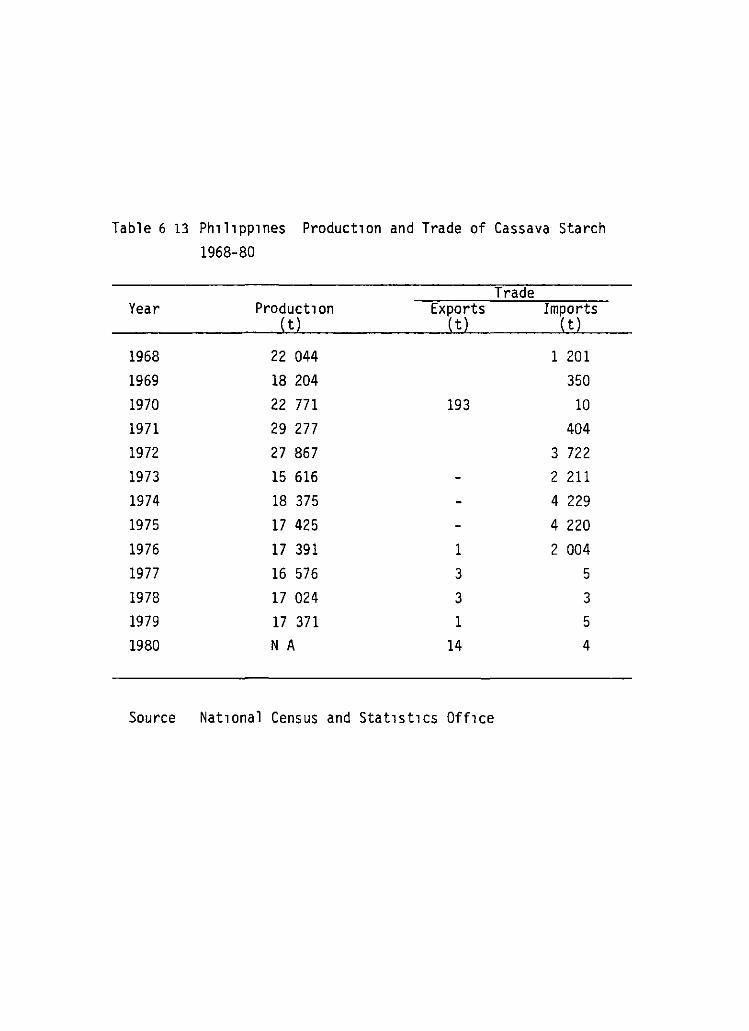
Table 6 13 Ph 111 pp1 nes Product1on and Trade of Cassava Starch 1968-80
Trade Year Product1on Exports Imports
t t t
1968 22 044 1 201
1969 18 204 350
1970 22 771 193 10 1971 29 277 404
1972 27 867 3 722 1973 15 616 2211 1974 18 375 4 229
1975 17 425 4 220
1976 17 391 1 2 004
1977 16 576 3 5
1978 17 024 3 3 1979 17 371 1 5
1980 N A 14 4
Source Nat1onal Census and Stat1st1cs Off1ce
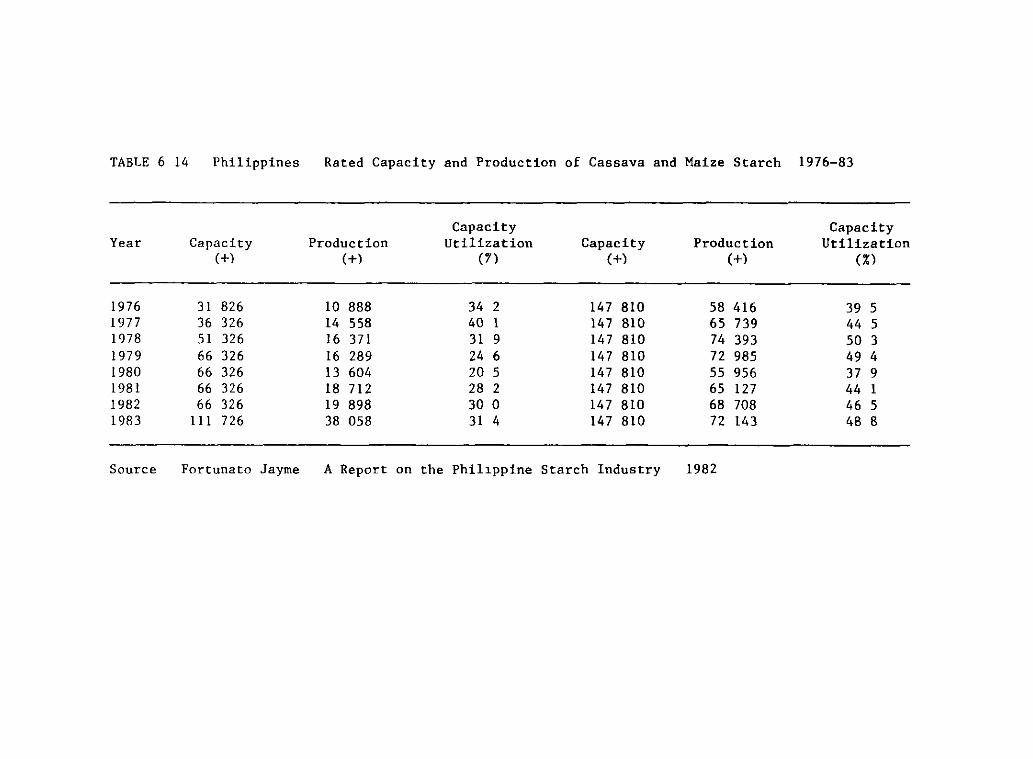
TABLE 6 14 Philippines Rated Capacity and Production of Cassava and Maize Starch 1976-83
Capacity Capacity Year Capacity Production Utilization Capacity Production Utilization
(+) (+) (7) (+) (+) (%)
1976 31 826 10 888 34 2 147 810 58 416 39 5 1977 36 326 14 558 40 1 14 7 810 65 739 44 5 1978 51 326 16 371 31 9 147 810 74 393 50 3 1979 66 326 16 289 24 6 147 810 72 985 49 4 1980 66 326 13 604 20 5 147 810 55 956 37 9 1981 66 326 18 712 28 2 147 810 65 127 44 1 1982 66 326 19 898 30 o 147 810 68 708 46 5 1983 111 726 38 058 31 4 147 810 72 143 48 8
Source Fortunato Jayme A Report on the Phil1ppine Starch Industry 1982
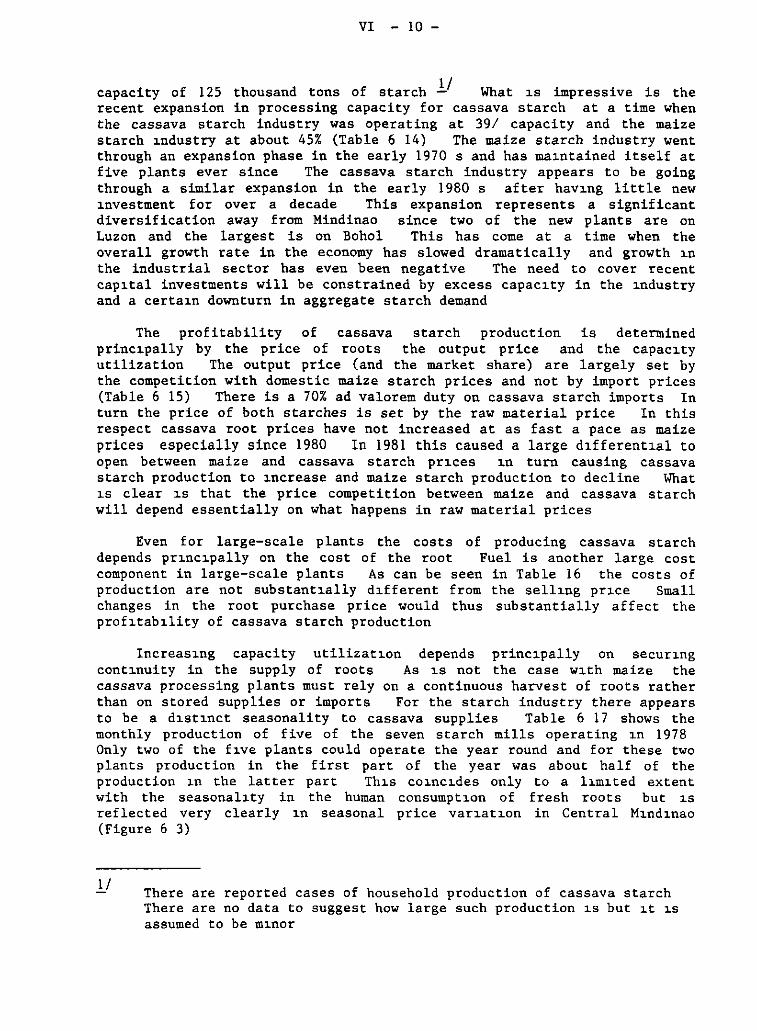
VI - 10 -
1/ capacity of 125 thousand tons of starch - What l.S impressive is the recent expansion in processing capacity for cassava starch at a time when the cassava starch industry was operating at 39/ capacity and the maize starch J.ndustry at about 45% (Table 6 14) The maize starch industry went through an expansion phase in the early 1970 s and has mal.ntained itself at five plants ever since The cassava starch industry appears to be going through a similar expansion in the early 1980 s after hav1ng little new J.nvestment for over a decade This expansion representa a significant diversification away from Mindinao since two of the new plants are on Luzon and the largest is on Bohol This has come at a time when the overall growth rate in the economy has slowed dramatically and growth 1n the industrial sector has even been negative The need to cover recent capl.tal investments will be constrained by excess capacJ.ty in the 1ndustry and a certa1n downturn in aggregate starch demand
The profitability of cassava starch production is determined princl.pally by the price of roots the output price and the capacl.ty utilization The output price (and the market share) are largely set by the competition with domestic maize starch prices and not by import prices (Table 6 15) There is a 70% ad valorem duty on cassava starch imports In turn the price of both starches is set by the raw material price In this respect cassava root prices have not increased at as fast a pace as maize prices especially since 1980 In 1981 this caused a large d1fferent1al to open between maize and cassava starch pr1ces l.n turn causing cassava starch production to l.ncrease and maize starch production to decline What l.S clear l.S that the price competition between maize and cassava starch will depend essentially on what happens in raw material prices
Even for large-scale plants the costs of producing cassava starch depends pr1nc1pally on the cost of the root Fuel is another large cost component in large-scale plants As can be seen in Table 16 the costs of production are not substant1ally d1fferent from the sell1ng prl.ce Small changes in the root purchase price would thus substantially affect the prof1tab1lity of cassava starch production
Increasl.ng capacity utilizatJ.on dependa princl.pally on securl.ng contJ.nuity in the supply of roots As l.S not the case wJ.th maize the cassava processing plants must rely on a continuous harvest of roots rather than on stored supplies or imports For the starch industry there appears to be a dl.Stl.nct seasonality to cassava supplies Table 6 17 shows the monthly production of five of the seven starch mills operating J.n 1978 Only two of the fJ.ve plants could operate the year round and for these two plants production in the first part of the year was about half of the production l.n the latter part Thl.s coJ.ncJ.des only to a ll.ml.ted extent with the seasonall.ty in the human consumptl.on of fresh roots but l.S reflected very clearly l.n seasonal price varJ.atJ.on in Central MJ.ndJ.nao (Figure 6 3)
l./ There are reported cases of household production of cassava starch There are no data to suggest how large such production l.S but J.t l.S assumed to be m1nor
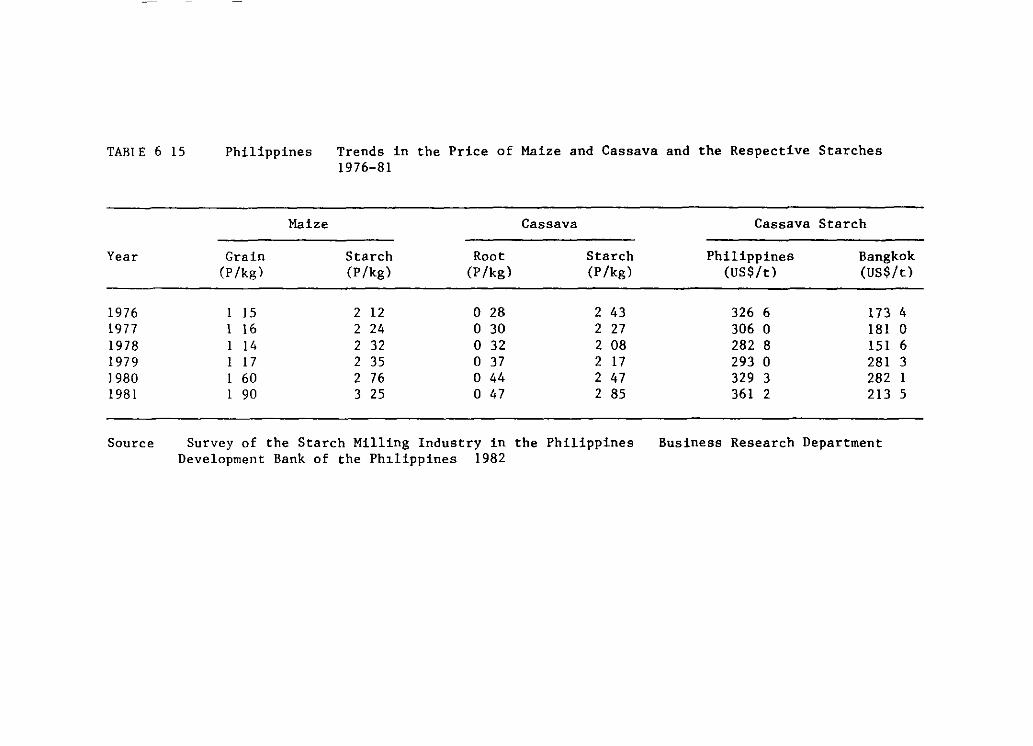
TABIE 6 15 Philippines Trends in the Price of Maize and Cassava and the Respective Starches 1976-81
Year
1976 1977 1978 1979 1980 1981
Grain (P/kg)
1 15 1 16
14 17 60 90
Maize
Starch (P/kg)
2 12 2 24 2 32 2 35 2 76 3 25
Cassava
Root Starch (P /kg) (P/kg)
o 28 2 43 o 30 2 27 o 32 2 08 o 37 2 17 o 44 2 47 o 47 2 85
Source Survey of the Starch Milling Industry in the Philippines Development Bank of the Ph1lippines 1982
Cassava Starch
Philippines Bangkok (US$/t) (US$/t)
326 6 173 4 306 o 181 o 282 8 151 6 293 o 281 3 329 3 282 1 361 2 213 5
Business Research Department
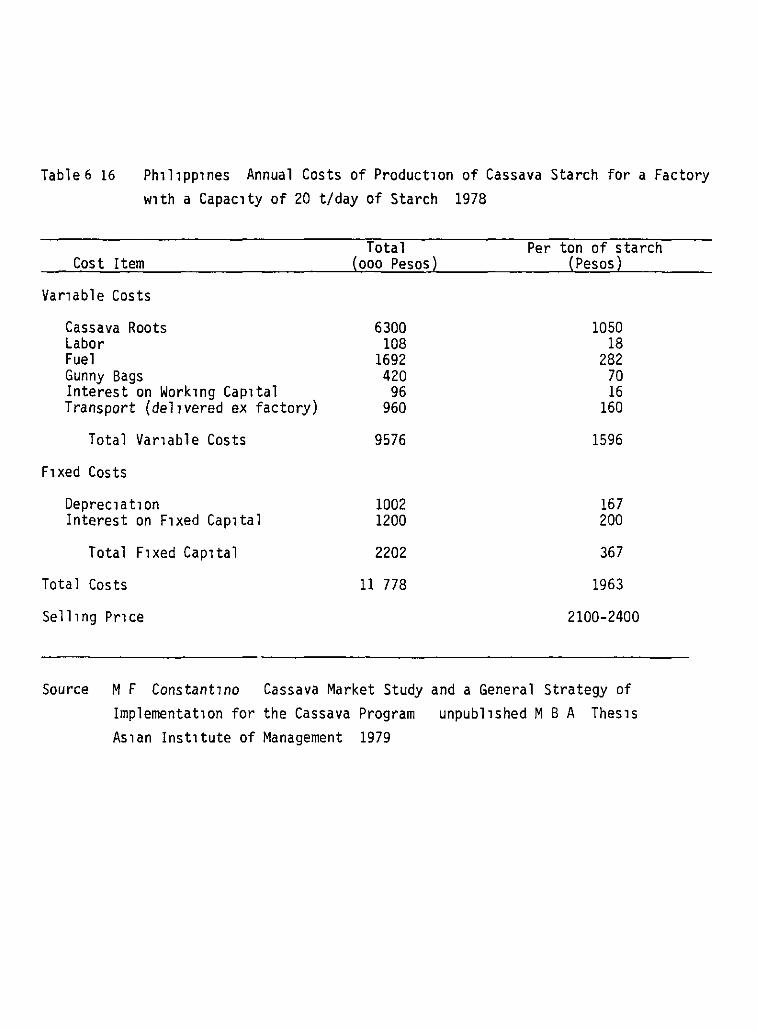
Table 6 16 Ph1l1pp1nes Annual Costs of Product1on of Cassava Starch for a Factory w1th a Capac1ty of 20 t/day of Starch 1978
Cost Item
Var1able Costs
Cassava Roots Labor Fuel Gunny Bags Interest on Work1ng Cap1tal Transport (del1vered ex factory)
Total Var1able Costs
F1 xed Cos ts
Deprec1at1on Interest on F1xed Cap1tal
Total F1xed Cap1tal
Total Costs
Sel llng Pnce
Total (ooo Pesos)
6300 108
1692 420
96 960
9576
1002 1200
2202
11 778
Per ton of starch (Pesos)
1050 18
282 70 16
160
1596
167 200
367
1963
2100-2400
Source M F Constant1no Cassava Market Study and a General Strategy of Implementat1on for the Cassava Program unpubl1shed M B A Thes1s As1an Inst1tute of Management 1979
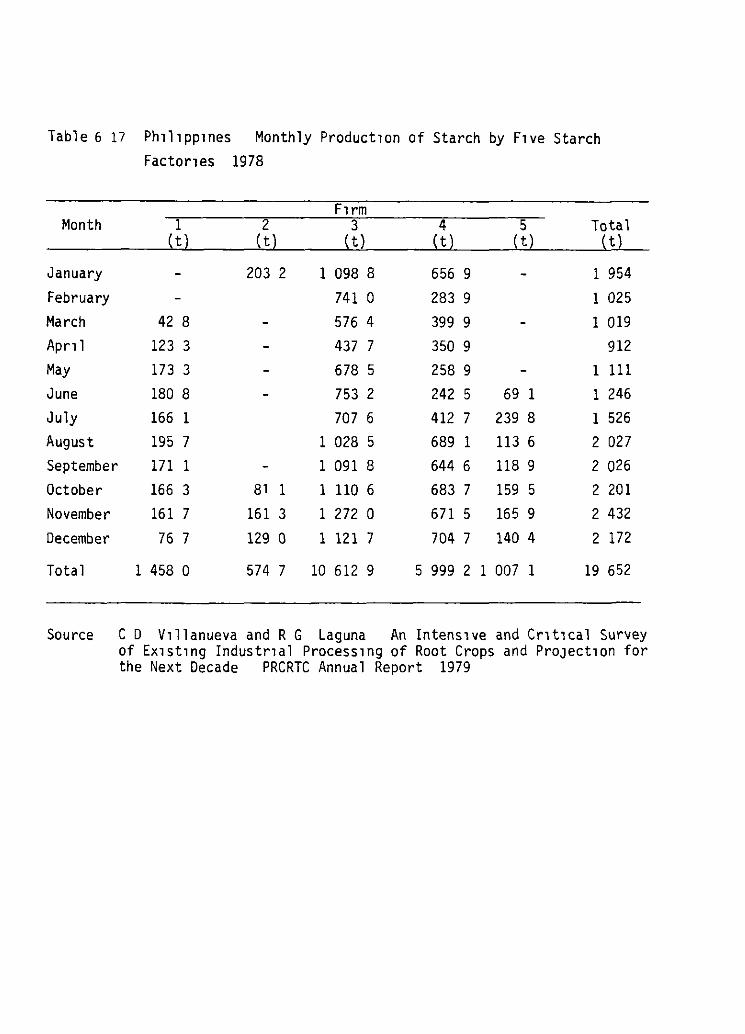
Table 6 17 Ph1l1pp1nes Monthly Product1on of Starch by F1ve Starch Faetones 1978
F1rm Month 1 2 3 4 5 Total
(t) (t) (t) (t) (t) (t)
January 203 2 1 098 8 656 9 1 954 February 741 o 283 9 1 025 March 42 8 576 4 399 9 1 019 Apnl 123 3 437 7 350 9 912 M ay 173 3 678 5 258 9 1 111 June 180 8 753 2 242 5 59 1 1 246 July 166 1 707 6 412 7 239 8 1 526 August 195 7 1 028 5 689 1 113 6 2 027 September 171 1 1 091 8 644 6 118 9 2 026 October 166 3 81 1 1 110 6 583 7 159 5 2 201
November 151 7 161 3 1 272 o 671 5 165 9 2 432
December 76 7 129 o 1 121 7 704 7 140 4 2 172
Total 1 458 o 574 7 10 612 9 5 999 2 1 007 1 19 652
Source C D V1llanueva and R G Laguna An Intens1ve and Cr1t1cal Survey of Ex1st1ng Industr1al Process1ng of Root Crops and ProJect1on for the Next Decade PRCRTC Annual Report 1979
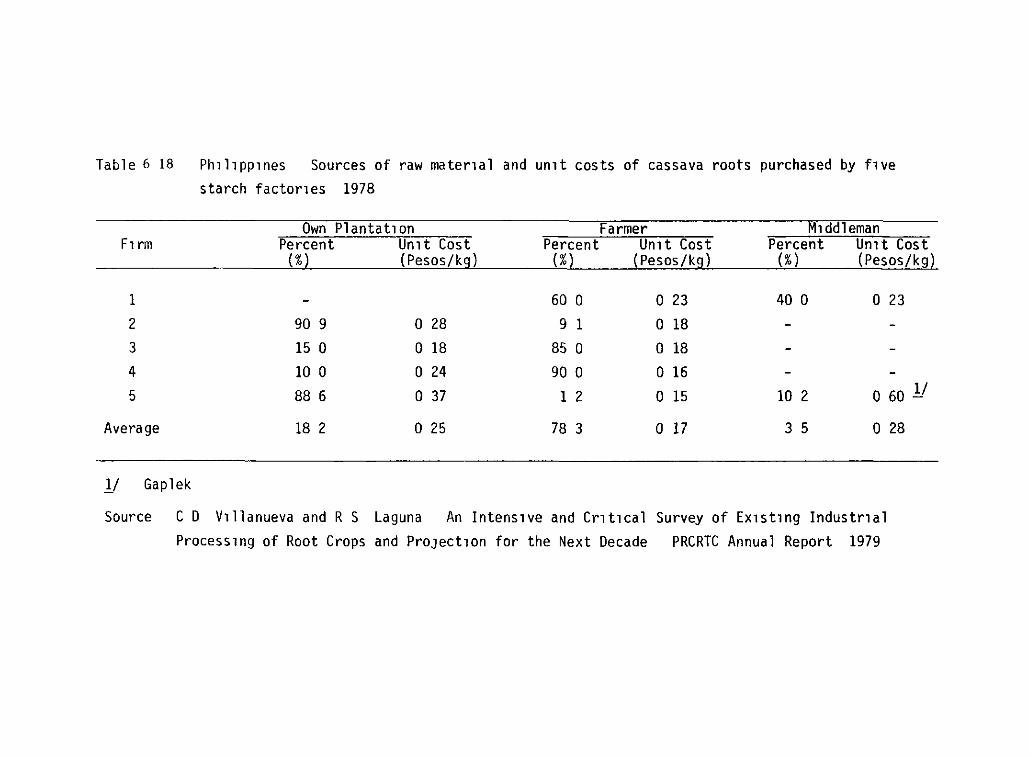
Table 6 18 Ph1l1pp1nes Sources of raw mater1al and un1t costs of cassava roots purchased by f1ve starch factor1es 1978
Own Plantat1on Farmer M1ddleman F1 rm Percent Un1t Cost Percent Umt Cost Percent Un1t Cost
(%) (Pesos/kg) (%) (Pesos/kg) (%) (Pesos/kg)
1 - 60 o o 23 40 o o 23
2 90 9 o 28 9 1 o 18 3 15 o o 18 85 o o 18 4 100 o 24 90 o o 16 5 88 6 o 37 1 2 o 15 10 2 o 60 y
Average 18 2 o 25 78 3 o 17 3 5 o 28
y Gaplek
Source C D V1llanueva and R S Laguna An Intens1ve and Cr1t1cal Survey of Ex1st1ng Industr1al Process1ng of Root Crops and ProJeCtlon for the Next Decade PRCRTC Annual Report 1979
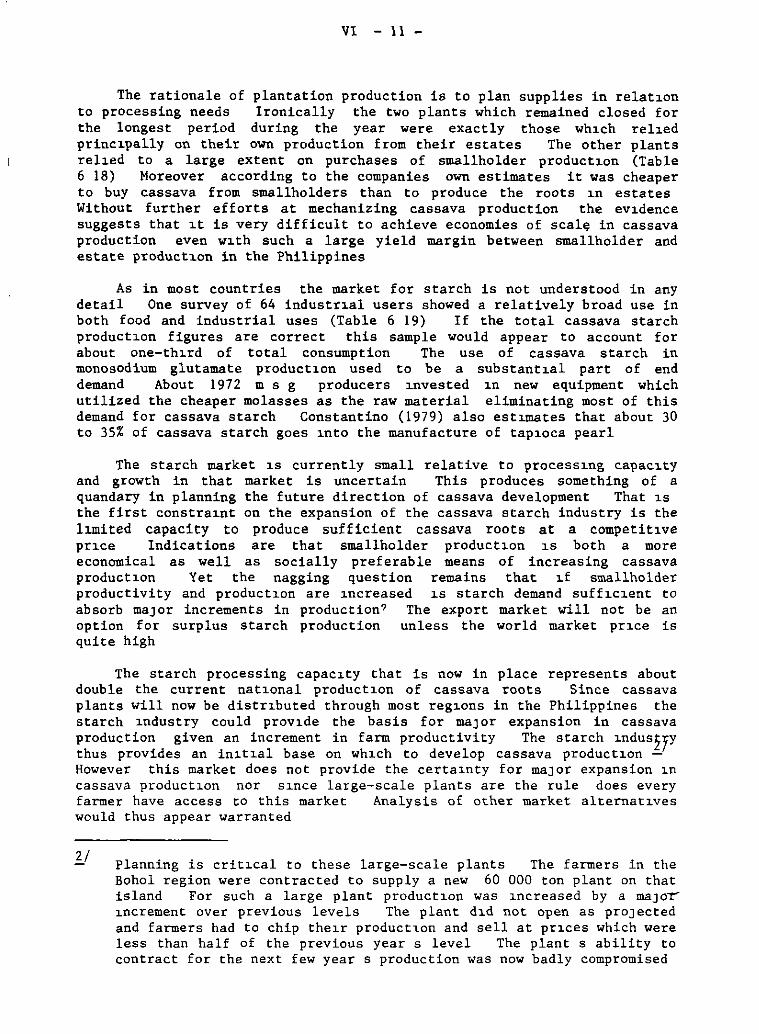
VI - ll -
The rationale of plantation production is to plan supplies in relat1on to processing needs Ironically the two plants which remained closed for the longest period during the year were exactly those wh1ch rel1ed princ1pally on their own production from their estates The other plants rel1ed to a large extent on purchases of smallholder product1on (Table 6 18) Moreover according to the companies own estimates it was cheaper to buy cassava from smallholders than to produce the roots 1n estates Without further efforts at mechanizing cassava production the ev1dence suggests that 1t is very difficult to achieve economies of sea!~ in cassava production even w1th such a large yield margin between smallholder and estate product1on in the Philippines
As in most countries the market for starch is not understood in any detail One survey of 64 industr1al users showed a relatively bread use in both food and industrial uses (Table 6 19) If the total cassava starch product1on figures are correct this sample would appear to account for about one-th1rd of total consumption The use of cassava starch in monosodium glutamate product1on used to be a substant1al part of end demand About 1972 m s g producers 1nvested 1n new equipment which utilized the cheaper molasses as the raw material eliminating most of this demand for cassava starch Constantino (1979) also est1mates that about 30 to 35% of cassava starch goes 1nto the manufacture of tap1oca pearl
The starch market 1s currently small relative to process1ng capac1ty and growth in that market is uncertain This produces something of a quandary in planning the future direction of cassava development That 1s the first constra1nt on the expansion of the cassava starch industry is the l1mited capacity to produce sufficient cassava roots at a competit1ve pr1ce Indications are that smallholder product1on 1s both a more economical as well as socially preferable means of increasing cassava product1on Yet the nagging question remains that 1f smallholder productivity and product1on are 1ncreased 1s starch demand suff1c1ent to absorb maJor incrementa in production? The export market will not be an option for surplus starch production unless the world market pr1ce is quite high
The starch processing capac1ty that is now in place representa about double the current nat1onal product1on of cassava roots Since cassava plants will now be distr1buted through most reg1ons in the Philippines the starch 1ndustry could prov1de the basis for maJor expansion in cassava production given an increment in farm productivity The starch 1ndus~yy thus provides an in1t1al base on wh1ch to develop cassava product1on -However this market does not provide the certa1nty for ma]or expansion 1n cassava product1on nor s1nce large-scale plants are the rule does every farmer have access to this market Analysis of other market alternat1ves would thus appear warranted
Planning is crit1cal to these large-scale plants The farmers in the Bohol region were contracted to supply a new 60 000 ton plant on that island For such a large plant product1on was 1ncreased by a maJor 1ncrement over previous levels The plant d1d not open as proJected and farmers had to chip the1r productcon and sell at pr1ces which were less than half of the previous year s level The plant s ability to contract for the next few year s production was now badly compromised
VI - 12 -
The dr1ed chip market
Gaplek-type dried chips are produced in the Philipp1nes but production has never been large enough or suff1c1ently cont1nuous to allow the development of a broad-based market Chip product1on is based in the Visayas and Mindinao areas and principally serves as a means of vent1ng fresh root surpluses where there are constra1nts on access to fresh markets Prices tend to be cheaper than their fresh root equivalent and chips are absorbed as cheap substitutes in industr1es such as feed concentrates starch (for making glucose) and flour (for noddles and non-leavened bakery products) In general prices are too low at current yields to provide incentives for increases in ch1p product1on Currently chips are the market of last resort for roots that need to be harvested or
once harvested have no ready market High fresh market prices have tended to inhibit the consoladation of a cassava ch1p market
However the question is what would be the potential market for cassava chips if market channels were better developed and root yields were increased? Like a host of other tropical wheat-import1ng countries the Philippines has for a long time had a law which required that wheat flours be substituted with domestically produced flour up to a m1nimum of 10% Cassava flour was assumed to be the alternat1ve flour with the most promise The law prompted the establishment of at least one cassava flour m1ll on Luzon The mill never operated at capacity and it was never poss1ble for the wheat flour 1ndustry to meet the requ1rements of the law s1nce sufficient cassava flour at a remunerative pr1ce was never available As w1th similar laws in other countries the market was potentially large but cassava flour could not be produced at a competitive pr1ce
The composite flour market offers potential 1f cassava chip prices can be reduced but exper1ence has shown that basing a cassava ch1p industry on m1xed feeds presenta far fewer organizational constra1nts (as well as quality problema) than developing cassava ch1ps for a composite flour 1ndustry In the last decade there has been a structural change in the poultry industry as production has shifted from small-scale un1ts to large vertically integrated commercial operations Meat production from these operations has tripled in the last decade (Table 6 20) Such structural change has spawned rap1d growth in the feed concentrate industry and the production of m1xed feeds has increased at an annual rate of 12 24 over the last decade (Table 6 21) Of total product1on of the mixed feed 1ndustry 701.. goes to poultry while the other 301.. is swine feed (Table 6 22) A pr1nc1pal feature or the industry however 1s 1t locus on Luzon where 907 of mixed feeds are produced Since the locus of cassava ch1p product1on 1s 1n the South 1nter-1sland transport costs w1ll be a ma)or cost component affect1ng the farm-level ch1p price
Growth 1n 1ndustr1al demand for maize has caused a fundamental change 1n the structure of the ma1ze market (Table 6 23) Although ma1ze product1on has 1ncreased at the very respectable rate of 4 34 per annum over the last decade 1ncreased use of maize for feed and for starch even with decl1ning per capita consumption of maize has enta1led a rising level of 1mports Moreover maize product1on has stagnated over the past three to four years ra1s1ng concerns that 1mports w1ll have to 1ncrease even
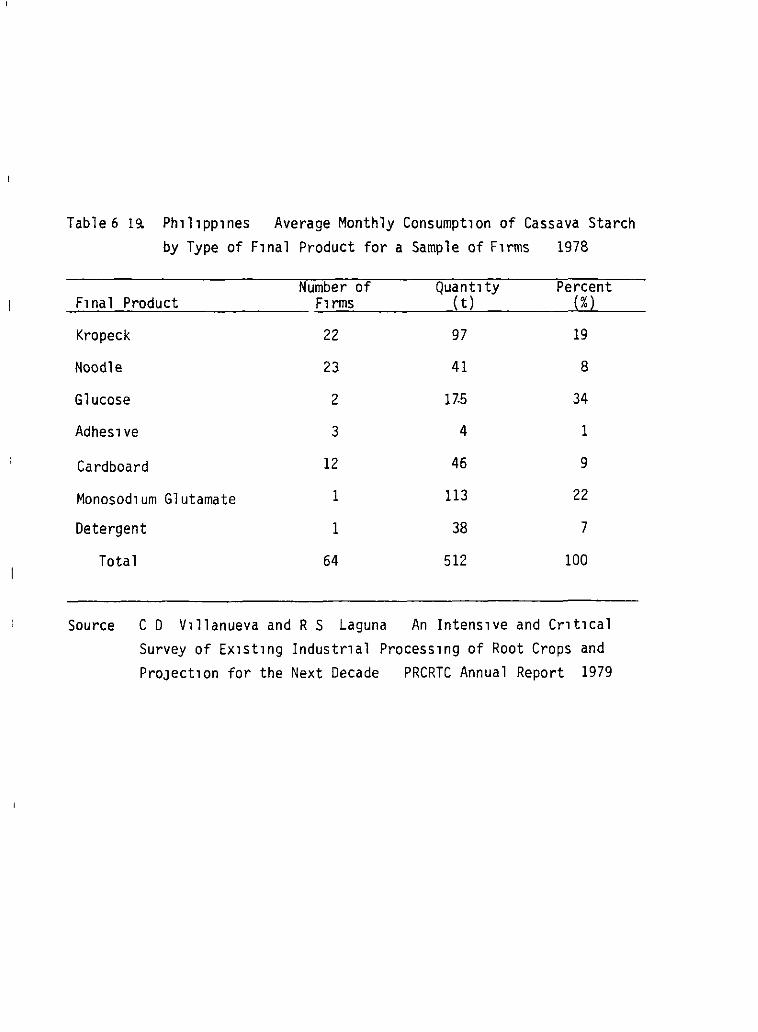
Table 6 19. Ph1l1pp1nes Average Monthly Consumpt1on of Cassava Starch by Type of F1nal Product for a Sample of F1rms 1978
Number of Quant1ty Percent F1nal Product F1rms ( t) (%)
Kropeck 22 97 19
Noodle 23 41 8
Glucose 2 17.5 34
Adhes1ve 3 4 1
Cardboard 12 46 9
Monosod1um Glutamate 1 113 22
Detergent 1 38 7
Total 64 512 100
Source C D V1llanueva and R S Laguna An Intens1ve and Cr1t1cal Survey of Ex1st1ng Industr1al Process1ng of Root Crops and ProJeCtlon for the Next Decade PRCRTC Annual Report 1979
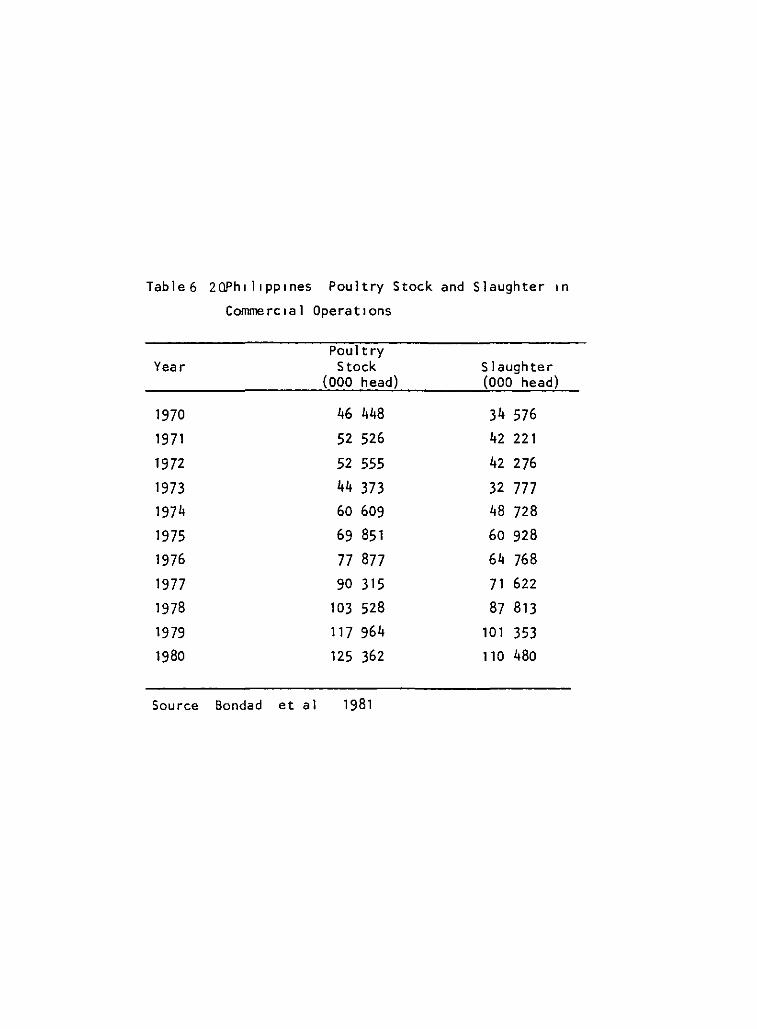
Tab 1 e 6 2 OPh 1 1 1 pp 1 nes Poultry Stock and S 1 aughter 1 n
Commerc 1a 1 Operat1ons
Poultry Year Stock S 1 aughter
(000 head) (000 head)
1970 46 448 34 576 1971 52 526 42 221
1972 52 555 42 276
1973 44 373 32 777 1974 60 609 48 728
1975 69 851 60 928
1976 77 877 64 768
1977 90 315 71 622
1978 103 528 87 813
1979 117 964 101 353 1980 125 362 110 480
Source Bondad et al 1981
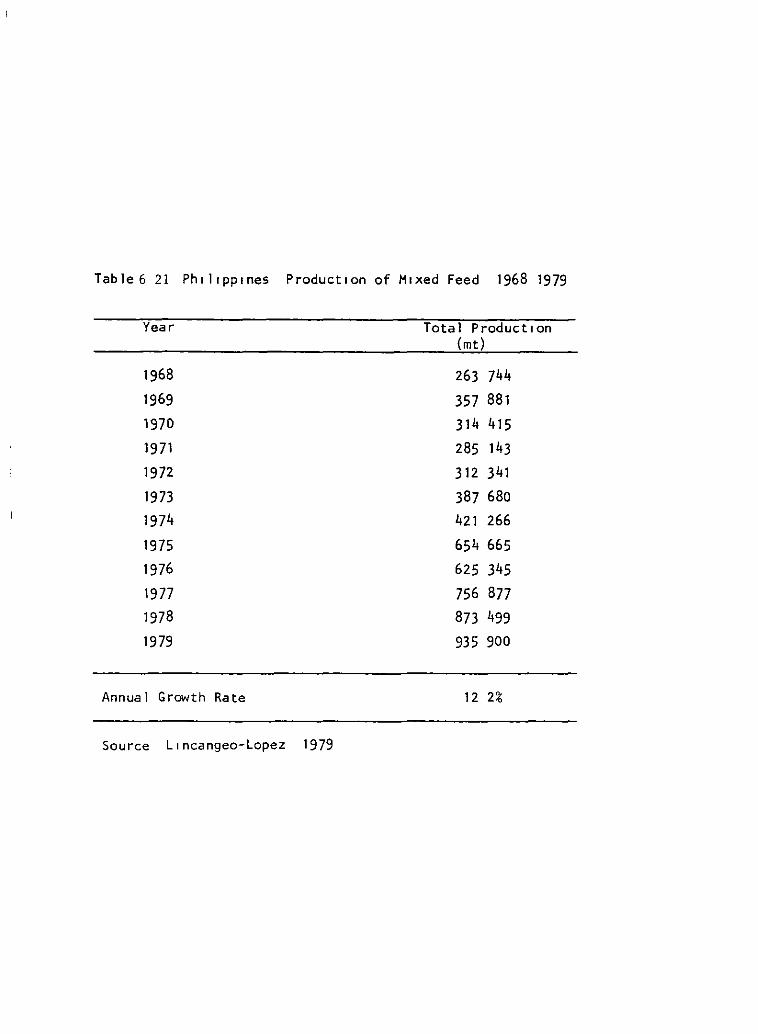
Table 6 21 Ph111pp1nes ProductJon of M1xed Feed 1968 1979
Year Total Product1on (mt)
1968 263 744 1969 357 881 1970 314 415 1971 285 143
1972 312 341
1973 387 680 1974 421 266
1975 654 665 1976 625 345 1977 756 877 1978 873 499 1979 935 900
Annual Growth Rate 12 2%
Source L•ncangeo-Lopez 1979
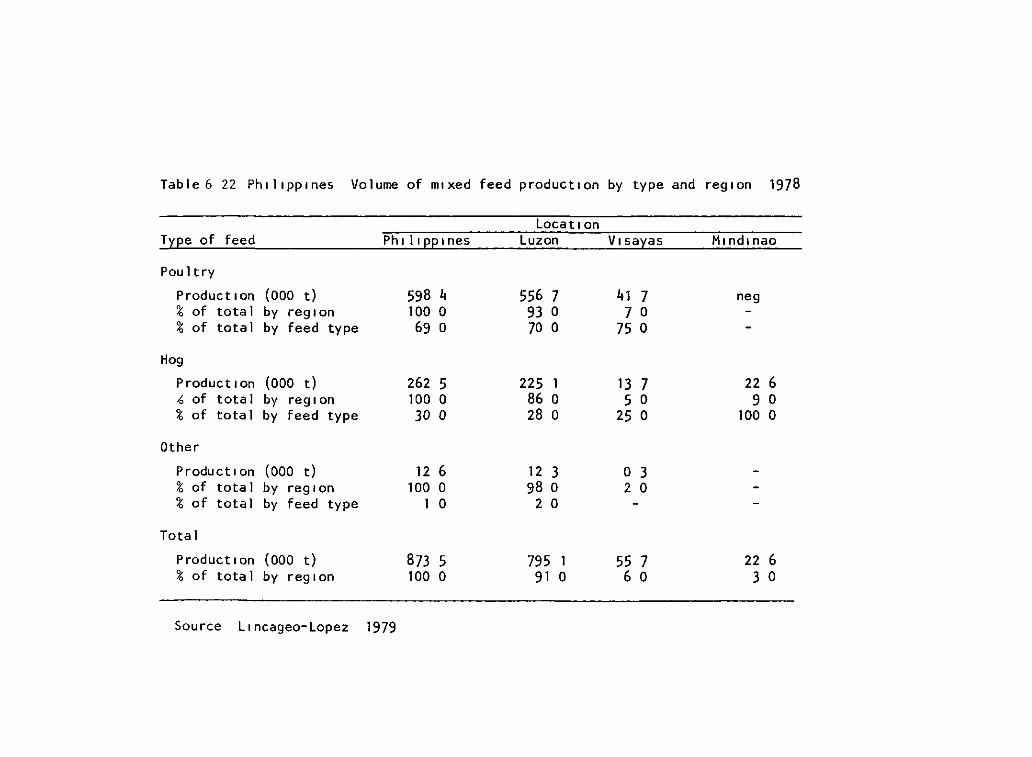
Table 6 22 Ph1l1pp1nes Volume of m1xed feed product1on by type and reg1on 1978
Locat1 on Ty~e of feed Ph 1 11 ~~ 1 nes Luzon V1sayas M1nd1nao
Pou 1 try
Product1on (000 t) 598 l¡ 556 7 1¡1 7 neg % of total by reg1on 100 o 93 o 7 o % of total by feed type 69 o 70 o 75 o
Hog
Product1on (000 t) 262 5 225 1 13 7 22 6 ~ of total by reg1on 100 o 86 o 5 o 9 o % of total by feed type 30 o 28 o 25 o 100 o
Other
Product1on (000 t) 12 6 12 3 o 3 % of total by reg1on 100 o 98 o 2 o % of total by feed type 1 o 2 o
Total
Product1on (000 t) 873 5 795 1 55 7 22 6 % of total by reg1on 100 o 91 o 6 o 3 o
So urce Llncageo-Lopez 1979
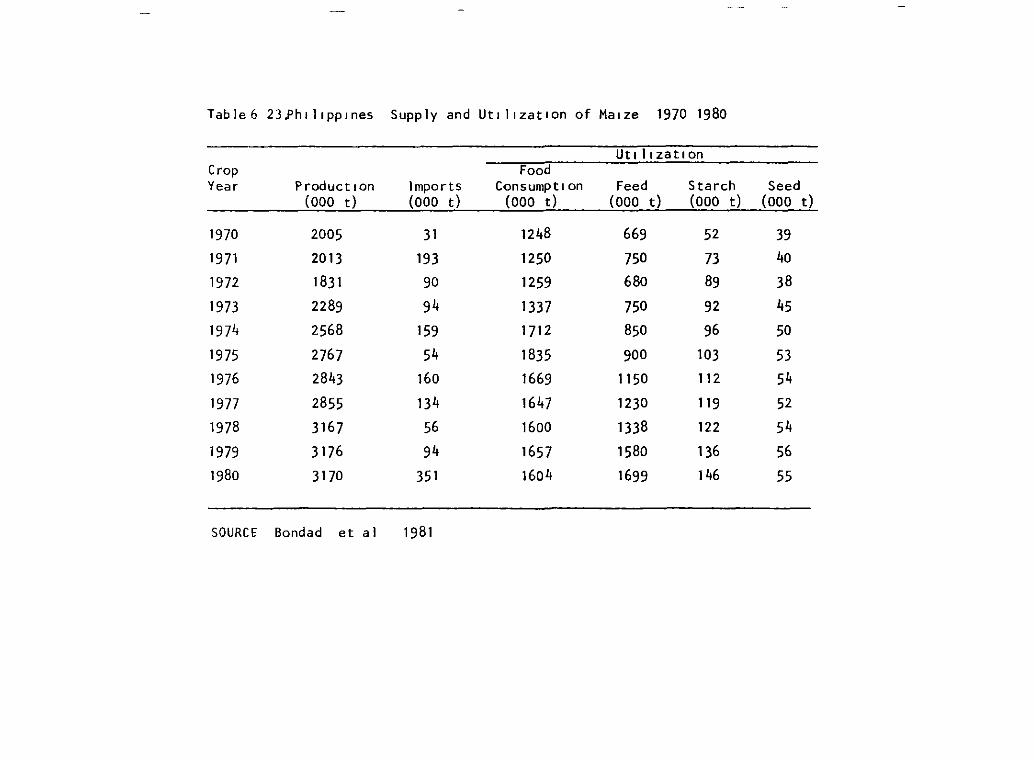
Table 6 23.Phlllpplnes Supply and Ut1 J¡zatlon of Ma1ze 1970 1980
Ut¡J¡zatlon Crop Food Year Productlon lmports Consumptl on Feed Starch Seed
(000 t) ( 000 t) (000 t) (000 t) ( 000 t) (000 t)
1970 2005 31 1248 669 52 39 1971 2013 193 1250 750 73 40
1972 1831 90 1259 680 89 38
1973 2289 94 1337 750 92 45
1974 2568 159 1712 850 96 50
1975 2767 54 1835 900 103 53 1976 2843 160 1669 1150 112 54
1977 2855 134 1647 1230 119 52 1978 3167 56 1600 1338 122 54
1979 3176 94 1657 1580 136 56 1980 3170 351 1604 1699 146 55
SOURCE Bondad et al 1981
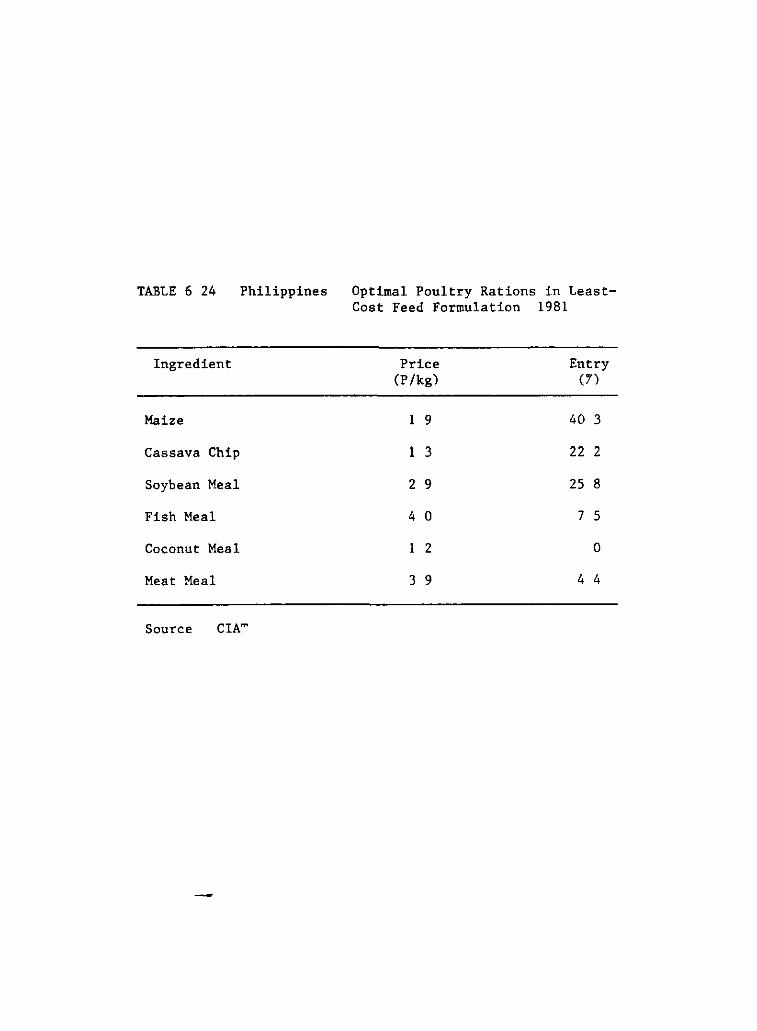
TABLE 6 24 Philippines
Ingredient
Maize
Cassava Chip
Soybean Me al
Fish Meal
Coconut Meal
Meat Meal
Source erA~
Optimal Poultry Rations in LeastCost Feed Formulation 1981
Price Entry (P/kg) 0')
1 9 40 3
1 3 22 2
2 9 25 8
4 o 7 S
1 2 o
3 9 4 4
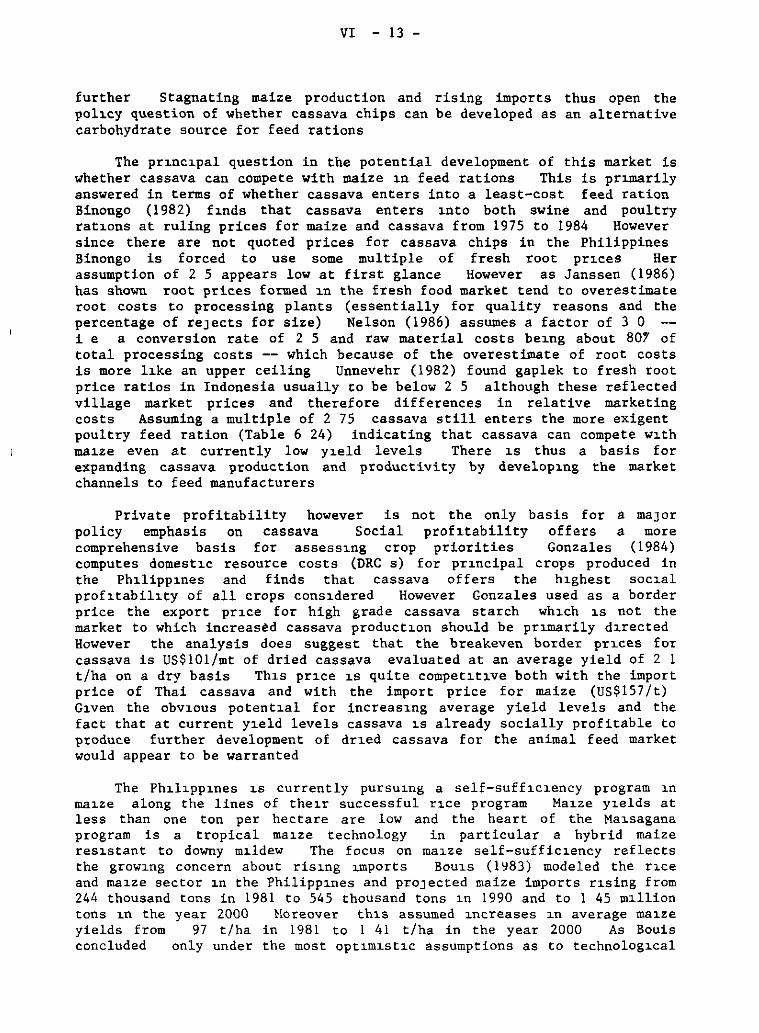
VI - 13 -
further Stagnating maize production and rising imports thus open the pol~cy question of whether cassava chips can be developed as an alternativa carbohydrate source for feed rations
The pr~nc~pal question in the potential development of this market is whether cassava can compete with maize ~n feed rations This is pr~marily answered in terms of whether cassava enters into a least-cost feed ration Binongo (1982) f~nds that cassava enters ~nto both swine and poultry rat~ons at ruling prices for maize and cassava from 197S to 1984 However since there are not quoted prices for cassava chips in the Philippines Binongo is forced to use some multiple of fresh root pr~ces Her assumption of 2 S appears low at first glance However as Janssen (1986) has shown root prices formed ~n the fresh food market tend to overestimate root costs to processing plants (essentially for quality reasons and the percentage of reJects for size) Nelson (1986) assumes a factor of 3 O i e a conversion rate of 2 S and raw material costs be~ng about 801' of total processing costs -- which because of the overestimate of root costs is more l~ke an upper ceiling Unnevehr (1982) found gaplek to fresh root price ratios in Indonesia usually to be below 2 S although these reflectad village market prices and therefore differences in relativa marketing costs Assuming a multiple of 2 7S cassava still enters the more exigent poultry feed ration (Table 6 24) indicating that cassava can compete w~th ma~ze even at currently low y~eld levels There ~s thus a basis for expanding cassava production and productivity by develop~ng the market channels to feed manufacturera
Private profitability however is not the only basis for a ma]or policy emphasis on cassava Social profHability offers a more comprehensive basis for assess~ng crop priorities Gonzales (1984) computes domest~c resource costs (DRC s) for pr~ncipal crops produced in the Ph~lipp1nes and finds that cassava offers the h1ghest soc~al
prof~tabil~ty of all crops cons~dered However Gonzales used as a border price the export pr~ce for high grade cassava starch wh~ch ~s not the market to which increas~d cassava product~on should be pr~marily d1rected However the analysis does suggest that the breakeven border pr1ces for cassava is US$101/mt of dried cassava evaluated at an average yield of 2 1 t/ha on a dry basis Th1s pr1ce ~s quite compet1t1ve both with the import price of Thai cassava and with the import price for maize (US$157 /t) G1ven the obv1ous potent1al for increas1ng average yield levels and the fact that at current y1eld levels cassava ~s already socially profitable to produce further development of dr1ed cassava for the animal feed market would appear to be warranted
The Ph1l~pp1nes ~s currently pursu~ng a self-suff~c~ency program 1n ma~ze along the lines of the~r successful r1ce program Ma~ze y1elds at less than one ton per hectare are low and the heart of the Ma1sagana program is a tropical ma1ze technology in particular a hybrid maize res1stant to downy m1ldew The focus on ma12e self-suffic1ency reflecta the grow1ng concern about ris1ng ~mports Bou1s (1 Y83) modeled the r1ce and ma1ze sector 1n the Philipp1nes and proJected maize importa r1sing from 244 thousand tons in 1981 to 545 thousand tons 1n 1990 and to 1 45 m1llion tons 1n the year 2000 yields from 97 t/ha concluded only under
Horeover th1.s assumed 1.ncreases 1.n average ma1.ze in 1981 to 1 41 t/ha in the year 2000 As Bouis the most opt1m1st1c assumptions as to technolog1cal
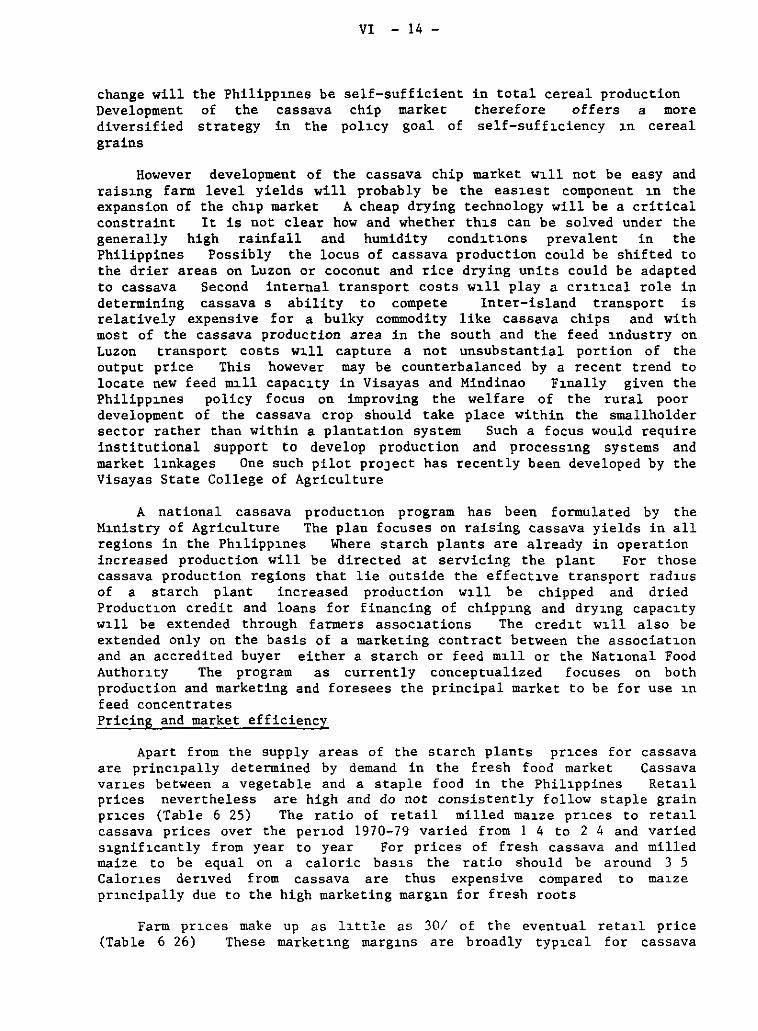
change will Development diversified grains
VI - 14 -
the Philipp~nes be self-sufficient of the cassava chip market strategy in the pohcy goal of
in total cereal production therefore offers a more self-suff~ciency ~n cereal
However development of the cassava chip market w~ll not be easy and rais~ng farm level yields will probably be the eas~est component ~n the expansion of the ch~p market A cheap drying technology will be a critical constraint It is not clear how and whether th~s can be solved under the generally high rainfall and humidity condLt~ons prevalent in the Philippines Possibly the locus of cassava production could be shifted to the drier areas on Luzon or coconut and rice drying units could be adapted to cassava Second internal transport costs w~ll play a cr~t~cal role in determining cassava s ability to compete Inter-island transport is relatively expensive for a bulky commodity like cassava chips and with most of the cassava production area in the south and the feed ~ndustry on Luzon transport costs Wl.ll capture a not unsubstantial portion of the output price This however may be counterbalanced by a recent trend to locate new feed ~11 capacJ.ty in Visayas and Mindinao Fl.nally given the Philipp~nes policy focus on improving the welfare of the rural poor development of the cassava crop should take place within the smallholder sector rather than within a plantation system Such a focus would require institutional support to develop production and processl.ng systems and market l~nkages One such pilot proJect has recently been developed by the Visayas State College of Agriculture
A national cassava product~on program has been formulated by the M~nistry of Agriculture The plan focuses on raising cassava yields in all regions in the Ph~lipp~nes Where starch plants are already in operation increased production will be directed at servicing the plant For those cassava production regions that lie outside the effect~ve transport rad~us of a starch plant increased production w~ll be chipped and dried Product~on credit and loans for financing of chipp~ng and dry~ng capac~ty w~ll be extended through farmers assoc~ations The cred~t w~ll also be extended only on the basis of a marketing contract between the associat~on and an accredited buyer either a starch or feed m~ll or the Nat~onal Food Author~ty The program as currently conceptualized focuses on both production and marketing and foresees the principal market to be for use ~n feed concentrates Pricing and market efficiency
Apart from the supply areas of the starch plants pr~ces for cassava are princ~pally determined by demand in the fresh food market Cassava var~es between a vegetable and a staple food in the Phil~ppines Retal.l prices nevertheless are high and do not consistently follow staple grain pr~ces (Table 6 25) The ratio of retail milled ma1Ze pr1.ces to reta1.l cassava prices over the per~od 1970-79 varied from 1 4 to 2 4 and varied s1.gnif~cantly from year to year For prices of fresh cassava and milled maize to be equal on a caloric bas1.s the ratio should be around 3 S Calor1.es der1.ved from cassava are thus expensive compared to ma~ze
pr~ncipally due to the high marketing marg~n for fresh roots
Farm pr1.ces make up as lütle as 30/ of the eventual reta~l price (Table 6 26) These market~ng marg1.ns are broadly typ~cal for cassava
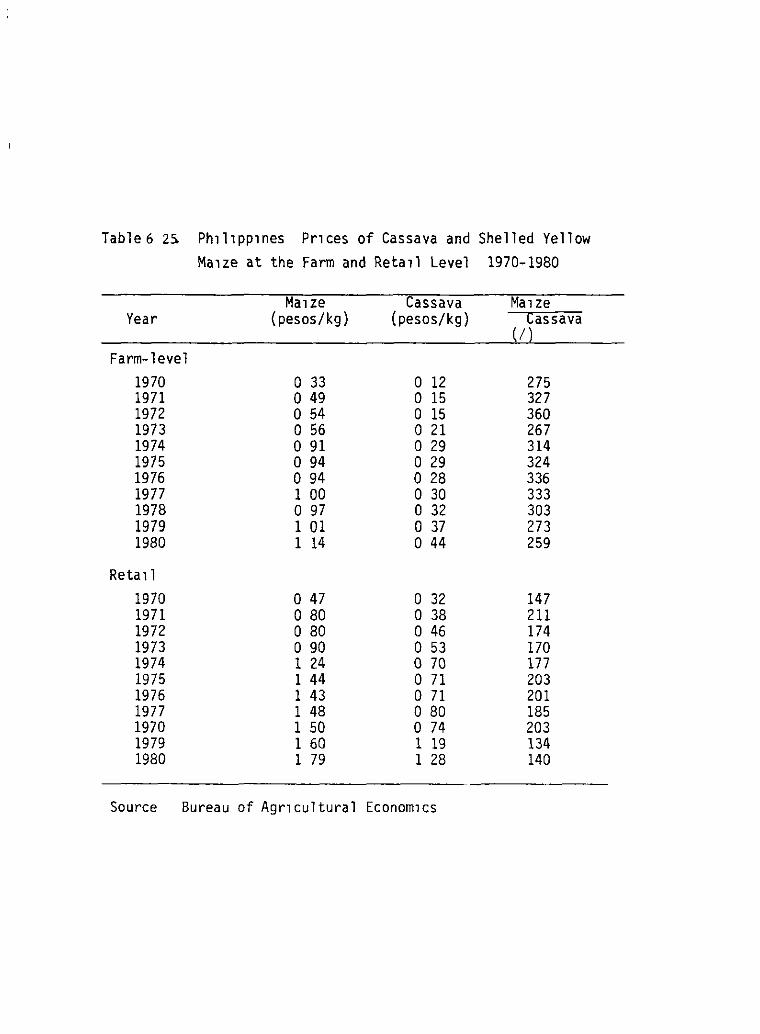
Table 6 25. Ph1l1pp1nes Pr1ces of Cassava and Shelled Yellow Ma1ze at the Farm and Reta1l Level 1970-1980
MalZe Cassava Ma1 ze Year {pesos/kg) (pesos/kg) Cassava
(1
Farm-level 1970 o 33 o 12 275 1971 o 49 o 15 327 1972 o 54 o 15 360 1973 o 56 o 21 267 1974 o 91 o 29 314 1975 o 94 o 29 324 1976 o 94 o 28 336 1977 1 00 o 30 333 1978 o 97 o 32 303 1979 1 01 o 37 273 1980 1 14 o 44 259
Reta 11 1970 o 47 o 32 147 1971 o 80 o 38 211 1972 o 80 o 46 174 1973 o 90 o 53 170 1974 1 24 o 70 177 1975 1 44 o 71 203 1976 1 43 o 71 201 1977 1 48 o 80 185 1970 1 50 o 74 203 1979 1 60 1 19 134 1980 1 79 1 28 140
So urce Bureau of Agr1cultural Econom1cs
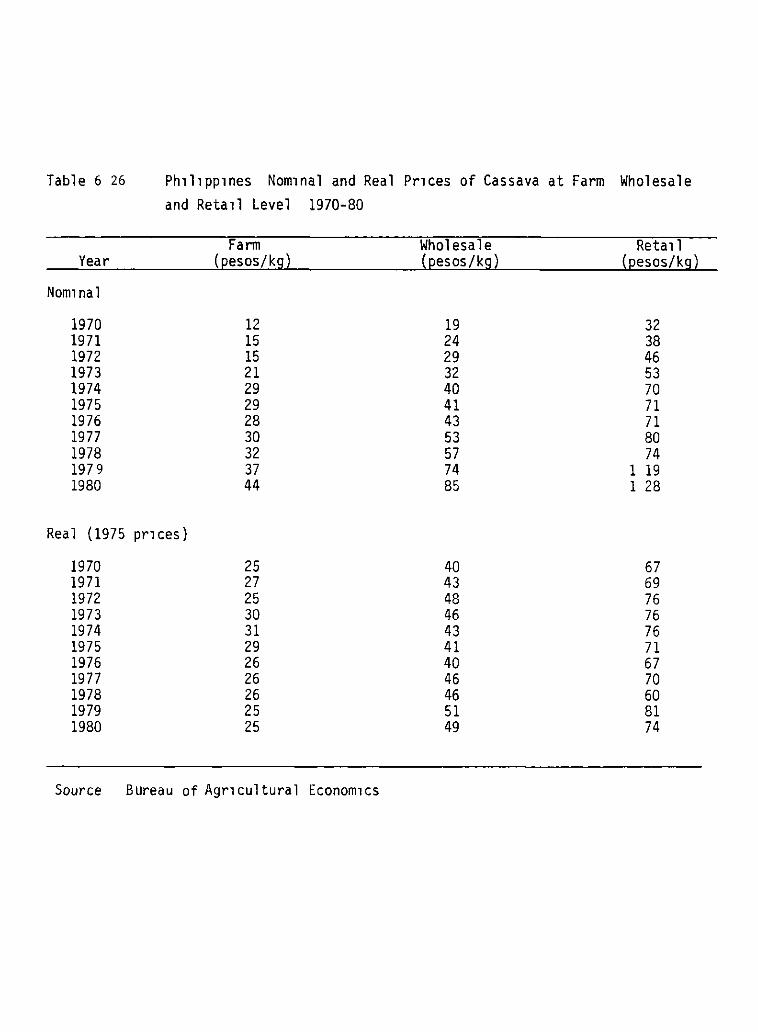
Table 6 26 Ph1l1pp1nes Nom1nal and Real Pr1ces of Cassava at Farm Wholesale and Reta1l Level 1970-80
Farm Wholesale Reta1l Year (pesos/kg) (pesos/kg) (pesos/kg)
Nom1nal
1970 12 19 32 1971 15 24 38 1972 15 29 46 1973 21 32 53 1974 29 40 70 1975 29 41 71 1976 28 43 71 1977 30 53 80 1978 32 57 74 197 9 37 74 1 19 1980 44 85 1 28
Real (1975 pr1 ces)
1970 25 40 67 1971 27 43 69 1972 25 48 76 1973 30 46 76 1974 31 43 76 1975 29 41 71 1976 26 40 67 1977 26 46 70 1978 26 46 60 1979 25 51 81 1980 25 49 74
Source Bureau of Agr1cultural Econom1cs
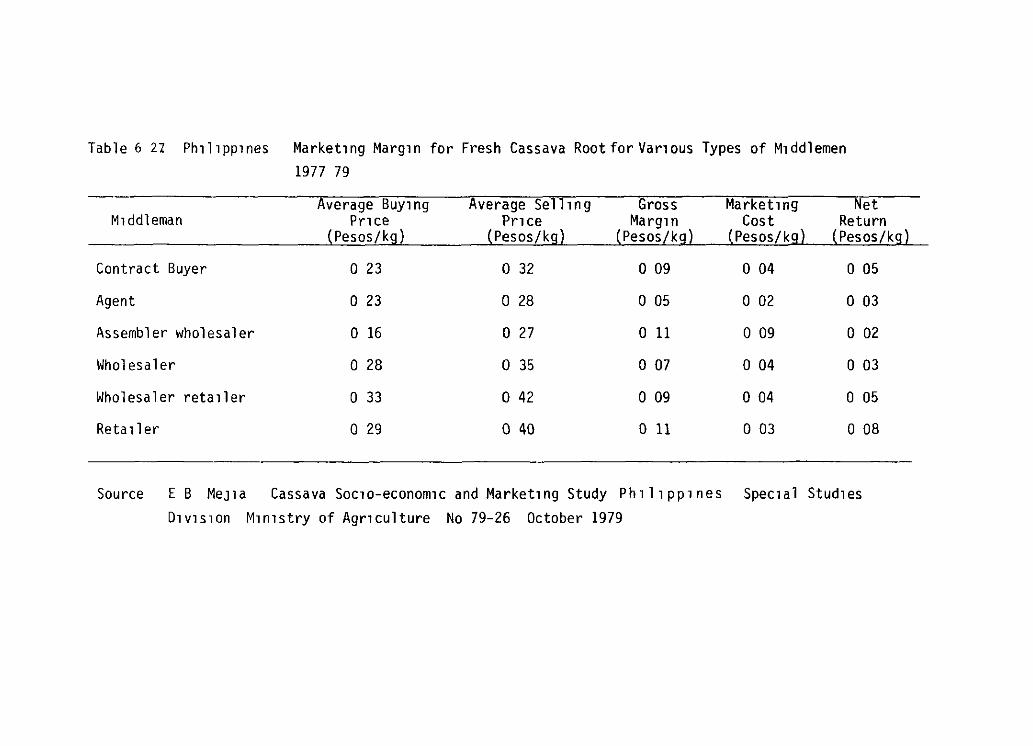
Tab 1 e 6 2Z Ph111 pp1 nes Market1 ng Marg1 n for Fresh Cassava Root for Van ous Types of M1 dd1 emen 1977 79
Average Buy1ng Average Se 111 n g Gross Market1ng Net M1ddleman Pnce Pnce Marg1 n Cost Return
------(Pesos/kg) (Pesos/kg) (Pesos/kg) (Pesos/kg) (Pesos/kg)
Contract Buyer o 23 o 32 o 09 o 04 o 05
Agent o 23 o 28 o 05 o 02 o 03
Assemb1er wholesa1er o 16 o 27 o 11 o 09 o 02
Who1esa1er o 28 o 35 o 07 o 04 o 03
Who1esa1er reta11er o 33 o 42 o 09 o 04 o 05
Reta11er o 29 o 40 o 11 o 03 o 08
Source E B MeJla Cassava Soc1o-econom1c and Market1ng Study Phl11 pp1 nes Spec1a1 Stud1es D1v1S10n M1n1stry of Agr1cu1ture No 79-26 October 1979
VI - 15 -
consumed in urban areas where transport from farm to urban center l.S relatively expensive However the SSD surveyed 222 cassava middlemen throughout the Phill.ppines and found the gross margl.ns between farmer and wholesaler as well as between wholesaler and retailer to be much smaller than that reflected l.n the average price data (Table 6 27) Moreover actual marketing costs (w1thout accounting for loases) were low There is thus sorne doubt as to the extent to which the gross margina as reflected in the BAE price data can be generalized to cassava market channels Nevertheless margina for fresh cassava remain high
To evaluate whether cassava is going to compete Wl.th grains in alternative markets the relevant price is the farm and not the retal.l price The price ratio between maize and cassava at this level is much more
3javorable (Table 6 25) Accepting a m1nimum pr1ce equivalent ratio of
3 1 - farm-level pr1ces were in general competitive with maize over the period This would be expected l.f cassava starch or ch1ps were to be competitive with mal.ze-derived produces However what l.S clear l.S that there is as yet no consistent market integration between maize and cassava prices Th1s l.S due to the more fragmented nature of cassava markets and the often specialized nature of these local markets Thus root prices are much lower in the southern regions as compared to Luzon often by as much as half
The fresh market can operate at higher price levels than the starch or chip market and has been the principal demand factor in price formatl.on However there is very l1mited capacity to absorb add1tional supplies and marketing l.S r1sky for farmers There has thus been no l.ncentive to 1ntens1fy production practices and no effective demand for new technology Pricing in the cassava root market will have to be l1nked to the coarse grain market creat1ng better price stab1l1ty and more integrated cassava markets Cassava chip production will be key to such market l.ntegration The fresh root market is small enough that making this transition that l.S driving prices downward in the fresh market to the maize equ1valent price should be eas1ly accompl1shed As a broader based ch1p market becomes established market efficiency and better market integration between regions should be vastly improved
Conclusions
The Ph1l1ppines was the f1rst country in Asia to rece1ve cassava from the New World Cassava was brought by the Span1sh from Mexico in the 17th century Yet cassava never established itself as an alternative carbohydrate staple to rice G1ven the generally favorable rainfall and so1l cond1t1ons thl.s role was captured by ma1ze Moreover ma1ze wh1le at f1rst be1ng grown as a cheap foodgrain alternat1ve to rice prov1ded the raw mater1al base for the development of both a starch and feed concentrate industry The Phil1pp1nes is now undergo1ng a rapid expansl.on in domestic demand for carbohydrate sources espec1ally the 1ncreas1ng demand for feed components This demand J.S princl.pally being met through r1sing mal.Ze 1mports even though l.nternal maize pr1ces have been kept above the1r 1mport pr1ce and should have acted as a damper on mal.ze demand
The ratl.O assumes a convers1on of roots to chips of 2 5 1 and that dried cassava l.S competl.tl.ve at 80k of the ma1ze pr1ce
VI - 16 -
ProJections ind1cate 1mports levels of almost one and a half m1llion tons by the year 2000 a level which runs counter to a policy obJ ective of self-sufficiency in cereal grains
The future of cassava in the Ph1l1ppines is clearly dependent on capturing a share of the growing animal feed market Under current maize price pol1cy cassava is already competitive in least cost feed rations although processing capacity and market1ng channels for cassava chips are as yet not well developed Severa! factors w1ll influence the development of this market particularly pricing of ma1ze imports which is in turn tied to setting of the exchange rate and the relat1ve rate of technical change in cassava production versus maize production However the first hurdle is the development of production processing and ut1lization linkages
The cassava sector in the Ph1lipp1nes is caught in a market inertia induced by the dominance of the fresh food market Price formation depends on local supply and demand cond1t1ons local markets are th1n and there is little spatial or product pr1ce integrat1on Incentives for investment in processing capacity and development of market channels for chips are constrained by the small production base price var1abil1ty and uncertain operating margins due to the independence of fresh root and ma1ze pr1ces On the other hand farmers have l1ttle incentive to 1ntensify cultural pract1ces and expand area because of uncertainty of market access and pr1ce variability due to thin markets Expanding the production of cassava chips is the solution to the development of better integrated cassava markets and of a price linkage of maize and cassava markets
The potent1al yield gap 1n cassava that can be exploited in the Philippines is much larger than 1n other Asian countries A closer study of cassava with1n current farm systems 1s needed to ident1fy the types of technology requ1red to raise yields Increas1ng product1v1ty however will require appropriate 1ncent1ves and thus impl1es simultaneous development of processing capacity and marketing channels In this regard the national cassava program is a step in that d1rection w1th its integration of extens1on of both process1ng and production technology the opening of credit lines for development of processing capacity and the basing of production credit on marketing contracts
Development of a broad-based cassava market will depend on the ability to produce cassava chips Drying technology is potent1ally the maJar constra1nt on future development of cassava Various alternatives will have to be tested under various cl1mat1c cond1t1ons and costs will need to be assessed G1ven dry1ng constra1nts and relat1vely h1gh 1nter-1sland transport costs consideration of pelleting 1n southern product1on areas should be cons1dered at an early stage However processing technology for ch1ps should be maintained small in scale thereby fac:¡J_Uat1ng l1nkage to small-farm product1on reducing transport and assembly costs for roots and allow1ng a more evolutionary growth in relat1on to the capac1ty of marketing channels Feed demand in the south will be filled first befare there 1s movement of dr1ed cassava to Luzon
The Ph1lippine cassava economy l1es between that of Indonesia and Thailand In Indonesia alternat1ve markets developed because of the breadth of the product1on base and the market integrat1on acheived through
VI - 17 -
gaplek production for food use In Thailand on the other hand the cassava industry could start from scratch relying on pure cost assessments in evaluating profitabill.ty In the Philippines the fresh food market makes cassava a non-tradeable and limits market 1ntegration Gaplek never developed as a food source because of maize ava1lability and a tradeable market for cassava never emerged Price signals have not provided the relevant 1nformation to producers and processors Knowing these constraints and given the potential for yield increases an appropriately designed pilot program where there is an integration of credit for processing investment extension of production technology and development of market channels could provide the base on wh1ch dynamic growth in cassava product1on and utilization could be launched Certa1nly such a program fits very well into Philippine agricultura! policy with Hs emphas1s on small farmer incomes and self-suff1ciency 1n grains
VI - 18 -
Appendix 6 1 A Synthesis of Production and Utilization
The BAE cassava production series raises several questions about the accuracy of the estimates part~cularly when they are compared to alternative production or yield estimates Another test of the production series is a comparison with data on utilization of cassava Two studies have attempted to reconcile production and consumption data for cassava M E Constantino (1979) compiled known estimates of cassava consumpt~on and found that between 1971 to 1976 these consumption estimates accounted for between only 50 to 80% of est~mated supply (Table 6A 1) The total consumption estimate of 252 thousand tons in 1971 compares favorably with the agricultura! census estimate of 271 thousand tons She reconciled the two series by accepting the production series and assuming human consumption as the residual Per capita consumpt~on thus increased dramatically This however is not supported by SSD estimates for human consumption of cassava
The Policy Analysis Staff in the Ministry of Agriculture adopted a different tactic Area estimates were assumed reliable and yields were re-estimated based on long-term trends (Table 6A 2) Per capita consumption figures were est~ted on the bas~s of a consumpt~on function The production series human consumption series and starch series were then put together and feed use was estimated as a residual The results shows rapidly rising feed use of cassava in the period 1975-81 There are no other corroborating data that feeding of cassava on-farm has increased dramat~cally nor that maJor ~ncreases in the use of dried cassava ~n
concentrates has occurred There is thus no corroborating evidence for the BAE s rapid rise 1n
production since 1975 Real farm level prices in the period 1975-80 were very stable and they were only slightly lower than during the first half of the decade All th1ngs considered it 1s probably best to base the production estimate on known consumption data This is attempted by reg1on (Table 6A 3) These regional consumpt~on estimates assume no inter-regional trade in fresh roots Given the bulkiness and perishabil1ty of cassava roots this is a reasonable assumpt1on The SSD production and marketing survey in fact found very little inter-regional trade except on Luzon where there was movement of cassava from regions I III and IV to Manila
In the development of the consumption estimates severa! assumptions were made concerning wastage on-farm feeding of cassava and production of chips Waste was assumed to be a straight 15/ of total consumption On-farm animal feed1ng followed in part from the results of the SSD survey wh1ch found that about 5/ of product1on was used in on-farm feeding and that this occurred essentially off-Luzon It was assumed that 10/ of small-holder product1on in M1nd1nao and Visayas was fed to sw1ne on farms Production of dried ch1ps was more diff1cult s1nce there is essentially no data on this consumpt1on form The SSD survey found production of cassava chips in only Central Visayas and Western and Northern Mindinao These areas were in general areas w1thout access to a starch plant and with ready access to either Cebu City or Cagayan de Oro c1t1es where either flour or concentrate m1lls are located Chip product1on 1n these three reg1ons was assumed to be 25/ of total small-farm production
VI - 19 -
The reg1onal utilization estimates more or less follow the regional distribution of production as presented in the 1975 BAE production statistics except for the B1col region l.n southern Luzon Up to 1976 the Bicol region was always represented in the production statl.stics as the major producing region in the Philipp1nes Yet on the consumptl.on side there l.S no evidence to suggest what this production l.S utill.zed for although there is occasional mentl.on of chip production in Bicol This region remal.ns something of a question mark as far as cassava production and utilization are concerned
The utl.lization estimate suggests that cassava is grown throughout the Phl.ll.ppines but that productl.on is larger 1n the southern islands than on Luzon For most reg1ons there is little alternative to the fresh market for human consumption except in Central Mindinao where the starch industry is concentrated
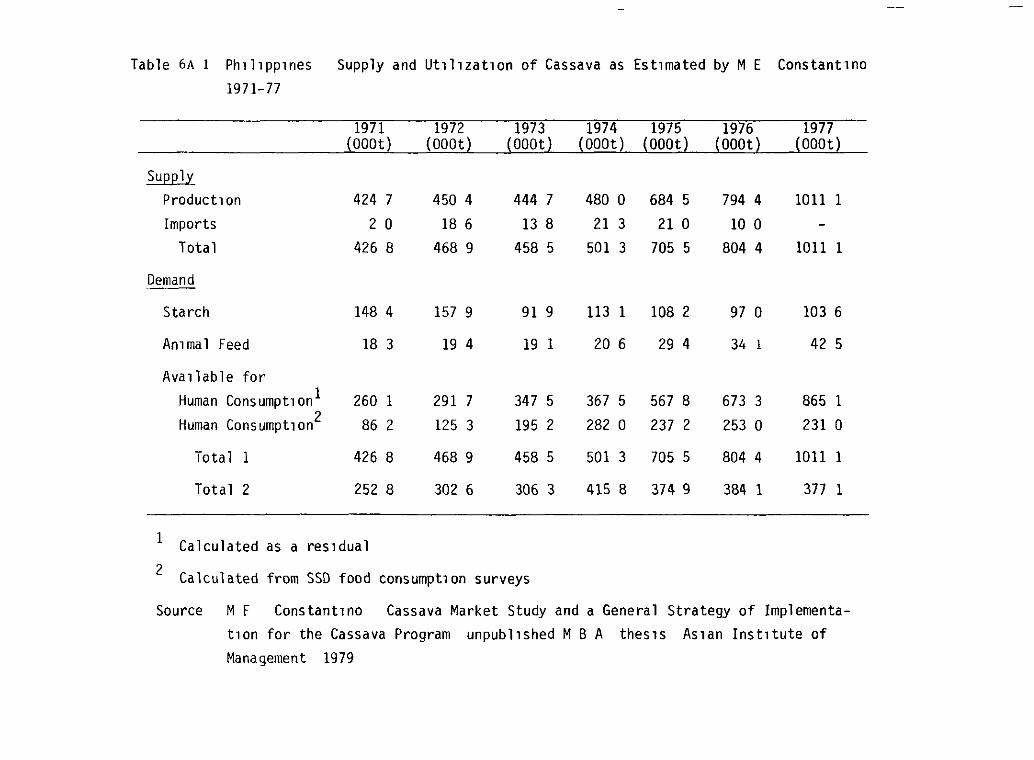
Table 6A 1 Ph1l1pp1nes Supply and Ut1l1zat1on of Cassava as Est1mated by M E
1971-77
1971 1972 1973 (OOOt) (OOOt) (OOOt)
··--
SuEQh Product1on 424 7 450 4 444 7 lmports 2 o 18 6 13 8
Total 426 8 468 9 458 5
Demand --Starch 148 4 157 9 91 9
Am ma 1 Feed 18 3 19 4 19 1
Ava1lable for
Human Consumpt1on 1 260 1 291 7 347 5
Human Consumpt1on2 86 2 125 3 195 2
Tota 1 1 426 8 468 9 458 5
Total 2 252 8 302 6 306 3
1 Calculated as a res1dual 2 Calculated from SSD food consumpt1on surveys
1974 .. --1975 1976 (OOOt) (OOOt) (OOOt)
480 o 684 5 794 4
21 3 21 o 10 o 501 3 705 5 804 4
113 1 108 2 97 o
20 6 29 4 34 l
367 5 567 8 673 3
282 o 237 2 253 o
501 3 705 5 804 4
415 8 374 9 384 1
Constant1no
1977 (OOOt)
1011 1
1011 1
103 6
42 5
865 1
231 o
1011 1
377 1
Source M F Constant1no Cassava Market Study and a General Strategy of Implementatlon for the Cassava Program unpubl1shed M B A thes1s As1an Inst1tute of
Management 1979
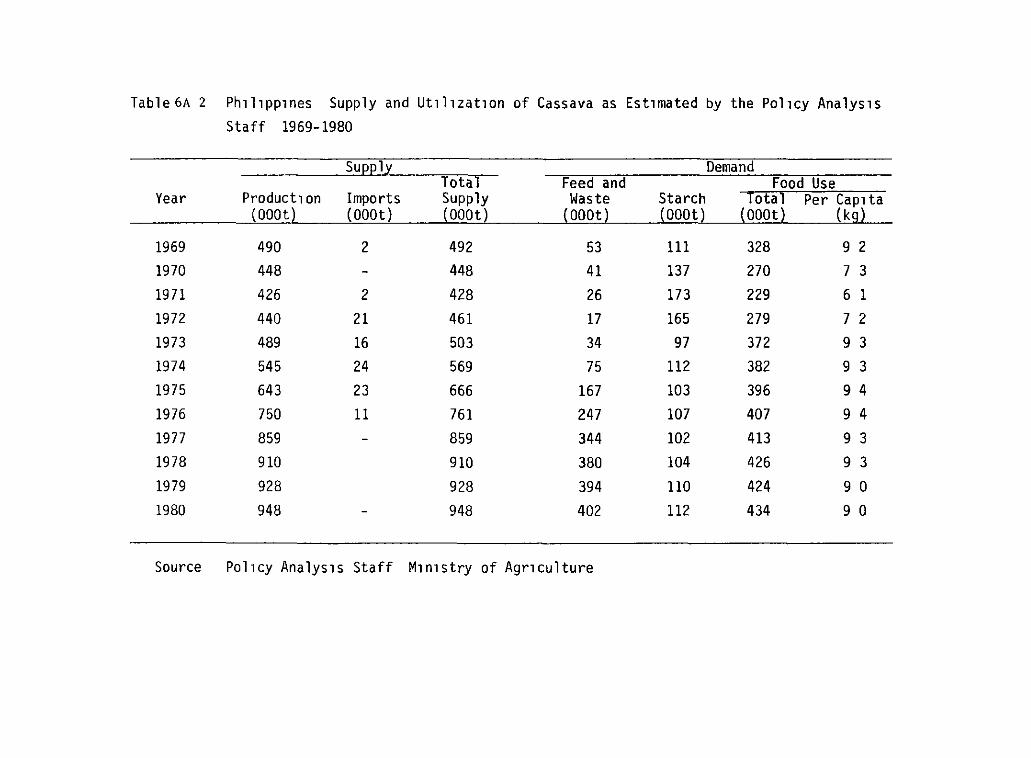
Table 6A 2 Ph1l1pp1nes Supply and Ut1l1zat1on of Cassava as Est1mated by the Pol1cy Analys1s Staff 1969-1980
Supp ly Demand Total Feed and Food Use
Year Product1on Imports Supply Waste Starch Total Per Cap1ta (OOOt) (OOOt) ( OOOt) (OOOt) (OOOt) (OOOt) (kg)
1969 490 2 492 53 111 328 9 2 1970 448 - 448 41 137 270 7 3
1971 426 2 428 26 173 229 6 1
1972 440 21 461 17 165 279 7 2
1973 489 16 503 34 97 372 9 3 1974 545 24 569 75 112 382 9 3 1975 643 23 666 167 103 396 9 4 1976 750 11 761 247 107 407 9 4
1977 859 - 859 344 102 413 9 3 1978 910 910 380 104 426 9 3
1979 928 928 394 110 424 9 o 1980 948 - 948 402 112 434 9 o
Source Pol1cy Analys1s Staff M1n1stry of Agr1culture
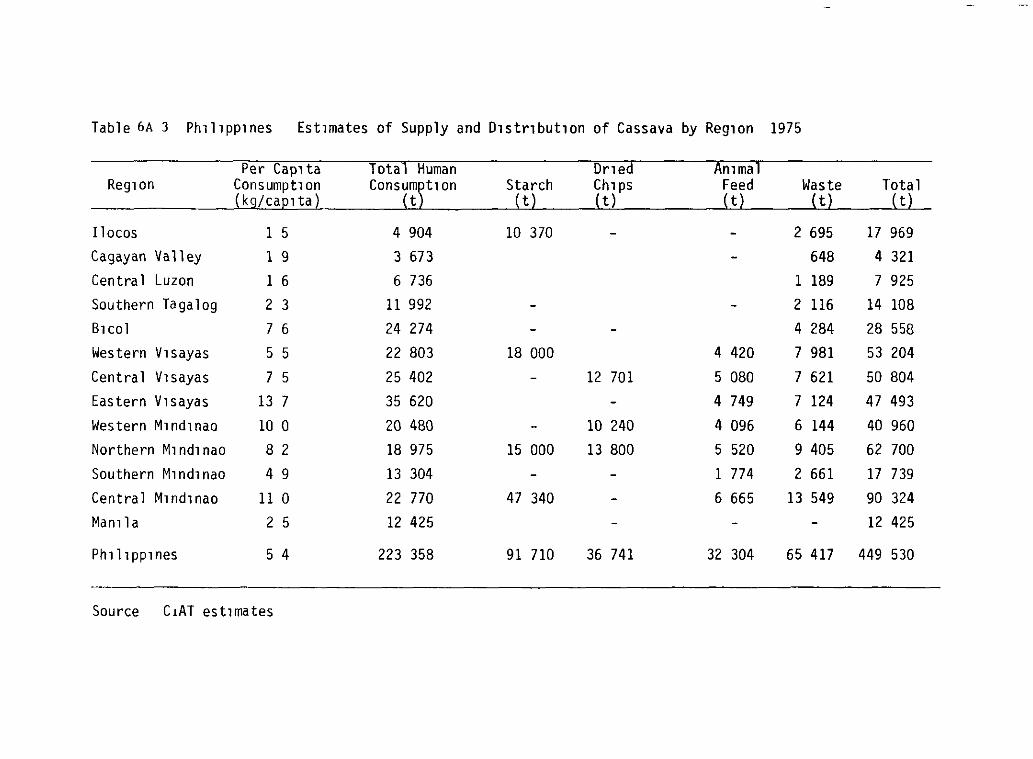
Table 6A 3 Ph1l1pp1nes Est1mates of Supply and D1str1bUt1on of Cassava by Reg1on 1975
Total Human Dned Ammal Reg1on Consumpt1on ~onsu~}t1 on Starch Ch1ps Feed
(t) (t) (t
11 oc os 1 5 4 904 10 370 - - 2 695 17 969
Cagayan Va 11 ey 1 g 3 673 - 648 4 321 Centra 1 Luzon 1 6 6 736 1 189 7 925
Southern Tagalog 2 3 11 992 - - 2 116 14 108
B1col 7 6 24 274 - - 4 284 28 558 Western V1sayas 5 5 22 803 18 000 4 420 7 981 53 204
Central V1sayas 7 5 25 402 - 12 701 5 080 7 621 50 804
Eastern V1sayas 13 7 35 620 - 4 749 7 124 47 493
Western M1nd1nao 10 o 20 480 - 10 240 4 096 6 144 40 960
Northern M1nd1nao 8 2 18 975 15 000 13 800 5 520 9 405 62 700
Southern M1nd1nao 4 9 13 304 - - 1 774 2 661 17 739
Central M1nd1nao 11 o 22 770 47 340 - 6 665 13 549 90 324
Maml a 2 5 12 425 - - - 12 425
Ph1l1pp1nes 5 4 223 358 91 710 36 741 32 304 65 417 449 530
Source C1AT est1mates

VII Thailand
Rapid Growth Driven by Export Markets
Thailand has developed the premier agricultura! export economy in the tropics at least in terms of its exports of carbohydrate sources This export orientation dates to the 1850 s when the sJ.gning of the Bowing treaty removed a ban by the Thai king on exports of rice The market stimulus to a subsistence economy with surplus land resources was immediate and rice exports became the drivl.ng force in the Thai agrl.cultural economy upto the Second World War The beginning of the post-war perJ.od marked the diversifl.catl.on of the Thai agricultura! economy into upland crops agal.n almost entirely directed to export markets Development of the upland sector has been the principal growth element in the Thal. agricultura! economy in the post-war period and has been based on expansion in maize kenaf cassava and sugar cane
The upland sector in the post-war period has gone through a series of commodl.ty booms These were based on area expansion Wl.thin a land and labor surplus agricultura! economy i e the lJ.mited size of domestic markets or the lack of export l.nfrastructure was the most bl.nding constraint on agricultura! productl.on The success of these booms resulted l.n a relative shortage of labor in the 1970 s inducing the development of a market for tractor-hl.re services The motor of this growth process thus was the openl.ng of market channels for export and relative price incentives l.n these markets However thl.s growth process also reflected the vagarl.es of world market demand as is epitomized by the rise and collapse of the kenaf industry
Cassava is the most recent of Thailand s commodity booms which is not to say that cassava l.S a recently introduced crop The exact date of l.ntroduction to Thailand l.S not known but cassava was apparently being grown as a food crop J.n the 18th century However unlike countrl.eS such as Indonesia and the Philippines Thailand was always able to meet its starchy staple requirements solely through rl.ce Cassava thus never became more than a specJ.ality food l.n the country The genesis for growth in the crop has always been non-food markets almost solely directed to export The initial development of such a market was in the 1930 s when cassava pearl wa'\¡ produced in the South for export through Malaysl.a (Scheltema 1938) -
The Thal. cassava industry was based on the starch export market up to about 1960 World War II briefly curtailed this market in Southeast Asia l.n the late 1940 s but follow1ng the war modern processl.ng mach1nery was l.ntroduced into Chonburl. in the eastern region A healthy starch industry was operating l.n thl.s regl.on by the ml.d-1950 s supplant1ng the starch l.ndustry in Indonesia and l.n the south of Tha1land However it was starch wastes that became the basl.s for the real expans1on l.n the crop when a
)) Thai export statistl.CS for cassava do not start untl.l 1950 and the only suggestJ.on of such an J.ndustry l.S Malaysian import statistics
VII - 2 -
West German importer in 1956 introduced cassava waste as an animal feed to Germany (Phillips 1974 Titapitnatanakun 1979) Low freight rates ~n this period its lack of alternative uses and high feedgrain prices in Germany made cassava waste particularly price competit~ve in Europe Since cassava waste was a by-product of starch manufacture shortages resulted and led to the importation of cassava meal starting ~n 1960 W~th the ~ntroduction of the Common Agricultural Pol~cy ~n 1962 and the favorable tar~ff binding on cassava in the 1968 GATT negotiat~ons the Tha~ cassava ~ndustry sh~fted to animal feed as its principal market Cassava chips became the dominant export in 1964 native pelleta in 1969 and hard pellets in 1983 W~th this external st~ulus Thailand went from a relat~vely minar producer of cassava in the 1950 s to the second largest (if not the largest) producer of cassava ~n the world
Production Trends
Production of cassava has increased from around 400 thousand tons ~n
the mid-1950 s to almost 20 million tons in 1984/85 (Table 7 1) This representa a sustained growth rate of 16% per annum for over 25 years These sharp ~nc-eases in production have been based exclusively on expans~on ~n area planted and have been concentrated in a relatively limited number of regions with~n the country Product1on has continued to expand in the old starch producing reg~on of Chonbur~ and Rayong However the bulk of cassava product~on has sh~fted from th1s zone to the Northeast Whereas the Northeast made up less than 10% of the total up to 1969 by 1979 the Northeast was producing over 607 of total cassava This represented a sh~ft to relatively dr~er production cond1t~ons and a movement from the red-yellow podzolic so~ls to the more acid~c latosols Cassava in part d~splaced kenaf ~n the Northeast and in part was planted on newly cleared forest areas
Cassava has grown from a relat~vely m~nor crop in the 1950 s to be the second most important crop after r~ce ~n terms of productioP volume (as measured on a dry weight bas~s) and in terms of fore~gn exchange earned As in previous commodity booms rap~d production increases have been based on area expans~on led by demand in ~nternational markets Capac~ty and growth in domest1c markets would never have susta~ned the growth rates that have occured in cassava and the other majar agr~cultural commodit~es To understand the cassava industry in Thailand the analys~s first reviews the factors on the production side that formed the basis for such high growth rates and then turns to an analysis of the demand s~de which must necessarily consider the changing nature of internat~onal cassava markets
Cassava Product~on Systems
Agricult~ral development ~n Tha~land has been based on exploitation of an agr~cultural front1er and reliance on ~nternational markets as a surplus vent Unlike Malays~a access to new land has been relat~vely
uncontrolled although a ceiling on the s~ze of land holdings fomerly ~n
the publ~c domain was set at 8 ha ~n 1936 With the expans~on in ~nternat~onal markets following World War ll planted area expanded rapidly in many cas~s at the expense of forest lands A satell~te census showed that forest land had been reduced from 57/ of total land ~n 1961 to 37/ in 1974 a loss of 10 mill~on hectares ~n 13 years (Bertrand 1980)
VII - 3 -
Whereas the pre-war expans~on was based principally on r~ce for wh~ch there was already a large production base d~versification into upland crops has been the hallmark of post-war agricultura! growth Crops such as maize sugarcane mung bean kenaf and cassava have expanded rapidly from relatively small production bases The f~nal component of th~s extensive growth pattern was relatively rapid mechanization of the agricultura! sector based on either animal or mechanical equipment Thus in 1963 68r of farms were using animal traction and 147 were using mechanical power or some combination of animals and tractora By 1978 33% of farmers were utilizing tractora
Cassava production systems therefore must be understood essent~ally ~n the context of rapid expansion of previously uncultivated land Certainly in the Northeast there was some substitution for kenaf whose area by 1981 had declined by about 330 thousand hectares from its peak in 1967 However cassava area in the Northeast ~ncreased by over 780 thousand hectares in the same period at the same time as maize production also expanded quite dramatically G~ven cassava s adaptat~on to the dr~er growing conditions of the Northeast and the profit levels as maintained by EC gra~n pr~ces the crop expanded rapidly principally by opening up new land The process obviously introduces a dynamic element into character~z~ng cassava production systems espec~ally in terms of adaptation of management pract~ces as farmers learn the responsiveness of a new crop and the effects of continuous cassava cultivat~on on so~l
fertility
Using the agricultura! census of 1963 and 1978 as reference points cassava expansion was based on a sizeable ~ncrease ~n the number of cassava grow~ng farms (from 58 to 450 thousand) and in an ~ncrease in the average size of cassava plant~ngs per farm from 1 4 to 2 1 ha In 1978 21% of the farmers ~n the Northeast grew cassava and ~n most ~nstances probably depended on cassava as the~r pr~ncipal source of ~ncome By 1978 the modal farm s~ze stratum for cassava farmers was between 3 2 and 6 4 ha (Table 7 2) This ~s large by overall Asian standards but st~ll relatively small given the agro-climatic potent~al of most growing areas Moreover such a farm size has supported a market for tractor hire serv~ces but not actual tractor ownership The adoption of tractor hire services has in turn released grazing land formerly needed to support draft animals for cultivation
Given the very dynamic nature of the upland sector espec~ally in the Northeast the degree of compet~t~on between cassava and other upland crops is d~ff~cult to def~ne If crop area data are d~saggregated by agroeconom~c zone (Table 7 3) certa~n hypotheses at least emerge In the old cassava grow~ng area of Chonbur~ and Rayong (agroeconom:¡_c zone 15) cassava made up 40/ of total farm area wHh the only other upland crop being sugarcane Cassava dom~nates th:Ls zone so thoroughly that 1.t appears blanketed by monoculture cassava In the Northeast the s:Ltuat:Lon is more diverse In agroeconom:Lc zones 1 and 5 cassava potent:Lally competes W:Lth ma~ze and kenaf In agroeconom:Lc zone 3 cassava competes only with kenaf In none of these latter zones does cassava dom1.nate the agricultura! economy Moreover only 1.n agroeconom1.c zone 5 do maize and cassava production areas really overlap In the two largest maize producing zones only very little cassava :LS produced In general 1.n the Northeast there :LS
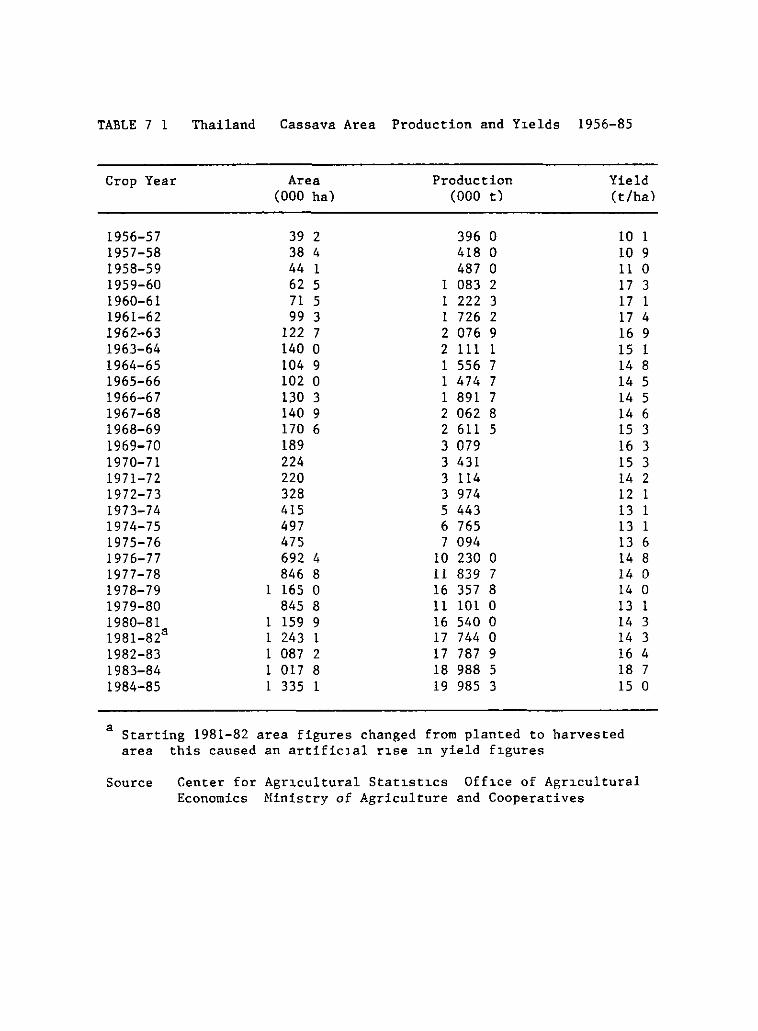
TABLE 7 1 Thailand Cassava Area Production and Y~elds 19S6-8S
Crop Year
19S6-S7 19S7-S8 19S8-S9 19S9-60 1960-61 1961-62 1962-63 1963-64 1964-6S 196S-66 1966-67 1967-68 1968-69 1969-70 1970-71 1971-72 1972-73 1973-74 1974-7S 197S-76 1976-77 1977-78 1978-79 1979-80 1980-81 1981-82a 1982-83 1983-84 1984-8S
Are a (000 ha)
39 2 38 4 44 1 62 S 71 S 99 3
122 7 140 o 104 9 102 o 130 3 140 9 170 6 189 224 220 328 41S 497 47S 692 4 846 8
1 16S o 845 8
1 1S9 9 1 243 1 1 087 2 1 017 8 1 33S 1
Production (000 t)
396 o 418 o 487 o
1 083 2 1 222 3 1 726 2 2 076 9 2 111 1 1 SS6 7 1 474 7 1 891 7 2 062 8 2 611 S 3 079 3 431 3 114 3 974 S 443 6 76S 7 094
10 230 o 11 839 7 16 3S7 8 11 101 o 16 S40 o 17 744 o 17 787 9 18 988 S 19 98S 3
Yield (t/ha)
10 1 10 9 11 o 17 3 17 1 17 4 16 9 1S 1 14 8 14 S 14 S 14 6 1S 3 16 3 1S 3 14 2 12 1 13 1 13 1 13 6 14 8 14 o 14 o 13 1 14 3 14 3 16 4 18 7 1S o
a Starting 1981-82 area figures changed from planted to harvested area this caused an artific~al r~se ~n yield f~gures
Source Center for Agr~cultural Stat~st~cs Off~ce of Agr~cultural Economics Ministry of Agriculture and Cooperatives
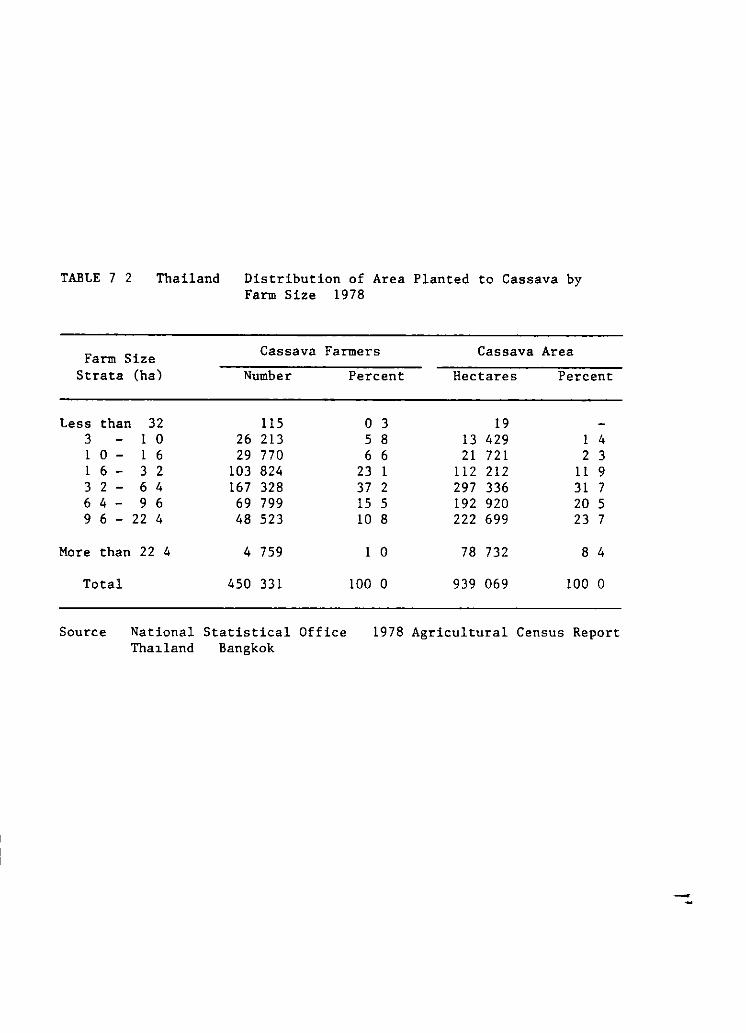
TABLE 7 2 Thailand Distribution of Area Planted to Cassava by Farm Size 1978
Farm Size Cassava Farmers Cassava Are a
Strata (ha) Number Percent Hectares Percent
Less than 32 11S o 3 19 3 1 o 26 213 S 8 13 429 1 4 1 o - 1 6 29 770 6 6 21 721 2 3 1 6 - 3 2 103 824 23 1 112 212 11 9 3 2 - 6 4 16 7 328 37 2 297 336 31 7 6 4 - 9 6 69 799 1S S 192 920 20 S 9 6 - 22 4 48 S23 10 8 222 699 23 7
More than 22 4 4 7S9 1 o 78 732 8 4
Total 4SO 331 100 o 939 069 100 o
Source National Statistical Office 1978 Agricultural Census Report Tha1land Bangkok
--
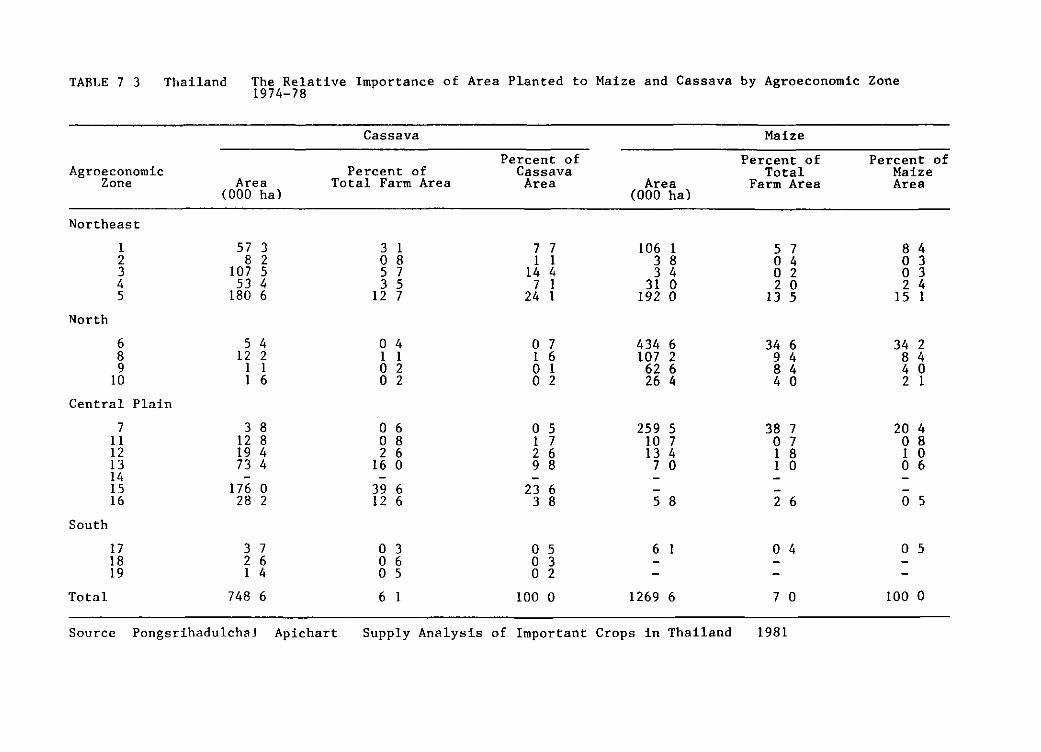
TABLE 7 3 Thailand The Relative Importance of Area Planted to Maize and Cassava by Agroeconomic Zone 1974-78
Cassava Maize
Percent of Percent of Percent of Agroeconomic Percent of Cassava Total Maize
Zone Are a Total Farm Area Are a Are a Farm Area Are a (000 ha) (000 ha)
Northeast
1 57 3 3 1 7 7 106 1 5 7 8 4 2 8 2 o 8 1 1 3 8 o 4 o 3 3 107 5 5 7 14 4 3 4 o 2 o 3 4 53 4 3 5 7 1 31 o 2 o 2 4 5 180 6 12 7 24 1 192 o 135 15 1
North
6 5 4 o 4 o 7 434 6 34 6 34 2 8 12 2 1 1 1 6 107 2 9 4 8 4 9 1 1 o 2 o 1 62 6 8 4 4 o
10 1 6 o 2 o 2 26 4 4 o 2 1
Central Plain
7 3 8 o 6 o 5 259 5 38 7 20 4 ll 12 8 o 8 1 7 10 7 o 7 o 8 12 19 4 2 6 2 6 13 4 1 8 1 o 13 73 4 16 o 9 8 7 o 1 o o 6 14 - - -15 176 o 39 6 23 6 16 28 2 12 6 3 8 5 8 2 6 o 5
South
17 3 7 o 3 o 5 6 1 o 4 o 5 18 2 6 o 6 o 3 19 1 4 o 5 o 2
Total 748 6 6 1 lOO O 1269 6 7 o lOO O
Source Pongsrihadulchal Apichart Supply Analysis of Important Crops in Thailand 1981
VII - 4 -
still significant scope for expansJ.on of cassava area if not at the expense of other crops then in terms of currently under-utilized land already in farms or 1n the public doma1n
The rainfall pattern in the Northeast and Central Plain is unimodal with a dry season from November to April and a wet season of varying intensity for the rest of the year as reflected in average annual rainfall for d1fferent sites from the Northeast to the South ranging from 900 to 3000 mm Moreover moving to the Northeast rainfall becomes more var1able and uncertain Since most of the cassava is solar dried this ra1nfall pattern creates a trade-off between optimum drying period and opt1mum plant1ng period The drying season starts in November and farmers rarely leave the cassava in the ground for longer than 12 months though it could be left much longer Where ra1nfall is more secure that is the Rayong and Chonburi area farmers plant in the dry season as well as the wet season Further to the northeast farmers tend to plant exclusively in the March to June period that is at the beg1nning of the rainy season (Figure 7 1) Exper1mental trails have shown that plant1ng at the beginning of the ra1ns gives s1gnJ.ficantly higher yields (Sinthuprama 1980)
Given a eight-to-twelve month growth cycle planting 1n the November-December period and harvesting in the same period coincide better with market demand Prices are at the1r seasonal high in the September-November period before decl1ning to their seasonal low in March-April Also root starch content is much higher at the beginning of the dry season result1ng in a further price prem1um There is greater demand for roots at this period because of the signif1cant increase in through-put and thereby lower costs in the chipping plants due to shorter drying periods There is thus a signifJ.cant increase in root sales in the dry season (Table 7 4) although harvest occurs throughout the year
Cassava production systems in and of themselves are relat1vely s1mple The land is prepared either by animal traction or by tractor hire services with the latter being increasingly common The cassava is planted either horizontally (sandy soils) or vertically (loamy soils) depending on the potent1al drought risk of the soil Planting material comes from recently harvested plants keeping stake storage time to a min1mum Cassava is grown l.n a very str1ct monoculture system in that no other crop species are interplanted and a single var1ety tends to dominate throughout Thailand Rayong 1 In weeding hand labor is employed with some animal interrow cultJ.vatJ.on Nevertheless in the these activitJ.es labor use is kept to the minimum necessary to adequately ma1nta1n the crop
The most crJ.tJ.cal 1ssue 1n the rapl.d expans1on of cassava production and the resultant extens1ve productJ.on systems 1s the maintenance of so1l fertil1ty In general fertil1zer applJ.catJ.on is low in Tha1land when compared to other Asian c2yntr1es Fert1l1zer prices are not cons1stently subsid1zed in Thailand - and are generally appl1ed to those crops 1n which marg1nal returns are h1ghest Of the maJor crops sugarcane has the
There are some programs purchase of fert1l1zer rice
which prov1de a cred1t subs1dy for the These programs are pr1mar1ly or1ented to
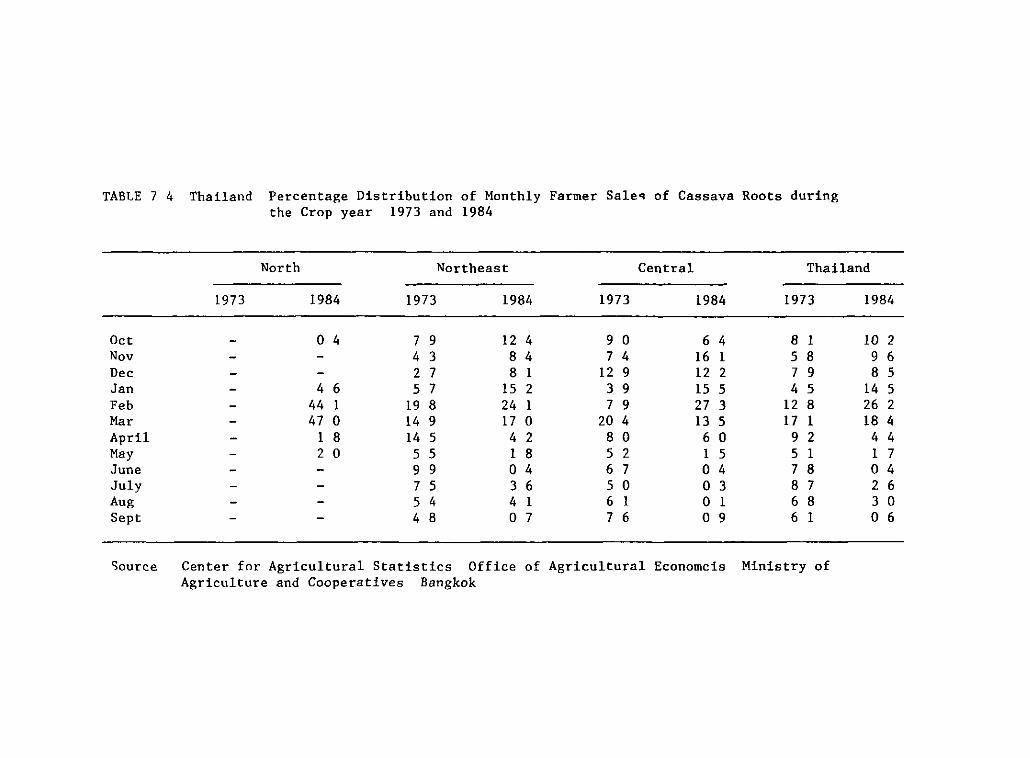
TABLE 7 4 Thailand Percentage Distribution of Monthly Farmer Saleq of Cassava Roots during the Crop year 1973 and 1984
North Northeast Central Thailand --
1973 1984 1973 1984 1973 1984 1973 1984
Oct - o 4 7 9 12 4 9 o 6 4 8 l lO 2 Nov - - 4 3 8 4 7 4 16 l 5 8 9 6 De e - - 2 7 8 l 12 9 12 2 7 9 8 5 Jan - 4 6 5 7 15 2 3 9 15 5 4 5 14 5 Feh - 44 l 19 8 24 l 7 9 27 3 12 8 26 2 Mar - 47 o 14 9 17 o 20 4 13 5 17 l 18 4 April - l 8 14 5 4 2 8 o 6 o 9 2 4 4 May - 2 o 5 5 1 8 5 2 l 5 5 l l 7 June - - 9 9 o 4 6 7 o 4 7 8 o 4 July - - 7 5 3 6 5 o o 3 8 7 2 6 Aug - - 5 4 4 l 6 l o l 6 8 3 o Sept - - 4 8 o 7 7 6 o 9 6 l o 6
Source Center for Agricultura! Statistics Office of Agricultural Econorncis Ministry of Agriculture and Cooperatives Bangkok
VII - 5 -
highest application rate followed by rice Accord1ng to the 1978 census rice consumes fully two-thirds of fertilizer ava1lab1lities Sugarcane vegetable and tree crops consume an addit1onal quarter leaving less than 10% or less than 70 thousand tons available for all other major field crops
Fertilizer application on cassava is low In 1973/74 average fertilizer application per cultivated hectare of cassava was only 6 9 kg/ha (Koomsup 1980) On that area where fertilizer was actually appl1ed (16% of cultivated area) rates were 43 kg/ha Recommended application rates are about 15 times this level By 1980/81 average application rates remained at the same level (Table 7 5) As would be expected fertil1zer application is much higher in the old product1on zones around Chonburi and Rayong wh1le in many areas of the Northeast fertilizer use on cassava is non-ex1stent The very low fertil1zer use in cassava ra1ses two critica! issues First has continuous cassava cultivat1on w1th only m1n1mal levels of fertilizer use resulted in a declining yield trend? Second what would be the yield ga1ns were fertil1zer applicat1on to 1ncrease? To answer part1ally these issues the analysis turns to an evaluation of cassava yields
Yields
Average cassava yield levels of 13 to 14 t/ha in Thal.land are high even by Asian standards Only India and Malaysia consistently have h1gher yields than Thailand Moreover Thailand has been able to maintain th1s level of productivity through the per1od of rap1d expansion 1n the crop The natJ.onal statistics suggest that yields have dechned somewhat sJ.nce 1960 In the early sixties average yields were around 17 t/ha and declined quite rap1dly to 14 t/ha by the late sixties Yields have remained at about th1s level ever since having fallen below 13 t/ha only once These relat1vely h1gh yJ.elds have been a signif1cant part of Thailand s dominance of the international trade in cassava
The difference in agro-climatic conditions between the Northeast and the Central Plain is only part1ally reflected 1n yield differences The older production reg1ons on average mainta1n a one-to-two ton yield advantage over productJ.on areas in the Northeast However yields have shown something of a r1sing trend in the Northeast especially if extended back to 1960 Yield trends in the Central Pla1n on the other hand 1n1tially declined in the 1960 1 s and over the past half decade have be en remarkably stable at around 15 t/ha Yield levels as expressed 1n the aggregate production stat1st1cs thus present a p1cture of relative stab1l1ty and g1ve no 1ndicat1on of progressive so1l exhaust1on
The micro-level data are only suggest1ve of the factors underlying the dynam1cs of cassava productiv1ty To start w1th average yields of cassava mask a very w1de y1eld dispers1on The y1eld d1str1bution is skewed with the largest segment of farmers producing qu1te normal yields by world standards of from zero to nine t/ha and with a very extended r1ght-hand side where some farmers produce over 19 t/ha (Table 7 6) The second set of data 1s long-term fert1l1ty stud1es (Figure 7 2) These data show the expected decl1ne 1n y1elds w1th cont1nuous cropping after open1ng up new land However the decl1ne 1s gradual and in one s1te y1elds only declined
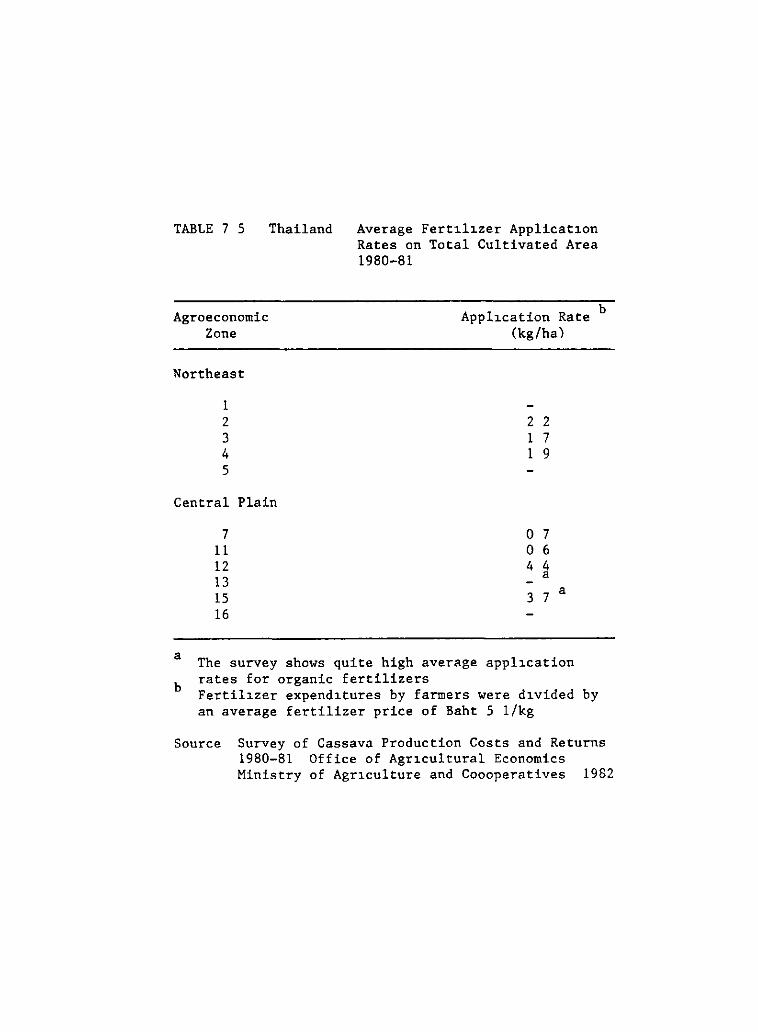
TABLE 7 5
Agroeconomic Zone
Northeast
1 2 3 4 5
Thailand
Central Plain
7 11 12 13 15 16
Average Fert1l1zer Applicat1on Rates on Total Cultivated Area 1980-81
b Appl1cation Rate (kg/ha)
2 2 1 7 1 9
o 7 o 6 4 4 a
3 7 a
a
b
The survey shows quite high average appl1cation rates for organic fertilizers Fertil1zer expend1tures by farmers were d1vided by an average fertilizer price of Baht 5 1/kg
Source Survey of Cassava Production Costs and Returns 1980-81 Office of Agr1cultural Economics Ministry of Agr1culture and Coooperatives 1982
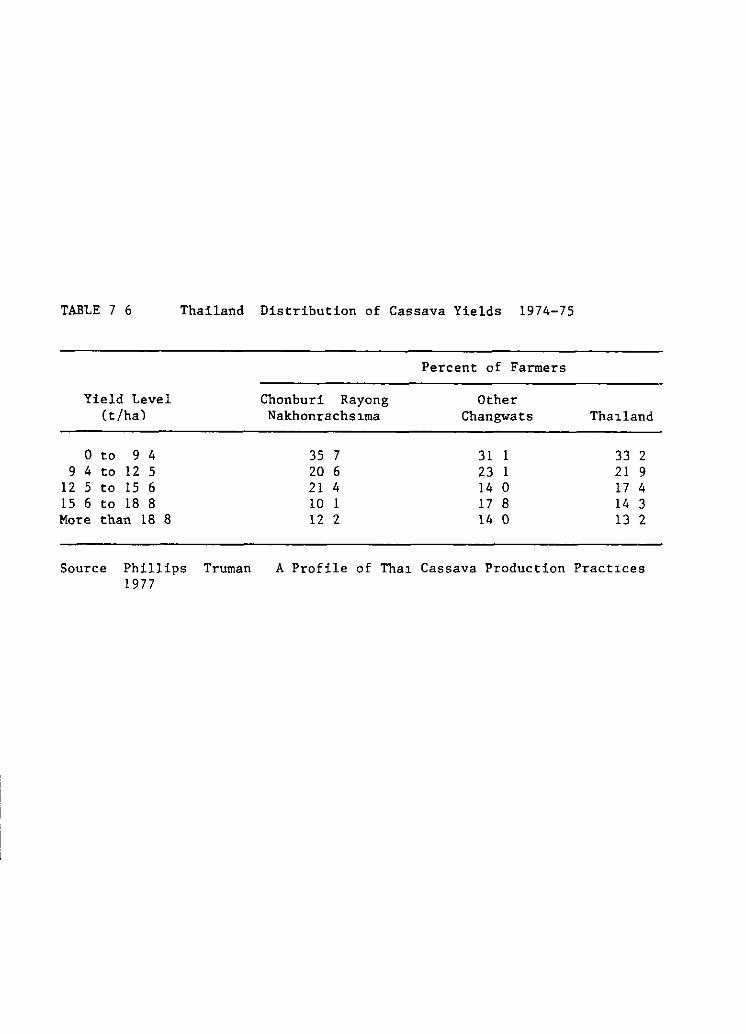
TABLE 7 6 Thailand Distribution of Cassava Yields 1974-7S
Yield Level (t/ha)
o to 9 4 9 4 to 12 S
12 S to 1S 6 15 6 to 18 8 More than 18 8
Source Phillips Truman 1977
Chonburi Rayong Nakhonrachs1ma
35 7 20 6 21 4 10 1 12 2
Percent of Farmers
Other Changwats
31 1 23 1 14 o 17 8 14 o
Tha1land
33 2 21 9 17 4 14 3 13 2
A Profile of Tha1 Cassava Production Pract1ces
VII - 6 -
from around 30 t/ha to 20 t/ha in a sixteen year period One thorough study found that from an initial yield of 20 to 30 t/ha yields decrease by half within 9 to 20 years (Interim Committee for Coordination of Investigations in the Lower Mekong Basin 1979) With such rapid open1ng of new land as has occurred in the case of cassava the yield decline in older plots has been offset by the higher y~elds of new product1on areas As yield in older plots fall cassava supply becomes more sens~tive to price changes particularly since more than half the farmers operate at below average yields
Mining of soil fertility has a longer-term social cost of enhanced erosion potential and a permanent decline ~n the productiv~ty of the land resource This therefore puts prime importance on mot~vating increased application of organic and inorganic fertil1zers as apparently already ~s happening in the Chonburi and Rayong area Two factors however complicate ~ncreased use of fertilizer on cassava First in most areas cassava must compete with either rice or sugarcane for capital resources for fertil~zer Second cassava responsiveness to fertil~zer applicat~on
is not as certain as in these other two crops There 1s often no response in the first two to three years after opening up new land (Table 7 7) After that while responses can be shown they cannot be demonstrated consistently (Table 7 8)
What remains extraordinary in Thailand is the high yields that farmers achieve 1n even depleted soils Suttibursaya and Kummarohita (1978) report cassava being grown continuously for 25 years without fert1l~zation and yet yields have decl1ned to only 16-17 t/ha A fertility restoration exper1ment selected four farmers fields which had been cont~nously
cultivated for 15 years and the average yield of the check plots was 21 t/ha (Inter= Committee for Coordination of Investigations in the Lower Mekong Basin 1979) Th1s suggests that the dominant variety Rayong 1 is very eff~c~ent in the utilization of limited soil nutrients Moreover thirty years of experimental work both on the experiment stat~on and ~n
farmers helds suggest that 30 t/ha is an achievable target with an appropriate fertil~zer regime
The results have made fertility management the princ~pal research thrust in cassava in Thailand What is the advantage of a large investment ~n breeding if 30 t/ha ~s imm~nently achievable with the current var1ety? However defining a recommendat1on that gives a consistently profitable response has eluded researchers and inhib~ted adoption of fertilizer use ~n cassava Indeed farmers in Tha~land util~ze fert~lizer they however do not apply ~t to their cassava Until the profitab~l1ty of fertilizer response can be s~gn~f1cantly 1ncreased probably by l1nk~ng appl~Cdt1on
rates to other environmental var1ables no effect~ve extens~on program for fertil~zat1on of cassava will be successful except poss~bly in the very badly degraded so1ls such as now exist 1n Chonbur~ and Rayong
Thus the relatively h~gh prices for cassava products obta~ned in the European Community was only part of the profit engine that resulted in the rap~d expans1on TU cassava area The other component was the very h1gh 1n1tial y1elds obtained by new adopters of cassava cult1vat1on Init1al y~elds in the 25 to 30 t/ha range provided a powerful stimulus to expand cassava area and lack of a viable crop alternat~ve kept farmers in cassava However th~s raises the quest~on of the longer term viabil1ty of cassava
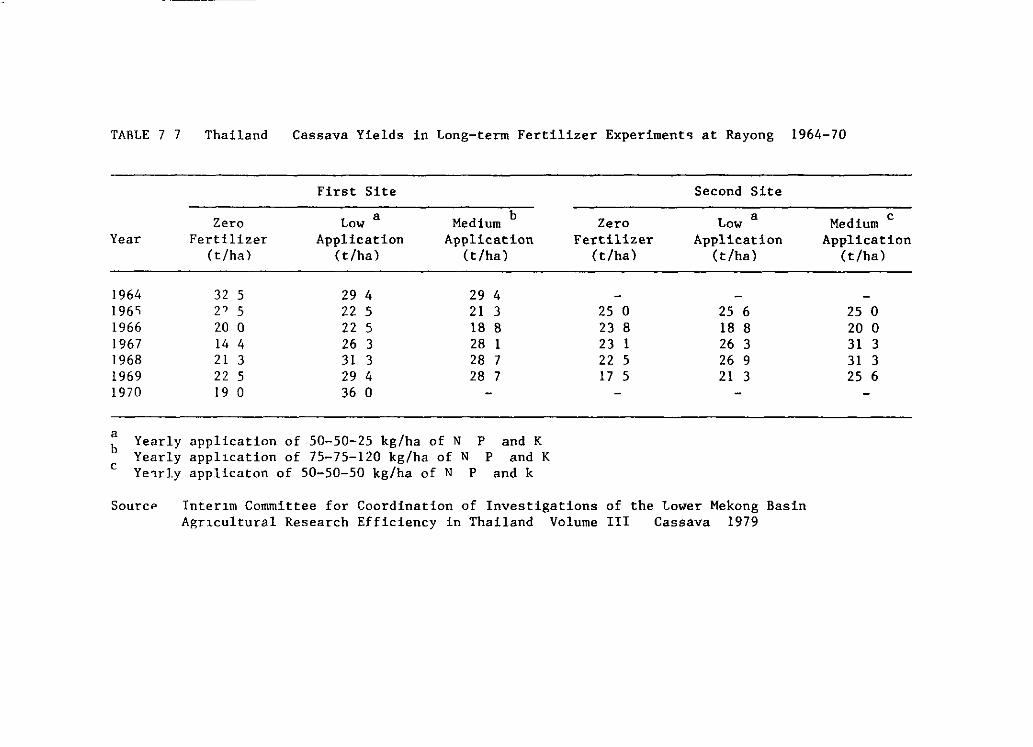
TABLE 7 7
Year
1964 196'i 1966 1967 1968 1969 1970
a b e
Yearly Yearly Ye~rly
SourcP
Thailand Cassava Yields in Long-terrn Fertilizer Experimentq at Rayong 1964-70
First Site
Zero Low a Medium b
Fertilizer Application Application (t/ha) (t/ha) (t/ha)
32 5 29 4 29 4 2? 5 225 21 3 20 o 22 5 18 8 14 4 26 3 28 1 21 3 31 3 28 7 22 5 29 4 28 7 19 o 36 o
application of 50-50-25 kg/ha of N P and K appl~cation of 75-75-120 kg/ha of N P and K applicaton of 50-50-50 kg/ha of N P and k
Zero Fertilizer
(t/ha)
25 o 23 8 23 1 22 5 17 5
Second Site
Low a Application
(t/ha)
25 6 18 8 26 3 26 9 21 3
Inter~m Committee for Coordination of Investigations of the Lower Mekong Basin Agr~cultural Research Efficiency in Thailand Volume III Cassava 1979
e Medium Application
(t/ha)
25 o 20 o 31 3 31 3 25 6
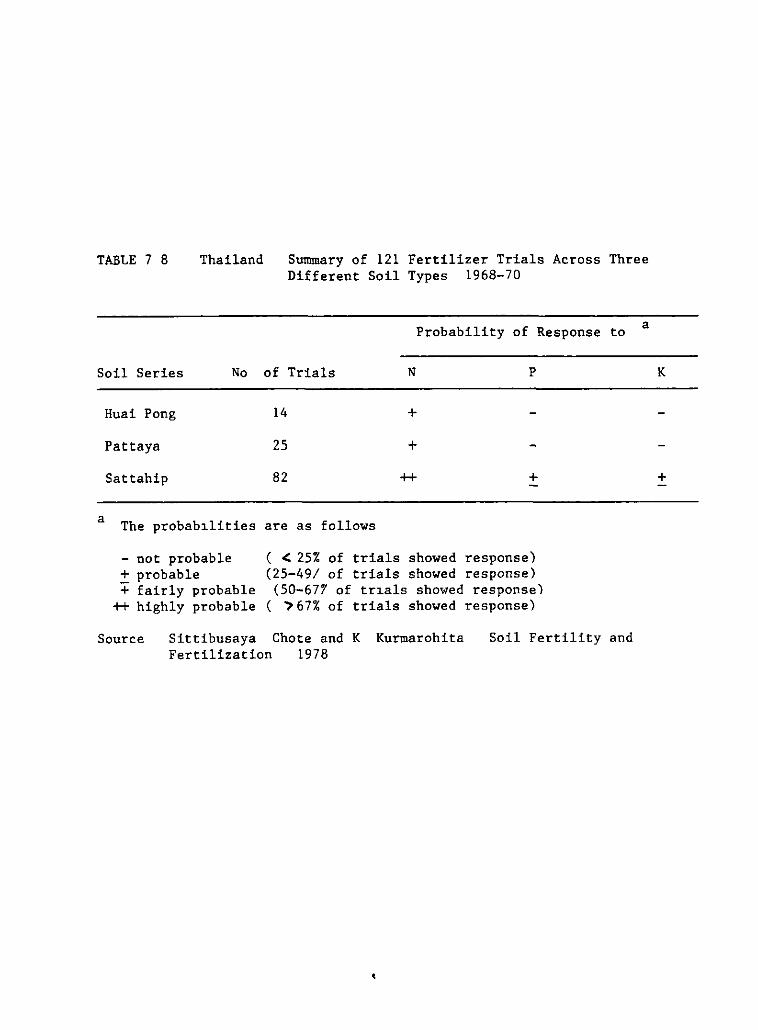
TABLE 7 8 Thailand Summary of 121 Fertilizer Trials Across Three Different Soil Types 1968-70
Probability of Response
Soil Series No of Trials N p
Huai Pong 14 +
Pattaya 25 +
Sattahip 82 ++ +
a The probab1lities are as follows
- not probable + probable + fairly probable
++ highly probable
( < 25% of trials showed response) (25-49/ of trials showed response)
(50-677 of tr1als shm<ed response) ( '? 67% of trials showed response)
to
Source Sittibusaya Chote and K Kurmarohita Fertilization 1978
Soil Fertility and
a
K
+
VII - 7 -
as the industry stabilizes as overall y1.elds decline to a low leve! equil1.br1.um and as output pr1.ces come under downward pressure The task is to transform a dynamic industry that has been fueled by private coses being lower than social costs to a sustainable industry where farmers muse pay the full cose of soil nutrient extraction
Coses of Product1.on and Labor Util1.zation
As yields decline the farmer s in1tial means of maintaining profits are by reduc1ng costs By As1an standards cassava productl.on systems in Thailand are relatively extensive in terms of labor and input use which in turn reflects the relatively high land-labor ratio existent l.n the country Moreover the existing agr1cultural frontier and the relatl.vely l1beral land pol1cy have further re1nforced extensive production practices The process has chus favored technologies that substitute for labor rather than those that substitute for land
Labor l.S the ma)Or cost component 1n cassava product1on systems Est1.mates of labor input per hectare range from 70 to 100 man days Only maize and broadcast r1ce have a lower labor input (Table 7 9) Addl.tionally because cassava can be planted almost anytime of the year and can be harvested over a relatively long period labor activities can be scheduled in relation to other demands for labor S1nce upland crops muse compete with rice for labor this flex1.b1lity in labor use gives cassava an advantage over other upland crops Finally cassava gives the h1ghest average returns per manday of labor 1nput (Boobst et al ) Cassava thus is very well adapted toche labor economy of Thailand----
The trend is toward further reductions in labor input Land preparatl.on through tractors has rapidly spread through the Northeast With movement to planting 1n rows interrow cult1vat1on w1th an1mals was employed in those areas that st1ll ma1nta1ned draft an1mals Increases in sales of herbicides have been reported in the ma)or cassava produc1ng area of Chonburi especially since there were no such sales prior to 197 3 (Inter1m Comm1ttee for Coord1nat1on of the Lower Mechong Basin 1979) Thus farmers have been very respons1ve to technolog1es that have subst1tuted for labor they have not been respons1ve in the adoption of land substituting technology
Labor or mechan1zat1on coses make up over 85/ of total cassava production coses (Table 7 10) Input and fixed coses make up the rema1nder Moreover normally about half of production coses are paid 1n cash che rest reflects the opportun1ty coses (evaluated at market prices) of farmer-owned resources The cost structure reflects some flex1.b1l1ty 1n absorb1ng price declines at least 1n the short-run since price declines can be absorbed in terms of lower returns on farmer-owned resources NaJor increases 1n fert1lizer coses would s1gn1f1cantly sh1ft this balance aga1n highlight1ng che 1mportance of a cons1stent yield response for adoption
Supply Response
The over the crop was
reasons behind the rap1d expans1on 1n last two decades can now be summarized very profitable Dur1ng che 1974-1984
•
cassava area in Tha1land F1rst and foremost the
per1od average returns to
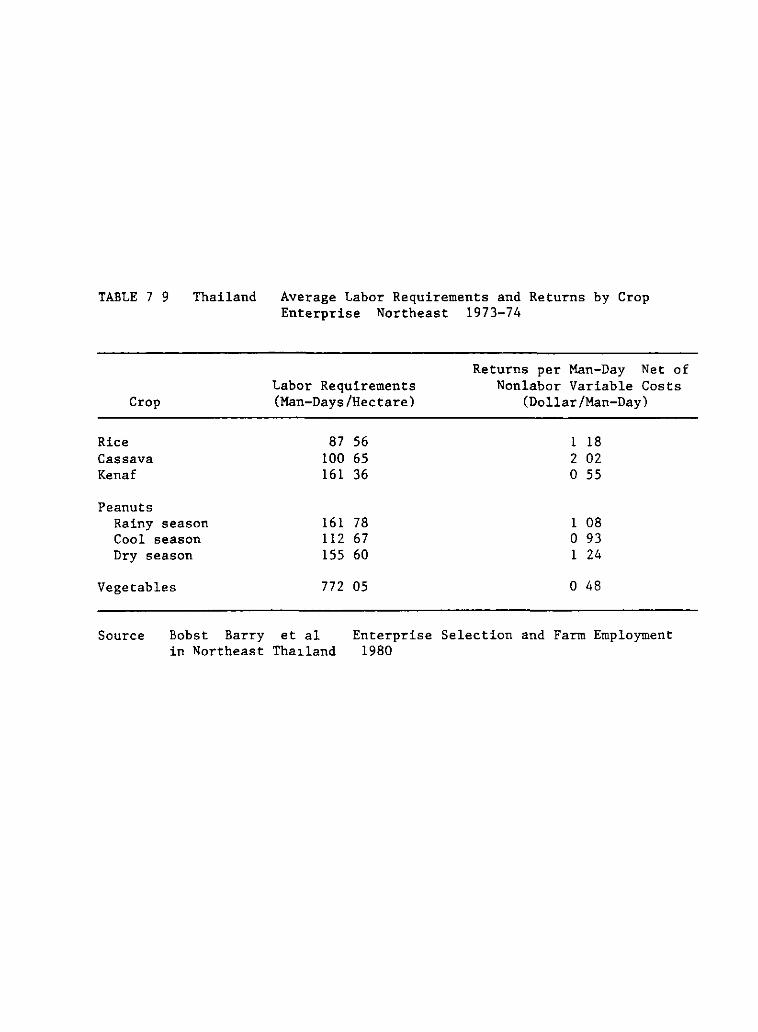
TABLE 7 9 Thailand
Crop
Rice Cassava Kenaf
Peanuts Rainy season Cool season Dry season
Vegetables
Average Labor Requirements and Returns by Crop Enterprise Northeast 1973-74
Returns per Man-Day Net of Labor Requirements Nonlabor Variable Costs (Man-Days/Hectare) (Dollar/Man-Day)
87 56 1 18 lOO 65 2 02 161 36 o 55
161 78 1 08 112 67 o 93 155 60 1 24
772 os o 48
Source Bobst Barry et al in Northeast Tha1land
Enterprise Selection and Farro Employment 1980
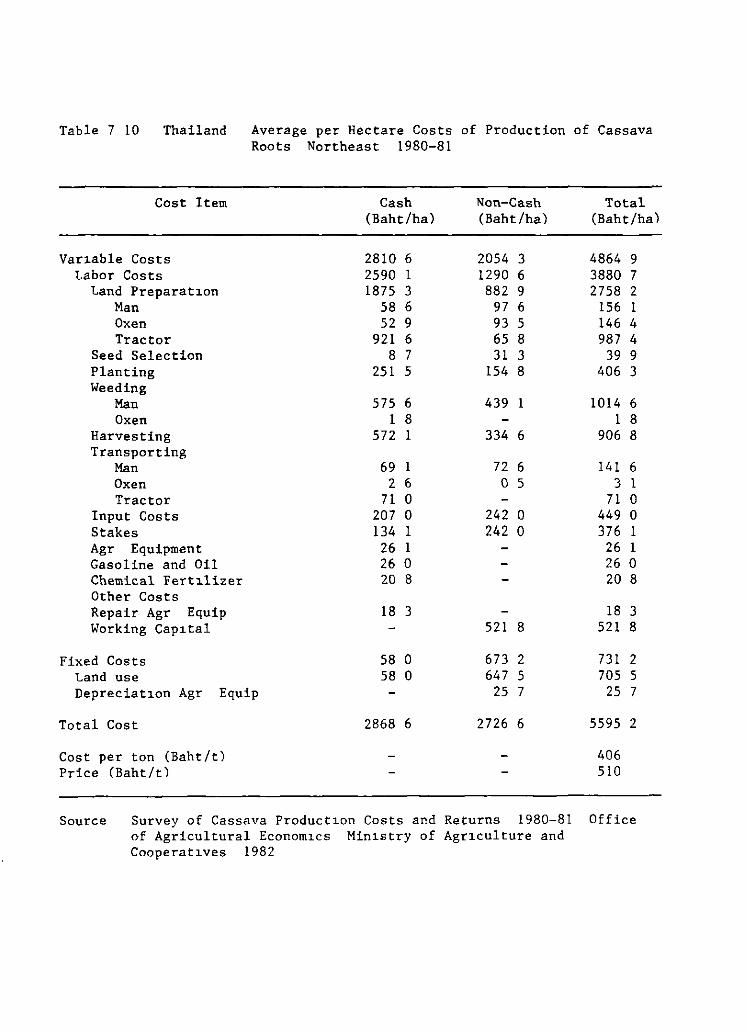
Table 7 10 Thailand
Cost ltem
Van.able Costs Labor Costs
Land Preparat1on Man Oxen Tractor
Seed Selection Planting Weeding
Man Oxen
Harvesting Transporting
Man Oxen Tractor
Input Costs Stakes Agr Equipment Gasoline and Oil Chemical Fert1lizer Other Costs Repair Agr Equip Working Cap1tal
Fixed Costs Land use
Average per Rectare Costs of Production of Cassava Roots Northeast 1980-81
Cash Non-Cash Total (Baht/ha) (Baht/ha) (Baht/ha)
2810 6 2054 3 4864 9 2590 1 1290 6 3880 7 1875 3 882 9 2758 2
58 6 97 6 156 1 52 9 93 S 146 4
921 6 65 8 987 4 8 7 31 3 39 9
251 S 154 8 406 3
575 6 439 1 1014 6 1 8 1 8
572 1 334 6 906 8
69 1 72 6 141 6 2 6 o S 3 1
71 o 71 o 207 o 242 o 449 o 134 1 242 o 376 1
26 1 26 1 26 o 26 o 20 8 20 8
18 3 18 3 521 8 521 8
58 o 673 2 731 2 58 o 647 S 705 S
Depreciat1on Agr Equip 25 7 25 7
Total Cost
Cost per ton (Baht/t) Price (Baht/t)
2868 6 2726 6 5595 2
406 510
Source Survey of Cassava Product1on Costs and Returns 1980-81 Office nf Agricultura! Econom1cs Min1~try of Agr1culture and Cooperat1ves 1982
VII - 8 -
cassava never dropped below 25% and were as h1gh as 145% (Table 7 11) Second the kenaf industry was in decline and even further land was available on which to expand Given the h1gh yields on uncultivated land cassava as an income source was unmatched and led to a maJor increase in incomes in the relatJ.vely depressed area of the Northeast Third farmers did not face a labor constraint as tractor hire services expanded rapidly in the cassava producing areas
All of these factors are reflected in cassava supply response Pongsnhandulchai (1981) has estimated supply equat1ons for cassava by agro-economl.c zone and as might be expected found a very h1gh short-run price elasticity of between O 58 to 2 78 (the median was 1 77) Price responsJ.veness in cassava was much higher than in rice (O 27) maize (O 70) kenaf (O 87) or sugarcane (O 62) Moreover the supply equatíons suggested that cassava principally competed for land with kenaf except in the Rayong-Chonburi region where there were no competJ.ng crops with cassava These equations were estimated while cassava prl.ces were on the whole increasing The question arises whether farmers would be equally responsive to declining prJ.ces and the answer would probably be no There is limited effectJ.ve competitl.on between cassava and other crops reflecting few other cropping alternatives for land l.n cassava Farmers would only signifJ.cantly reduce area 1f they were operating at a cash loss
Technology Development
Research on cassava in ThaJ.land started in 1956 with the creation of the Huai Pong ExperJ.ment Station in Rayong The station comes under the Field Crop Division of the Department of AgrJ.culture and sJ.nce 1956 has beeen the principal locus of cassava research although research on other f1eld crops l.S also done at the station As research on cassava has increased wJ.th the expansion in the crop other field crop research statJ.ons l.n the northeast have also conducted experJ.mental work on cassava all of which is coordinated by the Root Crops Branch WJ.thin the F1eld Crop Divis1on of the Department of Agriculture
For the first two decades cassava research focused on soJ.l management and fertilJ.zatJ.on (see SJ.ttJ.bursaya and KurmardrJ.ta 1978 for a summary of this research) The prl.ncipal features of this work are well summarJ.zed by the Committee for the Lower Mekong Basl.n (1979) namely high yearly y1eld fluctuauons probably related to rainfall conditions rapidly declining y1elds of unfertJ.lJ.zed plots and varJ.able response to fertl.ll.zers While the research has led to a set of fertilizer recommendations broken down by soil type and while a series of farm level demonstratJ.on trials were also carrl.ed out only ml.nor adoptl.on of fertl.ll.zer has occurred Some research J.n this area contJ.nues to be done even though l.t follows virtually the same approach The few devJ.ations have been toward evaluatJ.on of green and organic manures These have shown promising results (Table 7 12) but have not led to any recommendations
Lack of progress in the area of fertilization gave l.mpetus to the development of a varJ.etal improvement program Local clones were collected J.n 1956 These were evaluated for agronoml.c characters and yielding abill.ty but were found not to show significant differences One was selected and named Rayong 1 whJ.ch was used as a check var1ety 1n all
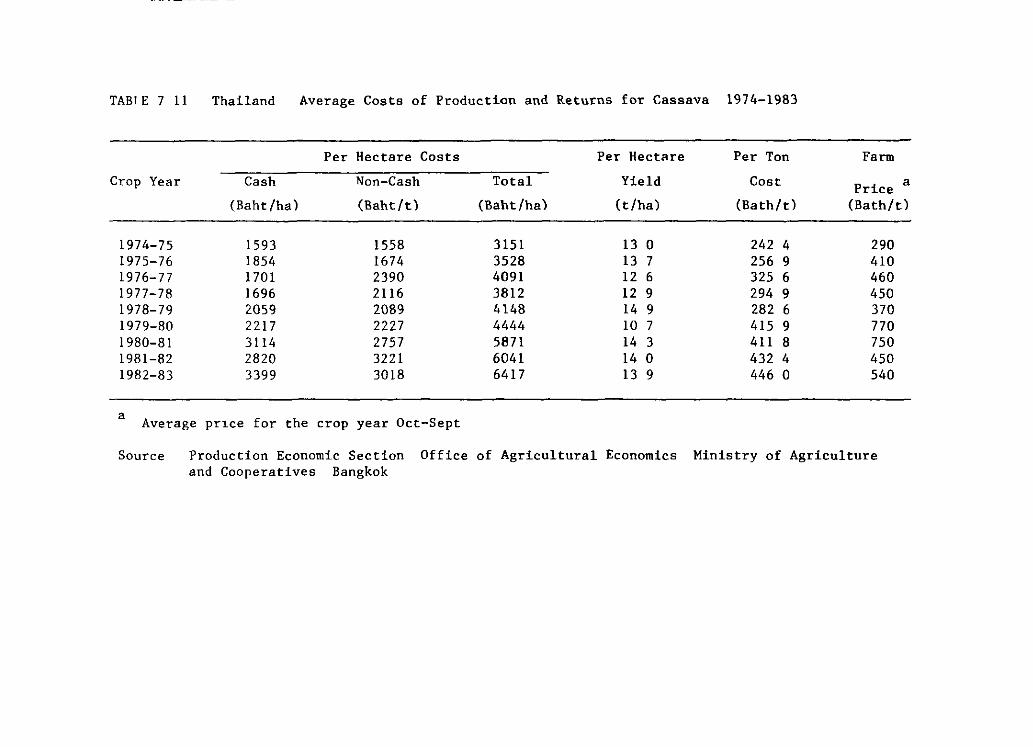
TABT E 7 11 Thailand Average Costa of Production and Returns for Cassava 1974-1983
Per Hectare Costs Per Hectare Per Ton Farro
Crop Year Cash Non-Cash Total Yield Cost Price a
(Baht /ha) (Baht/t) (Baht/ha) (t/ha) (Bath/t) (Bath/t)
1974-75 1593 1558 3151 13 o 242 4 290 1975-76 1854 1674 3528 13 7 256 9 410 1976-77 1701 2390 4091 12 6 325 6 460 1977-78 1696 2116 3812 12 9 294 9 450 1978-79 2059 2089 4148 14 9 282 6 370 1979-80 2217 2227 4444 lO 7 415 9 770 1980-81 3114 2757 5871 14 3 411 8 750 1981-82 2820 3221 6041 14 o 432 4 450 1982-83 3399 3018 6417 13 9 446 o 540
a Average pr1ce for the crop year Oct-Sept
Source Production Economic Section Office of Agricultura! Economics Ministry of Agriculture and Cooperatives Bangkok
VII - 9 -
succeeding experimental work While some selection from collected open-pollinated seed started in 1971 a controlled hybridization program did not begin till 1974 (Sinthruprama 1978) Initial crosses were between Rayong 1 and other local cultivara In 1977 varieties from CIAT were introduced as well as seed from controlled hybridization This served to s1gnificantly expand the germplasm on which the crossing program was based
Initial selection is based on high root yield and high starch content In later evaluations earliness and appropr1ate plant type for intercropping are introduced as selection characteristics Promising materials are evaluated for drought tolerance resistance to the few cassava d1seases and pests that occur in Tha1land and in some cases for ed1ble qual1ty characteristics A test1ng program of regional and on-farm trials resulted in the release in 1983 of the first promising var1ety Rayong 3 Its principal advantages over Rayong 1 are a higher starch content and a higher response to chemical fertilizer As yet it is too early to evaluate the adoption of this variety
New production technology has not been necessay to the rapid expans1on in cassava cultivat1on The high yields obtained with the local variety as new land was cultivated and the high prices set by the European Community were sufficient to ma1ntain h1gh profits in cassava cultivation These profit levels are now com1ng under pressure from two sources the decreas1ng yields as soil fertility decl1nes and uncertain access to the European Community as the EC attempts to reduce cassava imports The latter will requ1re lower price levels as Thailand looks to alternative internat1onal market5 which 1n turn will result in a cost-price squeeze at the farm level effectively 1ncreas1ng the demand for improved technology The research program 18 in a po5ition where a new variety 1n and of itself w111 not have a high probability of markedly improving yields Th1s will occur only if the variety is combined w1th a viable 5011 fert1lity management strategy The first s1gns of farmer adoption of fert1l1zer are occurring in the old production area5 of Chomburi and Rayong Motivat1ng this trend will prov1de the base for yield ga1ns though new var1et1es
Market5 and Demand
The development of the Tha1 cassava economy (together with that of Malaysia) has followed the reverse of the normal pattern That is growth in production was in1t1ally driven by export market development Only after export market channels were well 1n place d1d domestic markets of any size beg1n to develop Price formation was always based on cassava as a tradeable good 1n 1nternat1onal markets and Tha1 farmers and cassava processors based their decisions on price 1ncentives set 1n these markets An analysis of the Tha1 cassava economy in thus dependent on an evaluat1on of cassava demand 1n internat1onal markets (see Chapter VIII) and of price format1on in these markets
The Cassava Pellet Export Market
The export market for cassava chips and pellets dom1nates the Tha1 cassava economy High grain pn.ces in Europe f1rst 1n West Germany and
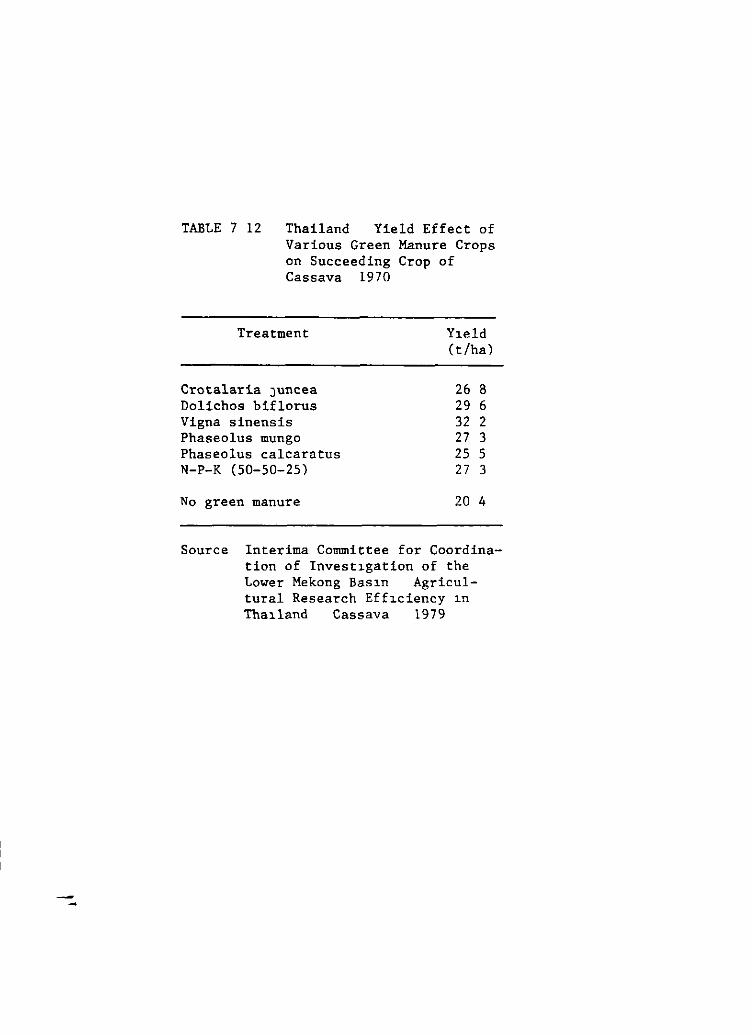
TABLE 7 12 Thailand Yield Effect of Various Green Manure Crops on Succeeding Crop of Cassava 1970
Treatment
Crotalaria Juncea Dolichos biflorus Vigna sinensis Phaseolus mungo Phaseolus calcaratus N-P-K (50-50-25)
No green manure
Y1eld (t/ha)
26 8 29 6 32 2 27 3 25 5 27 3
20 4
Source Interima Committee for Coordination of Invest1gation of the Lower Mekong Bas1n Agricultura! Research Eff1ciency 1n Tha1land Cassava 1979
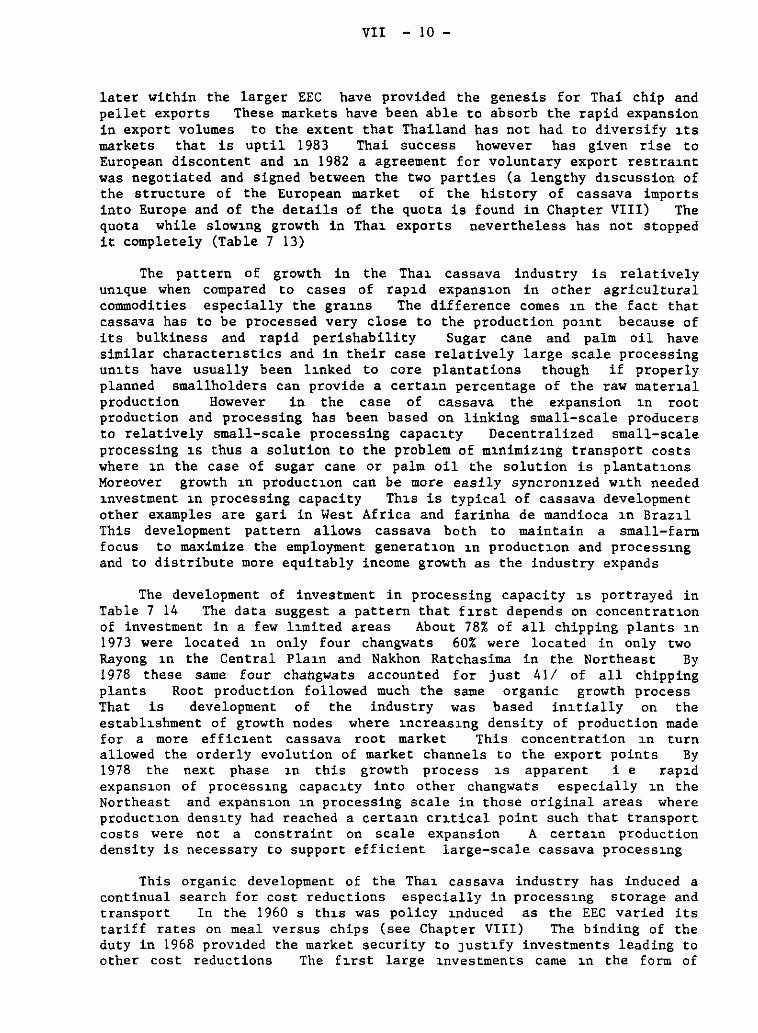
VII - 10 -
later within the larger EEC have provided the genesis for Thai chip and pellet exports These markets have been able to absorb the rapid expansion in export volumes to the extent that Thailand has not had to diversify 1ts markets that is uptil 1983 Thai success however has given rise to European discontent and 1n 1982 a agreement for voluntary export restra1nt was negotiated and signed between the two parties (a lengthy d1scussion of the structure of the European market of the history of cassava imports into Europe and of the details of the quota is found in Chapter VIII) The quota while slow1ng growth in Tha1 exports nevertheless has not stopped it completely (Table 7 13)
The pattern of growth in the Tha1 cassava industry is relatively un1que when comparad to cases of rap1d expans1on in other agricultural commodities especially the gra1ns The difference comes 1n the fact that cassava has to be processed very close to the production po1nt because of its bulkiness and rapid perishability Sugar cane and palm oil have similar character1stics and in their case relatively large scale processing un1ts have usually been l1nked to core plantations though if properly planned smallholders can provide a certa1n percentage of the raw mater1al production However in the case of cassava the expansion 1n root production and processing has been based on linking small-scale producers to relatively small-scale processing capac1ty Decentralized small-scale processing 1s thus a solution to the problem of m1nimiz1ng transport costs where 1n the case of sugar cane or palm oil the solution is plantat1ons Moreover growth 1n product1on can be more easily syncron1zed w1th needed 1nvestment 1n processing capacity Th1s is typical of cassava development other examples are gari in West Africa and farinha de mandioca 1n Braz1l This development pattern allows cassava both to maintain a small-farm focus to maximize the employment generat1on 1n product1on and process1ng and to distribute more equitably income growth as the industry expands
The development of investment in processing capacity 1s portrayed in Table 7 14 The data suggest a pattern that f1rst depends on concentrat1on of investment in a few l1mited areas About 78% of all chipping plants 1n 1973 were located 1n only four changwats 60% were located in only two Rayong 1n the Central Pla1n and Nakhon Ratchasima in the Northeast By 1978 these same four changwats accounted for just 41/ of all chipping plants Root production followed much the same organic growth process That is development of the industry was based in1tially on the establ1shment of growth nodes where 1ncreas1ng density of production made for a more effic1ent cassava root market This concentration 1n turn allowed the orderly evolution of market channels to the export points By 1978 the next phase 1n this growth process 1s apparent i e rap1d expans1on of process1ng capac1ty into other changwats especially 1n the Northeast and expans1on 1n processing scale in those original areas where product1on dens1ty had reached a certa1n cr1tical point such that transport costs were not a constraint on scale expansion A certa1n production density is necessary to support efficient large-scale cassava process1ng
This organic development of the Tha1 cassava industry has induced a continual search for cost reductions especially in process1ng storage and transport In the 1960 s th1s was policy 1nduced as the EEC varied its tariff rates on meal versus chips (see Chapter VIII) The binding of the duty in 1968 prov1ded the market security to JUSt1fy investments leading to other cost reductions The f1rst large 1nvestments came 1n the form of
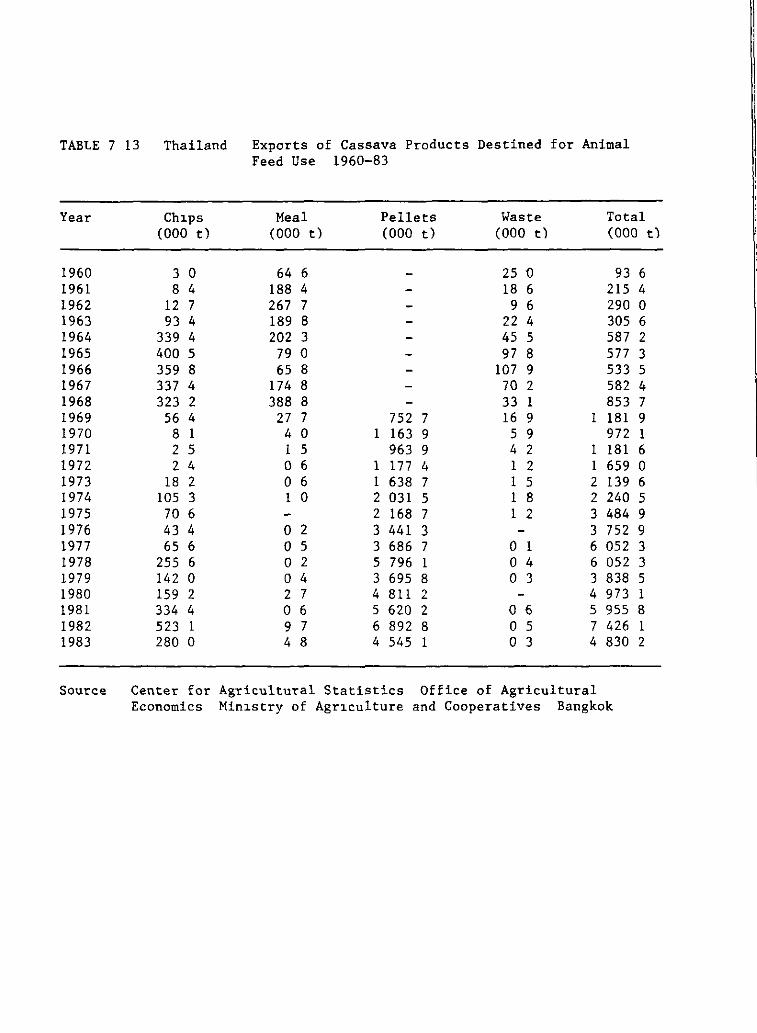
TABLE 7 13 Thailand Exports of Cassava Products Destined for Animal Feed Use 1960-83
Year Ch1ps Me al Pellets Waste Total (000 t) (000 t) (000 t) (000 t) (000 tl
1960 3 o 64 6 25 ú 93 6 1961 8 4 188 4 18 6 215 4 1962 12 7 267 7 9 6 290 o 1963 93 4 189 8 22 4 305 6 1964 339 4 202 3 45 5 587 2 1965 400 S 79 o 97 8 577 3 1966 359 8 65 8 107 9 533 5 1967 337 4 174 8 70 2 582 4 1968 323 2 388 8 33 1 853 7 1969 56 4 27 7 752 7 16 9 1 181 9 1970 8 1 4 o 1 163 9 S 9 972 1 1971 2 S 1 S 963 9 4 2 1 181 6 1972 2 4 o 6 1 177 4 1 2 1 659 o 1973 18 2 o 6 1 638 7 1 S 2 139 6 1974 105 3 1 o 2 031 S 1 8 2 240 S 1975 70 6 2 168 7 1 2 3 484 9 1976 43 4 o 2 3 441 3 3 752 9 1977 65 6 o 5 3 686 7 o 1 6 052 3 1978 255 6 o 2 S 796 1 o 4 6 OS2 3 1979 142 o o 4 3 69S 8 o 3 3 838 S 1980 1S9 2 2 7 4 811 2 4 973 1 1981 334 4 o 6 S 620 2 o 6 5 9S5 B 1982 S23 1 9 7 6 892 8 O S 7 426 1 1983 280 o 4 8 4 S4S 1 o 3 4 830 2
Source Center for Agricultural Statistics Office of Agricultural Economics Minl.stry of Agr1culture and Cooperatives Bangkok
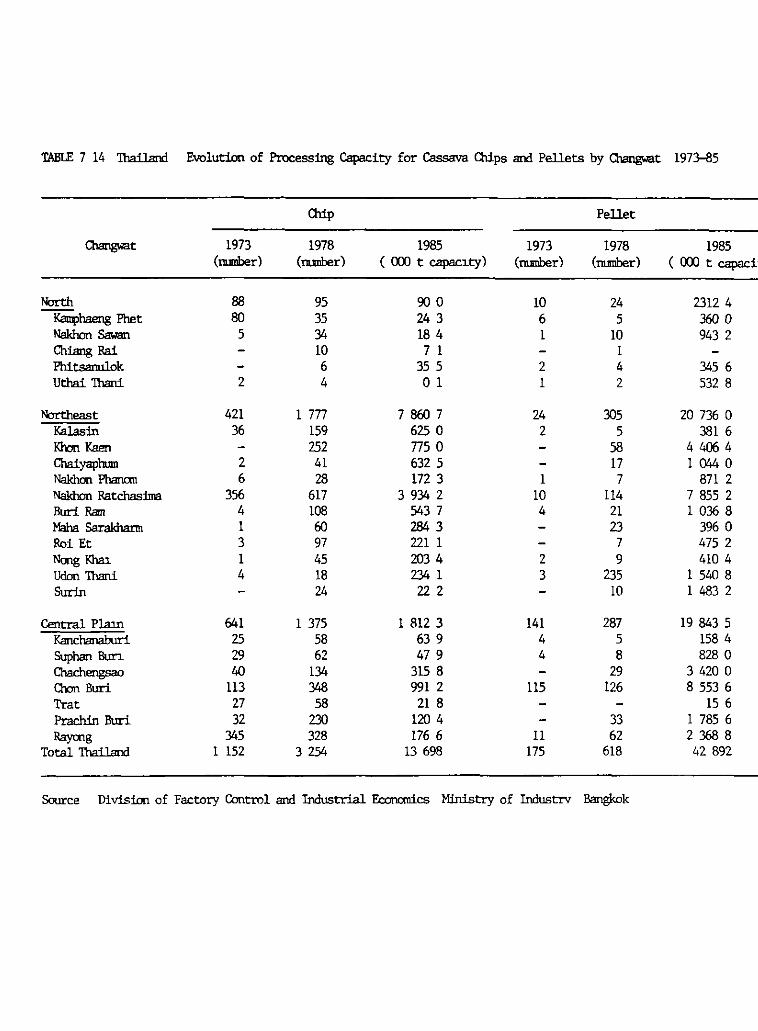
TABLE 7 14 Thailand Evolution of Processing Capacity for Cassava Chlps and Pellets by <llangwat 1973-85
Chip Pellet
<llangwat 1973 1978 1985 1973 1978 1985 (Illll!lber) (nunber) ( (XXJ t capaCl.ty) (nunber) (Illll!lber l ( COO t capacit
North 88 95 900 10 24 2312 4 ~haeng Phet 80 35 24 3 6 5 3600 Nakhon Sawan 5 34 18 4 1 lO 943 2 Chiang Rai lO 7 1 1 Phitsarrulok 6 35 5 2 4 345 6 Uthai Thani 2 4 o 1 1 2 532 8
Northeast 421 1 777 7 860 7 24 305 20 736 o Ka.las:ln 36 159 625 o 2 5 381 6 Klm Kaen 252 775 o 58 4 406 4 Chaiyaplun 2 41 632 5 17 1 044 o Nakhon Phanan 6 28 172 3 1 7 871 2 Nakhon Ratchas:lna 356 617 3 934 2 10 114 7 855 2 Buri Ram 4 108 5437 4 21 1 036 8 Maha Sarakhann 1 60 284 3 23 396 o Roi Et 3 97 221 1 7 475 2 Nong Khal. 1 45 203 4 2 9 410 4 Udon Thani 4 18 234 1 3 235 1 540 8 Sur:ln 24 222 lO 1 483 2
Central Plam 641 1 375 1 812 3 141 287 19 843 5 Kanchanaburl 25 58 63 9 4 5 158 4 Suphan Bun 29 62 47 9 4 8 828 o Chachengsao 40 134 315 8 29 3 420 o 01011 Buri 113 348 991 2 115 126 8 553 6 Trat 27 58 21 8 15 6 Prachin Buri 32 230 120 4 33 1 785 6 Raymg 345 328 176 6 11 62 2 368 8
Totsl Thailand 1 152 3 254 13 698 175 618 42 892
Source Division of Factory Control and Industrial Ecoromics M:lnistry of Industrv Bangkok
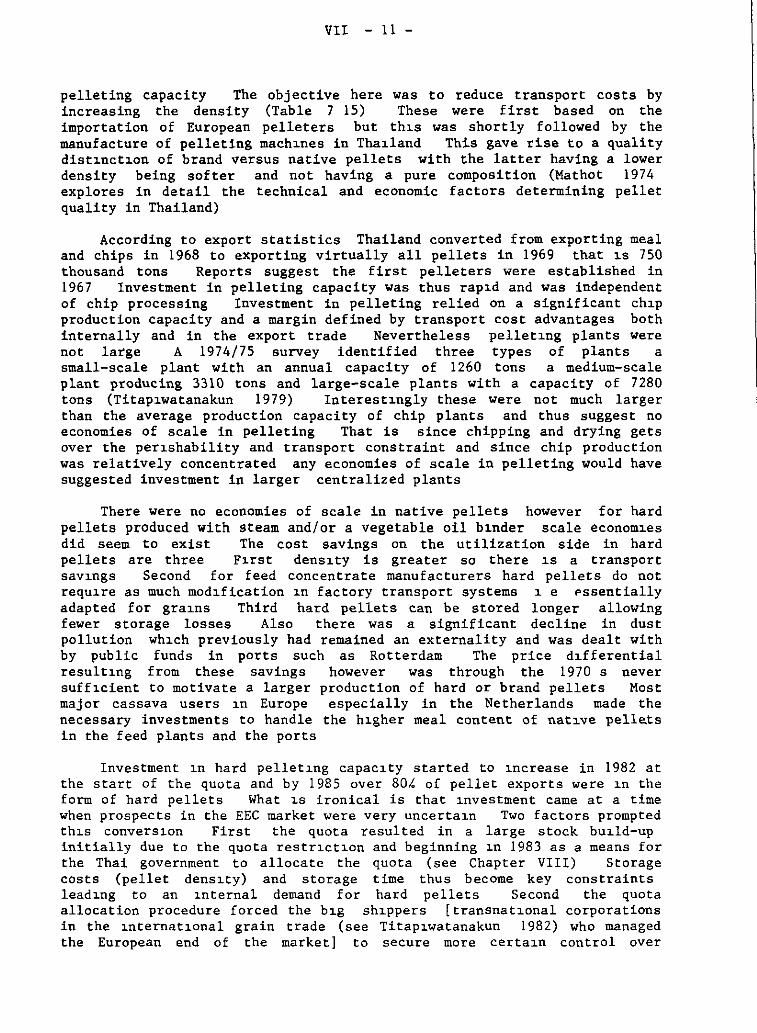
VII - 11 -
pelleting capacity The objective here was to reduce transport costs by increasing the density (Table 7 15) These were first based on the importation of European pelleters but th~s was shortly followed by the manufacture of pelleting mach~nes in Tha~land This gave rise to a quality dist~nct~on of brand versus native pellets with the latter having a lower density being softer and not having a pure composition (Mathot 1974 explores in detail the technical and economic factors determining pellet quality in Thailand)
According to export statistics Thailand converted from exporting meal and chips in 1968 to exporting virtually all pellets in 1969 that ~s 750 thousand tons Reports suggest the first pelleters were established in 1967 Investment in pelleting capacity was thus rap~d and was independent of chip processing Investment in pelleting relied on a significant ch~p production capacity and a margin defined by transport cost advantages both internally and in the export trade Nevertheless pellet~ng plants were not large A 1974/75 survey identified three types of plants a small-scale plant with an annual capacity of 1260 tons a medium-scale plant producing 3310 tons and large-scale plants with a capacitY of 7280 tons (Titap~watanakun 1979) Interest~ngly these were not much larger than the average production capacity of chip plants and thus suggest no economies of scale in pelleting That is since chipping and drying gets over the per~shability and transport constraint and since chip production was relatively concentrated any economies of scale in pelleting would have suggested investment in larger centralized plants
There were no economies of scale in native pelleta however for hard pellets produced with steam and/or a vegetable oil b~nder scale econom~es did seem to exist The cost savings on the utilization side in hard pellets are three Fl.rst dens~ty is greater so there ~s a transport sav~ngs Second for feed concentrate manufacturera hard pelleta do not requl.re as much mod~fication 1n factory transport systems l. e Pssentially adapted for graws Third hard pellets can be stored longer allowing fewer storage losses Also there was a significant decline in dust pollution whl.ch previously had remained an externality and was dealt with by public funds in ports such as Rotterdam The price d1fferential result~ng from these savings however was through the 1970 s never suff1cient to motivate a larger production of hard or brand pelleta Most majar cassava users 1n Europe especially in the Netherlands made the necessary investments to handle the h~gher meal content of nat~ve pellets in the feed plants and the ports
Investment l.n hard pellet1ng capac1.ty started to ~ncrease in 1982 at the start of the quota and by 1985 over 80k of pellet exports were l.n the form of hard pellets What ~s ironical is that l.nvestment came at a time when prospects in the EEC market were very uncertal.n Two factors prompted th~s conversl.on First the quota resulted in a large stock bu~ld-up initially due to the quota restrl.Ctl.On and beginning ~n 1983 as a means for the Thai government to allocate the quota (see Chapter VIII) Storage costs (pellet densl.ty) and storage time thus become key constraints lead1ng to an l.nternal demand for hard pellets Second the quota allocation procedure forced the b~g sh1ppers [transnatl.onal corporations in the 1nternat1.onal grain trade (see Titapl.watanakun 1982) who managed the European end of the market] to secure more certal.n control over
VII - 12 -
supplies in arder to guarantee their forward contracting in Europe They did this by backward integration into large-scale hard pelleting plants usually of European manufacture Thai manufacturers d~d follow with the~r own cheaper models to upgrade native pelleting plants These produced a quasi-hard-pellet an ~ntermediate product between nat~ve and hard pellets
As the ~ndustry developed large investments were also made in storage and loading facil~ties at export points A reflection of this investment ~s the change in s~ze of ship that carried cassava Table 7 16 charts the progressive change to larger bulk-cassava carr~ers which in turn impl~ed investment in loading facilities in Thailand In 1980 the average cargo size for a ship haul~ng cassava was 87 thousand tons This compares to an average size of 41 thousand tons for ships hauling grains of North American origin The Thai cassava trade was able to capture signif~cant economies of scale in ocean transport with Rotterdam being the only port that could take advantage of these scale economies Prices of cassava pellets in Hamburg for example are as much as 50 deutsche marks more expensive per ton than in Rotterdam Moreover cassava sh~pments to the United Kingdom are usually unloaded in Rotterdam and sent on lighter to U K ports
As ~n biology so in econom~cs growth is a far more complex process than surface -- or macro -- appearances would suggest Thailand ~n many ways offers an ~dealized growth pattern for cassava Early growth based on small-scale production and processing insures syncron~zation between the two in the growth process Economies of scale are poss~ble then when cr~t~cal market size and production densit~es are reached It is important to v~sualize cassava in th~s more dynamic sense when the comparative advantage of cassava versus grains is discussed later in the chapter Also what is important about the Thai cassava case ~s the rapid growth in ~nvestment ~n a industry characterized by relatively small-scale plants and the forward linkages that were made to domest~c manufacturing capac~ty
Investment ~n small-scale rural based industr~es ~s a particular characterist~c of Asian agr~culture -- one ~s tempted to attribute th~s to the constra1ned land resource base and the need for alternative employment in the rural sector the history of investment in the rural sector particularly 1rrigation and generally low incomes which makes even margins in small-scale process1ng attract1ve Cassava is in more ways than one well adapted to Asian cond1tions (see Chapter IX)
Price Format1on Price is the trottle that has controlled growth in the Thai cassava industry Understanding how pr1ces for cassava pellets are formed w1ll thus provide a basis for assess1ng both future prospects and an appropr1ate response to the EEC quota Because the maJar portian of Thai pellets are exported of which almost all go to the EEC the price of pellets 1n Tha1land and the price of pellets in Europe are 1nterdependent The pol1cy history of cassava in the EEC 1s discussed 1n Chapter VIII but suff1ce it here to say that since the binding in GATT of cassava at a 6/ ad valorem duty 1n 1968 cassava has had a compet1tive edge over gra1n imports which mu~t enter under the EEC s variable levy system S1nce domestic gra1n pr1ces 1n the EEC are normally well above world grain pr1ces and through the Common Agr1cultural Policy i~lated from 1nternational market cond1t1ons the cassava price is formed within the relat1ve conf1nes of the EEC market The impl1cat1ons for the cassava price 1s shown 1n F1gure 7 3 where the Rotterdam cassava pr1ce and the ma1ze threshold pr1ce
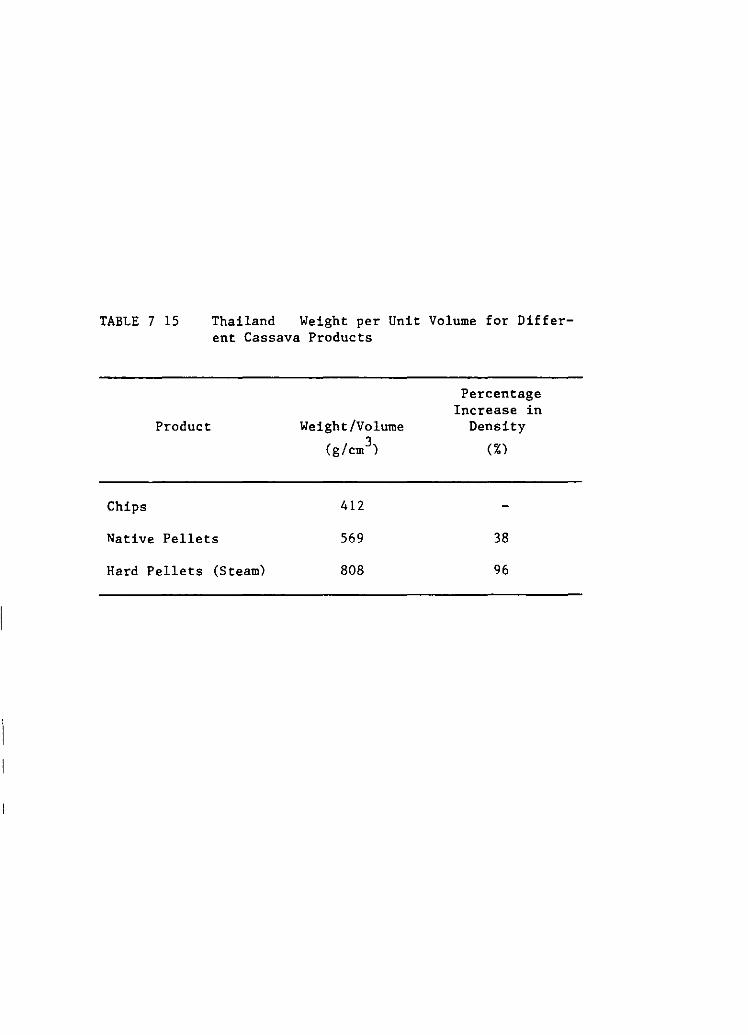
TABLE 7 15 Thailand Weight per Unit Volume for Different Cassava Products
Product
Chips
Native Pelleta
Hard Pellets (Steam)
Weight /Volume 3 (g/cm )
412
569
808
Percentage Increase in
Density
(%)
38
96
~ • -1
-. ...... -- -- ,¡-~=---- -': E~~ ... - .... .;:,¡:,_.._.. .¡_,.<i.JJ ....
""";;;-;.r;-.JOrl...-- ,.. ~ - • =Ql. ij ;!:,3 4J ;¡ 'V •
~ ii;:o 'ZP ~ -il ~' e :;;. r • .¡: ' oto ;¡- r ·- E- ~~{"" :J -· ~ ._.. H~
v.d.S:=~~-1 a ~e·=· ....--------------------~-----
-._, __ 4
11 ..,
' ¿
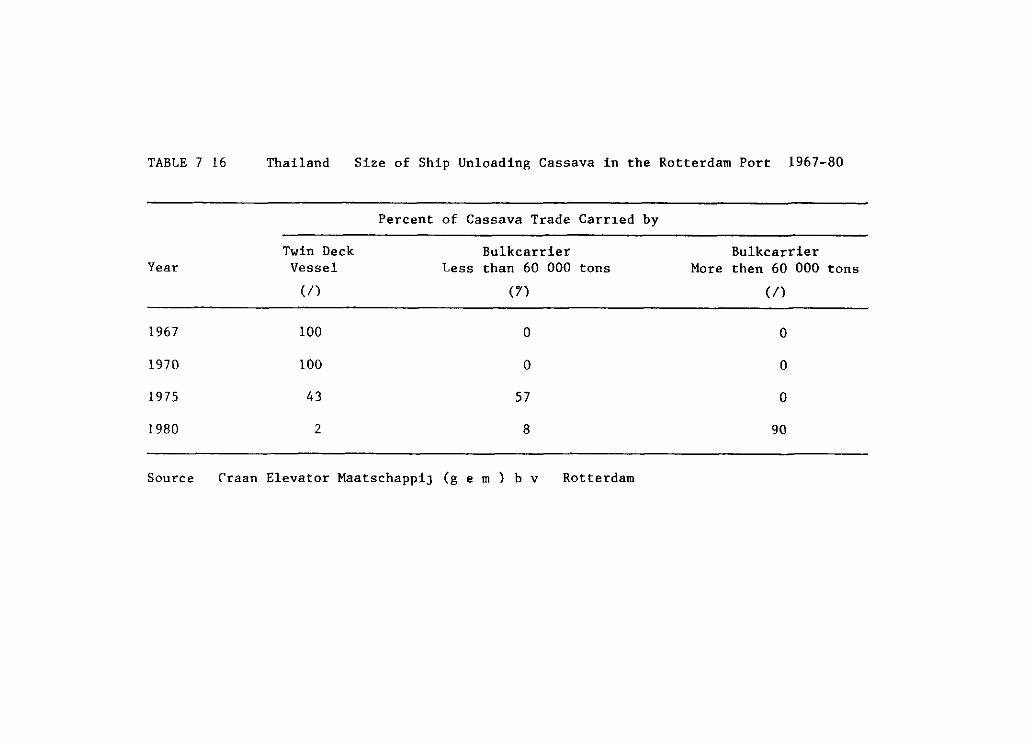
TABLE 7 16 Thailand Size of Ship Unloading Cassava in the Rotterdam Port 1967-80
Percent of Cassava Trade Carr1ed by
Twin Deck Bulkcarrier Bulkcarrier Year Vessel Less than 60 000 tons More then 60 000 tons
(/) (7) (/)
1967 lOO o o
1970 lOO o o
1975 43 57 o
1980 2 8 90
Source rraan Elevator MaatschappiJ (g e m ) b v Rotterdam
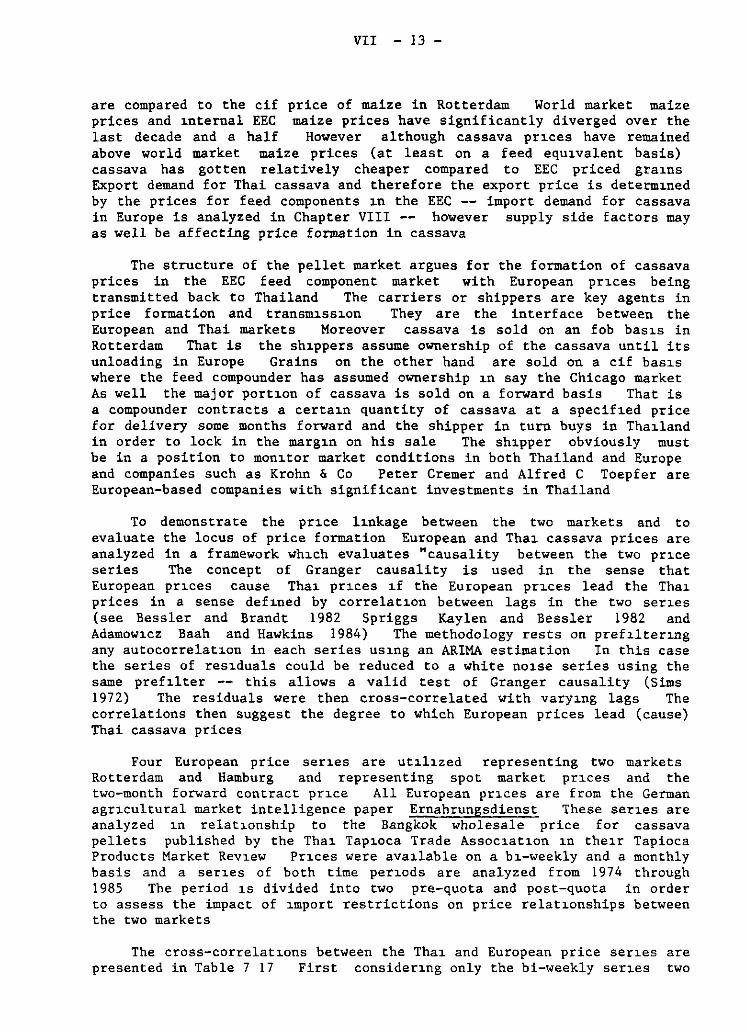
VII - 13 -
are compared to the cif price of maize in Rotterdam World market maize prices and 1nternal EEC maize prices have significantly diverged over the last decade and a half However although cassava pr1ces have remained above world market maize prices (at least on a feed equ1valent basis) cassava has gotten relatively cheaper compared to EEC priced gra1ns Export demand for Thai cassava and therefore the export price is determ1ned by the prices for feed components 1n the EEC -- import demand for cassava in Europe is analyzed in Chapter VIII -- however supply side factors may as well be affecting price formation in cassava
The structure of the pellet market argues for the formation of cassava prices in the EEC feed component market with European pr1ces being transmitted back to Thailand The carriers or shippers are key agents in price formation and transm1ss1on They are the interface between the European and Thai markets Moreover cassava is sold on an fob bas1s in Rotterdam That is the sh1ppers assume ownership of the cassava until its unloading in Europe Grains on the other hand are sold on a cif bas1s where the feed compounder has assumed ownership 1n say the Chicago market As well the majar port1on of cassava is sold on a forward basis That is a compounder contracts a certa1n quantity of cassava at a specif1ed price for delivery some months forward and the shipper in turn buys in Tha1land in arder to lock in the marg1n on his sale The sh1pper obviously must be in a position to mon1tor market conditions in both Thailand and Europe and companies such as Krohn & Co Peter Cremer and Alfred C Toepfer are European-based companies with significant investments in Thailand
To demonstrate the pr1ce l1nkage between the two markets and to evaluate the locus of price formation European and Tha1 cassava prices are analyzed in a framework wh1ch evaluates "causality between the two pr1ce series The concept of Granger causality is used in the sense that European pr1ces cause Tha1 pr1ces 1f the European pr1ces lead the Tha1 prices in a sense def1ned by correlat1on between lags in the two ser1es (see Bessler and Brandt 1982 Spriggs Kaylen and Bessler 1982 and Adamow1cz Baah and Hawkins 1984) The methodology rests on pref1lter1ng any autocorrelat1on in each series us1ng an ARIMA estimation In this case the series of res1duals could be reduced to a white no1se series using the same pref1lter -- this allows a valid test of Granger causality (Sims 1972) The residuals were then cross-correlated with vary1ng lags The correlations then suggest the degree to which European prices lead (cause) Thai cassava prices
Four European price ser1es are ut1l1zed representing two markets Rotterdam and Hamburg and representing spot market pr1ces and the two-month forward contract pr1ce All European pr1ces are from the German agr1cultural market intelligence paper Ernahrungsdienst These ser1es are analyzed 1n relat1onship to the Bangkok wholesale price for cassava pellets published by the Tha1 Tap1oca Trade Assoc1at1on 1n the1r Tapioca Products Market Rev1ew Pr1ces were ava1lable on a b1-weekly and a monthly basis and a ser1es of both time per1ods are analyzed from 1974 through 1985 The period 1s divided into two pre-quota and post-quota in arder to assess the impact of 1mport restrictions on price relat1onships between the two markets
The cross-correlat1ons between the Tha1 and European price ser1es are presented in Table 7 17 First consider1ng only the bi-weekly ser1es two
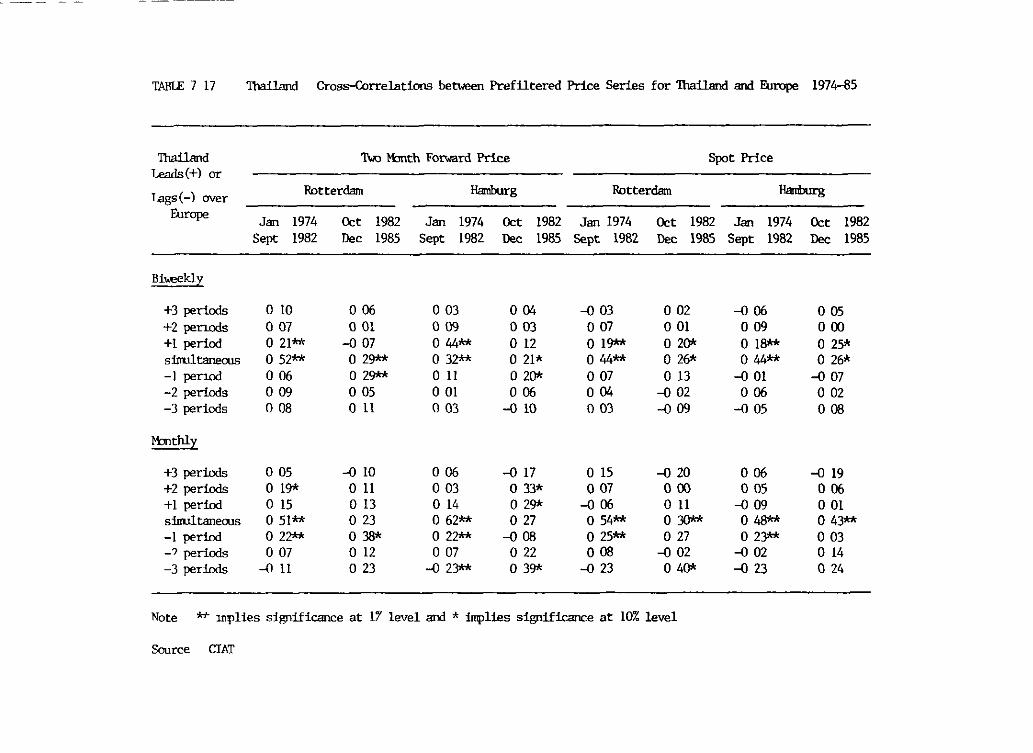
TARLE 7 17 Thailand Cross-correlations be~ Prefiltered Price Series for ThailBnd and Europe 1974-85
ThailBnd '!\., llinth Fornard Price Spot Price Leads(+) or
T.ags(-) over Rotterdam Hamburg Rotterdam Hamburg
Europe Jan 1974 Oct 1982 Jan 1974 Oct 1982 Jan 1974 Oct 1982 Jan 1974 Oct 1982 Sept 1982 !lec 1985 Sept 1982 llec 1985 Sept 1982 !lec 1985 Sept 1982 !lec 1985
Bi,..,eklz
+3 periods 010 o 06 o 03 004 -{) 03 o 02 -{)06 o 05 +2 penods o 07 o 01 009 o 03 o 07 o 01 o 09 000 +1 period o 21** -{) 07 o 44** o 12 o 19** o 20* o 18** o 25* sinultaneous o 52** 029** o 32** o 21* o 44** o 26* o 44** o 26* -1 penad o 06 029** 011 020* o 07 013 -{) 01 -{) 07 -2 periods o 09 o 05 001 006 004 -{) 02 006 o 02 -3 periods 008 011 o 03 -{)10 o 03 -{)09 -{) 05 008
M:mthly
+3 periods o 05 -{)10 o 06 -{) 17 o 15 -{) 20 006 -{) 19 +2 periods o 19* 011 o 03 o 33* o 07 000 o os 006 +1 period o 15 013 o 14 o 29* -{) 06 011 -{) 09 o 01 sinultanerus o 51** o 23 o 62** o 27 o 54** o 30** o 48** 043** -1 period 022** o 38* o 22** -{)08 o 25** o 27 o 23** o 03 -? periods o 07 o 12 o 07 o 22 008 -{) 02 -{) 02 o 14 -3 periods -D11 o 23 -{) 23** 039* -{) 23 o 40* -{) 23 o 24
Note *+ 1mplies significance at 17 level and * implies significance at 10% level
Source CIAT
VII - 14 -
structural features of the market are confirmed thac is the forward pr~ce generally gives a h~gher correlation between markets than the spoc price and in the case of the forward price the Rotterdam market is more closely linked to the Thai market then is the Hamburg market (for the spoc pr~ce the correlations are virtually the same comparing Rotterdam and Hamburg) Considering then only the case of the forward price Bangkok and Rotterdam prices in the 1974-82 period are significantly instantaneously correlated i e within the two-week time frame This representa relatively efficient flows of information between the two markets and therefore relatively close price integration Somewhat contrary to expectation there ~s also some residual tendency for the Bangkok price to lead (cause) the Rotterdam price In the very short-run this ~ndicates that the short-term supply situation in Thailand 1 e the ab~lity of the shipper to fill h1s forward contracts ~nfluences the price negotiated in Europe Th~s situation is even more marked in the case of Hamburg and again indicates thac Hamburg is not as rapidly integrated with the Bangkok market as is Rotterdam
The quota has radically changed this situation The scrength of ~ntegration becween Che two markecs has declined as reflected in Che lower correlation coefficients As will be shown later this has resulted in a widen~ng in the margin between the Cwo price series Moreover although ~nstantaneous causalicy between the two ser~es ~s still apparent European pr1ces under the quota lead Bangkok prices Under the quota short term supply needs are adequately mec by scocks while in Europe cassava supplies are conscra1ned by the quota Cassava does not have Co sell at much of a discount co gra1ns in order to move available supplies Therefore short-term price formation shifted over to demand s1de factors but with a decline in the strength of the direct price transmission back to Tha1land
Price transm1ssion between Europe and Thailand in the past has run in both direct1ons but for monthly data at least the analys1s suggests that Europe leads the Thai price The pr1ce transmiss1on process is then analyzed by making Thai cassava pr1ces a function of European pr1ces at varying lags the transport costs and a dummy variable for the quota per1od The results in Table 7 18 suggest thac only 49% of pr1ce changes 1n Europe is passed back to Thailand in the first month and another 29% in the second month The transport cost variable was negative as expected but not s1gnif1cant This was due to the inab1lity to construct a series that reflected the change in scale of shipping during the penad the variable as specif1ed assumes the same size ship Finally the dummy var1able for the quota period is negative implying that the marg1n between Europe and Thailand has w1dened under the quota This is to be expected wich upward pressure on cassava pr1ces in Europe due co a constra1ned supply and downward pressure on prices in Tha1land due co rising stock levels As is expla1ned in Chapter VIII Tha1 quota management pol1cy has ut1l1zed th1s larger marg1n to finance chird-country exports rather chan allowing a w1defall profit to accrue to cassava exporc compan1es
The prev1ous analys1s argued chac the locus of pr1ce format1on in this cassava market occurs e1ther at the level of negot1at1ons between che shipp1ng company and European feed manufacturer or becween the shipping company and Thai suppliers the type of suppl1er depending on how far back into the market the shipping company is integrated This impl1es that root and ch1p pr1ces are determined by pellec prices whether set in Europe or
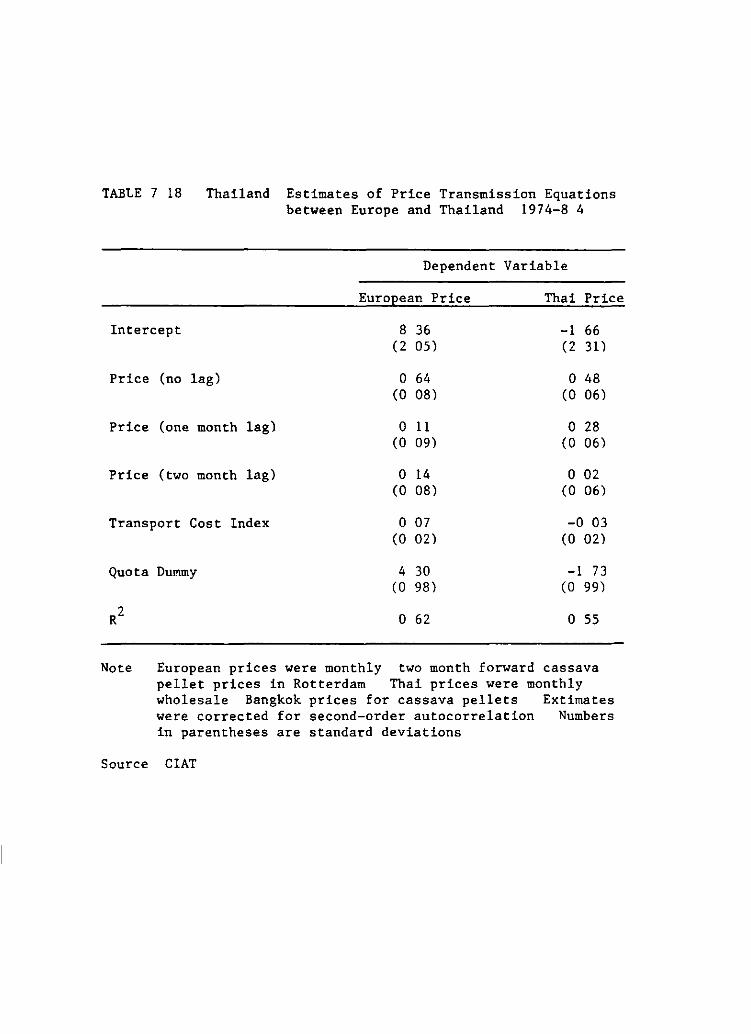
TABLE 7 18 Thailand Estimates of Price Transmission Equations between Europe and Thailand 1974-8 4
Dependent Variable
European Price Thai Price
Intercept 8 36 -1 66 (2 05) (2 31)
Price (no lag) o 64 o 48 (O 08) (O 06)
Price (one month lag) o 11 o 28 (O 09) (O 06)
Price (two month lag) o 14 o 02 (O 08) (0 06)
Transport Cost Index o 07 -0 03 (O 02) (0 02)
Quota Dummy 4 30 -1 73 (O 98) (O 99)
o 62 o 55
Note European prices were monthly two month forward cassava pellet prices in Rotterdam Thai prices were monthly wholesale Bangkok prices for cassava pellets Extimates were corrected for second-order autocorrelation Numbers in parentheses are standard deviations
Source CIAT
VII - 15 -
in Thailand This pattern is d1stinct from grains were normally processing 1s a mark-up on grain prices set in bulk wholesaling markets In the cassava situation the standard accounting for the chip and pellet1ng process1ng are
P = e P + e + R and e e r e e
P = e P + e + R p p e p p
where P representa price e is conversion rate e is operating cost and R is operating proht and the subscripts refer to roots(r) chips(e) and pellets (p) However g1ven the assumptions on price formatl.on prl.ce transmission equations for cassava chips and roots are as follows
p 1 p - (e + R ) and = r e e e e e
p 1 P - (e + R ) = e p p p e p
Making the variables stochastic and assuming an error term the above equations were estJ.mated and the results are presented in Table 7 19 The pellet equations follow expeetations with the estJ.mated eonversJ.on rates be1ng w1thin a reasonable range of but somewhat below the figure of 976 c1ted by industr1al sources The estimated operating marg1n (per 100 kg ) however 1s s1gnif1cantly below the actual budgeted costs of pelletJ.ng (see below) Nevertheless what the pr1ce transmissJ.on equations for pellets do suggest is quite restricted margins and therefore a very eompetit1ve 1ndustry
The ch1p equatJ.ons on the other hand only part1ally eonf1rm expectations The conversJ.on rates 1n ehonburi and Rayong are very clase to the 372 figure used by 1ndustrial sources wh1le the estimated conversion rate in Korat 1s unreasonably high suggesting a far higher leve! of effieiency than can be expected to be the case On the other hand the operat1ng margin estimates cover a wide range from being reasonable 1n Korat to being sign1f1cantly positJ.ve l.n ehonbur1 l. e reflecting operating losses The equatJ.ons suggest a delicate balance between operatJ.ng margins and convers1on rates a bindJ.ng charactistic in the profJ.table operatJ.on of a ch1pp1ng plant The equatJ.ons agal.n demonstrate the lJ.mited margJ.ns withl.n which the chipp1ng plants have to operate to turn a profit Given the chl.p pr1ce competit1on w1th1n the industry has generated relatJ.vely high root prices and ll.ml.ted operating marg1.ns
Pr1ce formatJ.on 1n summary 1n the Tha1-European pellet market l.S eff1c1.ent reflect1ng the very compet1tive nature of the Thal. cassava J.ndustry Any excess profits when they occur e1ther accrue to cassava farmers or result in inflated margins for the shipp1ng companies (f1gure 7 4) The later has occurred as a result of the impositl.on of the quota but Thai pol1ey has 1ssured that these windfall profJ.ts are d1rected towards open1ng up new markets for cassava pellets
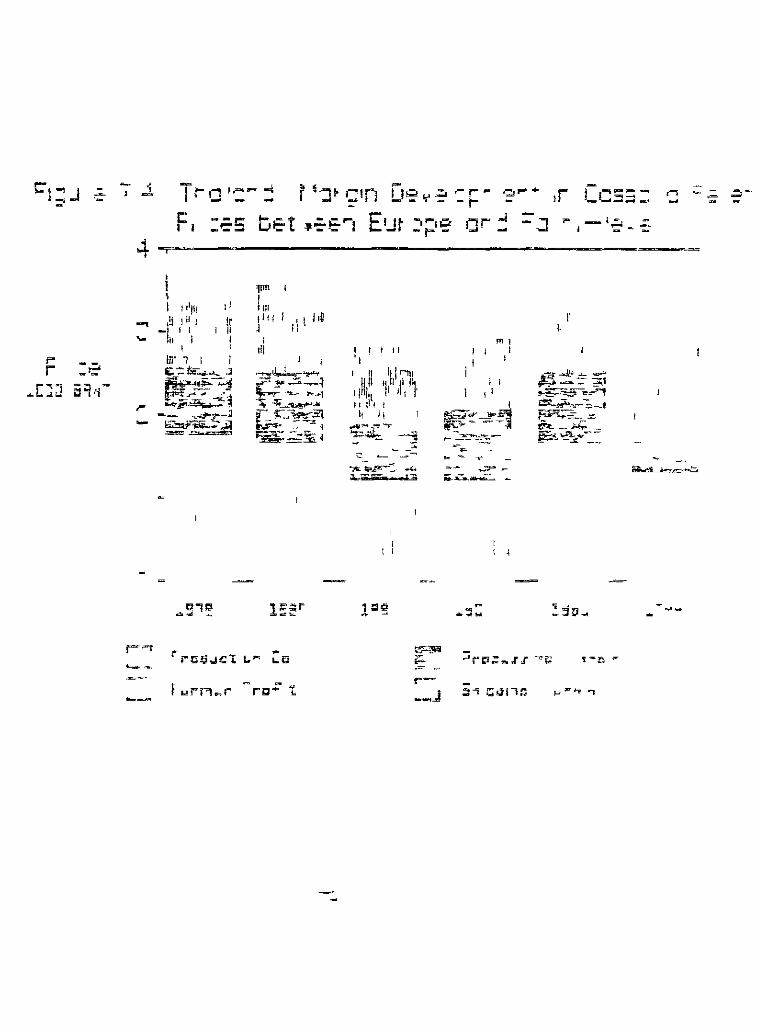
¡:-!; J 'Z .i
4
...
._ ¡-
r :.:-... ~,
.... L.,,¡¡..; ¡;¡;¡lj-.--
r''"" ..__
---
-Tr,.., ,,..._ ...¡ 1 _.¡ - - r 1 -:J~ Ctn 1 1 ,:, .::. .- r- ---"'--r- ~,.. ...
F1 -.=.s ---r
! !I!H ,,
~ J u 1 'r -1' 1 ¡,
" 1 1 1 1
llr 1 1 1 ¡;,-:::::!;e_....._ .J
~-~ ~~
~~ -- --.1:-' ~~.,il ~ ..,ew.,;¡;¡;;.•
tlíl:'l ~~ ~
1-- t "'.;E-r-1 E,,. ....... ~ 1..'1::' -· - r-
'11"' 1 1m 1 j¡ ¡ 1 1 /lb J 11
1 111
11 1 1 11
' 1
-~- 1 11 h 1 rtll (..,~.;:;~1 1/11 1¡11 11 1~
~ h-'j 1/1111¡ t1 1 1 r ~.!!L...~t;.,lr; 11 ¡1¡ 1 p ;::_"""a¡ 11 11
~--~-~~ ~--~ ...... ~~ 4 == ~ ~ --
"]~¡.;.~~~ .... ~ --a."if
1~.-:;r ~~
Hl~ ~
- ~:JO
¡¡r ..¡ ... -
1 1
¡'
m1 1
1
1 1 1 1
1
1 '
~ ~
-~~
-,J
,r ...
r '
re-=-- ;::¡ _ _.
- •.::. ' -
~~tl~
rro~.Jct ~..~ L.fl ~ ,.Ji""ti=-.rr ~¡; ,--e ~ -
f u!"'f"''!-1" .--
re~ ~ ::; ~!lll~ ._~, ... e ~-.J
,..., ~ ~
.:::,--
~-
VII - 16 -
Profitability of the Cassava Pellet Industry The very marked rate of growth in the Thai cassava 1ndu8try was driven by the relative profitab1lity of the industry especially 8ince pr1ce9 5et in Europe were eff1c1ently tran9m1tted to ca55ava root producer8 The profitab1lity of ca85ava at the farm level 18 8hown in Figure 7 4 which pre5ent8 a graphic picture of margin development in the ca55ava indu5try Farm-level profit8 were highly variable but even in year8 with low pr1ce9 prof1ts were sign1ficant Not surprisingly root production showed cont1nuous growth even with quite significant var1ability in prices
Another maJor characteristic of the cassava industry 18 that the farm-level root price makes up only between 40 to SO-' of the eventual f o b pr1ce By comparison farm level production costs make up 83r of f o b costs of maize in the U S A (Ortmann Stulip and Rask 1986) The ab1lity of cassava to compete with grains thus lies in its relatively low product1on costs and an efficient process1ng industry As seen 1n Figure 7 4 the processing margin d1d not vary s1gn1ficantly over the 1975-84 period
Cassava i8 very profitable for Tha1land A complete cost accounting for 1981 is summar1zed 1n Table 7 20 (see Appendix 7 2 for details) The costs are d1saggregated by domestic factor costs foreign 1mport costs and government taxes includ1ng tariffs All costs are at 1981 market pr1ces w1th 1nterest rates being at the commerc1al loan rate of 19% There are no indicat1ons of any market imperfections that would cause market prices of factors to dev1ate from their opportunity cost (see Bertrand 1980 and Lokaphadhana 1981) Nor until the quota was there any 1ntervention by the government 1n the cassava export trade The Thai cassava industry was one of the few examples of an 1ndustry that functioned without government intervention Deducting taxes and tariffs thus closely approx1mates soc1al costs of producing cas5ava
The cost breakdown suggests that root product1on costs are two-thr1ds of total f o b costs of cassava pellets Chipp1ng pelleting and export costs relat1vely equally d1vide the other th1rd Labor is by far the largest cost component making up 47% of total costs Import costs are relat1vely low making up only 11% of production costs Comparing costs to 1981 pr1ces 1mplies that almost 30% of the f o b price was garnered by the economy as soc1al prof1t with almost two-th1rds of that go1ng to the cassava farmer From a social point of view cassava was very profitable to the Tha1 economy and especially for the 1ncomes of the populat1on 1n the poorest sector of the economy the rural Northeast
The quota has made apparent the pol1t1cal underp1nnings of the internat1onal market for cassava pellets Uncerta1nty about long-term access to the European market has ra1sed the quest1on about the ab1l1ty of the Thai cassava 1ndustry to compete 1n the larger 1nternat1onal feedgrain market The first point to emphasize 1s that because Tha1land d1d not sell cassava in the 1nternational feedgra1n mantet up till the quota does not necessarily 1mply that cassava could not compete 1n that market The analys1s to date and that presented in Chapter VIII clearly shows that Thailand could sell all its product1on 1n Europe at pr1ces above what could have been obtained on the world feedgrain market obv1ously it was more prof1table for Tha1land to sell all 1ts product1on 1n the European market This s1tuat1on has changed with the quota and the issue of cassava s
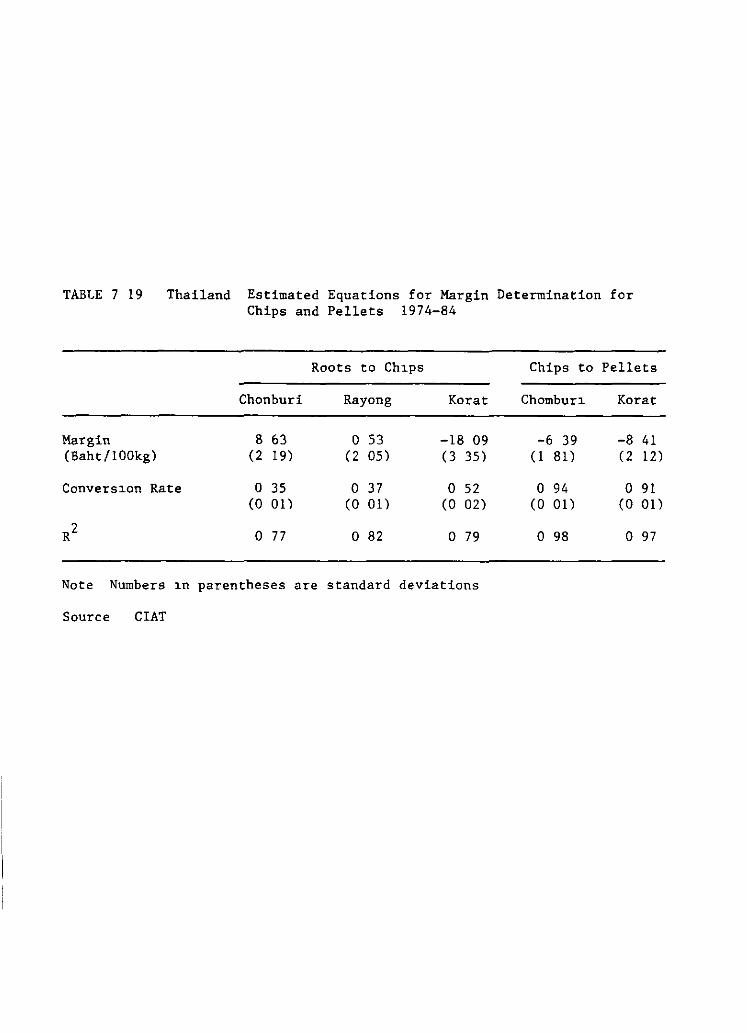
TABLE 7 19 Thailand Estimated Equations for Margin Determination for Chips and Pellets 1974-84
Roots to Ch1ps Chips to Pellets
Chonburi Rayong Korat Chombur1 Korat
Margin 8 63 o 53 -18 09 -6 39 -8 41 (Baht/100kg) (2 19) (2 05) (3 35) (l 81) (2 12)
Convers1.on Rate o 35 o 37 o 52 o 94 o 91 (O 01) (O 01) (O 02) (O 01) (O 01)
R2 o 77 o 82 o 79 o 98 o 97
Note Numbers 1n parentheses are standard deviations
Source CIAT
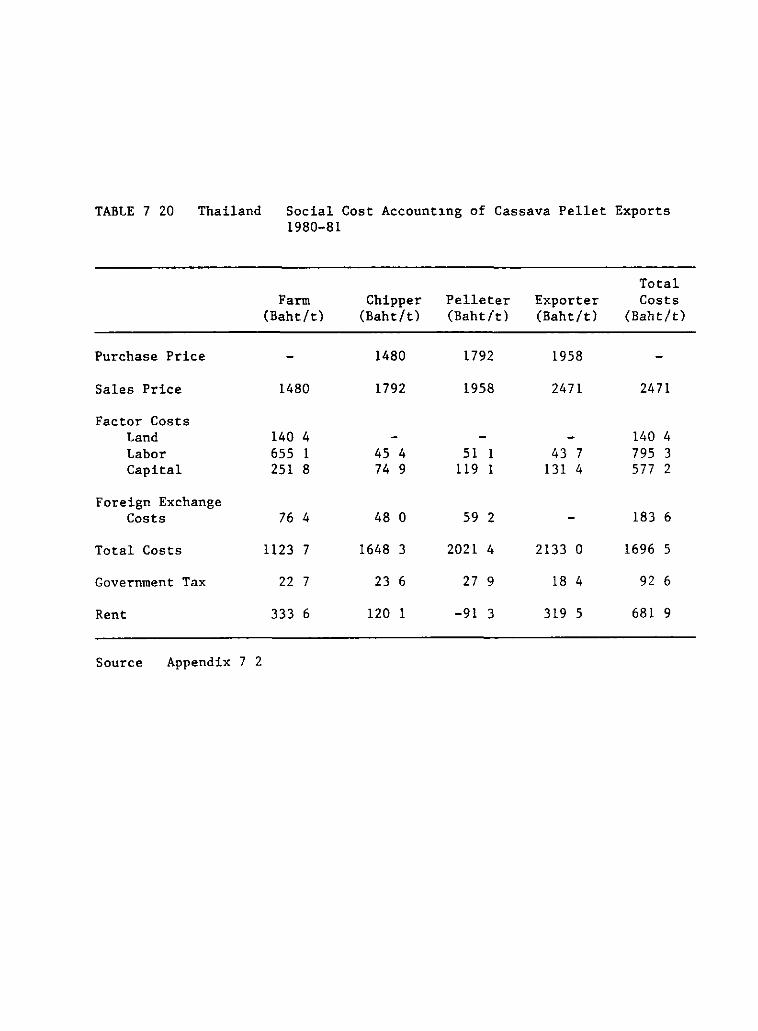
TABLE 7 20 Thailand
Purchase Price
Sales Price
Factor Costs Land Labor Capital
Foreign Exchange Costs
Total Costs
Government Tax
Rent
Source Appendix 7 2
Social Cost Account1ng of Cassava Pellet Exports 1980-81
Total Farm Chipper Pelle ter Exporter Costs
(Baht/t) (Baht/t) (Baht/tl (Baht/t) (Baht/t)
1480 1792 1958
1480 1792 1958 2471 2471
140 4 140 4 655 1 45 4 51 1 43 7 795 3 251 8 74 9 119 1 131 4 577 2
76 4 48 o 59 2 183 6
1123 7 1648 3 2021 4 2133 o 1696 S
22 7 23 6 27 9 18 4 92 6
333 6 120 1 -91 3 319 5 681 9
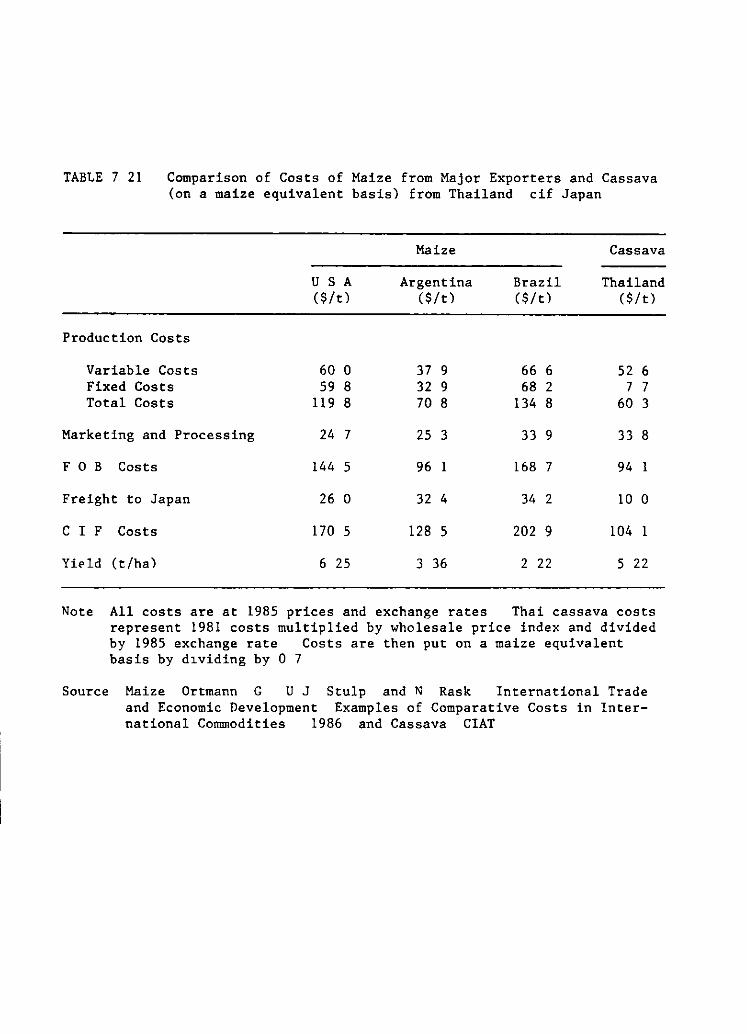
TABLE 7 21 Comparison of Costs of Maize from Major Exporters and Cassava (on a maize equivalent basis) from Thailand cif Japan
Maize Cassava
U S A Argentina Brazil Thailand ($/t) ($/t) ($/t) ($/t)
Production Costs
Variable Costs 60 o 37 9 66 6 52 6 Fixed Costs 59 8 32 9 68 2 7 7 Total Costs 119 8 70 8 134 8 60 3
Marketing and Processing 24 7 25 3 33 9 33 8
F O B Costs 144 5 96 1 168 7 94 1
Freight to Japan 26 o 32 4 34 2 10 o
C I F Costs 170 5 128 5 202 9 104 1
Yi@ld (t/ha) 6 25 3 36 2 22 5 22
Note All costs are at 1985 prices and exchange rates Thai cassava costs represent 1981 costs multiplied by wholesale price index and divided by 1985 exchange rate Costs are then put on a maize equivalent basis by d~viding by O 7
Source Maize Ortmann G U J Stulp and N Rask International Trade and Economic Development Examples of Comparative Costs in International Commodities 1986 and Cassava CIAT
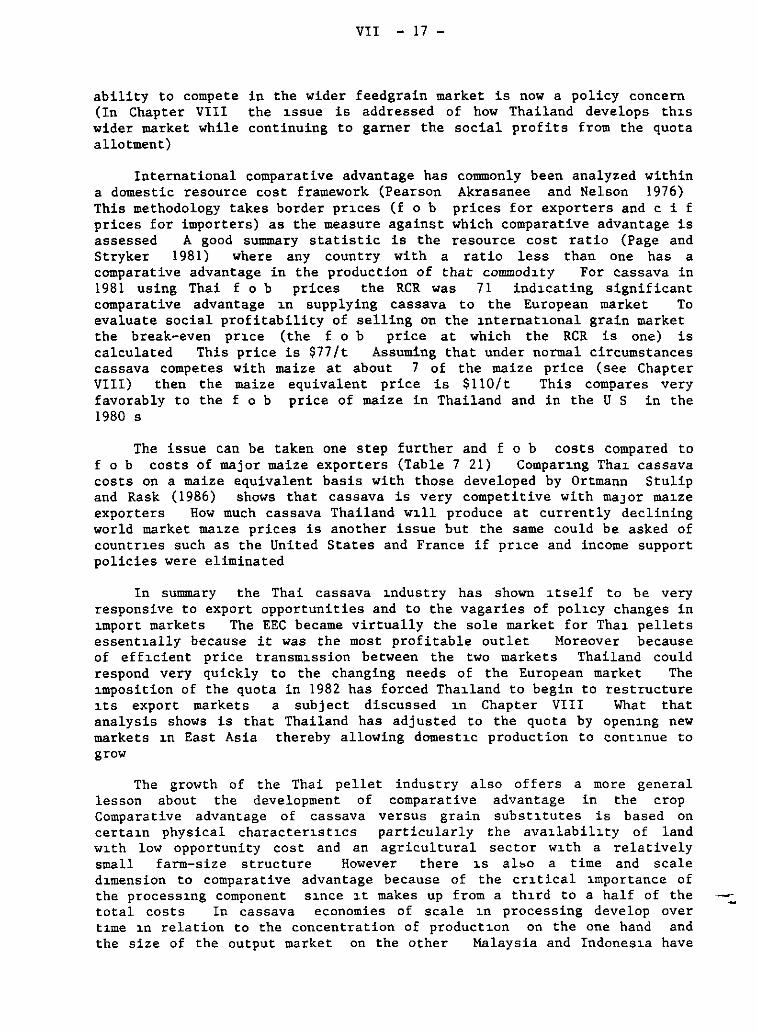
ability to compete (In Chapter VIII wider market while allotment)
VII - 17 -
in the wider feedgrain market is now a policy concern the ~ssue is addressed of how Thailand develops th~s
continuing to garner the social profits from the quota
International comparative advantage has commonly been analyzed within a domestic resource cost framework (Pearson Akrasanee and Nelson 1976) This methodology takes border pr~ces (f o b prices for exporters and e i f prices for importers) as the measure against which comparative advantage is assessed A good summary statistic is the resource cost ratio (Page and Stryker 1981) where any country with a ratio less than one has a comparative advantage in the production of that commod~ty For cassava in 1981 using Thai f o b prices the RCR was 71 ind~cating significant comparative advantage ~n supplying cassava to the European market To evaluate social profitability of selling on the ~nternat~onal grain market the break-even pr~ce (the f o b price at which the RCR is one) is calculated This price is $77/t Assuming that under normal circumstances cassava competes with maize at about 7 of the maize price (see Chapter VIII) then the maize equivalent price is $110/ t This compares very favorably to the f o b price of maize in Thailand and in the U S in the 1980 S
The issue can be taken one step further and f o b costs compared to f o b costs of major maize exporters (Table 7 21) Compar~ng Tha~ cassava costs on a maize equivalent basis with those developed by Ortmann Stulip and Rask (1986) shows that cassava is very competitive with maJor ma~ze exporters How much cassava Thailand w~ll produce at currently declining world market ma~ze prices is another issue but the same could be asked of countr~es such as the United States and France if pr~ce and income support policies were eliminated
In summary the Thai cassava ~ndustry has shown 1tself to be very responsive to export opportunities and to the vagaries of pol~cy changes in ~mport markets The EEC became virtually the sole market for Tha~ pellets essent~ally because it was the most profitable outlet Moreover because of eff~cient price transm~ssion between the two markets Thailand could respond very quickly to the changing needs of the European market The ~mposition of the quota in 1982 has forced Tha~land to begin to restructure ~ts export markets a subject discussed ~n Chapter VIII What that analysis shows is that Thailand has adjusted to the quota by open~ng new markets ~n East Asia thereby allowing domest~c production to cont~nue to grow
The growth of the Thai pellet industry also offers a more general lesson about the development of comparative advantage in the crop Comparative advantage of cassava versus grain subst~tutes is based on certa~n physical character~st~cs particularly the ava~labil1ty of land w1th low opportunity cost and an agricultura! sector w1th a relatively small farm-size structure However there ~s albo a time and scale d~mension to comparative advantage because of the cr1tical ~mportance of the process~ng component s~nce ~t makes up from a th~rd to a half of the total costs In cassava economies of scale ~n processing develop over t~me ~n relation to the concentration of product~on on the one hand and the size of the output market on the other Malaysia and Indones~a have
VII - 18 -
attempted to force the issue through plantation development but in cassava these have not been notably successful The soc~al equity benef~ts from cassava development (marginal agricultura! areas small-scale producers and rural employment in small-scale agro-industry) prov~de strong support in certain circumstances for an ~nfant ~ndustry argument to support cassava in the initial development of its processing capacity In Thailand this ~nit~al protection was provided by the EEC market The Thai case suggests that cassava can compete with grains but in the evaluation of the comparat~ve advantage of cassava in the feedgrain market a time perspective should be incorporated for processing costs
The Cassava Starch Market
The cassava industry ~n Thailand developed ~n~t~ally on the basis of the market for starch Starch production and exports have continued to grow throughout the post-war period but the industry has decl~ned in relat~ve importance having been eclipsed by the cassava pellet market Nevertheless the cassava starch ~ndustry ~n Thailand v~es with Indonesia as being the largest in the world It continues to be dynam~c suppling starch to both an expanding export market and an increas~ng domestic market
Constructing a supply and ut~lization series for cassava starch must rely on data from different sources and this produces sorne inconsistencies The series ~n Table 7 22 is developed from independent export product~on
and utilization estimates and represents the author s efforts at ach~eving consistency between the estimates What the data suggests is quite significant growth ~n starch product1on dr1ven through the 1970 s by rising domestic consumpt~on and in the 1980 s by a sudden spurt in the export market
Cassava starch has a w1de number of end markets 1n Tha1land The principal use 1s as a raw mater1al in the product1on of monosodium glutamate In th1s industry starch competes directly with molasses which is interchangeable w1th cassava starch Starch is also important in the expanding pulp and paper industry 1n text1le product1on and in food 1ndustries All of these are grow1ng industr1es and cassava starch w1ll continue to enJ oy an increas1ng domes tic market throughout this century However unlike other starch markets in East Asia one market which cassava starch has not entered is the glucose and sweetner ma-rket This is principally because Thailand 1s a producer and net expo-rter of sugar High fructose sweetners derived from cassava have been advocated as another poss1ble market s1nce 52/ of 1ndustr1al sugar consumption ~s for beverage production (Frankel 1981) Horeover the Tha1 government has a pol1cy of subs1d1z1ng sugar exports when world prices are low and taxing exporta when pr1ces are high (Lokaphadhana 1981) Nevertheless the pr~ce var1ab1l1ty in cassava starch pr1ces has made the 1nvestments needed in large-scale plant and capac1ty too r1sky and there has been no development 1n th~s
market
Tha~land is v1rtually the sole exporter of cassava starch and the largest exporter ~n the world of starch 1n general The export market was relat1vely atable through the 1960 s and 1970 s but increased dramat1cally 1n the 1980 s as new non-traditional 1mporters carne 1nto the market (see
VII - 19 -
Chapter VIII) Tha1land between 1980 and 1985 was able to expand exports by 50% in two years and v1rtually to double export volumes in four years w1thout too much affect on domest1c consumption levels Th1s suggests the investment in s1gnificant excess production capacity for starch on the one hand and the ability of the starch industry to compete effectively with the pellet industry for roots in 1984 and 1985 root prices were relatively low due to the quota
The starch industry needs to be very competitive in the sense that its margins are defined by root prices principally set by the pellet export market in the EEC and starch export prices set princ1pally by international maize prices i e the dominant cost in ma1ze starch product1on (see Chapter VIII) The starch industry very early began a search for scale economies in processing essentially based on large-scale plants but with equipment manufactured in Thailand -- in Indonesia on the other hand these scale econom1es in starch production do not ex1st (Nelson 1984) Based on the development of th1s market Tha1land is a now net exporter of cassava starch equipment including complete plants However w1th this competition to invest in arder to lower processing costs excess processing capacity was created allowing the industry to respond so quickly to new export markets
Pr1ce Formation and Profitability Like other cassava processing industries profitability 1n starch production is primarily dependent on the conversion rate and the margin between the root buying price and the starch selling price Unlike the pellet industry where the pr1ce of the processed product leads the price of roots the starch industry must take the root price as a g1ven The starch industry rarely has been able to underbid the chipp1ng plants The root pr1ce thus sets the price of starch Compet1tion for limited markets 1n turn insures both downward pressure on margins and the search for reductions in processing costs
The above scenario for price formation is adequately captured in the price transmission equat1ons 1n Table 7 23 and the processing cost analysis 1n Table 7 24 Note that contrary to the ch1p industry starch pr1ce 1s the dependent variable 1n the regression equation The estimated convers1on rates are only slightly h1gher than the estimate of 4 34 tons of roots for every ton of starch given by industrial sources Even the estimated rates suggest very high technical efficiency in starch extraction The estimated operating margin compares favorably with the budget1ng analysis in Table 7 24 Again the evidence suggests a very competitive industry where there is no indication of excess prof1ts Moreover a domest1c resource calculation would be redundant in the case of Tha1 starch s1nce Tha1land sets the world pr1ce for cassava starch and apart from 1mport dut1es on starch processing equ1pment there 1s no government intervention 1n the starch market
Continued growth in the starch 1ndustry 1s dependent pr1nc1pally on the supply pr1ce of starch wh1ch in turn 1s dependent on the root pr1ce and the chang1ng dynamics of the pellet market The tendency in the medium term is for cassava starch prices to come in line with ma1ze starch making cassava starch more competit1ve The other majar factor of course is growth 1n export markets Prospects in the 1nternational starch market are
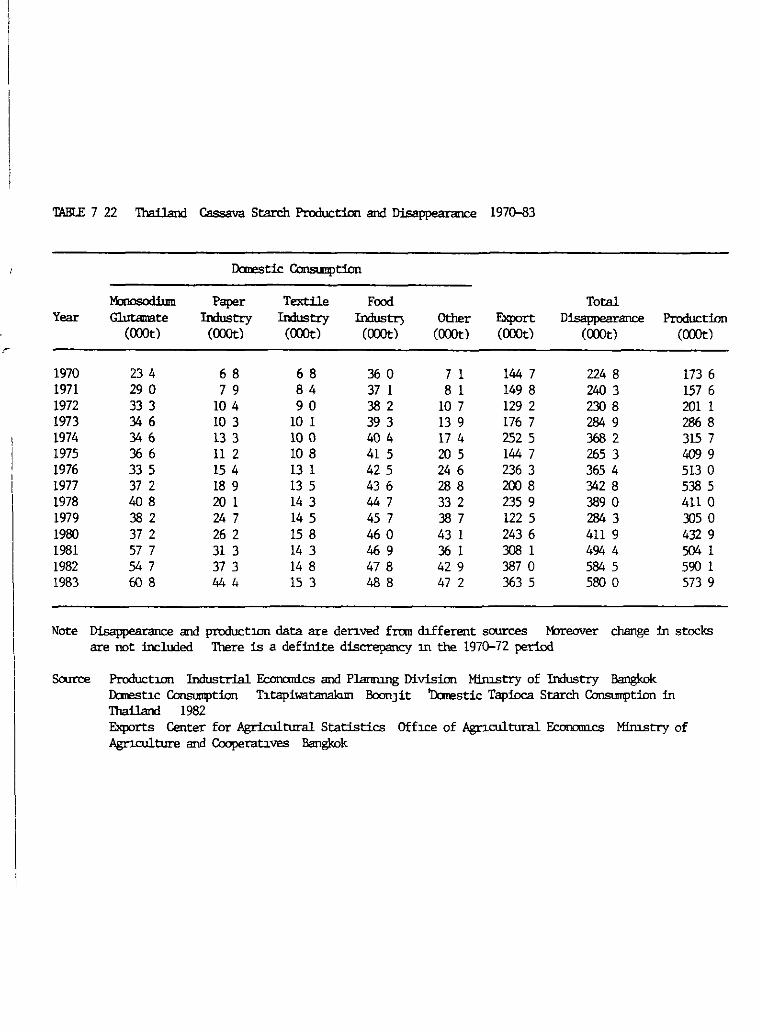
TABl.E 7 22 Tha.iland Cassava Starch Production and Disappeanmce 1970-83
J:la!estic Consumpt:ian
fulosodium Paper Textile Food Total Year Gl.utamate Inlustry Industry Inlustr) Other Export Disappearsnce Production
(CXXJt:) (CXXJt:) (CXXJt:) (CXXJt:) (CXXJt:) (CXXJt:) (CXXJt:) (CXXJt:) r
1970 23 4 6 8 6 8 360 7 1 144 7 224 8 173 6 1971 29 o 7 9 8 4 37 1 8 1 149 8 240 3 157 6 1972 33 3 104 9 o 382 107 129 2 230 8 201 1 1973 346 103 101 39 3 139 176 7 284 9 2868 1974 346 133 lO O 40 4 17 4 252S 368 2 31S 7 197S 366 11 2 108 41 S 20 S 144 7 26S 3 409 9 1976 33 S 1S 4 13 1 42 S 24 6 236 3 36S 4 513 o 1977 37 2 18 9 135 43 6 28 8 200 8 342 8 538 S 1978 408 20 l 14 3 447 33 2 235 9 389 o 411 o 1979 382 24 7 14 S 4S 7 387 122 5 284 3 305 o 1980 37 2 26 2 15 8 46 o 43 1 243 6 411 9 432 9 1981 57 7 31 3 14 3 469 361 308 1 494 4 504 1 1982 547 37 3 14 8 47 8 42 9 3870 584 5 590 1 1983 608 444 IS 3 488 47 2 363 5 580 o 573 9
Note Disappeanmce and productlDil data are denved f:mn dúferent sources M:rreover change ln stocks are not included There is a definite discre,>ancy m the 1970-72 period
Source ProductlDil Industrial Econanics and Planrung Divis:ian M:irostry of Industry Bangkok J:la!est1C Consumption T1tapiwatanakun BoonJ it '!bnestic Tapioca Starch Consumpt:ian in Thailand 1982 Exports Center for Agricultura! Statistics Ofhce of Agncultural Econam.cs M:imstry of Agnculture and Cooperat1ves Bangkok
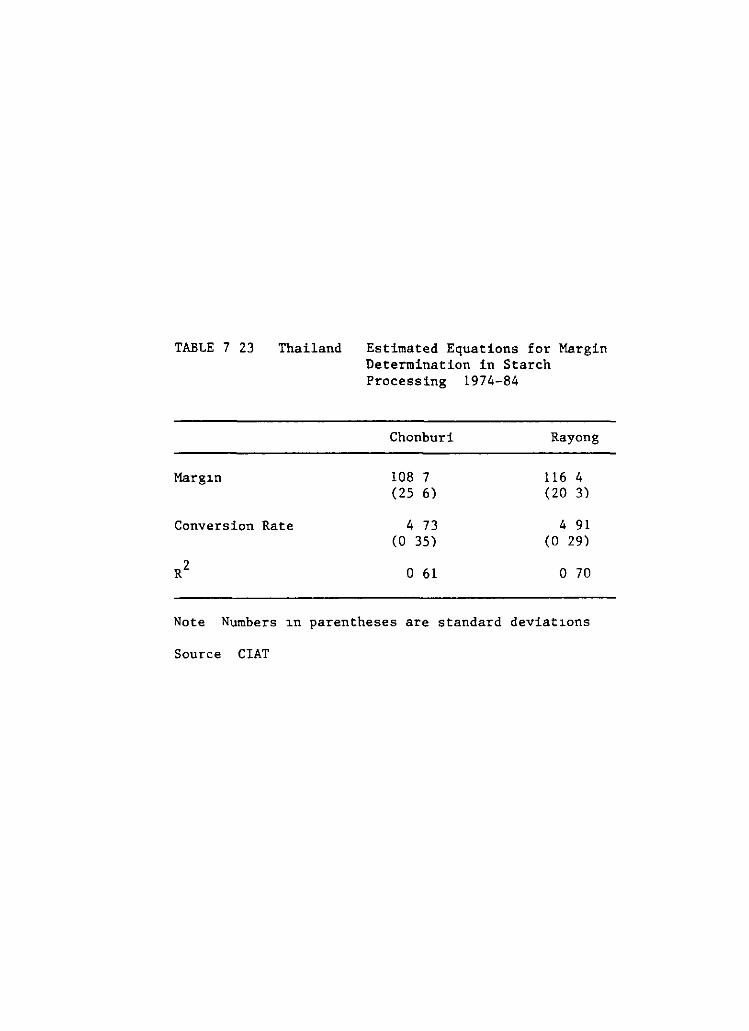
TABLE 7 23 Thailand
Marg1n
Conversion Rate
R2
Estimated Equations for Margin Determination in Starch Processing 1974-84
Chonburi Rayong
108 7 116 4 (25 6) (20 3)
4 73 4 91 (O 35) (O 29)
o 61 o 70
Note Numbers 1n parentheses are standard deviat1ons
Source CIAT
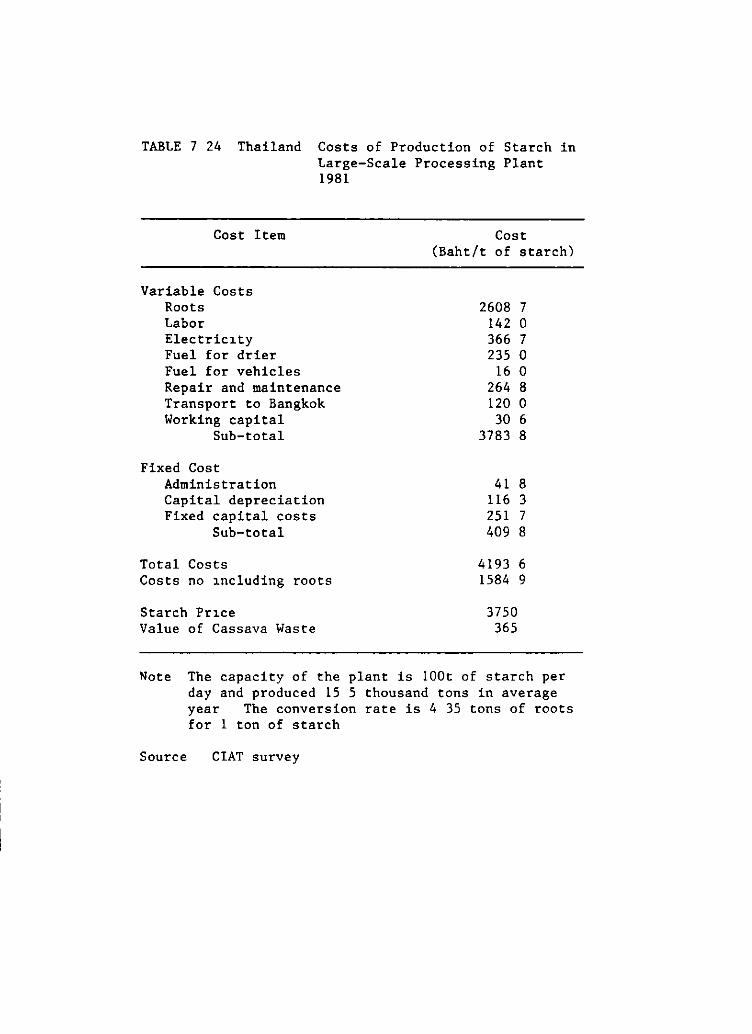
TABLE 7 24 Thailand Costs of Production of Starch in Large-Scale Processing Plant 1981
Cost Item
Variable Costs Roots Labor Electric1ty Fuel for drier Fuel for vehicles Repair and maintenance Transport to Bangkok Working capital
Sub-total
Fixed Cost Administration Capital depreciation Fixed capital costs
Sub-total
Total Costs Costs no 1ncluding roots
Starch Pr1ce Value of Cassava Waste
Cost (Baht/t of starch)
2608 7 142 o 366 7 235 o
16 o 264 8 120 o 30 6
3783 8
41 8 116 3 251 7 409 8
4193 6 1584 9
3750 365
Note The capacity of the plant is 100t of starch per day and produced 15 5 thousand tons in average year The conversion rate is 4 35 tons of roots for 1 ton of starch
Source CIAT survey
VII - 20 -
analyzed in Chapter VIII and suggest that markets open only where the country loses the ab~lity to meet its own domestic needs
The Animal Feed Market
There is no better illustration of the lack of integrat~on between world market maize and cassava prices than the comparative role that these two export crops have played in the development of Thailand s domestic feed concentrate ~ndustry Maize has formed the carbohydrate base for th~s
rapidly growing industry bas~cally because it has been more prof~table to export the cassava On those relatively rare occassions when the prices of the two commod~ties have come into line cassava has been used domestically in the manufacture of animal feeds This has happened more often s1nce the impos1t1on of the quota and given the current size of the domest1c market the animal feed market could start to play a larger role in putting an absolute floor under cassava pr~ces
Starting in the late 1960's basic structural changes 1n the product1on of both swine and poultry have formed the basis for the rapid e~pans~on in the feed concentrate industry Prior to this t1me both swine and poultry were raised in small-scale integrated crop-livestock systems Swine continues to be raised principally in the central plain This region is relatively clase to the Bangkok market and forms the main rice grow1ng area where rice bran and other by-products prov1de a plentiful feed source Commercial operations of over 50 hogs have increased the1r product1on share from approx~mately 12k in 1974 to 14-' in 1978 to around 15-' in 1983 (Chesley 1985) Development of commerc1al sw1ne operat1ons however has been constra~ned by the Animal Slaughtering and Meat Control Act of 1959 wh1ch allows only local author1t1es to establ1sh slaughterhouses and proh~b1ts sh1pment of carcasses outside tht> legally defined market area of each slaughterhouse Th1s has resulted in local monopson1es in slaughter facil_ties resulting in h1gh costa and inefficient wholesaling of carcasses (see Chesley 1985 for further discussion) A high percentage of the slaughter ~s done illegally but th1s 1s d1fficult for large commercial growers Nevertheless swine numbers have cont1nued to 1ncrease especially since the m1d-1970 s (Table 7 25)
Structural change 1n the poultry industry has been even more rapid (Table 7 25) often motivated through vert1cal 1ntegration of feed companies backwards to commercial poultry production units The broiler industry has been by far the most dynamic an1mal sector in Tha1land 1ncreasing nine-fold 1n the 1974-82 per1od Partly this arises from the restr1ctions on the pork sector and partly from the very rapid techn1cal change 1n the poultry sector The later 1s reflected ~n the decl1n1ng relat1ve price of chicken compared to other meats (F~gure 7 5) and a virtual doubl1ng of per capita consumpt1on of chicken over the course of the 1970 s The only l1m1ts on growth 1n this industry a techn1cally effic1ent 1ndustry w1th access to cheap feed sources is the s1ze of the domest1c market With total per cap1ta meat consumption st1ll at relat1vely low levels and population and income st1ll proJected to grow there 1s no h1nt yet of a downturn in growth Moreover Tha1land 1s deve1oping as a maJar exporter of poultry in the East As1an and Middle Eastern market
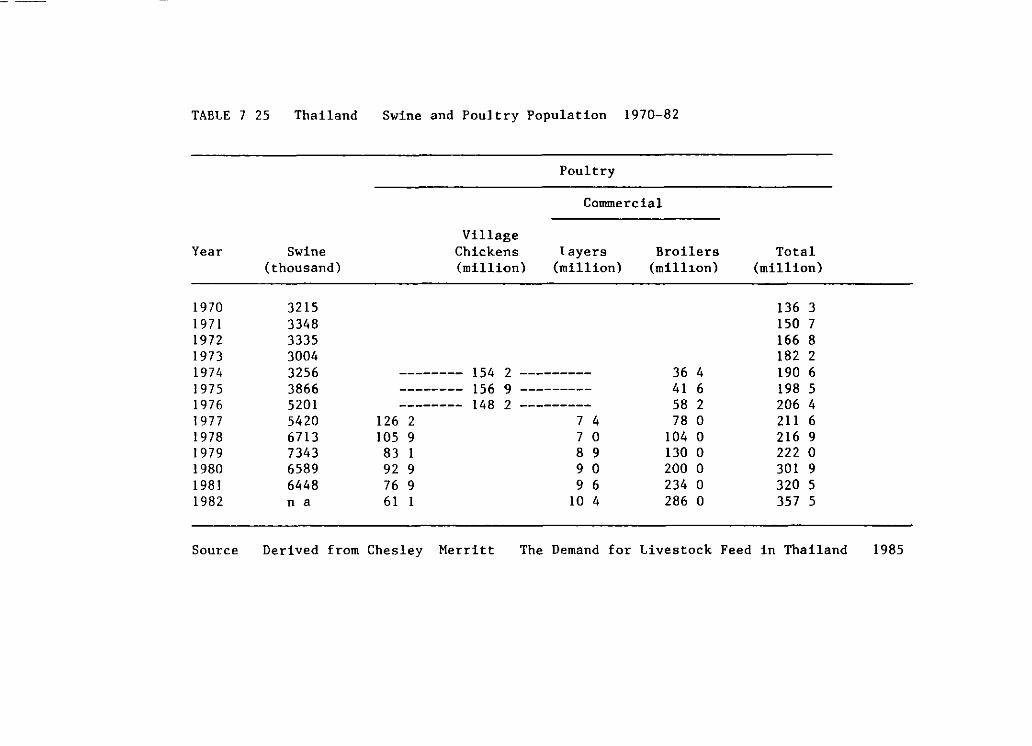
TABLE 7 25 Thailand
Year
1970 1971 1972 1973 1974 1975 1976 1977 1978 1979 1980 1981 1982
Swine (thousand)
3215 3348 3335 3004 3256 3866 5201 5420 6713 7343 6589 6448 n a
Swine and Poultry Population 1970-82
Poultry
Cornmercial
Village Chickens (million)
l ayers (million)
-------- 154 2 ----------------- 156 9 ----------------- 148 2 ---------
126 2 7 4 105 9 7 o 83 1 8 9 92 9 9 o 76 9 9 6 61 1 10 4
Broilers (milhon)
36 4 41 6 58 2 78 o
104 o 130 o 200 o 234 o 286 o
Total (million)
136 3 150 7 166 8 182 2 190 6 198 5 206 4 211 6 216 9 222 o 301 9 320 5 357 5
Source Derived from Chesley Merritt The Demand for Livestock Feed in Thailand 1985
VII - 21 -
The dynamism 1.n the meat sector has been integrally linked to a dynam1.c industrial feed sector Production of balanced feeds have 1.ncreased from a mere 64 thousand tons in 1968 to 2 1 m1.llion tons 1.n 1984 Although initially based on swine feeds the real growth 1.n production has come in broiler feeds This expansion in the feed sector has induced rap1.d 1.ncreases in the derived demand for carbohydrate sources This demand has been met almost exclusively by domestically produced ma1.ze The maize sector has also been very dynamic in the last two decades (Table 7 26) 1.ncreas1.ng from a production leve! of just over half a mill1.on tons in 1960 to well over 4 million tons in 1984 Production growth in the 1960 s went almost exclusively into exports However since about 1970 a growing share has gone to meet the needs of the domestic feed sector and since that point exports have been relatively stable at around 2 mill1.on tons
Cassava s potential as a carbohydrate source 1.n the animal feed market 1.s defined in Table 7 27 and Figure 7 6 Cassava comes into the least cost feed ration when its price is about 67 of the price of ma1.ze This rat1.o l.S somewhat low because the prices of soybean meal which is pr1.nc1.pally 1.mported are maintained relat1.vely high through import taxes These taxes have risen from S to 6 percent 1.n the late 1970 s to 8 S percent in 1983 (Chesley 198S) Thus cassava carne 1.nto the ration 1.n 1981 and again in 1984 Over the period 1971-8S cassava was never competitively pr1.ced with ma1.ze for any extended pen.od of time (F1.gure 7 6) Thus cassava has never been a feature of the domestic feed market Nevertheless 1.n 198S feed manufacturera for the first time began to use sign1.f1.cant volumes of cassava l.n the1.r feed mixtures An estimated 62S thousand tons was used in feeds in 198S However these competitive price relationsh1.ps d1.d not last through the end of 198S and cassava again moved out of the ration
Th1.s situation 1.s in fact quite favorable for cassava producers The animal feed 1.ndustry has a sol1.d raw material supply in ma1.ze but when substitutes are cheaper manufactures can profitably mix them 1.n their rat1.ons Pr1.ce is the determining factor for these feed components not continuity of supply Since cassava is read1.ly ava1lable feed manufacturera can eas1.ly move into cassava when price relat1ves are favorable As domest1.c feed manufacturera gain exper1ence 1.n us1ng cassava initially 1n sw1.ne feeds the domestic feed market could put an absolute price floor under the cassava market At these t1.mes cassava w1ll essentially be competitive with world market feedgrain prices but the logical market on which to sell is the domestic rather then the export market When cassava prices are above ma1ze pr1ces the cassava producer is much the better off The domestic animal feed market is now large enough that it can play such a role in support1.ng cassava pr1.ces
Conclusions
Cassava led the rapid post-war expansion in upland agn.culture in Thailand While maize and sugarcane expanded principally 1.n the Central Pla1.n prov1.nces cassava area 1.ncreased first in the East and then expandea rap1.dly in the poorest area of Thailand the Northeast Tha1.land was able to base exploitat1.on of an agr1.cultural front1.er a1.ded by labor-subst1.tut1.ng technolog1.es 1.n the 1970 s on development of export markets Thl.s was as true for ma1.ze as it was for cassava The expansion in cassava started 1.n the 19SO s and cont1.nued through the early 1960 s
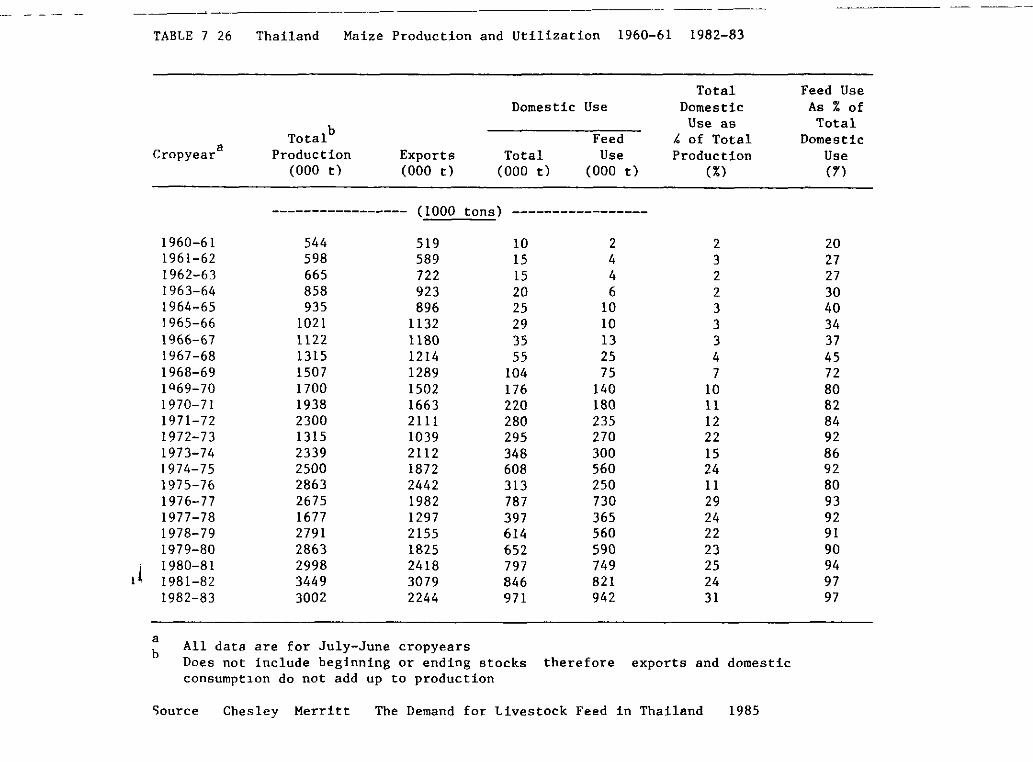
TABLE 7 26 Thailand Maize Production and Utilization 1960-61 1982-83
Total Feed Use Domestic Use Domes tic As % of
b Use as Total Total Feed !. of Total Domes tic
Cropyear a Production Exports Total Use Production Use (000 t) (000 t) (000 t) (000 t) (%) 0')
----------------- (1000 tons) -----------------
1960-61 544 519 10 2 2 20 1961-62 598 589 15 4 3 27 1962-63 665 722 15 4 2 27 1963-64 858 923 20 6 2 30 1964-65 935 896 25 lO 3 40 1965-66 1021 1132 29 10 3 34 1966-67 1122 1180 35 l3 3 37 1967-68 1315 1214 55 25 4 45 1968-69 1507 1289 104 75 7 72 1069-70 1700 1502 176 140 10 80 1970-71 1938 1663 220 180 11 82 1971-72 2300 2111 280 235 12 84 1972-73 1315 1039 295 270 22 92 1973-74 2339 2112 348 300 15 86 1974-75 2500 1872 608 560 24 92 1975-76 2863 2442 313 250 11 80 1976-77 2675 1982 787 730 29 93 1977-78 1677 1297 397 365 24 92 1978-79 2791 2155 614 560 22 91 1979-80 2863 1825 652 590 23 90
1 ¡ 1980-81 2998 2418 797 749 25 94 1981-82 3449 3079 846 821 24 97 1982-83 3002 2244 971 942 31 97
a All data are for July-June cropyears b Does not include beginning or ending stocks therefore exports and domestic consumpt1on do not add up to production
':;ource Ches ley Merritt The Demand for Livestock Feed in Thailand 1985
..... J; """' "'""a"'~"""''"' ¡:,¡. ., + .... ~ ~
-;:::_~ ""' ' .... a, ~ • r .......... ~ ......... ..... J- ...... - .... .. ¡;¡ ... - - .:...-¡;¡- ..... -;;;; -
"'"" ;::: r ~ e e s """ ::o Pi a ~ z e 5!1 º 3 ""1. ;íT""" ., 1 ""
1 ¡
.J
C' :J J > l
:1 ~ J , ' ... i
1 ¡ ' ü
¡
"'1
o . ... ' ' r
ü =::- -t
• _, .. '
_, ~-~~4V~f~•K-*~~,~g~üL~~=~~-~~~¿~~~ •=~~J~~
.......... .-- -...,
.... -.-~:. .... ,.. :
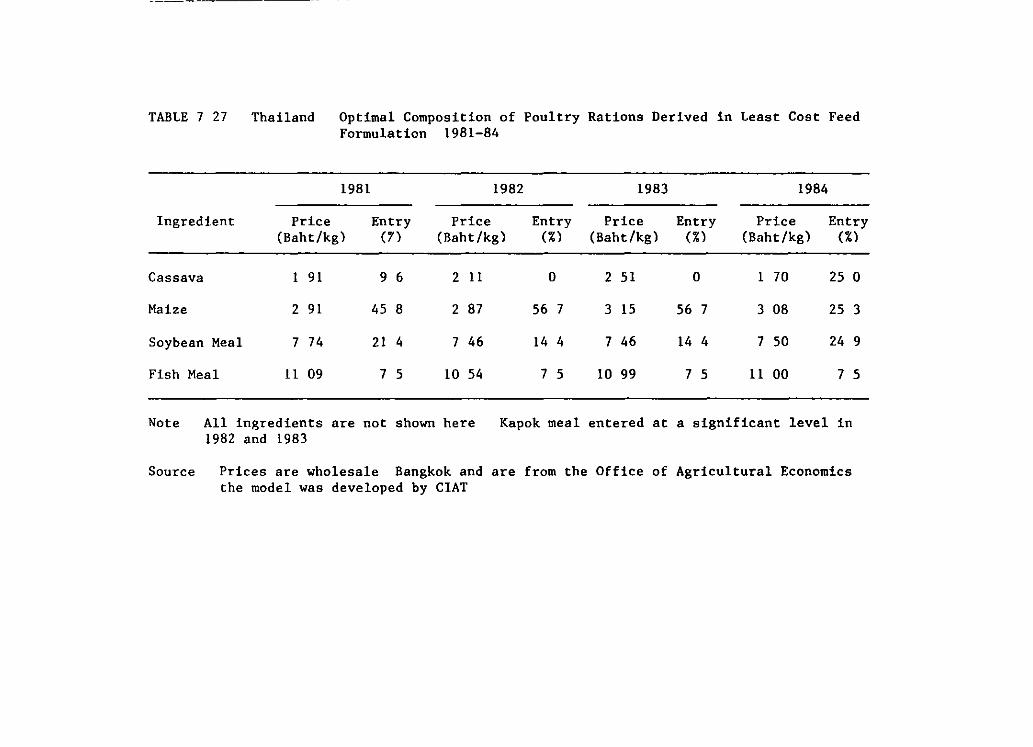
TABLE 7 27 Thailand Optimal Composition of Poultry Rations Derived in Least Cost Feed Formulation 1981-84
Ingredient
Cassava
Maize
Soybean Meal
Fish Meal
1981
Price (Baht/kg)
1 91
2 91
7 74
11 09
Entry (7)
9 6
45 8
21 4
7 5
1982
Price (Baht/kg)
2 11
2 87
7 46
10 54
Entry (%)
o
56 7
14 4
7 5
1983
Price (Baht/kg)
2 51
3 15
7 46
10 99
Entry (%)
o
56 7
14 4
7 5
1984
Price (Baht/kg)
1 70
3 08
7 50
11 00
Entry (%)
25 o
25 3
24 9
7 5
Note All ingredients are not shown here Kapok meal entered at a significant leve! in 1982 and 1983
Source Prices are wholesale Bangkok and are from the Office of Agricultura! Economics the model was developed by CIAT
VII - 22 -
being based principally en the starch export market lt is a mark of Thailand s abill.ty te take optimum advantage of changes in international market conditions that with the GATT binding of the cassava tariff in 1968 creatJ.ng a hole in the EEC 1 s variable levy system Thal. cassava exporta could respond so rapidly Thus the Thai cassava boom should not be seen as uniquely determined by a favorable tariff rate in the EEC but equally important was the dynamism of upland agrJ.culture and the additional land and labor resources that could be brought into production J.n response te profitable export markets
Thai success in cassava however has been at the expense of the EEC s political objectives The resulting voluntary export quota has created an au of uncertainty as Thailand has had te rapidly develop its own policy response and control procedures It is ironical indeed that ThaJ.land s only polJ.cy intervention in the cassava sector is a negative ene even though forced by the EEC The uncertainty however should not be J.nterpreted as portending emJ.nent decline in the cassava industry Rather a period of structural adjustment has been forced en the industry whJ.ch in the end will lay the basJ.s for more dJ.versity in end markets and even more effJ.cient production The short-run po1icy prob1em for ThaJ.land has been te develop a policy that al1ows the country te capture the social profits earned in the EEC and te the extent possible te transfer these benefJ.ts to cassava producers especJ.ally in the Northeast The solution requires an analysis of a1ternatJ.ve export markets and this is left till Chapter VIII Suffice it te say that Thailand has managed te make the ad]ustment and expand its export markets principally in East AsJ.a Moreover root production has even J.ncreased during the quota period Future growth Wl-11 be based on continued penetration of these new export markets
Nevertheless there has been downward pressure en farm-level prl.ces under the quota and the more the need te export te thJ.rd-country markets the more the downward pressure en root prices Over the past twenty years Thai1and has signJ.ficantly reduced cassava processing costs Farmers have also ad]usted to risJ.ng labor costs by adoptl.ng labor-savJ.ng technologJ.es What has not happened and what is becomJ.ng critica! as root prl.ces come down is the adoption of yield-J.ncreasing technology YJ.elds have remaJ.ned relatively constant over the past twenty years even though area has expanded into more marginal areas and fertilizer has not been used in tradicional growing areas Under current monocropping condJ.tions yields will eventually decline catching farmers in a cost-price squeeze A fertilJ.zation and soil management strategy that quarantees a profitable return l.S needed te complement improved varietJ.es Thl.s wi11 J.nsure the abJ.1ity of Thai cassava te compete in the WJ.der feedgraJ.n market a11owing Tha1.land the requJ.red flexJ.bility in restructurJ.ng its export markets Most J.mportant of all cassava wi11 then have achieved parJ.ty with graJ.ns in international markets establJ.shJ.ng a new claJ.m for carbohydrate exports from the tropJ.cs a role palm oil has recently carved out in the world vegetable oil market
VII - 23 -
Appendu 7 1 A Synthes1s of Production and Utilization
Cassava production has grown rapidly in the last two and a half decades with most of the root production being processed for export Domestic consumption of cassava is limited to starch and the occasional use of chips in animal feed concentrates Thailand should be a country therefore where cassava utilization and production data are relatively consistent
A production series is produced both by the Division of Agricultura! Economics (DAE) and the Department of Agr1cultural Extension (AEX) both of which form part of the Ministry of Agriculture and Cooperatives Both the DAE and AEX maintained the same series through the 1968/69 crop year but diverged then when the DAE changed procedures In general the DAE series is most utilized in the literature and is the one reported by FAO Both series show the same basic upward trend but in any particular year can diverge by as much as 25%
Converting exports to a fresh weight basis and comparing this export series to the production series (Table 7A 1) shows that the production data tended to be consistently underestimated in the case of the AEX before 1973/74 and in the case of the DAE befare 1982/83 Titapiwatanakun (1979) reviews th1s discrepancy in some detail and attributes the difference to a failure to accurately monitor the rapid expansion in area especially where cassava was be1ng planted in more frontier-like conditions in the Northeast The DAE production ser1es thus prov1des a relat1vely consistent underestimate of actual production and the export series probably provides a more accurate minimum estimate of actual production
The Ministry of Commerce has developed supply and utilization estimates for cassava (Table 7A 2) These clearly h1ghlight the dominance of the export market but also identify a not unimportant domest1c market for both starch and animal feed The other dom1nant component is the very high stock levels be1ng held in this period The production estimate constructed from utilization data is about 11% larger than the DAE estimate of product1on Thus Thailand prov1des one of the few cases (Malaysia is the other) where cassava production tends to be underestimated
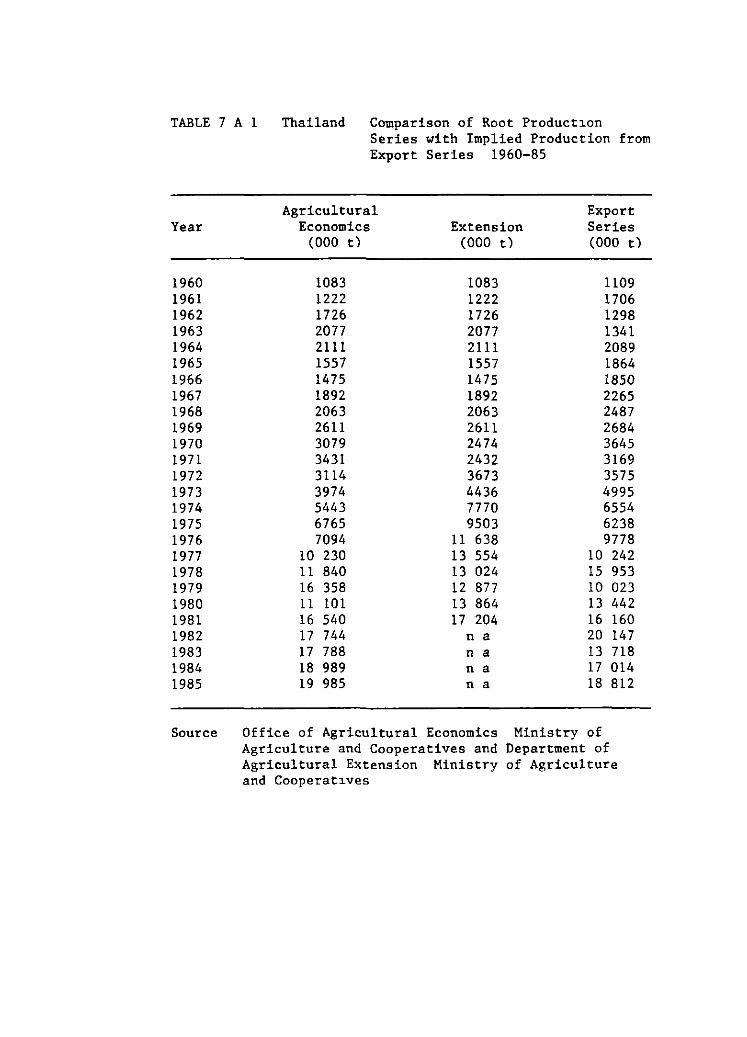
TABLE 7 A 1 Thailand Comparison of Root Product1on Series with Implied Production from Export Series 1960-85
Agricultura! Export Year Economics Extension Series
(000 t) (000 t) (000 t)
1960 1083 1083 1109 1961 1222 1222 1706 1962 1726 1726 1298 1963 2077 2077 1341 1964 2111 2111 2089 1965 1557 1557 1864 1966 1475 1475 1850 1967 1892 1892 2265 1968 2063 2063 2487 1969 2611 2611 2684 1970 3079 2474 3645 1971 3431 2432 3169 1972 3114 3673 3575 1973 3974 4436 4995 1974 5443 7770 6554 1975 6765 9503 6238 1976 7094 11 638 9778 1977 10 230 13 554 10 242 1978 11 840 13 024 15 953 1979 16 358 12 877 10 023 1980 11 101 13 864 13 442 1981 16 540 17 204 16 160 1982 17 744 n a 20 147 1983 17 788 n a 13 718 1984 18 989 n a 17 014 1985 19 985 n a 18 812
Source Office of Agricultura! Economics Ministry of Agriculture and Cooperatives and Department of Agricultura! Extension Ministry of Agriculture and Cooperat1ves
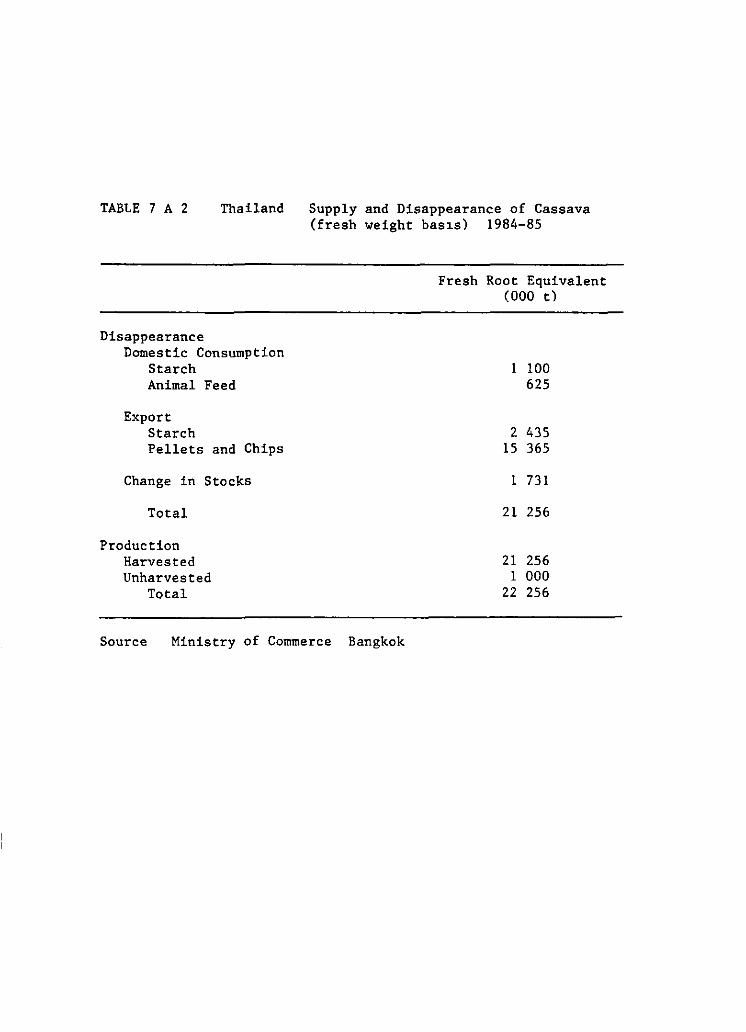
TABLE 7 A 2 Thailand
Disappearance Domestic Consumption
Starch Animal Feed
Export Starch Pellets and Chips
Change in Stocks
Total
Production Harvested Unharvested
Total
Supply and Disappearance of Cassava (fresh weight bas1s) 1984-85
Fresh Root Equivalent (000 t)
1 lOO 625
2 435 15 365
1 731
21 256
21 256 1 000
22 256
Source Ministry of Commerce Bangkok

VIII World and Asian Markets for Cassava Products
World trade in cassava products has increased rapidly over the last three decades rising from about 200 thousand tons (~n product weight) in the early 1950 s to a peak of 8 4 million tons in 1982 The latter representa a little lesa than 20% of total world production of cassava a very significant figure when compared to a commodity like rice where only 4% of production moves in world trade While the volume traded is sizeable by world commodity standards eg world rice trade amounts to a l~ttle over 8 million tons the number of countries involved is relatively small In fact over 90-' of trade is accounted for by exports of Thailand to the European Community For a commodity trade of such volume this is a particularly narrow base
Trade dominates the cassava economy only of Thailand and in the 1980-82 period China Trade achieves a more limited importance although rarely exceeding 10% of domestic production -- in Indonesia and Malaysia In all other cassava producing countries internacional trade has rarely been an option and is currently of only marginal importance This relatively unique trade structure raises a number of issues which w~ll be explored in this chapter Most importantly the reasons surrounding the relatively narrow part~cipation in world cassava trade will be examined This analysis will then lead to an evaluation of the potential for broadening the import markets for cassava followed by some prognosis for increasing the number of exporting countries The discussion will be rooted in an historical evaluation of the changing determinante of comparative advantage an approach which will allow sorne speculation on the future role of cassava in world trade in carbohydrate sources
Protectionism and Substitution Decline in the World Starch Trade
World trade in cassava started with starch exporta from the Malayan peninsula in the mid-1800 s Early trade relied on cassava s advantage as a starch source the higher value-added of starch compared to other processed cassava products and the proportionately lower freight costs for starch compared to dry cassava Starch was the maJor cassava product in value terms moved in world cassava trade throughout the present century up till the 1960 s The market for starch is relatively small in comparison to trade in wheat or feed grains Moreover while this market exhibited moderate growth from the turn of the century to the Second World War there has been little growth in the post-war period while the grain trade has grown at historically h~gh rates However underlying these trends in starch trade 1s a market structure undergoing s~gn~ficant change influenced by shifting comparative advantage dynam~c technical change rapidly shift~ng end markets and trade barriera It is in these terms that the world market for cassava starch will be analyzed
Demand for starch is marked by the product' s versatility Almost every major industry has found a use for starch and as a result the process of industrialization normally coincides with a significant increase in the demand for starch Th~s industrialization affect is partially reflected in the historical ser~es on =ports of cassava starch over the present century At the turn of the century the United K~ngdom was the largest ~mporter of cassava and other starches By the 1920 s the United
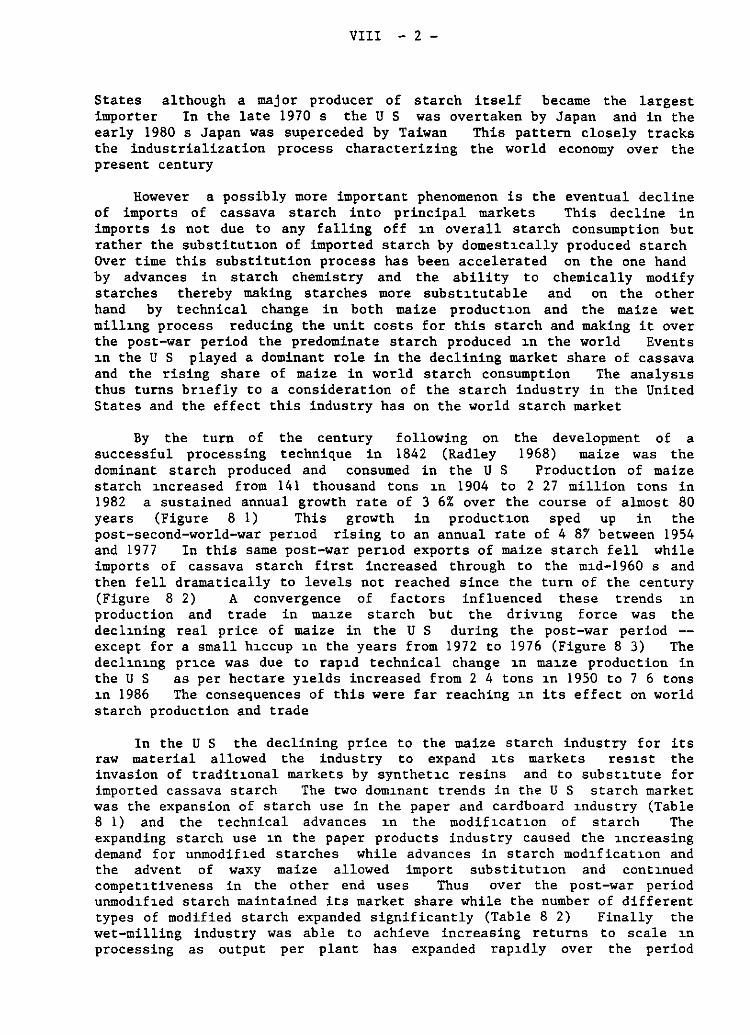
VIII - 2 -
States although a major producer of starch itself became the largest importer In the late 1970 s the U S was overtaken by Japan and in the early 1980 s Japan was superceded by Taiwan This pattern closely tracks the industrialization process characterizing the world economy over the present century
However a possibly more important phenomenon is the eventual decline of imports of cassava starch into principal markets This decline in imports is not due to any falling off 1n overall starch consumption but rather the substitut1on of imported starch by domestJ.cally produced starch Over time this substitution process has been accelerated on the ene hand by advances in starch chemistry and the ability to chemically modify starches thereby making starches more substl.tutable and on the other hand by technical change in both maize productl.on and the maize wet mill1ng process reducing the unit costs for this starch and making it over the post-war period the predominate starch produced 1n the world Events 1n the U S played a dominant role in the declining market share of cassava and the rising share of maize in world starch consumption The analys1s thus turns br1efly to a consideration of the starch industry in the United States and the effect this industry has on the world starch market
By the turn of the century following on the development of a successful processing technique in 1842 (Radley 1968) maize was the dominant starch produced and consumed in the U S Production of maize starch 1ncreased from 141 thousand tons 1n 1904 to 2 27 million tons in 1982 a sustained annual growth rate of 3 6% over the course of almost 80 years (Figure 8 1) This growth in productl.on sped up in the post-second-world-war perl.od rising to an annual rate of 4 8r between 1954 and 1977 In this same post-war per1od exports of maize starch fell while imports of cassava starch first increased through to the ml.d-1960 s and then fell dramatically to levels not reached since the turn of the century (Figure 8 2) A convergence of factors influenced these trends 1n production and trade in ma1ze starch but the driv1ng force was the dechning real price of maize in the U S during the post-war period -except for a small h1ccup 1n the years from 1972 to 1976 (Figure 8 3) The decl1n1ng pr1ce was due to rap1d technical change 1n ma1ze production in the U S as per hectare y1elds increased from 2 4 tons 1n 1950 to 7 6 tons 1n 1986 The consequences of this were far reaching 1n its effect on world starch production and trade
In the U S the declining price to the maize starch industry for its raw material allowed the industry to expand 1ts markets res1st the invasion of tradit1onal markets by synthetl.C resins and to subst1tute for imported cassava starch The two dom1nant trends in the U S starch market was the expansion of starch use in the paper and cardboard 1ndustry (Table 8 1) and the technical advances 1n the modifl.catl.on of starch The expanding starch use 1n the paper products industry caused the 1ncreasing demand for unmodif1ed starches while advances in starch modJ.ficat1on and the advent of waxy maize allowed import substitut1on and cont1nued compet1tiveness in the other end uses Thus over the post-war period unmod1f1ed starch maintained its market share while the number of different types of modified starch expanded significantly (Table 8 2) Finally the wet-milling industry was able to achieve increasing returns to scale 1n processing as output per plant has expanded rap1dly over the period
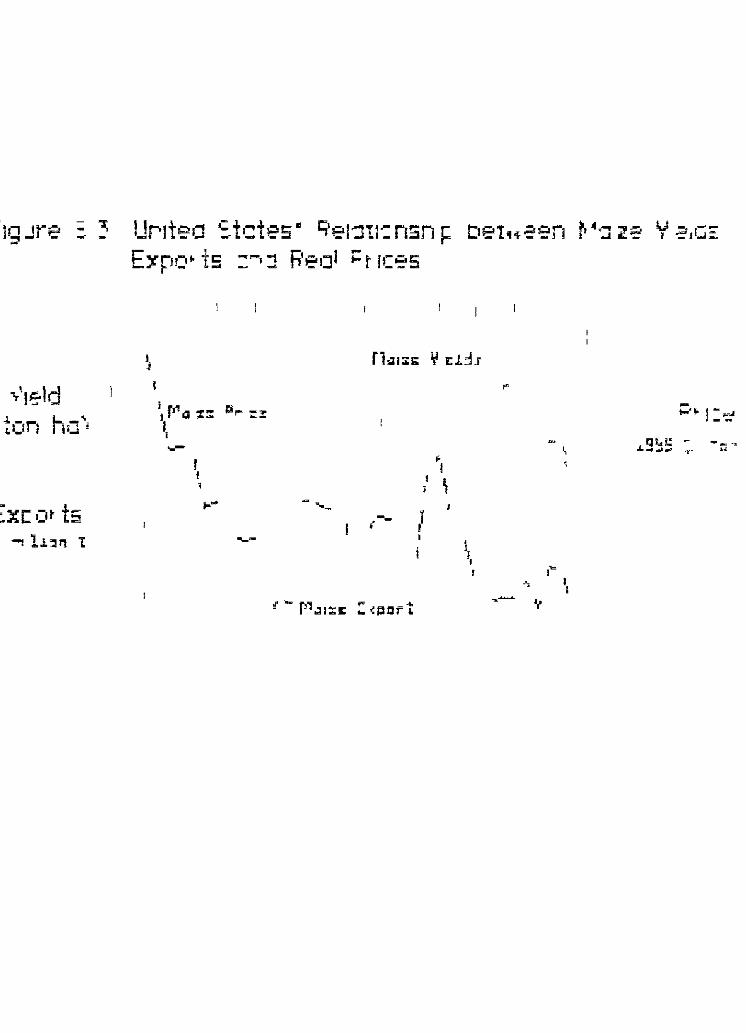
ln ~r~ ~ ".J; ::r- - -- -
:xc .:1t ts .., lJ.'Jil ¡:
!1.-.,t,:::,d C ~,..,f¡::.s • l:j'¡:.l...,-rl.- r¡"1o-, ¡:: -i - ~ -- L - ., - - 1 ~ Ll- -J J
E::t'po• ts :-·::! fi'e!Jl ¡: t 1ces
~ 1
... -1 1
'
l -..- 1
• l 1 '
1"
;::. • j : '::'
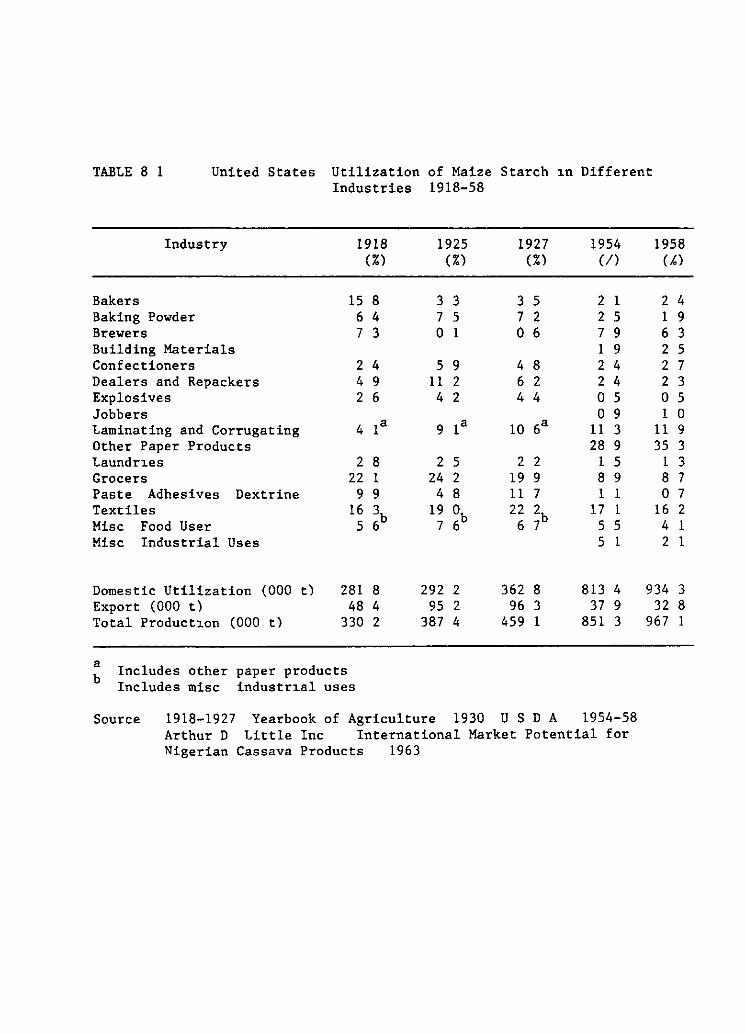
TABLE 8 1 United States Utilization of Maize Stareh 1n Different Industries 1918-58
Industry
Bakers Baking Powder Brewers Building Materials Confeetioners Dealers and Repaekers Explosives Jobbers Laminating and Corrugating Other Paper Produets Laundr1es Groeers Paste Adhesives Dextrine Textiles Mise Food User Mise Industrial Uses
Domestie Utilization (000 t) Export ( 000 t) Total Produet1on (000 t)
1918 (%)
15 8 6 4 7 3
2 4 4 9 2 6
4 la
2 8 22 1
9 9 16 3b
5 6
281 8 48 4
330 2
a b
Ineludes other paper produets Ineludes mise industr1al uses
1925 (%)
3 3 7 5 o 1
5 9 11 2 4 2
9 la
2 5 24 2
4 8 19 ob 7 6
292 2 95 2
387 4
1927 (%)
3 5 7 2 o 6
4 8 6 2 4 4
10 6a
2 2 19 9 11 7 22 2b 6 7
362 8 96 3
459 1
1954 (/)
2 1 2 5 7 9 1 9 2 4 2 4 o 5 o 9
11 3 28 9
1 5 8 9 1 1
17 1 5 5 S 1
813 4 37 9
851 3
Souree 1918-1927 Yearbook of Agrieulture 1930 U S D A 1954-58 Arthur D Little Ine International Market Potential for Nigerian Cassava Produets 1963
1958 (k)
2 4 1 9 6 3 2 5 2 7 2 3 o 5 1 o
11 9 35 3
1 3 8 7 o 7
16 2 4 1 2 1
934 3 32 8
967 1
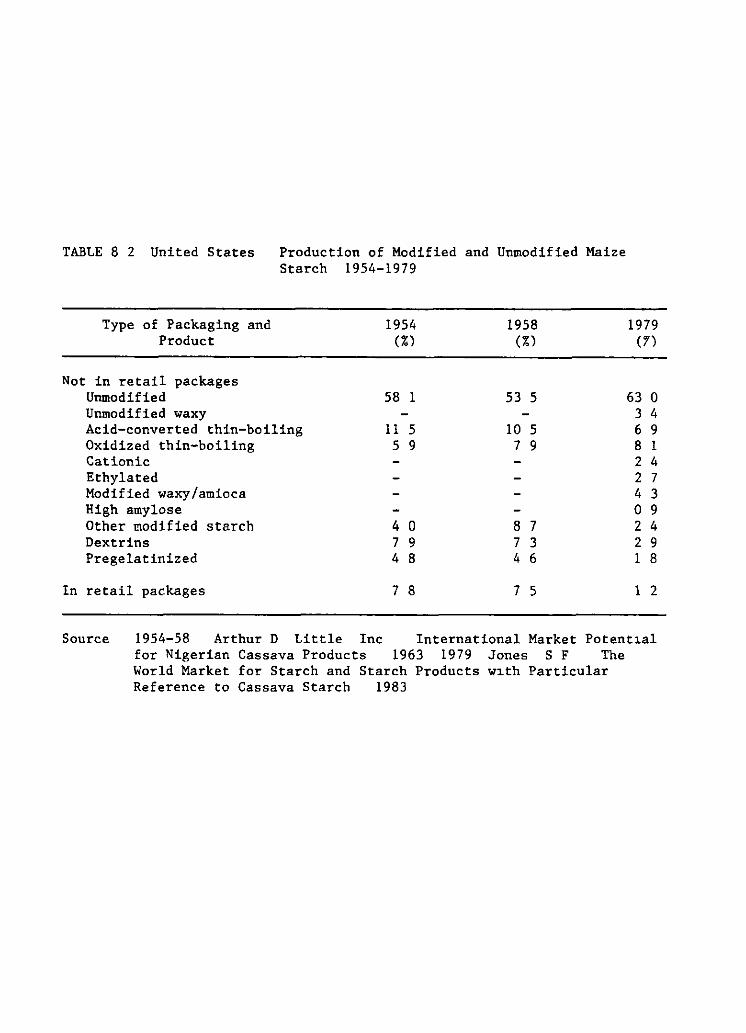
TABLE 8 2 United States Production of Modified and Unmodified Maize Starch 1954-1979
Type of Packaging and Product
Not in retail packages Unmodified Unmodified waxy Acid-converted thin-boiling Oxidized thin-boiling Cationic Ethylated Modified waxy/amioca High amylose Other modified starch Dextrins Pregelatinized
In retail packages
1954 (%)
58 1
11 5 5 9
4 o 7 9 4 8
7 8
1958 (%)
53 5
10 5 7 9
8 7 7 3 4 6
7 5
1979 0')
63 o 3 4 6 9 8 1 2 4 2 7 4 3 o 9 2 4 2 9 1 8
1 2
Source 1954-58 Arthur D Little lnc International Market Potent1al for Nigerian Cassava Products 1963 1979 Jones S F The World Market for Starch and Starch Products w1th Particular Reference to Cassava Starch 1983
VIII - 3 -
(Table 8 3) Technical dynamism in raw material production in processing and in utilization have created exceptional growth in what on the surface should appear to be a relatively tradit~onal stable industry
A more recent outgrowth of th~s technological dynamism ~n the maize wet mill~ng industry is the rapid growth in h~gh fructose corn sweetners (HFCS) The possibly most important dimension to the very rapid growth in the HFCS market is the strong interplay between product substitut~on and price policy in an already well established market U S sugar policy in the post-war period has been directed to maintaining the incomes of domestic producers usually against imports from more productive tropical producers The rise of the HFCS ~ndustry has been due essentially to the protection given the domestic sugar market and the falling relative price of ma~ze One result has been falling importa of sugar into the U S from developing countries but the salient point in the present context is that tariff policy and product substitution have been the dominant elements influencing both HFCS production in the US and world trade in starch
Nevertheless before returning to the world starch market the analys~s of the U S market for cassava starch will first be completed Cassava starch has enjoyed two markets in the U S a speciality market where cassava starch ~s utilized for ~ts particular character~st~cs and the broader starch market where starches from different sources are substitutable The non-speciality market has changed over time In the early part of the century cassava starch was utilized principally for the manufacture of adhesives or glue especially for furniture manufacture and for envelopes and stamps With the advent of resin glue and natural gums these markets d~sappeared to be replaced in the 1950 s by the paper industry where cassava starch was used as a corrugating adhesive These represented large markets where other starches could have substituted and cassava starch was used because of its competit~ve price In 1928 the e ~ f price of Javanese cassava starch ~n New York was $2 31 per 100 pounds compared to a maize starch price in Ch~cago of $3 25 per 100 pounds (Comm~ttee on Finance U S Senate 1929) Thai cassava starch was very competitive with domest~cally produced maize starch through the 1950 s The cassava starch market share increased from 3 6% in 1952 to 14 1? in 1961 (Arthur D L~ttle Inc 1963) By 1968 cassava starch had ceased to be competitiv"¡ /in the broader industrial market and importa declined dramatically - Cassava starch has maintained its speciality market in the food industry but at a relat~vely insignificant level of around 30 thousand tons The largest import market for cassava starch over the course of about 50 years declined to relative insignif~cance
Responsib~lity for th~s dramat~c shift ~n cassava starch imports l~es partly with the technolog~cal advance taking place ~n the maize ~ndustry
and partly w~th the changing ~nternational pr~ce for cassava Dur~ng the 1960 s the linkage between ~nternational maize and cassava prices was severed by the creation of the European Economic Commun~ty (see the next
Not coincidentally 1968 ~s the year when a tariff hole was opened for cassava feedstuffs ~n the EEC This topic will be d~scussed in the next section
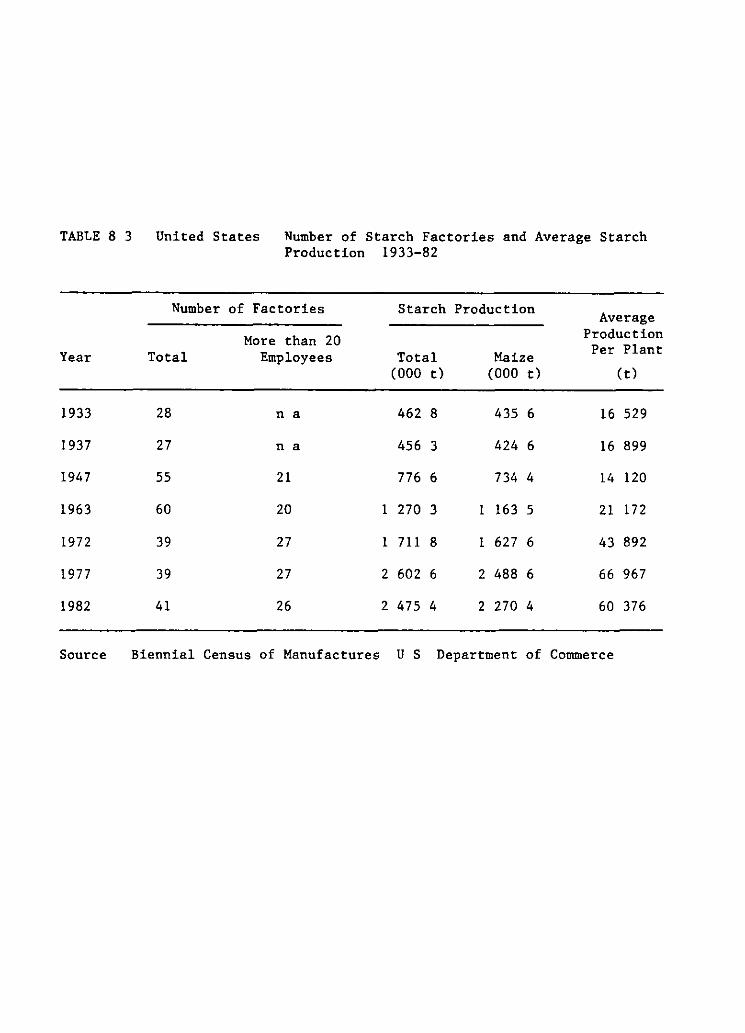
TABLE 8 3 United States Number of Starch Factories and Average Starch Production 1933-82
Number of Factories Starch Production Average
More than 20 Production
Year Total Employees Total Maize Per Plant
(000 t) (000 t) (t)
1933 28 n a 462 8 435 6 16 529
1937 27 n a 456 3 424 6 16 899
1947 55 21 776 6 734 4 14 120
1963 60 20 1 270 3 1 163 S 21 172
1972 39 27 1 711 8 1 627 6 43 892
1977 39 27 2 602 6 2 488 6 66 967
1982 41 26 2 475 4 2 270 4 60 376
Source Biennial Census of Manufactures U S Department of Commerce
VIII - 4 -
section for details) The 1960 s witnessed the rise of the dried cassava animal feed trade where cassava chip or pellet prices were linked to the internal grain pr~ces of the EEC and not to the international grain market Post-war growth in cassava starch trade was halted and throughout the 1960 s and 1970 s world exports of cassava starch remained stagnant at around 200 thousand tons However stagnation did not turn into decline as there was a major restructuring of import markets
This restructuring had two principal components the rise of new import markets in Asia and the transfer of maize wet milling technology to major markets usually through investment by the Corn Products Corporat~on of the USA By far the more important element in th~s restructuring was the development ~n major markets of a domestic capacity to produce maize starch usually based on imported maize This d~splacement of starch production based on domestic sources such as r~ce patato and wheat by starch production based on imported maize occurred essentially in the post-war per~od Several factors spawned th~s development in part~cular the declin~ng real price of maize in international markets the cost savings ~n bulk shipping of grains -- to the extent that starch became more expens~ve to ship than grains -- the very high tariff barriers in most markets for imported starch generally much lower tar~ffs on imported maize in order to support the growing animal feed sector the technical advances ~n the maize wet milling process and the high value of the sub-products especially the o~l and gluten Thus ma~ze starch became the principal starch produced in the U K all five countries in the original EEC Spain and Japan and at the same time maize starch exports from the U S declined to ~ns~gnificant levels In 1980 out of an estimated world production of starch of 16 million tons maize starch accounted for 77~ (Jones 1983)
Cassava must move in international trade in a processed form and therefore cassava must buck the post-war trend in international agricultura! trade where bulk movement of raw mater~als has dominated Cassava starch has been one casualty of these developments trends that have been set in motion by technical change and agricultura! trade policies This however has not prevented cassava starch from carv~ng out new markets essentially by minimiz~ng transport costs and by breaching trade barriera These new markets have come in Asia and the importance of transport costs in the development of these markets can be seen in Table 8 4
Japan developed as a maJor importer of cassava starch in the 1970 s but imported cassava starch was always of secondary ~mportance in domestic markets because of trade restrictions Japan erected a relat~vely
elaborate set of import restrict~ons designed on the one hand to protect domestic raw material producers especially sweet patato and patato farmers and on the other hand to meet the needs of a growing domest~c starch market Starch production in Japan ~ncreased from 895 thousand tons ~n 1962 to 1 975 thousand tons in 1982 to become the world s second largest starch producer Whereas in 1962 sweet patato and potato starch accounted for over 807 of total production (Business and Defense Serv~ces Admin~strat~on 1967) by 1982 the production share had fallen to 20/ In
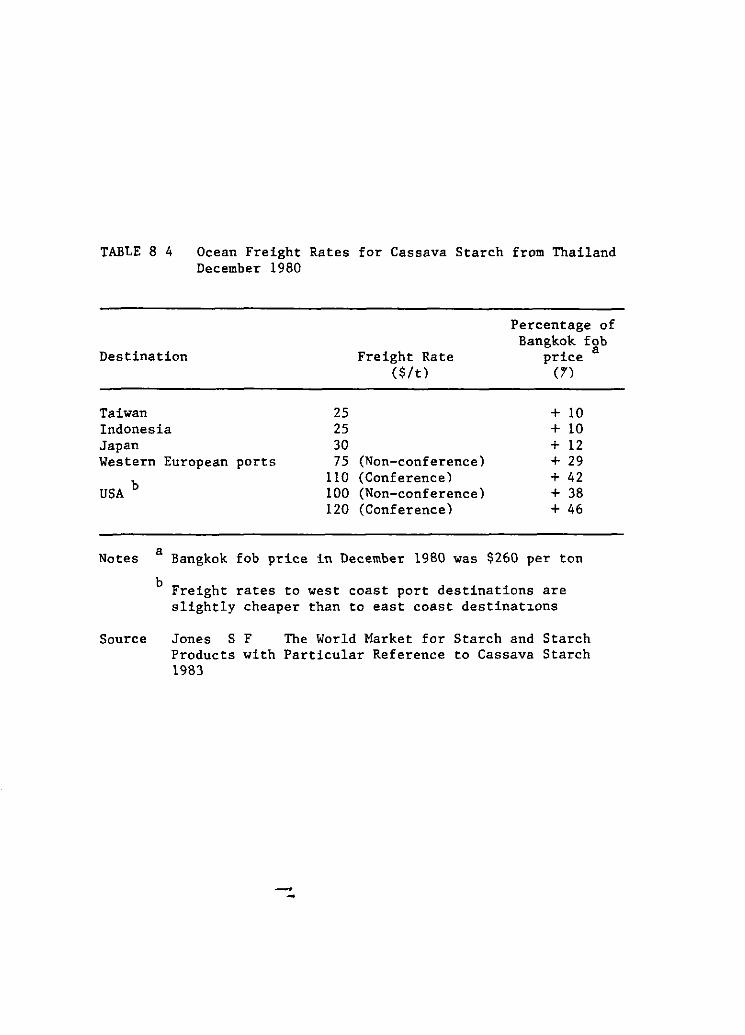
TABLE 8 4 Ocean Freight Rates for Cassava Starch from Thailand December 1980
Percentage of Bangkok fob
a Destination Freight Rate price ($/t) {7)
Taiwan Indonesia Japan
25 25 30
+ 10 + 10 + 12
Western European ports 75 {Non-conference) + 29
USA b
Notes a
b
Source
110 (Conference) + 42 100 (Non-conference) + 38 120 (Conference) + 46
Bangkok fob price in December 1980 was $260 per ton
Freight rates to west coast port destinations are slightly cheaper than to east coast destinat~ons
Jones S F The World Market for Starch and Starch Products with Particular Reference to Cassava Starch 1983
VIII - 5 -
this period in which the production of sweet potato starch fell the production share of maize starch increased from 9 3% in 1962 to 76~ 1n 1982 (F1gure 8 4) Even though maize used in starch production comes under the quota and tariff system maize starch has come to dominate the domest1c market Part of the reason is that the maJ or use for starch 1n Japan is for sweetner production where maize wet-milling technology is well advanced this accounted for 5 71. of total consumption 1n 1978/79 (Jones 1983)
The cassava starch that is imported services partly a speciality market and partly those industries where cassava starch is subject to quota rather than a 25% ad valorem duty (see Jones 1983 for a deta1led discussion of the Japanese trade protection system for starch) Thus cassava starch was able to take advantage of the rapid growth 1n the Japanese starch market but cassava starch only filled in at the margin Without trade hberalization there is little scope for a large role for cassava starch in the Japanese market even though imports will fluctuate to a certa1n extent depending on the import price as happened in 1984 when Thai export prices declined markedly
However rapid industrialization in the countries of the Pacific rim have generated new markets for cassava starch In 1980 Taiwan became the largest importer of cassava starch Imports increased from an average of around 10 thousand tons 1n the 1973-76 period to over 100 thousand tons 1n 1981-84 This was due to falling domestic production especially for cassava starch and rapidly rising demand Imports went from 4% of domesuc consumption in 1975 to 52% in 1980 (Jones 1983) The only dynam1c component in the domestic starch sector was maue starch where production 1ncreased from 17 thousand tons in 1975 to 45 thousand tons in 1980 (Jones 1983) However one factor has limited the growth of the maize starch industry and that 1s a domestic sugar industry This has forestalled movement to an integrated starch-sweetner technology while market s1ze has lim1ted scale economies in processing On the other hand tariffs on imported maize of 3% are much more favorable than the tariff of Taiwan $1500 per ton on cassava starch -- a rate of about 16~ on 1980 cif prices The future for cassava starch imports into Taiwan h1nges on developments in the domestic maize starch sector and here domest1c sugar production and scale economies will probably be the driving forces
The market analysis above provides suffic1ent reasons for the stagnation at around 200 thousand tons in the world trade in cassava starch over the course of the 1960 s and 1970 s What then is surpris1ng is the very s1gnificant expansion in export volumes 1n the 1981-84 period In 1984 Tha1 exports of cassava starch reached an h1storical high for any country of 465 thousand tons The U S S R suddenly entered the market in 1982 import1ng very large volumes of cassava starch S1ngapore also became an importer of some substance and Hong Kong has cont1nued to import about 10 thousand tons However most interesting of all 1s that Indonesia imported almost 100 thousand tons in 1982 and over 50 thousand tons in 1983 wh1le Malaysia came into the market for over 10 thousand tons 1n 1984 --All of these are essentially Asian markets and Malaysia and Indonesia are as well maJor producers of cassava starch A maJar devaluat1on of the Tha1 baht in 1981 and particularly low root pr1ces in 1981 and 1984 partly precipitated b) the Thailand-EC quota agreement made
VIII - 6 -
Thai cassava starch especially competitive in regional markets This increased Japanese and Taiwanese importa and made Tha1 starch competit1ve with domestically produced starch in Malaysia and Indones1a Supply s1de factors thus also have an impact on the world market and the analysis thus turns to a brief summary of export trends
Historically exports of cassava starch have usually been dominated by a single country except in relatively brief periods of transition between countries Comparative advantage in cassava starch production has sh1fted quickly and dominance is virtually total Thus comparative advantage shifted from Malaysia to Indonesia in the penad 1907 to 1913 and from Indonesia to Thailand during the Second World War (Table 8 S) The f1rst transition was precipitated by the rubber boom 1n Malaya while the second came as a result of the ravages of the war and the demise of the colonial regime in Indones1a There were thus clear reasons behind the rap1dity of the transition per1od but what is less clear is why single countries should dominate in world cassava starch trade
A majar part of the reason for this dominance is the relatively small size of the world market and the inherent riskiness in scaling up an export-oriented industry in such a thin market In both transitions the precipitating cause of decline in the leading country was a loss of profitability in the production of cassava starch In Malaysia th1s was due to the rising opportunity cost of land due to the expanding rubber industry and 1n Indonesia it was due to the destruction of processing capac1ty and the demise of the plantation systems of Java where land costs under a colonial adm1nistrator did not reflect its true scarcity value On the other side in the expanding countries growth in 1nvestment in process1ng and in turn increased cassava production had to be motivated by a significantly large profit marg1n This initial establishment phase was usually based on a period of relatively high world pr1ces and some factor which made cassava production particularly competitive i e some basis for comparative advantage In the case of Indonesia the basis of comparative advantage was a substantial and relatively cheap labor force a plent1ful water supply international cap1tal availability relatively liberal terms for plantat1on development in upland areas and an existing smallholder production base However the initial base for comparat1ve advantage was reinforced over t1me by development of excess processing capaci y (and therefore quicker supply response) established marketing channels and a research capacity for developing new technologies Consol1dation of the cassava starch export industry made entry by other countries into this market virtually imposs1ble
Comparat1ve advantage is thus not JUSt a matter of intrinsic factors which make a country particularly compet1tive If export dom1nance can be established further evolution in the industry tends to re1nforce comparative advantage That is comparative advantage 1n international trade can be created and does not necessarily depend only on 1nit1al factor endowments To a very sign1f1cant extent Tha1land created its particular comparative advantage 1n the product1on of cassava starch and later cassava pellets This was based on the development of a maJar road system especially into the Northeast a relatively liberal land policy together with an unexplo1ted frontier an ind1genous eng1neering capacity so that starch processing factories could be manufactured locally an ex1st1ng well-developed export sector based on rice and commercial m1ddlemen with
VIII - 7 -
the capital to invest Thailand had exported cassava starch as early as the 1930 s but it was not till the demise of Indonesian exports that the Thal. cassava starch industry began to expand under the impetus of high prices following the Second World War By the mid-1950 s Thailand was unchallenged in the world cassava starch market and by the 1980 s both Malaysia and Indonesia were importing cassava starch from Thailand
The cassava starch industry in Thailand faces two principal constraints on further expansion both of which are due to trade policies of other countries The first is the high tarJ.ff barriers for starch in practically all majar import markets except the U S SJ.nce cassava starch moves in world trade in a starch form rather than as a raw material differential trade barriers have resulted in cassava starch not being able to take advantage of the relatJ.vely buoyant growth in demand for starch whereas maize has captured much of the market Moreover the only other exports of starch of any significance is patato starch from the Netherlands Patato starch has dJ.fficulty competing with maize starch within the EC and substantial subsidies are necessary to export these surpluses Annual exports from the EC of about 150 thousand tons further decrease the international market for cassava starch A pol1cy constra1ned market very much characterizes world trade l.n cassava starch even though some pr1ce elasticity does exist as is characteristic of a product with such clase substl.tutes
This demand elasticJ.ty is closely linked to the second constraint In ThaJ.land the starch industry must compete WJ.th the pellet export market for cassava roots Because prices for pellets are defined by internal EC grain prices the chip and pellet J.ndustry makes the price of roots significantly more expensive than if the industry had to compete at world maize prl.ces which the starch J.ndustry must do The starch industry usually comes into the root market during the rainy period when root prices are low and root demand from the pellet industry is also low As root prices rJ.se the starch J.ndustry is usually caught in a prl.ce squeeze and often must cease operation Significant excess capacity normally exJ.sts l.n the industry Thus when root prices are low starch producers can significantly expand their market by lowering prices and because of the excess processing capacl.ty output response can be significant With the low root prices caused by the quota in the early 1980 s the Thal. starch industry was able to double its exports (Table 8 6) Thailand is often constral.ned in expandJ.ng its starch market by the particular policy context of cassava within the EC however for Thailand thJ.s l.S not a loss since the socJ.al profits for selling pellets in the EC market more than compensate for the loss of starch sales
Future prospects for world trade in starch are if anything unpredJ.ctable No studJ.es predicted nor could have predJ.cted the rapid expansion in cassava starch trade in the 1980 s after two decades of stagnation since it was principally due to the l.mposition of the quota Policies are the doml.nant J.nfluence on world trade l.n cassava starch and these have tended to remal.n outside the real of economl.c predictJ.on The only feature that is clear l.S that Thailand will contl.nue to domJ.nate exports for the foreseable future and the prospects for ány other country entering the market at any substantJ.ve volume are minimal
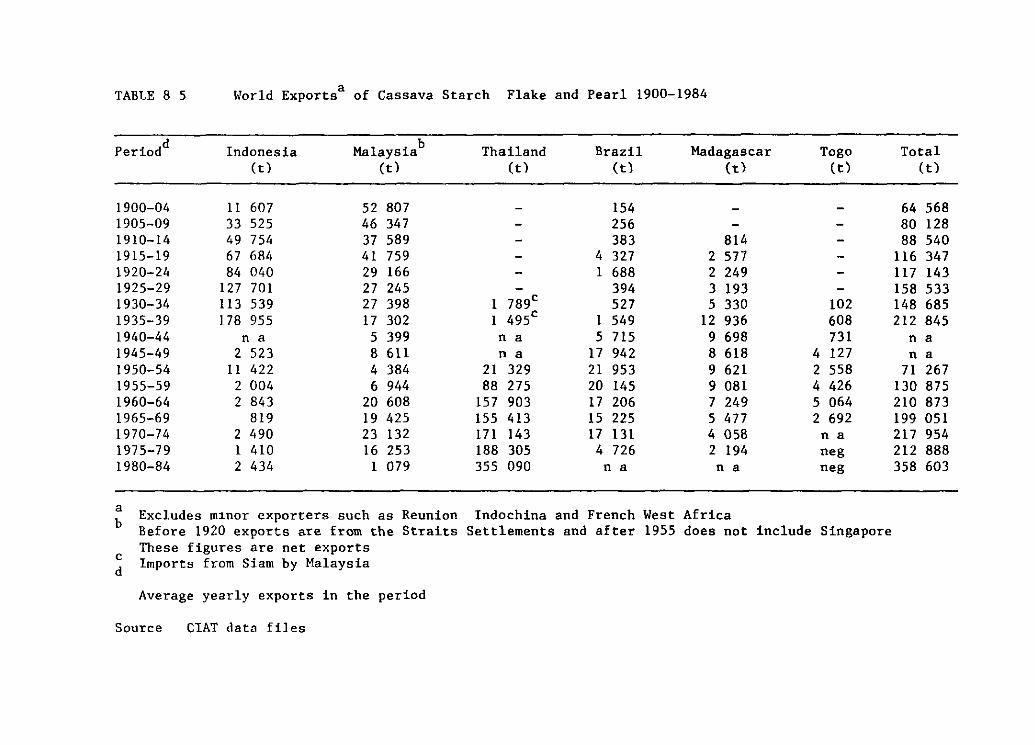
TABLE 8 S a World Exports of Cassava Starch Flake and Pearl 1900-1984
Period d Indonesia Malaysia b Thailand Brazil Madagascar Togo Total (t) (t) (t) (t) (t) (t) (t)
1900-04 11 607 52 807 - 154 - - 64 568 1905-09 33 525 46 347 - 256 - - 80 128 1910-14 49 754 37 589 - 383 814 - 88 540 1915-19 67 6R4 41 759 - 4 327 2 577 - 116 347 1920-24 84 040 29 166 - 1 688 2 249 - 117 143 1925-29 127 701 27 245 - 394 3 193 - 158 533 1930-34 113 539 27 398 1 789c 527 S 330 102 148 685 1935-39 178 955 17 302 1 495c 1 549 12 936 608 212 845 1940-44 n a S 399 n a S 715 9 698 731 n a 1945-49 2 523 8 611 na 17 942 8 618 4 127 n a 1950-54 11 422 4 384 21 329 21 953 9 621 2 558 71 267 1955-59 2 004 6 944 88 275 20 145 9 081 4 426 130 875 1960-64 2 843 20 608 157 903 17 206 7 249 5 064 210 873 1965-69 819 19 425 155 413 15 225 S 477 2 692 199 051 1970-74 2 490 23 132 171 143 17 131 4 058 na 217 954 1975-79 1 410 16 253 188 305 4 726 2 194 neg 212 888 1980-84 2 434 1 079 355 090 n a n a neg 358 603
a Excludes m1nor exporters such as Reunion Indochina and French West Africa b Before 1920 exports are from the Straits Settlements and after 1955 does not include Singapore
e These figures are net exports
d Imports from Siam by Malaysia
Average yearly exports in the period
Source CIAT data files
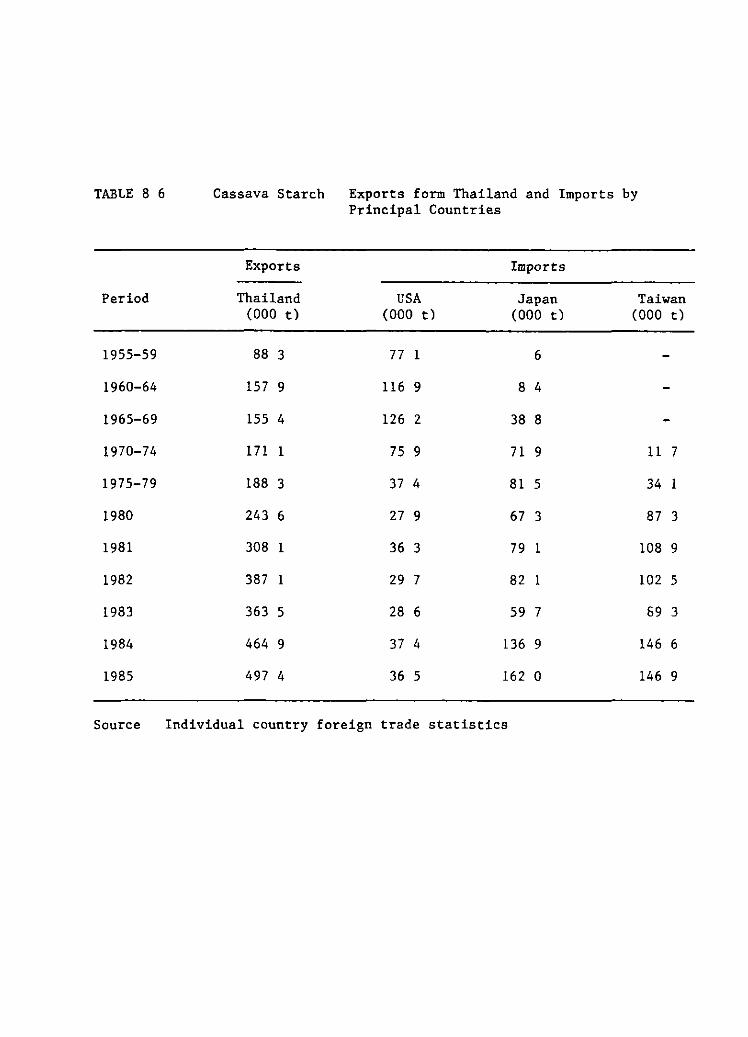
TABLE 8 6
Period
1955-59
1960-64
1965-69
1970-74
1975-79
1980
1981
1982
1983
1984
1985
Source
Cassava Starch Exports form Thailand and Imports by Principal Countries
Exports Imports
Thailand USA Japan Taiwan (000 t) (000 t) (000 t) (000 t)
88 3 77 1 6
157 9 116 9 8 4
155 4 126 2 38 8
171 1 75 9 71 9 11 7
188 3 37 4 81 S 34 1
243 6 27 9 67 3 87 3
308 1 36 3 79 1 108 9
387 1 29 7 82 1 102 S
363 S 28 6 59 7 69 3
464 9 37 4 136 9 146 6
497 4 36 S 162 o 146 9
Individual country foreign trade statistics
VIII - 8 -
The world starch market is really something of an allegory for the history of cassava The lessons are essent~ally two F~rst rarely if ever have there been policy ~ntervent~ons by domestic governments in their cassava producing sectors On the other hand policy interventions by importing countries either directly on imported cassava or indirectly on domestic substitutes have continually influenced cassava s trade prospects Second prior to the Second World War cassava products were very competitive with grain products even consider~ng the relatively high cost of international shipping The basic change between the pre-war and post-war position of cassava has been the rapid technical change in grain production in temperate developed countries especially the U S The relative shift ~n comparative advantage between tropical cassava and temperate grains has been due to very large d~fferences in research expenditures on grains versus cassava Every allegory has its moral and cassava s continued role in international trade is testimony to its inherent product~vity Second modern comparative advantage especially of trop~cal cassava versus temperate grains is not fixed in stone but will depend essentially on techn~cal progresa together with economies of scale of post-harvest handling and processing
Protection~sm and Subst~tution The Rise in Trade in Cassava Feedstuffs
Apart from Thailand and Malaysia cassava starch production has normally been a component of a w~der cassava sector where the bulk of the production normally went to food uses In many cases these were dry products such as gaplek in Indonesia or farinha de mandioca in Brazil Prior to the early 1960 s surpluses of these products were often exported pr~ncipally to be used as an animal feedstuff in European countries Volumes in this century prior to 1960 were never large only rarely exceeding 200 thousand tons in a single year By comparison the ~nternat~onal ma~ze trade was normally around 4 to 6 million tons during this period having reached a peak of 13 million tons ~n 1937 (Internat~onal lnstitute of Agriculture) Argentina and Eastern Europe were the main suppliers of maize in this period lnternational transport costs and the more rudimentary state of balanced feed technology limited the development of a w~der trade in cassava feedstuffs
The current large trade in cassava pellets was essentially policy-induced The origin of th~s trade was German price policy ~n the 1950 s Western Europe in the immediate post-war per~od was the princ~pal market for feedgrain imports Germany however developed a policy of h~gh domest~c grain pn.ces to support the income of ~ts own farmers (Figure 8 S) The rap~dly expanding animal feed sector however had sign~ficant ~ncent1ve to try develop cheaper supplies of carbohydrate sources wHh cassava be~ng a potent~al grain subst1tute German companies 1n the 1950 s began developing supply sources 1n Indones~a and Tha~land German 1mports of cassava in 1955 were 131 thousand tons 1n 1959 import levels were 240 thousand tons and in 1960 323 thousand tons The year 1960 marked the point at which Germany turn"d from Indonesia to Tha~land as a principal source of supply During this per~od the other European countr~es were relat~vely m~nor importers of cassava
The formation of the European Economic Community and its assoc~ated
Common Agricultura! Pol~cy served to expand the market that German pol~cy
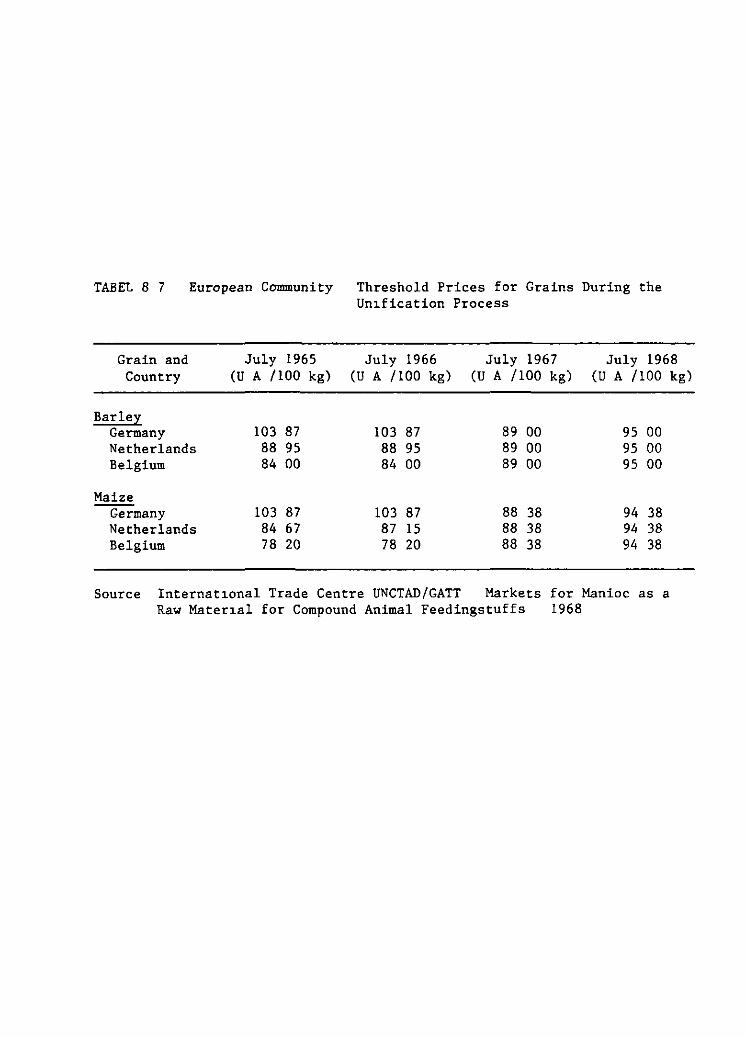
TABEL 8 7 European Community Threshold Prices for Grains During the Un~fication Process
Grain and July 1965 July 1966 July 1967 July 1968 Country (U A /100 kg) (U A /100 kg) (U A /100 kg) (U A /100 kg)
Bar ley Germany 103 87 103 87 89 00 95 00 Netherlands 88 95 88 95 89 00 95 00 Belgium 84 00 84 00 89 00 95 00
Maize Germany 103 87 103 87 88 38 94 38 Netherlands 84 67 87 15 88 38 94 38 Belgium 78 20 78 20 88 38 94 38
Source Internat~onal Trade Centre UNCTAD/GATT Markets for Manioc as a Raw Mater~al for Compound Animal Feedingstuffs 1968
VIII - 9 -
and German companies had developed The first stage come in July 1962 when the variable levy and support price system become effective for all feedgrains The agr~cultural common market rested on two prices The intervention pn.ce is the guaranteed min~mum pr~ce for farmers at which marketing agencies throughout the E E e are committed to huy the gra~n The threshold price is the minimum price at which grain imports from non-E E e countries enter the community The variable levy is the difference between the threshold price and the current e i f import price Interna! prices are thus insulated from world market prices and operate within a band between the floor or intervention price and the ceiling or threshold price Br~nging all interna! pr~ces within the economic community into line was done gradually and it was not unt~l July 1967 that all national intervent~on and threshold pr~ces were unified and border taxes were abolished
During this process cassava was not overlooked but nevertheless was treated differently Initially in 1962 only cassava meal imports were subJ ect to tariffs These consisted of a f~xed component and a variable component based on the barley variable levy After various changes by November 1964 the meal levy was fixed at 25 percent of the barley levy plus 2 5 units of account (the European eommunity accounting un~t) per ton (see Nelson 1982 for further detail) In July 1967 chips and pellets were brought under tariff regulat~on and these products faced a variable levy of 18% of the barley variable levy and no fixed charge The meal tariff remained the same The most important change however came in July 1968 when as part of Kennedy Round of the GATT negot~ations the levy on cassava pellets and chips was bound to a maximum 6-' ad valorem basis eassava meal was not bound and continued to be subject to~he higher duty
The pattern and trends ~n cassava imports were remarkably sensitive to these policy changes First the form in which cassava was imported changed with the different~al duty structure Meal was the principal form of ~mports pr~or to 1962 With the sl1ghtly h~gher duty structure for meal growth in imports ~n the 1962-68 period shifted to ch~ps even though chips are bulk~er and more costly to transport Meal was eliminated as an import item ~n 1968 due to the change 1.n tariff structure and w~th the investment security provided by the duty bind~ng the imports of cassava shifted almost completely to pellets to take advantage of economies in transport
Germany remained the dominant importer of cassava up to 196 7 The unification of prices however shifted profitability of cassava imports to the Netherlands and Belgium Unificat1.on resulted in gra~n prices in Germany coming down and those in the Netherlands and Belgium r~s~ng
(Table 8 7) Th~s reduced cassava s relat~ve profitab~l~t} in German} and ~ncreased it ~n the Netherlands and Belgium (Table 8 8) As grain pr~ces were the same across countr~es transport costs became a determJ.ning factor of wh~ch areas could most successfully bid for cassava ~mports As Rotterdam had by far the most efficient unload~ng and distribution system the Netherlands became the locus uf cassava imports Thus ~n 1966 Germany imported 702 thousand tons of cassava compared to only 96 thousand tons for the Netherlands Germany did not reach that level of 1.mports again until 1977 By that t~me the Netherlands was ~mporting 1 8 m~llion tons (Table 8 9)
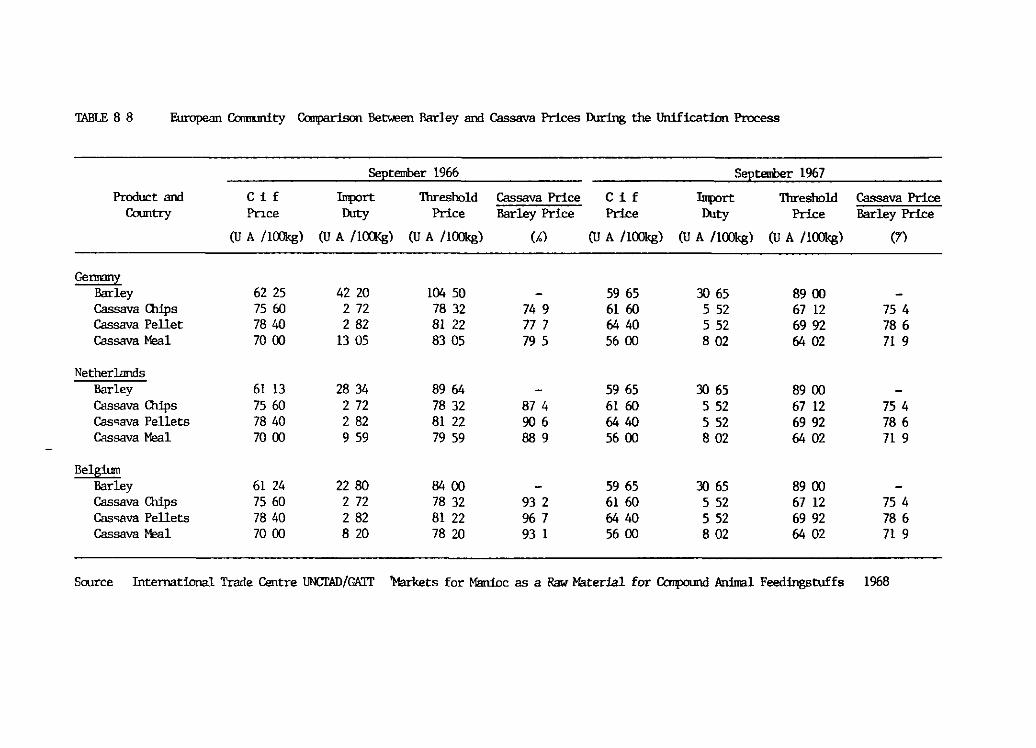
TABLE 8 8 European Conmmity Canparison Be~ Barley and Cassava Prices During the Unificat:inn Process
~tember 1966 S tember 1%7
Product and e i f Inport Threshold Cassava Price e i f lnport Threshold Cassava Price Country Pnce Duty Price Barley Price Price Jluty Price Barley Price
(U A /100kg) (U A / HXl<g) (U A /100kg) (k) (U A /100kg) (U A /100kg) (U A /100kg) (7)
Ce~ Bar ley 62 25 42 20 104 so - 59 65 30 65 89 00 Cassava lliips 75 60 272 78 32 74 9 61 60 S 52 67 12 75 4 Cassava Pellet 78 40 2 82 81 22 777 64 40 S 52 69 92 78 6 Cassava Meal 70 00 13 os 83 os 79 5 56 00 8 02 64 02 719
Netherlands Bar ley 61 13 28 34 89 64 - 59 65 30 65 89 00 Cassava lliips 75 60 272 78 32 87 4 61 60 5 52 67 12 75 4 Cas•ava Pellets 78 40 2 82 81 22 906 6440 5 52 69 92 78 6 Cassava Meal 70 00 9 59 79 59 889 56 00 8 02 64 02 719
Belg:lum Bar ley 61 24 22 80 8400 - 59 65 30 65 89 00 Cassava Chips 75 60 272 78 32 93 2 61 60 S 52 67 12 75 4 Caso;ava Pellets 78 40 2 82 81 22 96 7 64 40 S 52 69 92 78 6 Cassava Meal 70 00 8 20 78 20 93 1 56 00 8 02 64 02 71 9
Source Internacional Trarle Centre UNCrAD/GAlT 'Markets for Marúoc as a Raw Material for Canpound An:lrral Feedingstuffs 1%8
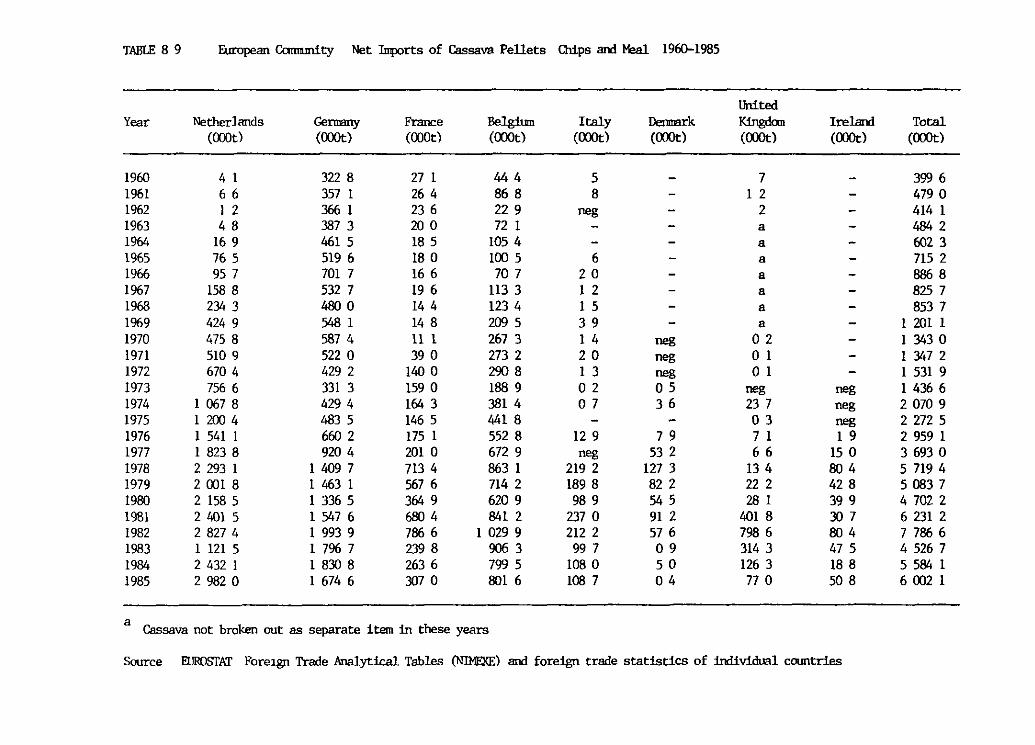
TABLE 8 9 European Canrunity Net liqx>rts of Cassavn Pelleta Chips and ~ 1960-1985
United Year Netherlands Germany France Belgium !tal y Dernmrk K:1ngdan Ireland Total
(OOOt) (OOOt) (OOOt) (OOOt) (OOOt) (OOOt) (OOOt) (OOOt) (OOOt)
1960 4 1 322 8 27 1 444 5 - 7 - 399 6 1961 6 6 357 1 26 4 86 8 8 - 1 2 - 479 o 1962 1 2 366 1 23 6 22 9 neg - 2 - 414 1 1963 4 8 387 3 20 o 721 - - a - 484 2 1964 16 9 461 5 18 5 105 4 - - a - 602 3 1965 76 5 519 6 18 o 100 5 6 - a - 715 2 1966 95 7 701 7 16 6 70 7 2 o - a - 8868 1967 158 8 532 7 19 6 113 3 1 2 - a - 825 7 1968 234 3 4800 14 4 123 4 1 5 - a - 853 7 1969 424 9 548 1 14 8 209 5 3 9 - a - 1 201 1 1970 475 8 587 4 11 l 267 3 1 4 neg o 2 - 1 343 o 1971 510 9 522 o 39 o 273 2 20 neg o 1 - 1 347 2 1972 670 4 429 2 140 o 290 8 1 3 neg o 1 - 1 531 9 1973 756 6 331 3 159 o 188 9 o 2 o 5 neg neg 1 436 6 1974 1 067 8 429 4 164 3 3814 o 7 3 6 237 neg 2 070 9 1975 1 200 4 4835 146 5 4418 - - 03 neg 2 272 5 1976 1 541 1 660 2 175 1 552 8 12 9 7 9 7 1 1 9 2 959 1 1977 1 823 8 920 4 2010 672 9 neg 53 2 6 6 15 o 3 693 o 1978 2 293 1 1 409 7 7134 8631 219 2 127 3 13 4 804 5 719 4 1979 2 001 8 1 463 1 567 6 714 2 189 8 82 2 22 2 42 8 5 083 7 1980 2 158 5 1 336 5 364 9 620 9 98 9 54 5 281 39 9 4 702 2 1981 2 401 5 l 547 6 680 4 8412 237 o 91 2 401 8 307 6 231 2 1982 2 827 4 1 993 9 786 6 1 029 9 212 2 57 6 798 6 804 7 786 6 1983 1 121 5 1 796 7 239 8 906 3 99 7 o 9 314 3 47 5 4 526 7 1984 2 432 1 1 830 8 263 6 799 5 108 o 5o 126 3 18 8 5 584 1 1985 2 982 o 1 674 6 307 o 801 6 108 7 o 4 770 508 6 002 1
a Cassava not broken out as separate item in these years
Source ElJROSTAT Fore1g11 Trade Analytical Tables (NJMEXE) and foreign trade statistics of individual cOtmtries
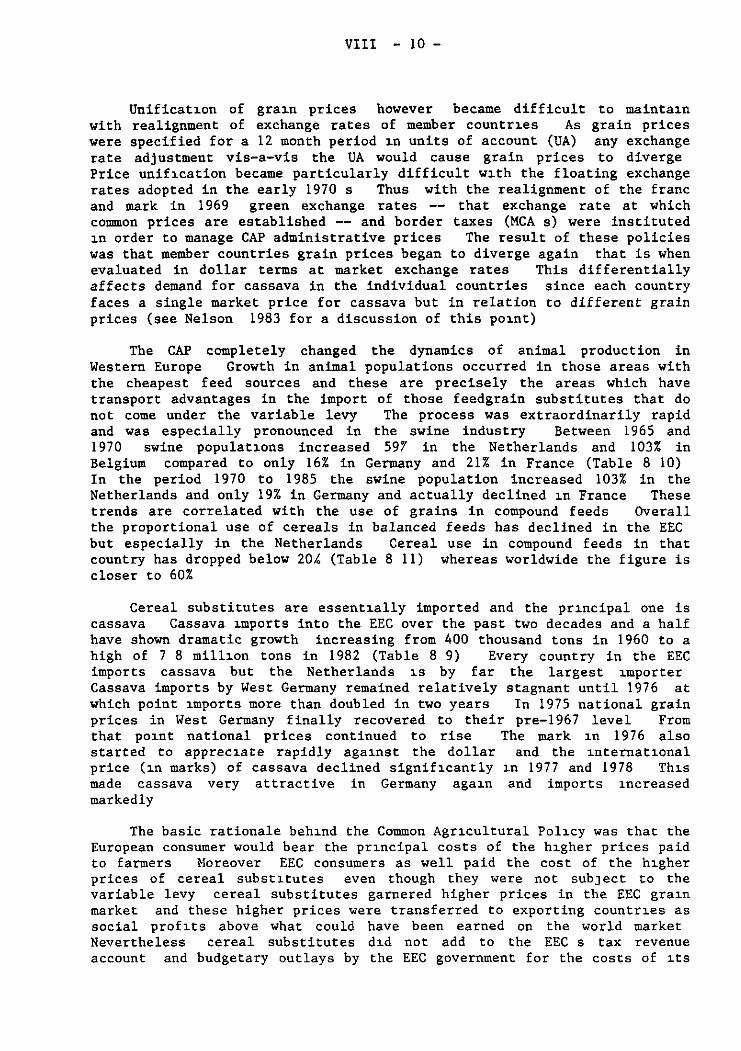
VIII - 10 -
Unificat1.on of gral.n prices however became difficult to maintal.n with realignment of exchange rates of member countr1.es As grain prices were specified for a 12 month period 1.n units of account (UA) any exchange rate adjustment vis-a-vis the UA would cause grain prices to diverge Price unif1.cation became particularly difficult Wl.th the floating exchange rates adopted in the early 1970 s Thus with the realignment of the franc and mark in 1969 green exchange rates -- that exchange rate at which common prices are established -- and border taxes (MCA s) were instituted 1.n order to manage CAP administrative prices The result of these policies was that member countries grain prices began to diverge again that is when evaluated in dollar terms at market exchange rates This differentially affects demand for cassava in the individual countries since each country faces a single market price for cassava but in relation to different grain prices (see Nelson 1983 for a discussion of this po1.nt)
The CAP completely changed the dynamics of animal production in Western Europe Growth in animal populations occurred in those areas with the cheapest feed sources and these are precisely the areas which have transport advantages in the import of those feedgrain substitutes that do not come under the variable levy The process was extraordinarily rapid and was especially pronounced in the swine industry Between 1965 and 1970 swine populat1.0ns increased 597 in the Netherlands and 103% in Belgium compared to only 16% in Germany and 21% in France (Table 8 10) In the period 1970 to 1985 the swine population increased 103% in the Netherlands and only 19% in Germany and actually declined 1.n France These trends are correlated with the use of grains in compound feeds Overall the proportional use of cereals in balanced feeds has declined in the EEC but especially in the Netherlands Cereal use in compound feeds in that country has dropped below 20~ (Table 8 11) whereas worldwide the figure is closer to 60%
Cereal substitutes are essent1.ally imported and the pr1.ncipal one is cassava Cassava 1.mports into the EEC over the past two decades and a half have shown dramatic growth increasing from 400 thousand tons in 1960 to a high of 7 8 milll.on tons in 1982 (Table 8 9) Every country in the EEC imports cassava but the Netherlands 1.s by far the largest 1.mporter Cassava imports by West Germany remained relatively stagnant until 1976 at which point 1.mports more than doubled in two years In 1975 national grain prices in West Germany finally recovered to their pre-196 7 level From that po1.nt national prices continued to rise The mark 1.n 1976 also started to apprecJ.ate rapidly aga1.nst the dollar and the J.nternatJ.onal price (1.n marks) of cassava declined signifJ.cantly l.n 1977 and 1978 Th1.s made cassava very attractive in Germany agal.n and imports 1.ncreased markedly
The basic rationale beh1.nd the Common AgrJ.cultural PolJ.cy was that the European consumer would bear the pr1ncipal costs of the h1.gher prices paid to farmers Noreover EEC consumers as well paid the cost of the h1.gher prices of cereal substl.tutes even though they were not subJect to the variable levy cereal substitutes garnered higher prices in the EEC gra1.n market and these higher prices were transferred to exporting countr1.es as social profl.ts above what could have been earned on the world market Nevertheless cereal substitutes d1.d not add to the EEC s tax revenue account and budgetary outlays by the EEC government for the costs of 1.ts
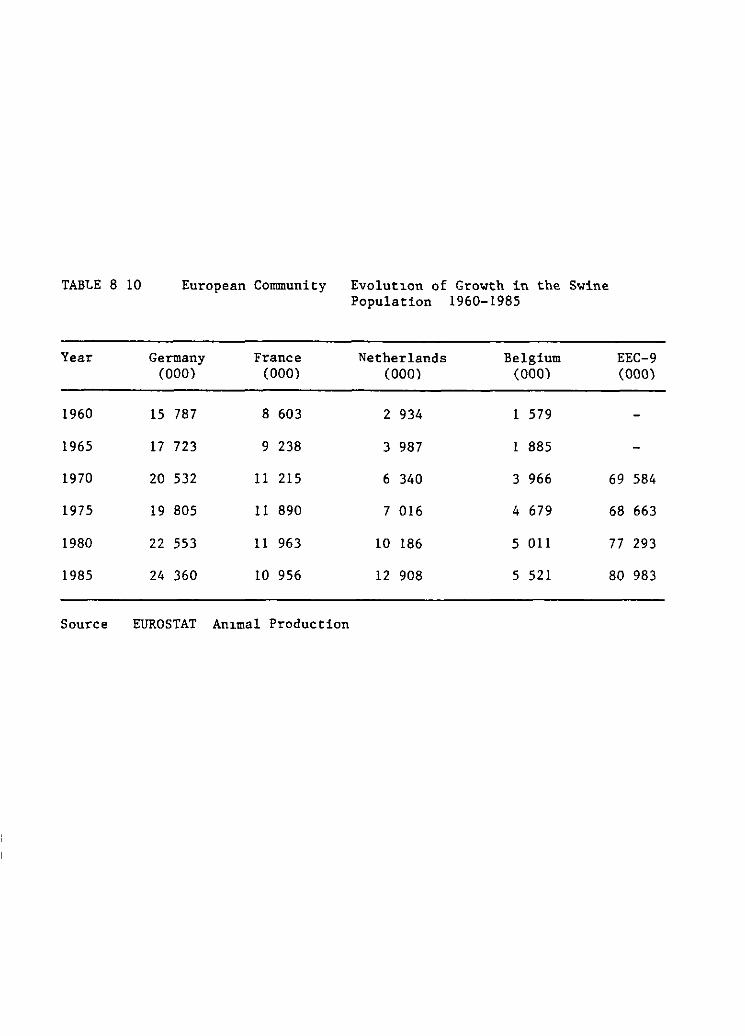
TABLE 8 10
Year
1960
1965
1970
1975
1980
1985
European Community Evolut1on of Growth in the Swine Population 1960-1985
Germany France Netherlands Belgium (000) (000) (000) (000)
15 787 8 603 2 934 1 579
17 723 9 238 3 987 1 885
20 532 11 215 6 340 3 966
19 805 11 890 7 016 4 679
22 553 11 963 10 186 5 011
24 360 10 956 12 908 5 521
Source EUROSTAT An1mal Production
EEC-9 (000)
69 584
68 663
77 293
80 983
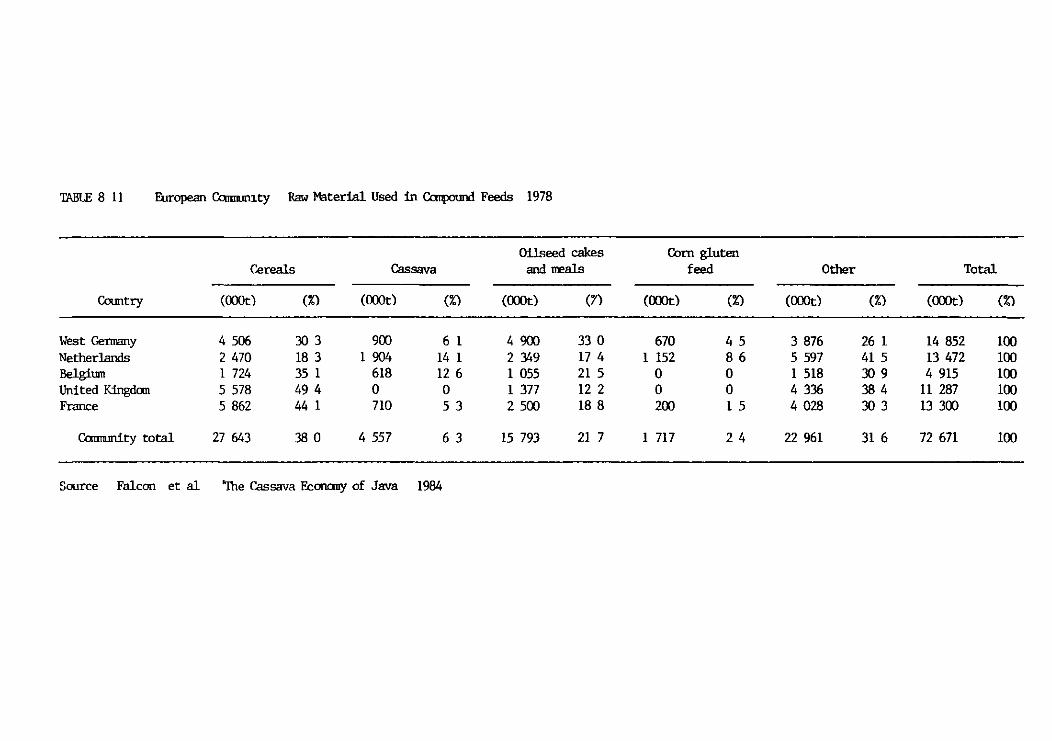
TABLE 8 11 European Camrurnty Raw Material Used in Canpound Feeds 1978
OiL~eed cakes Coro gluten C.ereals Cassava and meals feed Other Total
Country (OOOt) (%) (OOOt) (%) (OOOt) (7) (OOOt) (%) (OOOt) (%) (OOOt) (%)
West Gerrnany 4S06 303 900 6 1 4 900 33 o 670 4 S 3 876 26 1 14 8S2 100 Netherlands 2 470 18 3 1 904 14 1 2 349 17 4 1 1S2 8 6 S S97 41 S 13 472 lOO Belgium l 724 3S 1 618 12 6 1 oss 21 S o o 1 Sl8 309 4 91S lOO United Kingdan S S78 49 4 o o 1 377 12 2 o o 4336 384 11 287 100 France S 862 441 710 S 3 2SOO 18 8 200 1 S 4 028 303 13 300 lOO
Coommity total 27 643 380 4 557 6 3 15 793 21 7 1 717 24 22 961 31 6 72 671 100
Source Falcon et al 'The Cassava Econany of Java 1984
VIII - 11 -
grain policy atarted to increase aignificantly in the early 1980 s In that period the EEC became a net exporter of graina the dallar started to appreciate aga~nst European currencies making the domeat1c costs of export subsidies high and cassava importa reached record high levels in 1981 and 1982 The budgetary costs of the CAP grain policy started to reach levela that were putt~ng atrains on the capacity of the EEC to generate tax revenue
Caasava atarted to play a significant role in the ability of the CAP to sustain ita obJectives In an econometric model of the EEC feedgrain market Rastegari (1982) found that cassava imports and conaumption had a positive impact on livestock production -- thereby conf1rm1ng the previous analysis -- and had a negative impact on feedgrain imports The latter effect is expected and results in the loss of tariff revenues to the EEC treasury The more s~gnificant f1nding was that casaava importa had a negative effect on the sett~ng of threshold prices Cassava importa were reducing the flexibility of the EC to set domestic farm pr~ces especially when the EC moved into a net export position in graina where export subsidies were large and dumping developed political repercussions with traditional grain exporters especially the U S
The EEC waa under significant pressure to reduce the growth in budgetary costs of the CAP w~thout the political flexibility of legislating majar structural reform in agr~cultural policy The EEC sought to resolve the s1tuat1on by reduc~ng the growth in imports of cassava Because the 64 ad valorem import duty on caasava was bound in the GATT the EEC sought to--negot~ate voluntary export reatraints with princ~pal supplying countries espec~ally Thaüand The EEC found this to be the politically most tractable solution since unbinding of the tar1ff would have required agreement of compensation with export~ng countries with which the b1nding had been negotiated and with the country (1f d1fferent) which 1s the majar suppl1er Moreover all the EEC countr~es would as well have had to agree to the unbind~ng In November 1980 Thaüand agreed in principle to the voluntary l~mitation of cassava exports to the EEC however it is not t1ll September 1982 that the voluntary export restraint agreement was rat~fied by both part~es
Thailand felt that she had little bargaining power at th~s stage She had already negotiated a quota agreement for textile exports to the EEC an industry in which investments had been large and which was a principal component of her industrializat1on strategy Moreover Thailand did not want to put a pol1tically sens1tive industry auch as cassava (because of 1ts 1mportance as a source of farm income in the Northeast) at risk by relying only on the diff1culty of EEC members reach~ng agreement among themselves on an unb~nding of the duty In add1tion Tha1land was prom1sed a s1gn1ficant increase 1n agricultura! development aid to be spent on cassava divers~ficatwn in the Northeast Finally as Blyth (1984) has shown in another context from the exporters v1ewpoint voluntary export restraints are the least harmful form of providing protection against imports into the EEC Weighing the options Thailand chose the less risky course However as Br1tain s Overseas Development I~1tute observed
The story comb1nes all those elements wh1ch so often br1ng the CAP into d1srepute m1sd1rected public expend1ture (in this case of aid money) insensitive protectionism and uncr1tical acceptance of the v1ews of
VIII - 12 -
European farming interests at the expense of consumers (in this case other farmers) and overseas suppliers (House of Lords 1981)
As a concession to Thailand the EEC also committed 1tself to maintaining Thailand s position in the European cassava market The EEC thus sought voluntary export restraints from other principal export1ng countries In 1982 an agreement also was reached with Indonesia and Brazil who were then GATT members which unbound the tariff and replaced it with a tariff-quota The agreement for all parties concerned was limited to a five-year period (Table 8 12) Thailand was particularly d1sadvantaged in the agreement by being the only country whose export quota would decl1ne over time Also in the initial understanding the EEC would also bear in mind the importance of imports of carbohydrate products which would compete directly with manioc (House of Lords 1982) Significantly the other cereal subst1tutes of importance were maize-gluten feed and citrus pulp pellets the principal supplier of which was the United States The EEC has not found it possible politically to restrain the imports of these products and during the quota period 1mports of maize gluten feed rose dramatically This s1tuation underscores a basic point about the pol1tical economy of cassava which is that cassava s vested interests have always lain with the economically powerless
Before the end of 1986 the EEC and the pr1ncipal cassava exporters i e Thailand had to come to terms on a new agreement or return to the situation prevailing before 1982 By late 1986 Tha1land and the EEC had both ratified a new agreement on export controls of cassava The agreement covers four years from 1986 through 1989 and specifies a maximum export volume of 21 million tons over the per1od Th1s amounts to S 2S mill1on tons a year some 1mprovement on the 4 S million ton quota of 198S-86 However exports to Portugal and Spain as well would now come under the agreement Some minor flex1b1l1ty was allowed in distributing the quota from year to year as Thailand could export up to S S mill1on tons 1n any single year This pattern of periodic deliberation and renewal of a new agreement on export restraint will most l1kely continue to be the pattern of EEC-Thailand trade in cassava
Demand for Cassava in the EEC With the voluntary export restraints in place since 1982 estimation of import demand for cassava is something of a moot point at least as far as total quantity imported by the EEC 1s concerned However price and the distribution of those imports within the EEC does have an effect on the profits to be earned by the Thai cassava 1ndustry and the comparative cost of animal feed across EEC countr1es How pr1ces for cassava are determ1ned thus is of key importance to Thailand espec1ally in its management of the restra1nts on exports to the EEC
The feed 1ndustry 1n Europe is highly compet1t1ve and factor1es base their purchas1ng decis1ons on least-cost feed formulation models In general cassava w1ll enter into swine rations f1rst that is at higher cassava prices than its entry into poultry rat1ons A large feed manufacturer in the Netherlands in 198S maintained a 40/ maximum 1ncorporation level for swine rat±-on.s and a 2S/ inclusion maximum for poultry rations McK1nzie et al (1986) c1te maximum inclusion levels of 35k 1n swine rations and 20/ for poultry rat1ons for Dutch feed manufacturers in 1980 W1th1n any individual country cassava demand 1s a
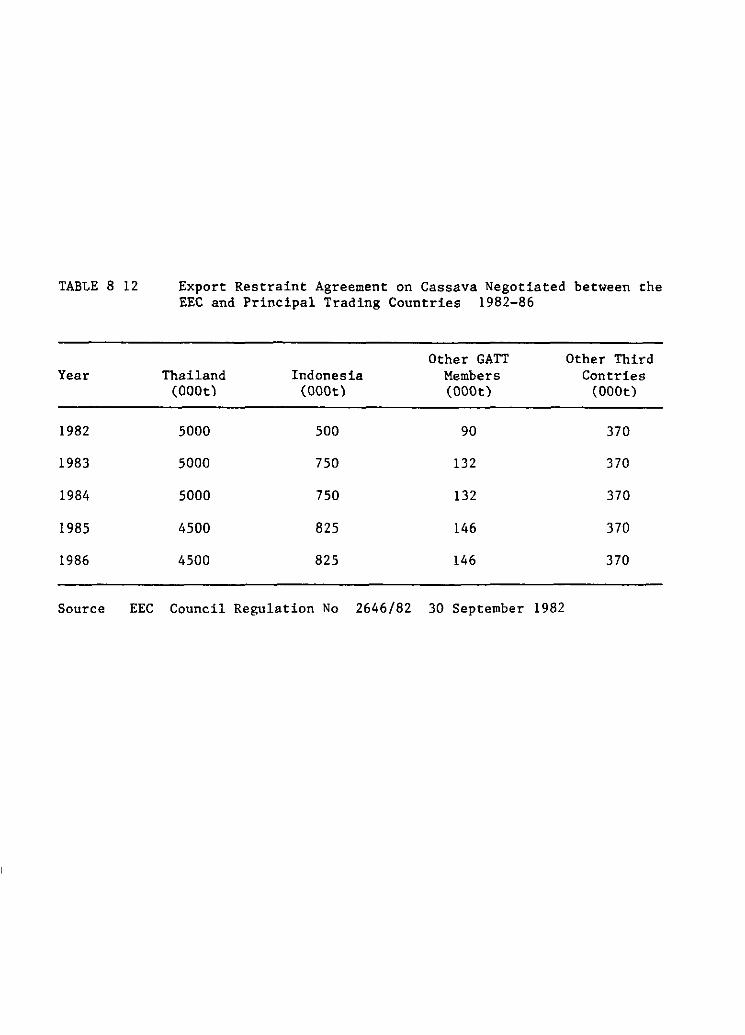
TABLE 8 12
Year
1982
1983
1984
1985
1986
Source EEC
Export Restraint Agreement on Cassava Negotiated between the EEC and Principal Trading Countries 1982-86
Other GATT Other Third Thailand Indonesia Members Con tries
(OOOt) (OOOt) (OOOt) (OOOt)
5000 500 90 370
5000 750 132 370
5000 750 132 370
4500 825 146 370
4500 825 146 370
Council Regulation No 2646/82 30 September 1982
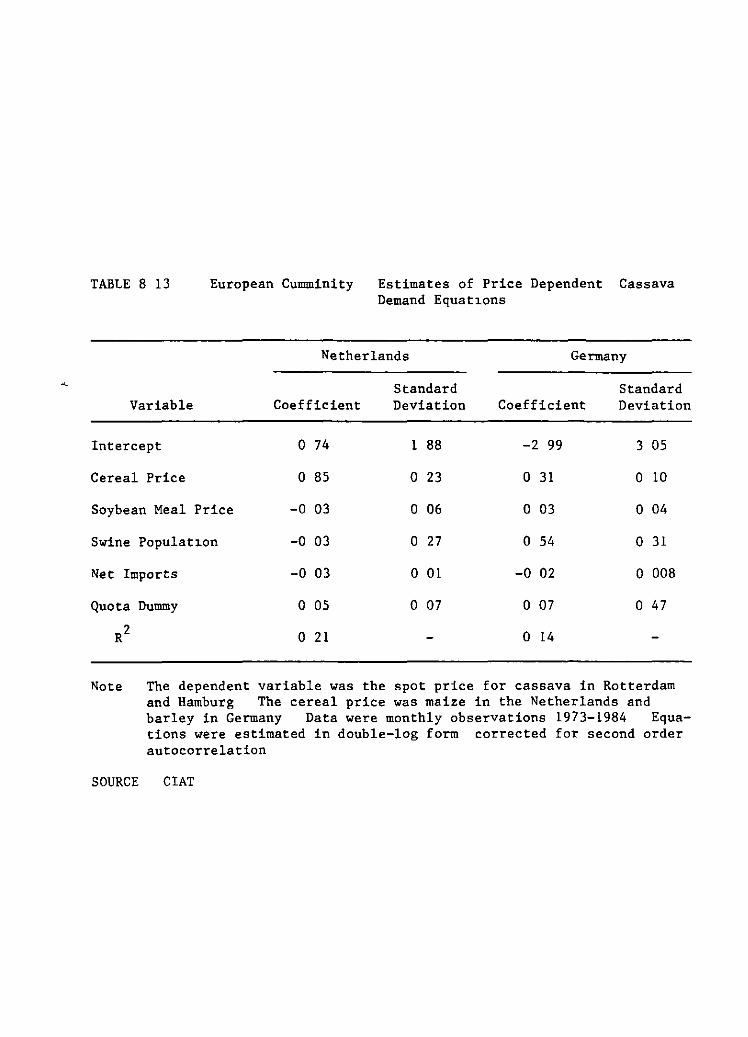
TABLE 8 13 European Cumminity Estimates of Price Dependent Cassava Demand Equat~ons
Netherlands Germany
Variable
Intercept
Cereal Price
Soybean Meal Price
Swine Populat~on
Net Imports
Quota Dummy
R2
Coefficient
o 74
o 85
-o o3
-o o3
-0 03
o 05
o 21
Standard Deviation
1 88
o 23
o 06
o 27
o 01
o 07
Standard Coefficient Deviation
-2 99 3 05
o 31 o 10
o 03 o 04
o 54 o 31
-0 02 o 008
o 07 o 47
o 14
Note The dependent variable was the spot price for cassava in Rotterdam and Hamburg The cereal price was maize in the Netherlands and barley in Germany Data were monthly observations 1973-1984 Equations were estimated in double-log form corrected for second order autocorrelation
SOURCE CIAT
VIII - 13 -
step function operating between the price when it first enters the swine rat~on to that price at which cassava reaches max~mum incorporation levels in all rations Because interna! grain prices vary between countries cassava will be utüized fust in those countries with relatively high grain prices As Nelson (1983) points out cassava demand will be relatively elast~c ~n these countries between the price at which it first entera the ration and the maximum incorporation rate For additional imports demand becomes leas elastic as the cost of transporting cassava from the port increases and it must compete in reg~ons where feed-grain prices have been lowered by green rates
The import demand function for cassava is fraught with diff~culties in specification G~ven a short enough time period so that supply cannot respond demand theory would suggest a price dependent funct~on Moreover since grain prices vary between countries a market clearing price for cassava will be defined ~n each of the major importing countries with some potencial for arbitrage between ne~ghboring countries Using monthly data price dependent import demand funct~ons were estimated for the Netherlands and Western Germany with the interna! cassava price being a function of the market pr~ce for the dominant feedgrain net imports of cassava the soybean meal price and the swine population
The results of this estimat~on (Table 8 13) show that cassava prices respond to changes in feedgrain prices As would be expected cassava prices are more responsive to changes in maize prices in the Netherlands the main importer than to barley prices in Germany However although cassava importa have a significant and negative effect on cassava prices in both countries the size of the coefficient ~s remarkably close to zero suggesting very little elastic~ty in the market This result is counterintu~tive g~ven the rapid rate of growth in cassava ~mports and the ease of subst~tution ~n feed components McKinz~e et al (1986) estimate a demand elastic~ty for cassava in the Netherlands of -2 4 using transformed solutions of least-cost feed models It ~s therefore worthwhile to analyze more closely the mechanisms surrounding price formation of cassava
Cassava pr~ces are quoted in Europe in Deutsch marks on an fob Rotterdam basis which ~s distinct from the cif Rotterdam quotes for other commodities such as soybean meal The difference is the point at wh~ch the buyer takes ownership of the commodity In the case of soybean meal ~t ~s
purchased on the Chicago Board of Trade and the feed manufacturer pays the freight and insurance at the unloading point ~o Rotterdam In the case of cassava he buys on a customs cleared basis from the shipper in Rotterdam The sh~pper pays the fre~ght and ~nsurance d~scharge costs and customs duties The sh~pper has ownersh~p of the cassava till discharge in Rotterdam while ~n the case of soybean meal he does not prov~d~ng only freight services
The reason feed manufacturera have gene to th~s system was essentially the uncerta~nty of quality and customs clearance At one stage Tha~ pelleters were introducing r~ce hulls wh~ch under EC tariff rules would be class~f~ed as a compound feed dutiable at a very h~gh tar~ff Under the current system the shipper guarantees the quality and the price and the
VIII - 14 -
buyer assumes no risks However this system potentially reduces the efficiency of pr1ce transmission between the two markets
Th1s last point is reflected in the determination of a market pr1ce for cassava in Europe Most buyers purchase cassava on forward contracta so that continuity of supplies is guaranteed and storage costs are kept to a minimum In general cassava is contracted between 2 to 6 months forward Thus approximately 90% of each shipment from Thailand has already been contracted Only a small percentage is sold on a spot market or at the so-called afloat price the price normally quoted from trade sources Moreover the afloat price generally reflecta speculators in the market who have not yet covered their contracta and is therefore more variable than the forward price
The market price for cassava is therefore a negotiated forward pr1ce between shipper and feed concentrate manufacturer and this price 1s often not quoted The shippers can negotiate on the basis of known production costs for pelleta in Thailand known handling and freight cost -- in 1985 $4/t for loading $9/t for freight and insurance and $5/t for discharge -and the tariff while the buyers w1ll negotiate on the basis of thc shadow price of cassava in their feed cost models and their sense of the cassava price 1n Thailand and Europe
The analysis of price transm1ssion between Thailand and Europe (see Chapter VII) suggested that forward prices in Europe were much better correlated with Thai prices than afloat prices and that prices were transm1tted instantaneously with some residual tendency for prices in Thailand to lead those in Europe befare the quota and those in Europe to lead Thailand after the quota The forward contracting and the nature of price transm1ssion suggests that the cassava price is given exogenously --1n the context of a monthly import demand equat1on--and thus the endogenous var1able in the demand function should be cassava importa
An import demand equation was thus estimated using net cassava importa as the dependent var1able Since this is an amount which is forward contracted traders have suggested that an average period is about three months and so imports were lagged three months Lagged importa were then made a function of the forward price for delivery in three months current swine stocks current soybean meal prices and the grain threshold pr1ce three months forward S1nce grain prices are fixed on a monthly basis befare the crop year the threshold price is the best est1mate of the future gra1n pr1ce Because a f1xed amount of cassava must be allocated among the var1ous countries the equat1ons were estimated us1ng Zellner s seem1ngly unrelated regress1on techn1que
The results (Table 8 14) are s1gnif1cantly better than the prev1ous spec1f1cation The d1rect import elasticity is relatively elast1c although lower for the Netherlands than for Germany This 1s expected 1n a country where cassava imports already are 30% of the combined production of pig and poultry feeds and moving additional amounts involves more radical pr1ce changes Conversely cassava importa 1n the Netherlands respond much more strongly to changes in grain prices than 1n Germany In German.y a large part of the concentrate and an1mal industry is 1n the South and cassava use 1n rations 1n this part of the country 1s moderated by the
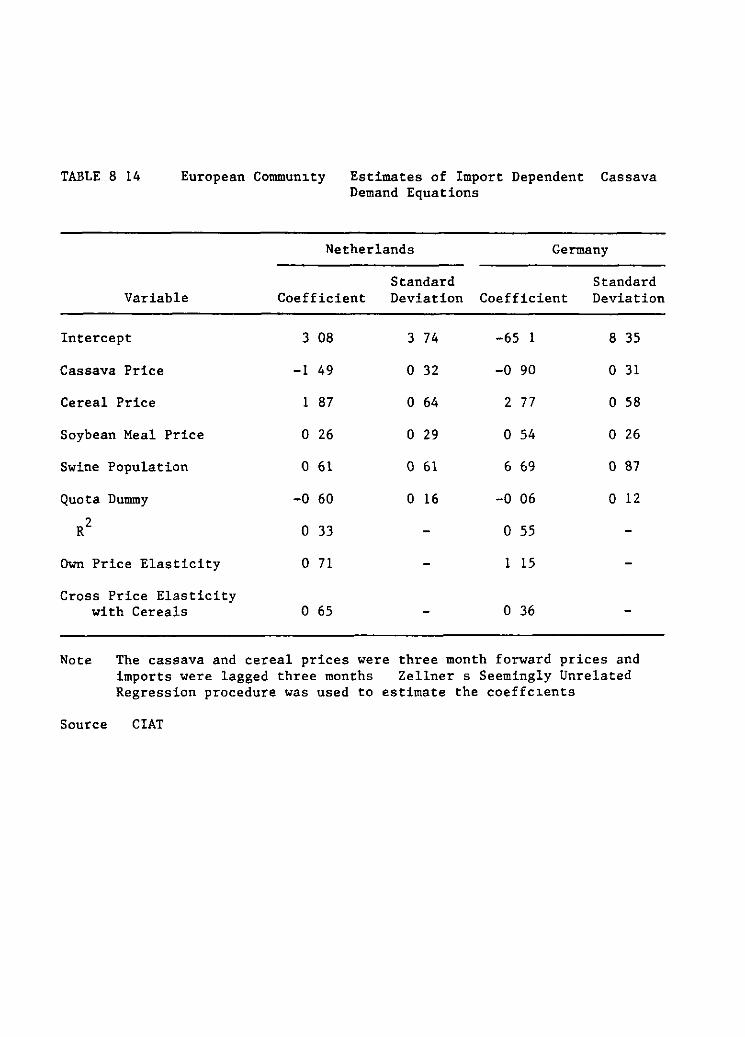
TABLE 8 14 European CommunLty Estimates of Import Dependent Cassava Demand Equations
Netherlands Germany
Standard Standard Variable Coefficient Deviation Coefficient Deviation
Intercept 3 08 3 74 -65 1 8 35
Cassava Price -1 49 o 32 -0 90 o 31
Cereal Price 1 87 o 64 2 77 o 58
Soybean Meal Price o 26 o 29 o 54 o 26
Swine Population o 61 o 61 6 69 o 87
Quota Dummy -o 60 o 16 -o o6 o 12
R2 o 33 o 55
Own Price Elasticity o 71 1 15
Cross Price Elasticity with Cereals o 65 o 36
Note The cassava and cereal prices were three month forward prices and imports were lagged three months Zellner s Seemingly Unrelated Regression procedure was used to estimate the coeffcLents
Source CIAT
VIII - 15 -
transport costs from port areas Grain prices have te move more radically te get the same response in demand for cassava imports Finally the quota is principally affecting cassava use in the Netherlands where cassava imports have declined other things being equal te what they were prior te the quota Why Netherlands should be worse affected than Germany by the quota is not clear and in the end is counterintuit~ve However this result may be short term in nature since in 1985 the Netherlands recovered in import volume what it lost ~n 1983 and 1984 This result may therefore reflect forward contract committments at the time of ~mplementation of the quota
The soybean meal coeffic~ent remains someth~ng of an anomally since it suggests that cassava and oilseed meals are substitutes particularly ~n Germany where the coefficient is significant Misspecification is possible since the current price rather than the future price was used a future price in Europe was not available Nevertheless Nelson (1983) in his model of EEC import demand did not get a significant coeff~cient for soybean meal either though the sign suggested complementarity McKinzie et al (1986) work~ng with least cost feed models in the Netherlands find a complementary relat~onship between cassava and oilseed meals Nevertheless even using such a robust technique the cross-price elast~city estimated is only -0 3 i e there is a response of cassava use te changes ~n o~lseed meal prices but it is not large In Germany oilseed meals make up 30 te 40% of feed concentrates Because oilseed meals are often sim~larly priced te gra~ns they enter as a calorie as well as a protein source Changes in oilseed meal prices would thus have little influence en cassava use since the protein restrictions in the least cost models are already more than met
The effects of the quota thus have been (1) te reduce the efficiency of price transm~ss~on between Europe and Tha1land wh~le sh1ft~ng cassava price format1on essent~ally te demand-side factors in Europe (2) te w~den the margins between Europe and Thailand a factor wh1ch Tha1land 1s us~ng te open third-country markets and (3) te reallocate cassava 1mports between countries On the latter point Spain and Portugal s entry 1nto the EEC the suggested elimination of green rates and MCA s and the environmental constra~nts being placed en expansion of livestock enterprises in northern Europe all suggest potent~al for shifting the locus of growth in animal production te these two countries 1f based en tqe ability te eff1ciently 1mport feed componente wh~ch do not come under the variable levy Given gra~n shortfalls in both these countries r1s~ng gra1n prices as the grain sector comes under CAP pr~ces some exper~ence
w1th importing cassava ~n 1984 and 1985 and the proJected 1mprovement in port fac~l1t1es cond~tions seem appropriate for such a restructur~ng
Moreover the quota en cassava imports will probably have little ~mpact en increased grain use Hillberg (1986) developed a simulation model of the West German feed sector and found only gradual substitution of grains for cassava ~n swine and poultry rat~ons ~n northern Germany However the quota also led to higher feed prices a decreased demand for feed concentrates and 1n consequence the ~mpact of changes 1n ratJ.on compos~t~on favor~ng gra~ns was dampened by the accompany~ng higher hnished ratJ.on costs (Hillberg 1986) Moreover as McKJ.nzie et al (1986) find the high cross-pnce elasticities suggest that a spec1hc commodity ~mport restriction would substantially reduce that commodüy s
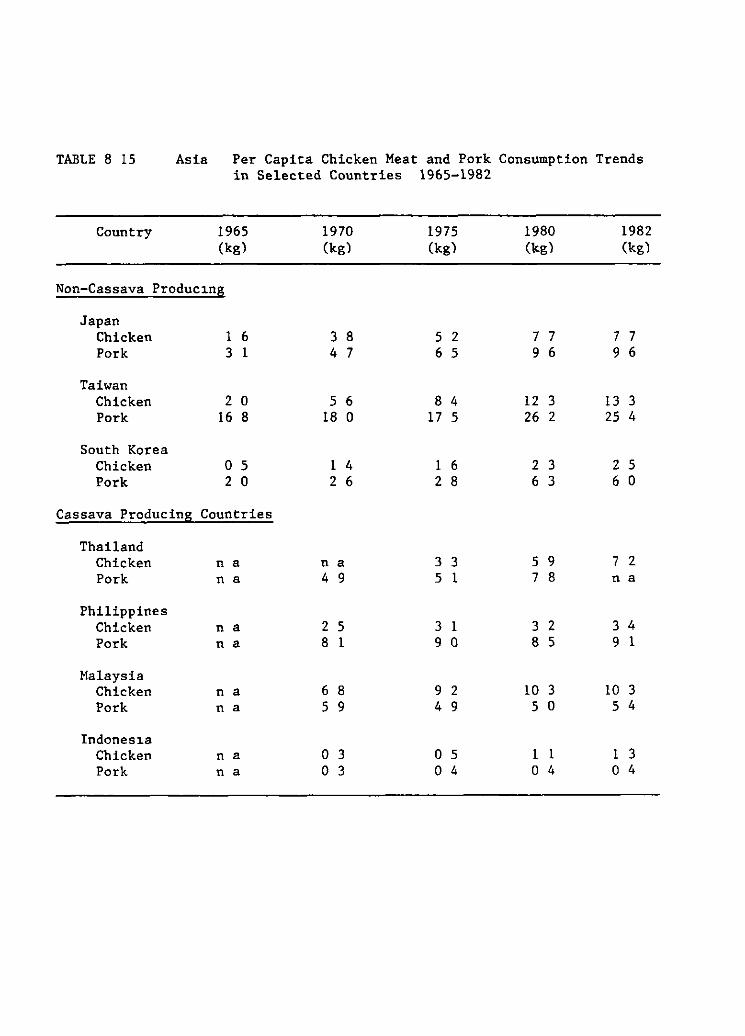
TABLE 8 1S Asia Per Capita Chicken Meat and Pork Consumption Trends in Selected Countries 196S-1982
Country 196S 1970 197S 1980 1982 (kg) (kg) (kg) (kg) (kg)
Non-Cassava Produc1ng
Japan Chicken 1 6 3 8 S 2 7 7 7 7 Por k 3 1 4 7 6 S 9 6 9 6
Taiwan Chicken 2 o S 6 8 4 12 3 13 3 Por k 16 8 18 o 17 S 26 2 25 4
South Korea Chicken O S 1 4 1 6 2 3 2 S Por k 2 o 2 6 2 8 6 3 6 o
Cassava Producing Countries
Thailand Chicken na n a 3 3 5 9 7 2 Por k n a 4 9 5 1 7 8 na
Philippines Chicken n a 2 S 3 1 3 2 3 4 Por k na 8 1 9 o 8 S 9 1
Malaysia Chicken n a 6 8 9 2 10 3 10 3 Por k na 5 9 4 9 S O S 4
Indones1a Chicken n a o 3 o 5 1 1 1 3 Por k n a o 3 o 4 o 4 o 4
VIII - 16 -
useage but that use of other non-grain imports could be expected to r~se greatly Such appears to be the case with corn gluten feed imports from the United States (Siamwalla 1986)
The world market for cassava feedstuffs is something of the reverse of that for cassava starch In the case of feedstuffs tariff and price policies in Europe have created a large market insulated from world trade conditions in feedgrains Since the market is politically defined (though almost every agricultura! market has its political dimension) cassava s impingement on other EEC objectives has resultad in restraints on future growth of EEC imports The European market is nevertheless providing the base for the restructuring of trade in cassava pellets and to understand this process requires some analysis of the feed and livestock sector in East Asia
The Asian Regional Market for Cassava Feedstuffs
Do cassava feedstuffs have a wider international market than just the European Communüy 1 Trade and price pol~cies as ~n all trade matters dealing with cassava hold the key to the answer The issue is be~ng
forced by the EC ~tself through its imposition of ~port quotas which in turn has caused Tha~land to devise mechanisms to open third country markets The solution mim~cs the EEC s export subsidies with one big difference the European consumar rather than the EEC budget is in effect subsid~zing Thai exports to non-EC countries Th~s is irony of a high arder that the EEC should be subsidizing Thai cassava exports to th~rd
countr~es This outcome is to the international grain trade what epicycles were to Ptolemaic astronomy a further complication to produce a workeable system but where the central thesis of that system is faulty For cassava what it achieves is time to develop a more rational system and the bulwark of such a system will ~nevitably be the Asian market for feedstuffs which is currently dominated by imports of U S coarse gra~ns
Food consumption patterns ~n East and Southeast As~a are changing rapidly The causes for these changes arise as much from the supply s~de
-- techn~cal change in food production and processing improved foreign exchange ava~labil~t~es allowing an ~ncrease in and diversif~cation of food ~mports and improvements in marketing -- as from the demand side -increasing per capita incomes urbanization declining influence of religious prohibitions on certain foods and changing relative prices Chang~ng food consumption patterns are thus set with~n an evolv~ng econom~c system wh~ch reflects fundamental structural change and basic shifts ~n
food process~ng market~ng home preparation methods and purchas~ng
patterns as the populat~on shifts from rural to urban residence
The most fundamental sh~ft in food consumpt~on patterns ~n As~a has been the rapid ~ncrease ~n the consumption of l~vestock products especially meat (Table 8 15) For example ~n Japan ~n the two decades spanning the period 1960 to 1980 per cap~ta consumpt~on of beef grew at an annual rate of S 6/ pork at a rate of 11 1/ and ch~cken at a susta~ned
rate of 16 71 Even after such h~gh rates of growth per ca pita meat consumpt~on in Japan is st~ll only about a quarter of levels in the United States This h~ghl~ghts the f~rst salient feature of meat consumpt~on
patterns ~n Asia that growth ~n consumpt~on has started from a very small
VIII - 17 -
base since for most countries no more than S O kg of meat per person was consumed in the early 1960 s Only the Philippines and Taiwan would appear to have had a higher consumption base due essentially to the larger role of swine in farming systems and rural consumption patterns Pigs also were important in large parts of China Swine have played a differential role across As1an countries in defining meat consumption patterns partly because of religious restrictions such as Moslem taboos in Malaysia and Indonesia and Buddhist prejudices in Tha1land and Japan and partly because of feed availability on farms in swine producing countries usually the root crops sweet potatoes or cassava and rice millings
In the two decades encompassing 1960 to 1980 annual growth in per capita GNP was over 4% in all countries under study here except for the Philippines which grew at 2 8% per year Meat demand is very income elastic in Asia (Table 8 16) and yet income elasticities and income growth do not explain all the growth in per capita meat consumption In Asia income growth has also precipitated d1vers1fication of the diet as reflected 1n the very low per capita consumption figures for meat in the early 1960 s Also income growth is closely related to other bas1c changes 1n the economy that affect food consumption patterns particularly urbanization and the growth of food retailing networks Implicit in migrat1on from a rural to urban setting is a shift in food sources from one based primarily on production to one based on purchases Also conven1ence becomes an important factor in food choice in preparat1on methods and 1n food storage in the home Finally food preferences become more susceptible to advertising and to the diversity found in eating out of the home Therefore implicit in income growth are the basic changes in lifestyle that impinge on food consumption patterns these have had a large impact on the rising demand for meat in Asian countries
Income elast1c1t1es do not vary significantly across the different meats except for the lower estimates for pork in the high consuming countr1es Income growth does not account for the very signif1cant differences in growth rates between the different meats Thus wh1le income expla1ns much of the growth in total meat consumption price 1s the more relevant var1able in analyzing growth rates in individual meats In all meats the own-price elasticity is very h1gh and while cross-price elast1cities are normally s1gn1ficant (Table 8 17) substitution has not yet played a dominant role in meat consumption patterns in Asia as it has for example in Lat1n America Differences in growth rates in consumption of the var1ous meats is due to the different1al trends in real pr1ces of the meats espec1ally the decl1ne in ch1cken and to a certain extent pork prices v1s-a-v1s stabil1ty or increases 1n the pr1ce leve! of beef It is the fundamental effect of pr1ces on meat consumpt1on that makes bas1c cost changes on the supply side so 1mportant
Japan has the longest history in the modern1zation of 1ts feed and l1vestock industry and thus in many respects will presage the future developments in the livestock industry of many As1an countr1es The dom1nant factor in the expansion of the l1vestock sector 1n Japan was technical change This 1s shown in Table 8 18 which shows rap1d expans1on 1n meat production of ch1cken and pork even though product pr1ces were decl1n1ng relat1ve to feed prices This relationship is the more impress1ve considering that feed makes up 35/ of pork product1on costs and about two th1rds of chicken production costs (Coyle 1983) Three
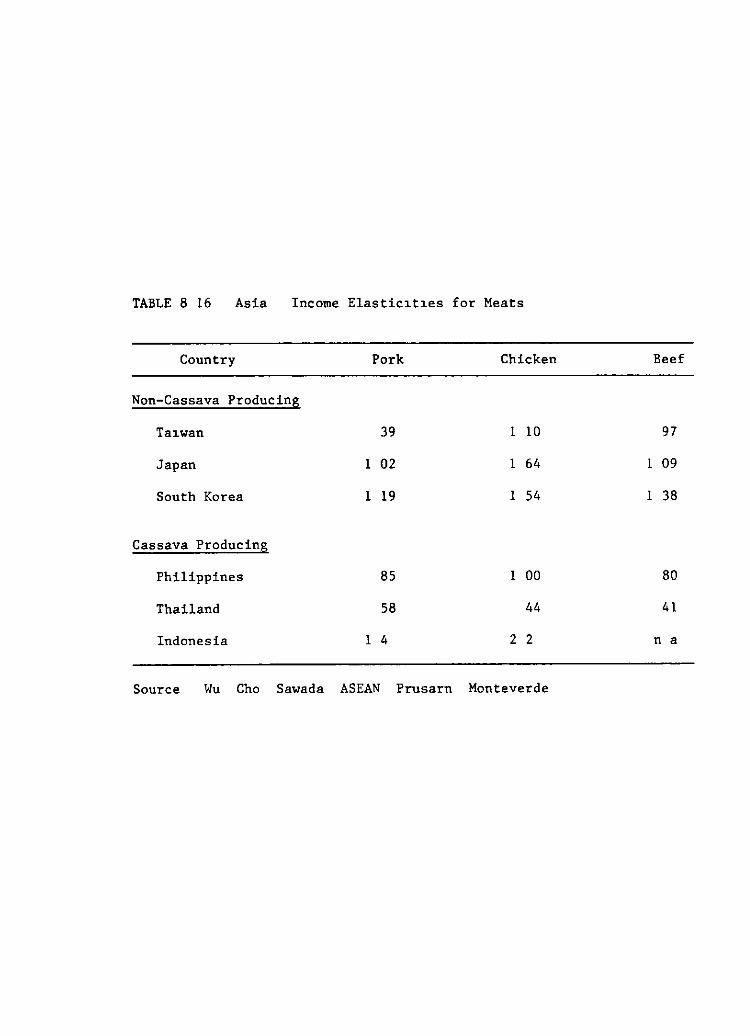
TABLE 8 16 Asia Income Elastic~t~es for Meats
Country Por k Chicken Beef
Non-Cassava Producing
Ta~wan 39 1 10 97
Japan 1 02 1 64 1 09
South Korea 1 19 1 54 1 38
Cassava Producing
Philippines 85 1 00 80
Thailand 58 44 41
Indonesia 1 4 2 2 n a
Source Wu Cho Sawada ASEAN Prusarn Monteverde
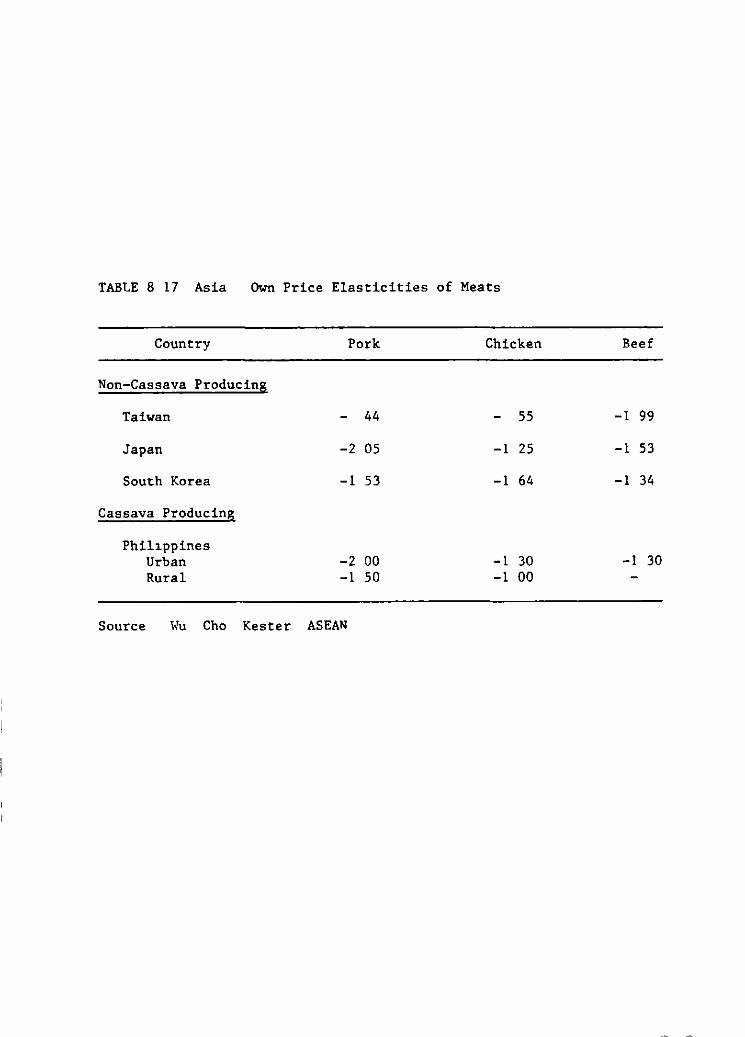
TABLE 8 17 Asia Own Price Elasticities of Meats
Country Por k Chicken Beef
Non-Cassava Producing
Taiwan 44 55 -1 99
Japan -2 os -1 25 -1 53
South Korea -1 53 -1 64 -1 34
Cassava Producing
Phill.ppines Urban -2 00 -1 30 -1 30 Rural -1 50 -1 00
Source Hu Cho Kester ASEAN
important efficiency
VIII - 18 -
changes account for these rapid Lncreases Ln production changes that are now occurring in other Asian countries
FLrst structural change in lLvestock production has been rapid Production has moved from small units on farms to specialLzed large-scale enterprises In Japan this process has been partLC'Illarly impressive in both swLne and broiler production (Table 8 19) Structural change Ln livestock production has not implied a gradual increase in animal populations on farms but a rapid shift away from farm units to specialized production units In the procesa the number of producers declined rapidly In Japan the number of SWLne producers declLned from 800 thousand in 1960 to 156 thousand in 1979 (Coyle 1983) StatistLcs on total anLmal populations usually mask quite marked shifts in sources of productLon Thus in dLsaggregating the statLstics for Thailand for poultry (Table 7 25) while growth in the total population has been moderate the Lncrease in large-scale commercial operations has been very rapid and on-farm populations have declined
ThLs search for scale economice through structural change has characterized the pork and poultry sectors of all the countries under study here except Indonesia and China In ChLna the very rapid rise in pork production and consumptLon since the political changes of the late 1970 s has been due to shifts of productLon from collectLves to individual households and intensification of production through the improved availability of grains (Sicular 1985) In IndonesLa on the other hand Lncome distributional obJ ectives have been translated into a 1983 polLcy which hmits the size of poultry operations to a thousand layers and 750 broLlers (see World Bank 1984 for a more extensive discussion of the pohcy) This policy may limit the price declines in poultry that have come Ln other countries and therefore the expansion in consumption On the other hand since the population is still overwhelmingly rural the polLcy may Ln fact lead to decentralization of production away from urban areas and increased rural consumption as is occurring with pork Ln ChLna The feed companies appear willing to respond by developing rural feed dLstrLbution channels Indonesia and China may offer an alternatLve livestock development strategy oriented towards rural consumptLon However eventually when the policy turns toward urban consumption the development of large-scale poultry and swine units wLll be essential to cost and price reductLons for urban consumera
The second important change Ln livestock systems in AsLa is the shLft to balanced feeds as the principal source of anLmal nutrition The Lmpact of thLs on production efficLency has come through improved animal nutrLtLon whLch has allowed quLcker weight gaLns usually hLgher slaughter weLght and improved reproductive capacity Whether balanced feed is cheaper than on-farm feed sources LS questLonable especially for swine ~ince feedstuffs wLth relatively low opportunity costs are used ~hxed
feeds however allow balanced nutrition especLally for proteLn requLrements and expand the availability of feed sources which are usually constraLned at the farm-level Development of a mLxed feed industry has been especially critical in the growth of the poultry industry
Development of a mLxed feed industry usually leads the structural change Ln lLvestock production with the Lnitial linkages generally beLng
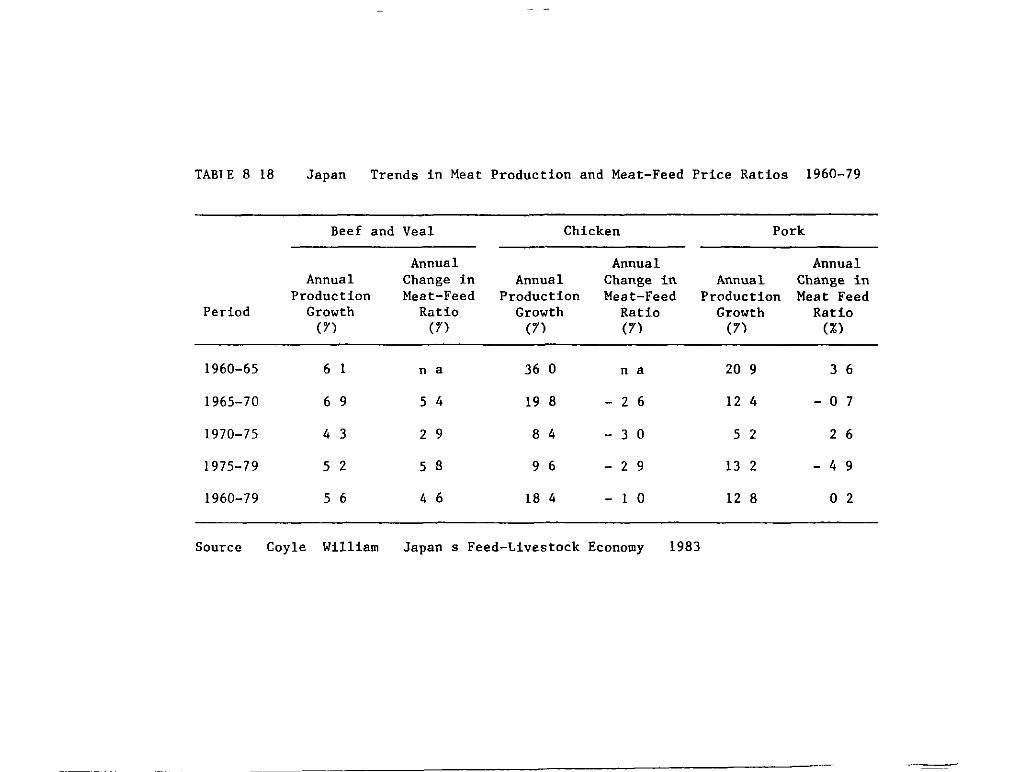
TABT E 8 18 Japan Trends in Meat Production and Meat-Feed Price Ratios 1960-79
Beef and Veal Chicken Por k
Annual Annual Annual Annual Change in Annual Change in Annual Change in
Production Meat-Feed Production Meat-Feed Production Meat Feed Period Growth Ratio Growth Ratio Growth Ratio
(7) (7) (7) (7) (7) (%)
1960-65 6 1 n a 36 o n a 20 9 3 6
1965-70 6 9 5 4 19 8 - 2 6 12 4 - o 7
1970-75 4 3 2 9 8 4 - 3 o 5 2 2 6
1975-79 5 2 5 8 9 6 - 2 9 13 2 - 4 9
1960-79 5 6 4 6 18 4 - 1 o 12 8 o 2
Source Coy le William Japan s Feed-Livestock Economy 1983
VIII - 19 -
made with the poultry sector Growth in compound feed manufacture has been very rapid in East and Southeast Asia in the last one to two decades Most countries have managed annual growth rates of well over 10/ with Japan maintaining a 9 9-' annual rate of growth over a period of 22 years from 1960 to 1982 (Table 8 20) Growth can be remarkably rap1d in the early stages in the establishment of the industry Thus in the 1960 s Japan s compound feed industry grew at annual rate of 17% comparable to the growth of South Korea's industry in the 1970 s of 18-' but well below the remarkable growth in Thailand of 30% per annum through the course of the 1970 S
There is a chicken or egg quest1on in the gestation of a compound feed 1ndustry In most cases the establishment of the industry 1s based on the development of commercial poultry enterpr1ses with the two often vertically linked in the initial phases The feed industry often assumes the in1tiative in the development of its market If developments in the industry follow the example of Japan then eventually divestment of the poultry enterprises takes place and divers1ficat1on occurs with a significant rise in sw1ne feed and dairy feed product1on However s1gnif1cant difference9 will be expected to occur across countries in the development of the latter two industries because of Moslem proh1b1t1ons of pork consumption 1n Malaysia and Indonesia and lactose ind1gestability 1n many Asian populations In Asia more so than any other cont1nent the development of the livestock industry is and will be based on either the purchase of mixed feeds by l1vestock producers or the purchase of the feed ingred1ents by the livestock producers to mix their own feeds Expansion of the livestock 1ndustry in As1a w1ll not be based on an integrated farm system in which own production of feed components is l1nked to l1vestock production
The third element respons1ble for rapid technical change in the livestock sector 1s the improved feed conversion rates in the an1mal populat1on This is due to both more efficient animal breeds and improvements 1n management espec1ally in animal health A particular trend in sw1ne production is the movement away from breeds with a high fat carcass to those with a much higher percentage of lean meat However aggregate feed convers1on rates only part1ally reflect th1s improvement since they as well incorporate the movement away from on-farm feed resources -- that is tho9e feed components which do not usually figure in data on feed availability -- to compound feeds (Table 8 21) Aggregate feed conversion rates thus first increase and then decline when the conversion by livestock producers to compound feed has stabilized Comparison of these aggregate rates across countries will not different1ate between improvements 1n the efficiency of feed conver9ion and the degree of penetration of compound feeds in the livestock sector What the l1m1ted data in Table 8 21 indicate is that aggregate feed conversion rates are still r1sing in all countries but Japan that 19 the changes 1n the production structure of an1mal product1on 19 st1ll the dom1nate 1nfluence
R1sing demand for livestock products and the structural change in livestock production have created a very rap1d increase 1n the 00r1ved demand for feedstuffs espec1ally carbohydrate sources The response to this situat1on 1n all cases but Thailand has been to increase 1mports of feed gra1ns In the non-cassava and non-maize producing countries the growth in feed grain imports has been very rapid 1ndeed In 1960 Japan
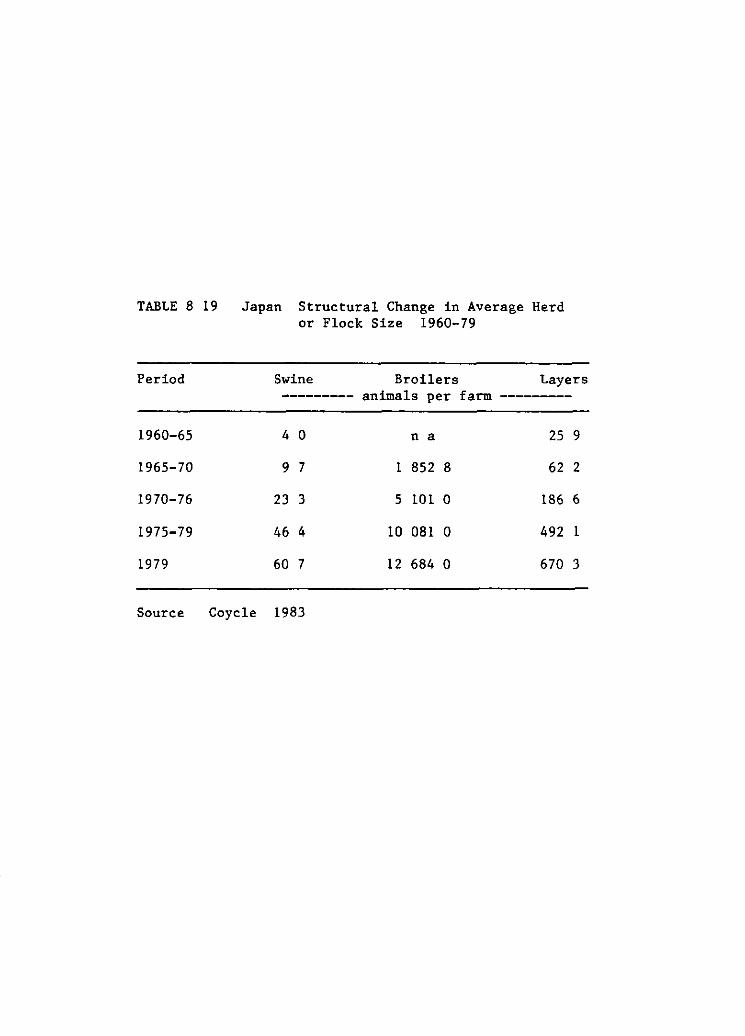
TABLE 8 19 Japan Structural Change in Average Herd or Flock Size 1960-79
Period Swine Broilers Layers
--------- animals per farm ---------
1960-65 4 o n a 25 9
1965-70 9 7 1 852 8 62 2
1970-76 23 3 S 101 o 186 6
1975-79 46 4 10 081 o 492 1
1979 60 7 12 684 o 670 3
Source Coycle 1983
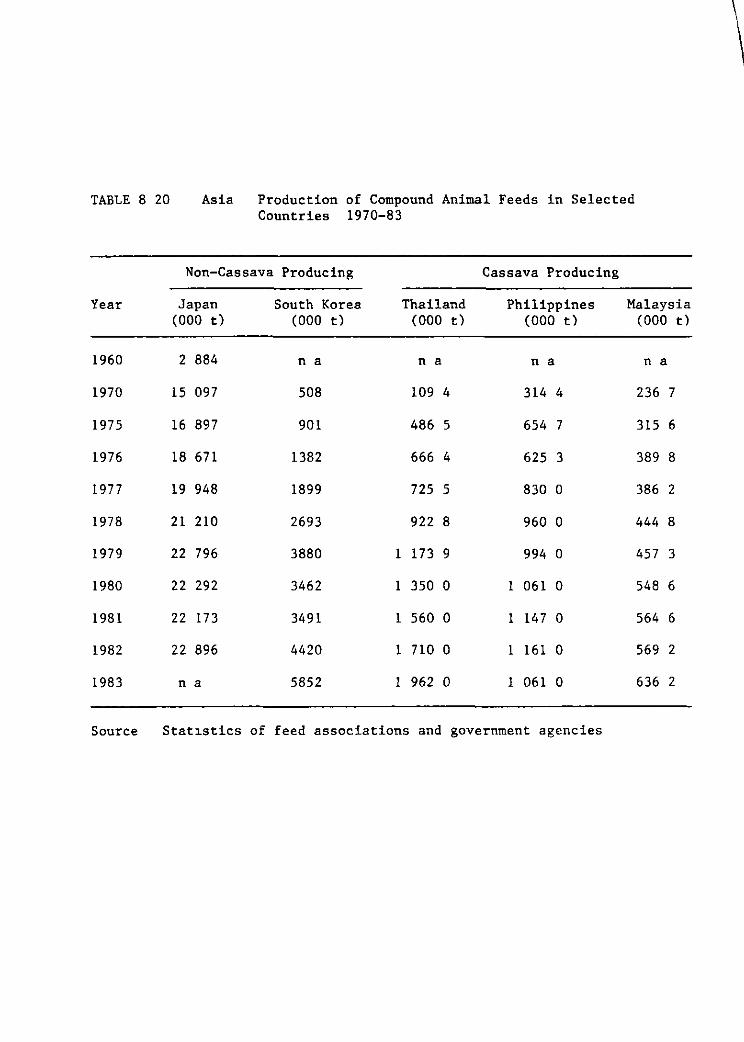
TABLE 8 20 Asia Production of Compound Animal Feeds in Selected Countries 1970-83
Non-Cassava Producing Cassava Producing
Year Japan South Korea Thailand Philippines Malaysia (000 t) (000 t) (000 t) (000 t) (000 t)
1960 2 884 n a n a n a n a
1970 15 097 508 109 4 314 4 236 7
1975 16 897 901 486 5 654 7 315 6
1976 18 671 1382 666 4 625 3 389 8
1977 19 948 1899 725 5 830 o 386 2
1978 21 210 2693 922 8 960 o 444 8
1979 22 796 3880 1 173 9 994 o 457 3
1980 22 292 3462 1 350 o 1 061 o 548 6
1981 22 173 3491 1 560 o 1 147 o 564 6
1982 22 896 4420 1 710 o 1 161 o 569 2
1983 n a 5852 1 962 o 1 061 o 636 2
Source Stat~stics of feed associations and government agencies
\
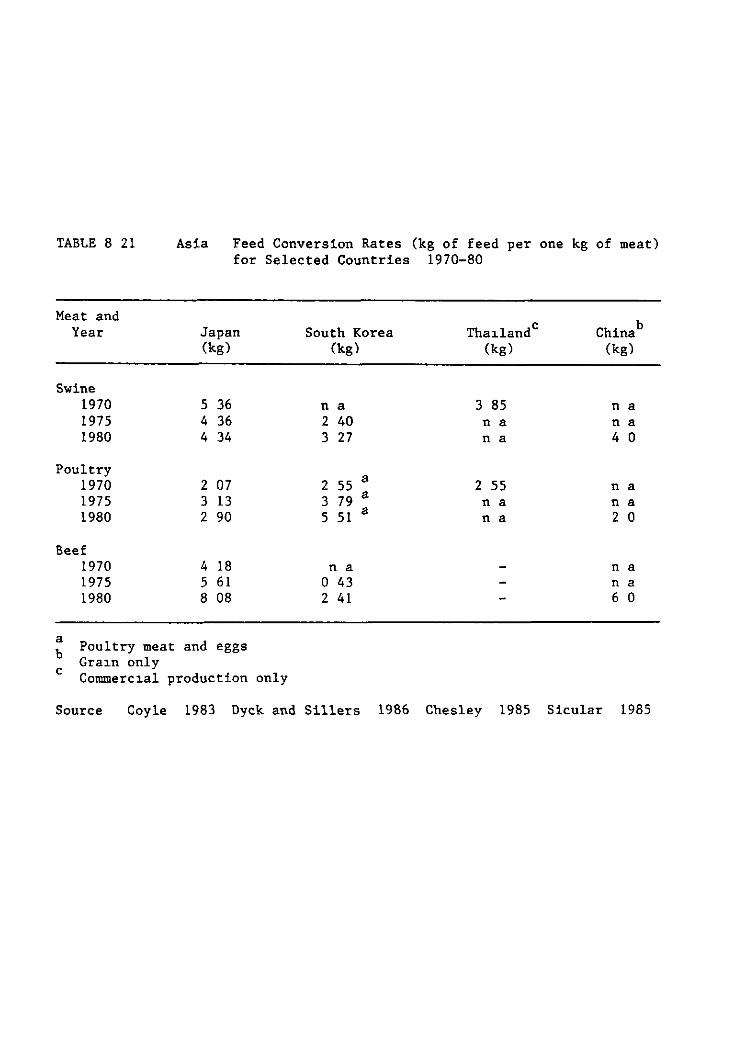
TABLE 8 21 Asia Feed Conversion Rates (kg of feed per one kg of meat) for Seleeted Countries 1970-80
Meat and b Year Japan South Korea e China Tha~land
(kg) (kg) (kg) (kg)
Swine 1970 5 36 n a 3 85 na 1975 4 36 2 40 n a na 1980 4 34 3 27 n a 4 o
Poultry a 1970 2 07 2 55 2 55 na
1975 3 13 3 79 a n a na 1980 2 90 5 51 a 2 o n a
Beef 1970 4 18 n a n a 1975 5 61 o 43 na 1980 8 08 2 41 6 o
a Poultry meat and eggs b
Gra~n only e Commere~al produetion only
Souree Coy le 1983 Dyek and Sillers 1986 Ches ley 1985 Sieular 1985
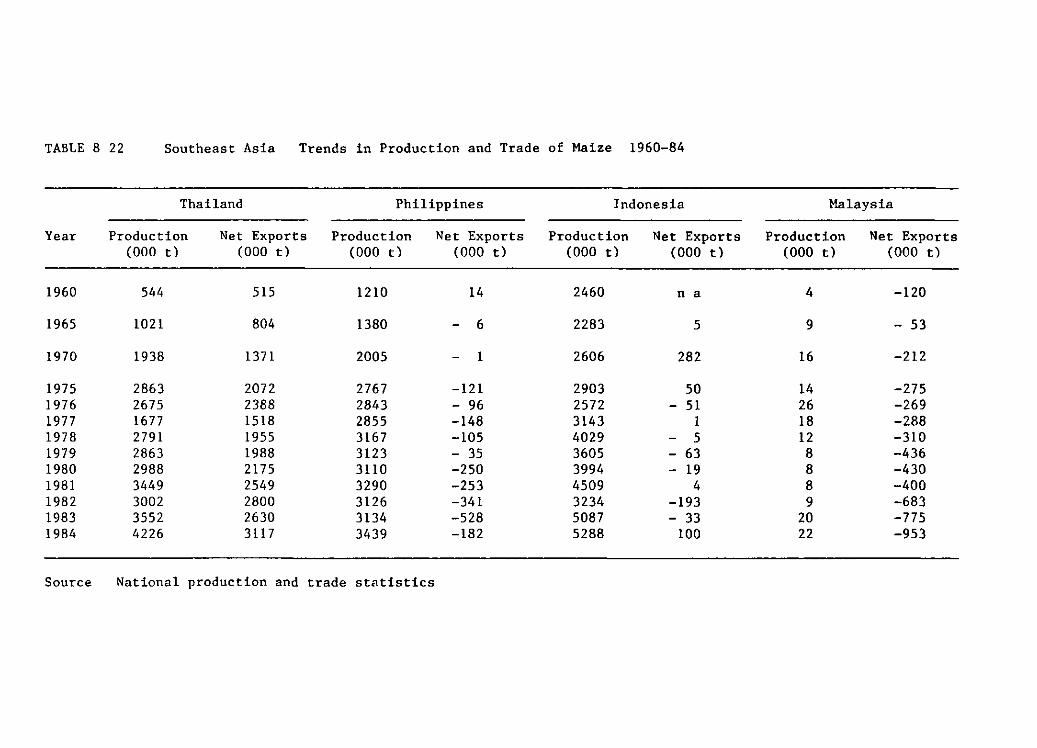
TABLE 8 22 Southeast Asia Trends in Production and Trade of Maize 1960-84
Thailand Philippines Indonesia Malaysia
Year Production Net Exporta Production Net Exports Production Net Exporta Production Net Exporta (000 t) (000 t) (000 tl (000 t) (000 tl (000 tl (000 tl (000 t)
1960 544 515 1210 14 2460 n a 4 -120
1965 1021 804 1380 - 6 2283 S 9 - 53
1970 1938 1371 2005 - l 2606 282 16 -212
1975 2863 2072 2767 -121 2903 so 14 -275 1976 2675 2388 2843 - 96 2572 - 51 26 -269 1977 1677 1518 2855 -148 3143 1 18 -288 1978 2791 1955 3167 -105 4029 - S 12 -310 1979 2863 1988 3123 - 35 3605 - 63 8 -436 1980 2988 2175 3110 -250 3994 - 19 8 -430 1981 3449 2549 3290 -253 4509 4 8 -400 1982 3002 2800 3126 -341 3234 -193 9 -683 1983 3552 2630 3134 -528 5087 - 33 20 -775 1984 4226 3117 3439 -182 5288 lOO 22 -953
Source National production and trade statistics
VIII - 20 -
Taiwan and South Korea together imported less than 2 million tons of coarse grains By 1984 the import level for these three countries stood at 27 6 million tons Domestic production of feedstuffs in these countrLes declined during the period especially barley in Japan sweet potatoes and barley Ln South Korea and cassava and sweet potatoes in Taiwan which thereby reinforced the linkage between domestic livestock production and feed grain imports Decline in domestic production of feedstuffs in these countries was due to the demise of integrated livestock-crop farms and the rising costs of farm labor as a result of industrialization and rural-urban migration
In maize-producing countries however development of the livestock sector has been one of the factors stimulating increases in grain production Thus in the Philippines Indonesia Thailand and China feedgrain production has increased significantly (Table 8 22) but this has not been sufficient to keep up with rising demand except in the case of Thailand The Philippines moved from the position of net exporter or mLnor net Lmporter of maize to a maJar net Lmporter in 1971 Indonesia did the some in 1976 and China has significantly increased its imports Ln the last five years Finally Thailand has not been able to increase significantly its maLze exports even through domestic production has increased from 2 3 mLllion tons in 1973 to well over 4 millLon tons in 1984 In all countries feed demand has increased at a much more rapid pace than domestic production of feedstuffs Significant scope therefore exists in the tropLcal countries in Southeast Asia to link increasing interna! demand to production growth in feedstuffs thereby improving farmer income Ln principally upland areas
The rapidly rising demand for carbohydrate sources for the growing animal feedstuff industry in East and Southeast AsLa thus raises a dual potentLal for cassava that LS exports from Thailand to the large import markets in Japan South Korea and Taiwan and increased domestLc utLlizatLon in the cassava producing countries As regards the former the quota placed by the EEC on cassava imports has had the secondary affect of shifting Thai surpluses into principally East AsLan markets The mechanism by which this has been accomplished has to do with Thailand s interna! management of the quota on the one hand and liberalLZation of tariff barriers on cassava for animal feed by the principal importing countries in East Asia
Since the agreement between Thailand and the EEC restrLcting cassava flows to Europe LS a voluntary export restraLnt Thailand had to accept the responsLbLlLty for managLng the quota (as Blyth 1984 has shown voluntary export restraints are the least harmful form of protection from the exporter s view point) SLnce the agreement which covers the period 1982 to 1986 was not sLgned till September of 1982 only Ln 1983 did ThaLland begin to effectively limit cassava exports to the EEC During 1983 the Ministry of Commerce Ln ThaLland adopted an export licensing system and attempted severa! forms of allocatLng the lLcenses First the quota was allocated on a quarterly basLs to exporters based on historical shares in the export busLness Then the quota allocation was shifted to a first-come-firstrserve system where licenses were granted for the quarter upto the point that the quota for the period was exhausted
Finally by the end of 1983 ThaLland had arrived at a workeable system for allocatLon of the export quota StartLng Ln 1984 the year was divided
VIII - 21 -
into seven periods Export allocations in a period were based on the stocks held by exporters such that those holding higher stocks would be given a higher percentage share of the export quota In addition a bonus system was instJ.tuted in which any exports to thJ.rd countries in the prevJ.ous period would allow first priority to export allocation in the next period depending on the size of the third country exports The bonus system was established on a 1 1 basis and the ratio was changed to l 25 l at the end of 1985 that is a one ton quota allocatJ.on for every 1 25 tons exported to third countries However due to the declining stock levels in mid-1986 the bonus ratio was changed back to 1 1 in June of that year The reversal indicates that the Ministry of Commerce recognizes the policy role of the bonus ratio whereby market surpluses can be managed by adjustment in this ratio
The result of this quota allocation system has been the development of a two-tJ.ered price structure at the export point The system has allowed ThaJ.land to appropriate the rents to be accrued in the European market while maintaJ.ning a unJ.fied domestic price structure The divergence in prices at the export point is due to the situation where cassava pr1.ces in Europe are determJ.ned by the grain price set under the Common Agricultura! Policy and those in third countries are set by the world price for feedgraJ.nS As one of the results of the quota has been an increased price spread between Thailand and Europe the Ministry of Commerce has developed J.ts export allocation policy to divert these exporter rents J.n order to finance exports to third countries As export allocations have been as low as 11% of total stock holdings (Figure 8 6) there is signJ.fJ.cant J.ncentive for exporters to guarantee theJ.r access to the European market by utilizing some of these profits to sell in third countries Thailand has thus taken the logical step of stratJ.fying its market
On the import market SJ.de there has been a progressJ.ve liberalJ.zatJ.on of tarJ.ff and quota restrictions on cassava in most markets WJ.th the recognJ.zed shift to dependence on J.mports to meet theJ.r animal feed requirements East Asian countries have progressively liberalized import restrJ.ctions on feed components In general liberalJ.zation of feed graJ.ns especially maJ.ze and sorghum precedes that of cassava In Japan and South Korea this has been due to a vestigial desire to protect domestic sweet potato producers and in Taiwan to protect both sweet potato and cassava producers Nevertheless in 1968 Japan reduced its tariffs on cassava l.mports for feed use to zero In South Korea the lJ.beralization has been much more recent Upto 1984 the general tariff for cassava was 40/ compared to 5% for maJ.ze -- cassava chips for alcohol manufacture were imported at a lower duty under a quota system In 1984 cassava tarJ.ff rates were reduced to 20/ and J.n 1985 to 77 whJ.ch was then equal to the rate on feedgraJ.n imports Taiwan on the other hand has contJ.nued to maintaJ.n a low tarJ.ff rate on maize of 3k WJ.th a signifJ.cantly hJ.gher rate for cassava TaJ.wan has been reluctant to liberalize the duty because of its own cassava producers even though domestic cassava does not go J.nto animal feed concentrates
East AsJ.an markets have easily absorbed the surpluses from Thailand Thal. exports to East and Southeast Asian markets increased from 48 thousand tons in 1982 (this was all chip exports to South Korea for alcohol productJ.on) to 129 thousand tons J.n 1983 225 thousand tons in 1984 and
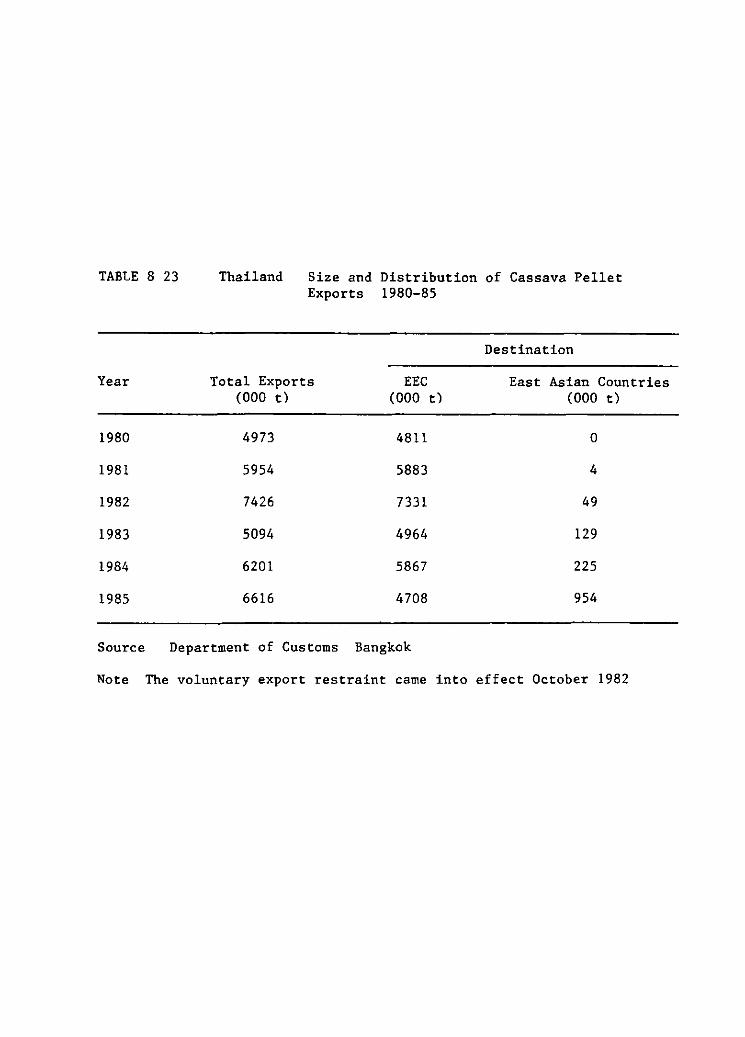
TABLE 8 23
Year
1980
1981
1982
1983
1984
1985
Thailand Size and Distribution of Cassava Pellet Exporta 1980-85
Destination
Total Exports EEC East Asian Countries (000 t) (000 t) (000 t)
4973 4811 o
5954 5883 4
7426 7331 49
5094 4964 129
6201 5867 225
6616 4708 954
Source Department of Customs Bangkok
Note The voluntary export restraint carne into effect October 1982
VIII - 22 -
finally to 954 thousand tons in 1985 (Table 8 23) In 1985 Japan took over 400 thousand tons and South Korea and Taiwan over 200 thousand tons each The potential market for cassava in East Asia is more than even current cassava export levels as long as 1t is competit1vely priced with ma1ze East Asia will develop as the secondary or residual market for Thai cassava with Europe having first call on Thai cassava exports upto the quota l1mit
On the other hand for the cassava-producing countries in Southeast Asia increased cassava production is one of the means for meeting the rapidly rising domestic demand for carbohydrate sources in feed rat1ons (Table 8 20) Feed concentrate product1on has been increas1ng rapidly in most countr1es in Southeast Asia as demand for animal products have increased and technical change has taken place in animal production systems In Malaysia and the Philippines feed component demand has been met to a significant extent by 1ncreased maize 1mports In Thailand increasingly maize production has been diverted to meeting domestic demand while exports have largely stagnated Finally in Indonesia structural change in an1mal and feed production is just beginning and 1f Indonesia follows trends in the other countries Indones1a will also become a net feedgra1n importer Therefore the potential exists to link increasing domestic demand for feed energy sources to increased cassava product1on
Real1zat1on of this potential depends on cassava be1ng pr1ce competitive with other carbohydrate sources in animal feed diets In Asia this is maize supplemented by broken rice when available Cassava is competitive if it enters into the solution of a least cost feed formulat1on model For the period 1982 to 1984 cassava enters into the least cost d1et in Indonesia and the Ph1l1ppines Cassava comes in and out of the diet 1n Thailand and does not enter at all in Malaysia To enter the diet cassava in general has to be priced at about 65 to 70"/ of the price of maize depending on the price of soybean meal Viewed in the longer term this maize-cassava-price ratio has been very variable in Indonesia and Thailand reflecting the disarticulation between the two international markets In Malaysia the trends in this pr1ce ratio have been cons1stently rising In Malays1a cassava has progressively gotten more expensive in relation to maize Start1ng in 1980 cassava began to be per1od1cally uncompetitive and in mid-1982 th1s trend became relatively permanent In Indonesia on the other hand cassava has become relatively cheaper compared to maize although with significant variability
This analysis re1nforces conclusions from the previous chapters In Malays1a 1n the 1980 s cassava has failed to remain compet1t1ve with ma1ze 1mports In Tha1land cassava will come 1n and out of the rat1on depend1ng on price relationships for maize and cassava defined in two independent but nevertheless international markets In Indones1a cassava could form a more important component of the as yet nascent feed industry Cassava 1n some years 1s extremely competit1ve with ma1ze and yet cassava has not been ut1lized in this industry Use in th1s 1ndustry could put a more effect1ve price floor under cassava on Java However since the feed industry has so far rel1ed on imported ma1ze through BULOG the marketing channels there have yet to develop In the Phil1ppines cassava 1s compet1t1ve but an even further step is required of develop1ng cassava process1ng capacity In general there is suff1cient demand 1n existing domestic markets to absorb
VIII - 23 -
cassava production in these countries Cassava s entry into the growing animal feed market will apart from ThaLland depend on increased domestic production
Conclusions
The prevLous analysis suggests a rather basic question what is a world market for cassava? The world cassava market is something of an odd animal only because it presents the reverse image of the dominant world market for grains The distinctions here are many but a few WLll suffLce in order to characterize the world cassava market First cassava moves as a semi-processed product whereas grains are essentially bulked and shipped being processed in the Lmporting country Processing makes cassava a tradeable gool and unlike other root crops links cassava producing areas to internacional markets However the processing defines the end market where it will be utilLzed i e starch human food or anLmal feed End use in cassava LS defined at or near the production point whereas in grains end use is defined near the consumption poLnt The issue is crLtical Ln internacional trade because processed products eg starch or flour in general have higher tariff protection than raw materials Thus a world cassava trade LS not defLned in the same sense as a world maize trade Rather there is a cassava starch trade and a cassava pellet trade each with their respective world prices
Second government policy plays a very dLrect role in price formation for cassava in world markets just as in the case of graLns However for grains world prLces are principally determined by policies in ma]or exportLng countries which support the price or incomes of their grain producers In cassava on the other hand prLces are principally set by the policies of importing countrLes There are virtually no polLcies whLch directly intervene to support either farm prices for cassava or cassava producer incomes The dLstinctLon LS important Ln regards to the standard by which cassava is judged to be prLce competitLve with graLns Ln internacional markets Cassava competes essentLally wLth graLns but the current organization of international trade Ln cassava and grains resulta Ln a situation where they do not compete directly at internationally determined prices Thus the common assessment that cassava is not competitLve Ln international grain markets in something of a red herrLng because prices are formed within two very distinct policy structures and prices in both cases are not an adequate measure of actual production and transfer costs
FLnally the degree of substLtutLon between cassava and graLns has measurably Lncreased over the post-war perLod and much of the growth Ln world trade Ln cassava has been based on cassava s direct substLtution for grains Ln the dLfferent end markets Cassava s future in world markets does Ln fact depend on its ability to compete with grains To date thLs competLtion has been determLned by grain price policLes and tarLff structures of importing countries and because of this cassava trade is more vulnerable to policy changes than the internacional grain trade where prices and volumes are princLpally set by the graLn policies of the exportLng countrLes Thus while cassava competes on a cost basLs Ln the wider Lnternational grain market (Table 7 21) Lt cannot compete on a price basis The polLtical economy of Lnternational trade in carbohydrate
VIII - 24 -
sources is such that cassava which comes closest to being produced and traded under laissez-faire market principles and perfect competition economic principles and furthermore which is produced solely in developing countn.es cannot compete in an international grain market where income support poll.cies (and to a lesser extent export subsidies and government-to-government sales) of developed countries are necessary for producing at international prices The future of a world market for cassava is principally a matter of political economy and not of pure economics and the policy structure within which cassava must compete will be set outside the ~nfluence of cassava producers themselves
Does cassava have a comparat~ve advantage vis-a-vis grains in international markets? The dominant world market for both grains and cassava in the near future ~s the animal feed market Cassava would move as pellets compet~ng against maize and sorghum What is strik~ng about current world trade in coarse grains is that tropical countries are net ~mporters with the volume growing over time In the tropics only Thailand has rema~ned a large and consistent exporter of coarse gra~ns in the last decade Sudan Burma and Zimbabwe have exported smaller amounts These exporters essentially trade in their own reg~onal market anad their comparative advantage over the large temperate exporters often rests on transport costs quality (white maize in Afnca) and demand for bagged grain The temperate zone appears to have a sign~ficant comparative advantage over the tropics in the production and export of maize and sorghum Part of this ~s due to edapho-climatic conditions -- longer day length longer growing season better soils and reduced disease and pest pressure -- but the pr~ry factors are agricultura! research and eff~cient transport and marketing systems For example the large investments in ma~ze research in the United States s~nce the early 1900's was responsible for a signif~cant rate of growth in maize yields over the post-war period This increased product~on was princ~pally directed to export markets at decl~n~ng real pr~ces (F~gure 8 3)
The issue then is whether tropical cassava has a comparative advantage aga~nst temperate grains and whether this comparat~ve advantage can be further shifted towards cassava through investments in agricultura! research process~ng and marketing Cassava is perfectly adapted to tropical condH~ons it grows well in acid so~ld of low nutrient status can w~thstand periodic drought ~s relatively resistant to disease and pest attack and is very flexible ~n its planting and harvest~ng dates Its productiv~ty under such cond~tions is unequalled by grain crops in the trop1cs Moreover cassava has a very l~m~ted research h1story with almost no basic research on the crop Compared to temperature grains research on cassava ~s 1n its infancy and to date there has been lHtle impact on cassava productivity from improved technolog1es Average yields of cassava 1n exporting countr1es are far below their potent1al indicating s~gnificant scope to shift relative comparative advantage to cassava 1n the same way that tropical palm oil has gained an 1ncreased market share over temperate soybean 011 1n the last two decade
Comparative advantage between grains and cassava (and also between cassava producers) w1ll also depend on processing and market1ng costs The development of the cassava sector in Thailand offers something of a model in the development of scale econom1es in cassava process1ng assembly and
VIII - 25 -
transport If growth in cassava exporta are to be based on small farm production there ~s an argument for basing initial growth on small-scale processing units and achieving scale economies only at cr~tical production volumes Large-scale processing units without the production base are a non-starter or usually result in plantatJ.on production Something of an infant industry argument exists for developing an export capacity in cassava that is competit~ve with the Thai industry where scale economies have already been developed Tha~land because of the efficiency of its processing and marketing sector is fully competitive on a cost basis with U S coarse grains
Sustain~ng the infant industry argument would call for developing a critical production volume based on domestic markets In this lies the real future of a world cassava market since as has been stated tropical countries are majar net importers of coarse grains and increased cassava production will be directed to meet~ng domestic requirements first Any export surpluses w~ll depend on the growth in domestic demand vis-a-vis the growth in production As has been the case ~n As~an cassava producing countries apart from Tha~land product~on has not been able to meet rising demand for cassava products In this regard then impr<-ved production technology would provide the increases in volumes necessary to meet domest~c demand and should surpluses develop would result in the cost reduct~ons that allow the country to compete in internacional markets The ~nternational market for cassava products will continue to be ruled by trade policies technical change and shifting comparative advantage

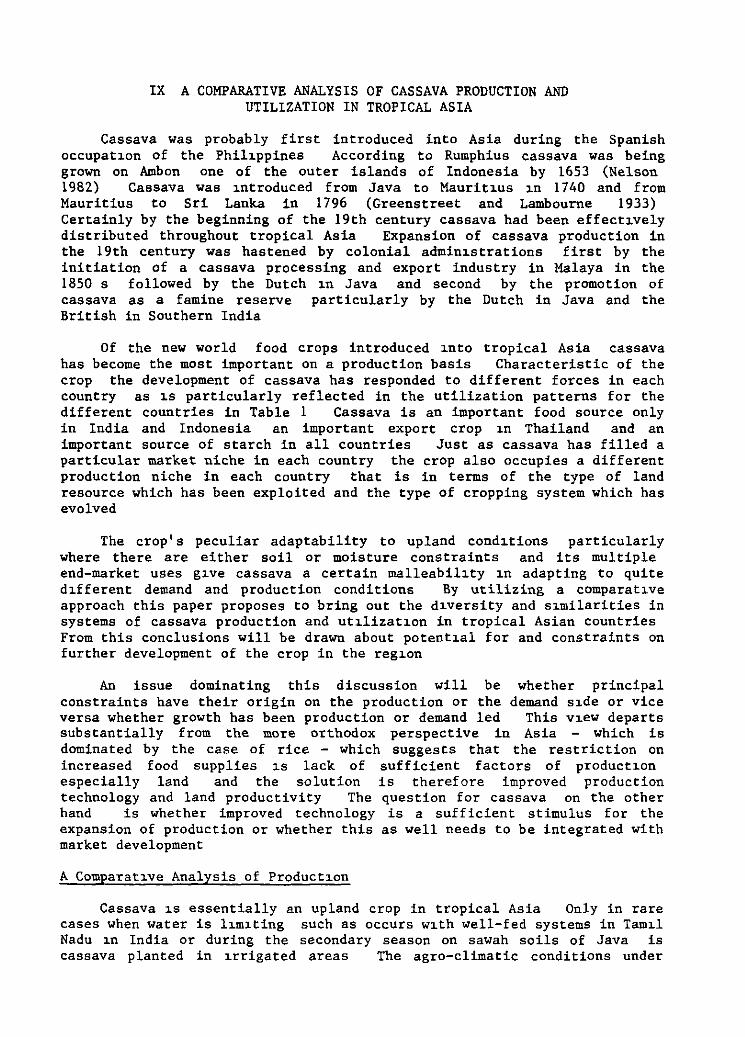
IX A COMPARATIVE ANALYSIS OF CASSAVA PRODUCTION AND UTILIZATION IN TROPICAL ASIA
Cassava was probably first introduced into Asia during the Spanish occupatJ.on of the PhilJ.ppines According to Rumphius cassava was being grown on Ambon one of the outer islands of Indonesia by 1653 (Nelson 1982) Cassava was J.ntroduced from Java to MauritJ.us J.n 1740 and from Mauritius to Sri Lanka in 1796 (Greenstreet and Lambourne 1933) Certainly by the beginning of the 19th century cassava had been effectJ.vely distributed throughout tropical Asia Expansion of cassava production in the 19th century was hastened by colonial adminJ.strations first by the initiation of a cassava processing and export industry in Malaya in the 1850 s followed by the Dutch J.n Java and second by the promotion of cassava as a famine reserve particularly by the Dutch in Java and the British in Southern India
Of the new world food crops introduced J.nto tropical Asia cassava has become the most important on a production basis Characteristic of the crop the development of cassava has responded to different forces in each country as J.S particularly reflected in the utilization patterns for the different countries in Table 1 Cassava is an important food source only in India and Indonesia an important export crop J.n Thailand and an important source of starch in all countries Just as cassava has filled a particular market niche in each country the crop also occupies a different production niche in each country that is in terms of the type of land resource which has been exploited and the type of cropping system which has evolved
The crop 1 s peculiar adaptability to upland condJ.tions particularly where there are either soil or moisture constraints and its multiple end-market uses gJ.ve cassava a certain malleabilJ.ty J.n adapting to quite dJ.fferent demand and production conditions By utilizing a comparatJ.ve approach this paper propases to bring out the dJ.versity and sJ.milarities in systems of cassava production and utJ.lizatJ.on in tropical Asian countries From this conclusions will be drawn about potentJ.al for and constraints on further development of the crop in the regJ.on
An issue dominating this discussion will be whether principal constraints have their origin on the production or the demand sJ.de or vice versa whether growth has been production or demand led This vJ.ew departa substantially from the more orthodox perspective in Asia - which is dominated by the case of rice - which suggests that the restriction on increased food supplies J.S lack of sufficient factors of productJ.on especially land and the solution is therefore improved production technology and land productivity The question for cassava on the other hand is whether improved technology is a sufficient stimulus for the expansion of production or whether this as well needs to be integrated with market development
A ComparatJ.ve Analysis of ProductJ.on
Cassava J.s essentially an upland crop in tropical Asia Only in rare cases when water is lJ.mJ.ting such as occurs WJ.th well-fed systems in TamJ.l Nadu J.n India or during the secondary season on sawah soils of Java is cassava planted in J.rrigated areas The agro-climatic conditions under
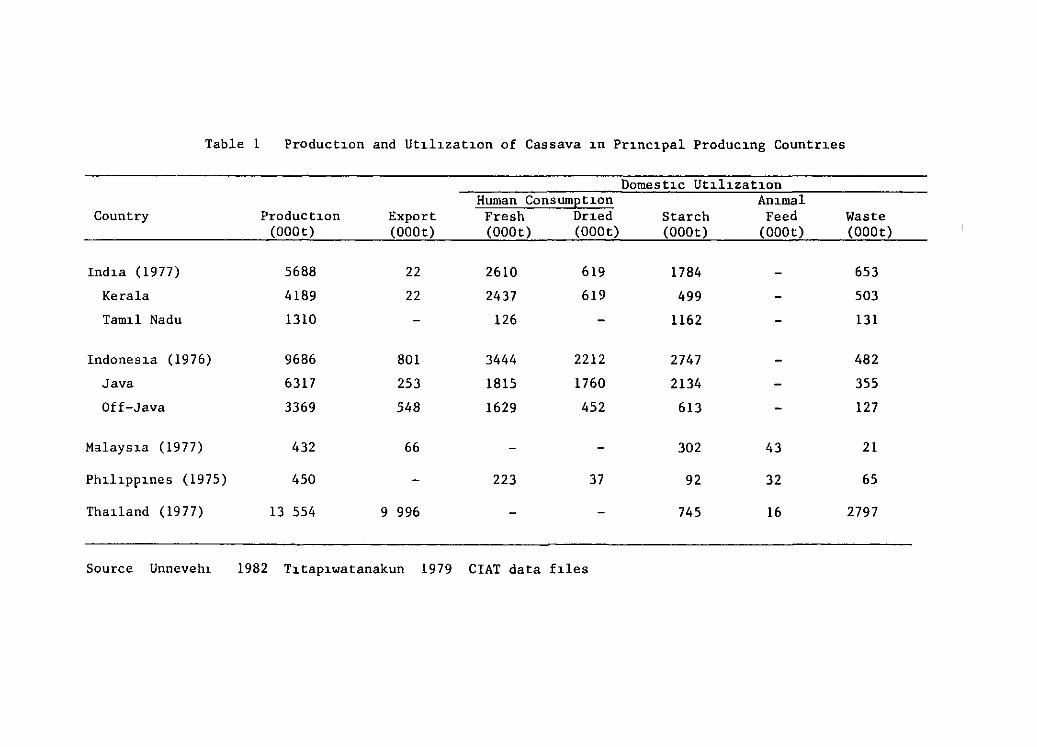
Table 1 Product1on and Ut1l1zat1on of Cassava 1n Pr1nc1pal Produc1ng Countr1es
Domest1c Ut1l1zat1on Human ConsumEt1on An1mal
Country Product1on Export Fresh Dr1ed Starch Feed Waste (OOOt) (OOOt) (OOOt) (OOOt) (OOOt) (OOOt) (OOOt)
Ind1a (1977) 5688 22 2610 619 1784 - 653
Kerala 4189 22 2437 619 499 - 503
Tam1l Nadu 1310 - 126 - 1162 - 131
Indones1a (1976) 9686 801 3444 2212 2747 - 482
Java 6317 253 1815 1760 2134 - 355
Off-Java 3369 548 1629 452 613 - 127
Malays1a (1977) 432 66 - - 302 43 21
Ph1l1pp1nes (1975) 450 - 223 37 92 32 65
Tha1land (1977) l3 554 9 996 - - 745 16 2797
Source Unneveht 1982 T1tap1watanakun 1979 CIAT data f1les
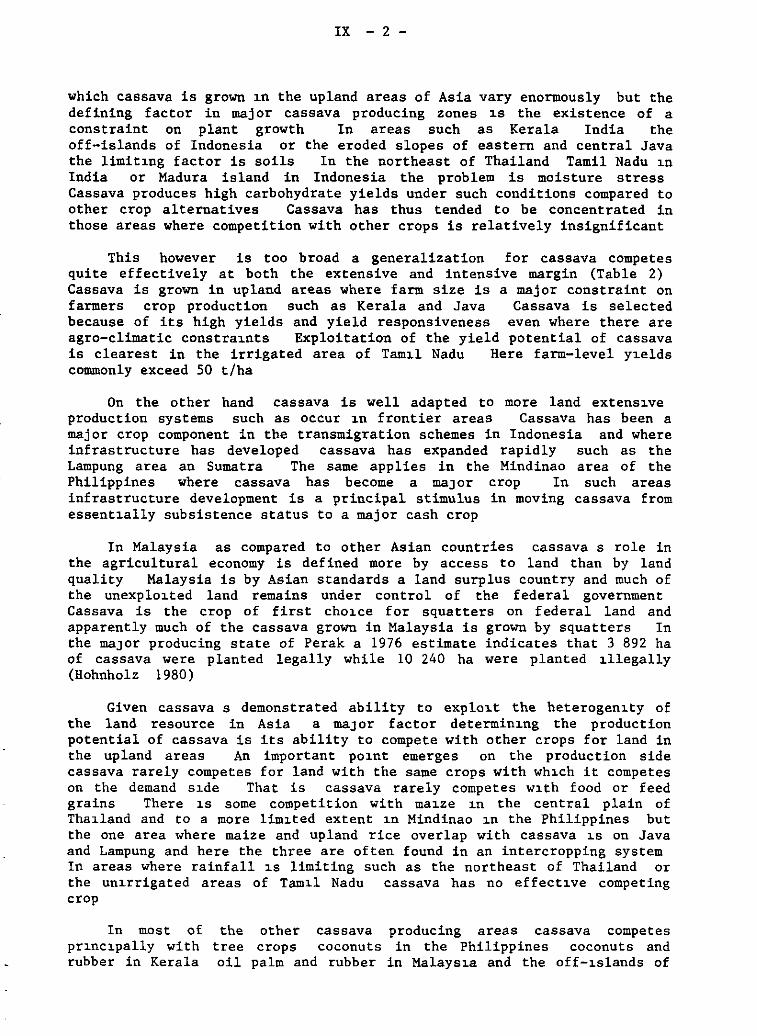
IX - 2 -
which cassava is grown ~n the upland areas of Asia vary enormously but the defining factor in majar cassava producing zones ~s the existence of a constraint on plant growth In areas such as Kerala India the off-islands of Indonesia or the eroded slopes of eastern and central Java the limit~ng factor is soils In the northeast of Thailand Tamil Nadu ~n
India or Madura island in Indonesia the problem is moisture stress Cassava produces high carbohydrate yields under such conditions compared to other crop alternatives Cassava has thus tended to be concentrated in those areas where competition with other crops is relatively insignificant
This however is too broad a generalization for cassava competes quite effectively at both the extensive and intensive margin (Table 2) Cassava is grown in upland areas where farm size is a major constraint on farmers crop production such as Kerala and Java Cassava is selected because of its high yields and yield responsiveness even where there are agro-climatic constra~nts Exploitation of the yield potential of cassava is clearest in the irrigated area of Tam~l Nadu Here farm-level y~elds commonly exceed 50 t/ha
On the other hand cassava is well adapted to more land extens~ve production systems such as occur ~n frontier areas Cassava has been a majar crop component in the transmigration schemes in Indonesia and where infrastructure has developed cassava has expanded rapidly such as the Lampung area an Sumatra The same applies in the Mindinao area of the Philippines where cassava has become a maJar crop In such areas infrastructure development is a principal stimulus in moving cassava from essent~ally subsistence status to a majar cash crop
In Malaysia as compared to other Asian countries cassava s role in the agricultura! economy is defined more by access to land than by land quality Malaysia is by Asian standards a land surplus country and much of the unexplo~ted land remains under control of the federal government Cassava is the crop of first cho~ce for squatters on federal land and apparently much of the cassava grown in Malaysia is grown by squatters In the maJar producing state of Perak a 1976 estimate indicates that 3 892 ha of cassava were planted legally while 10 240 ha were planted ülegally (Hohnholz 1980)
Given cassava s demonstrated ability to explo~t the heterogen~ty of the land resource in Asia a maJar factor determin~ng the production potential of cassava is its ability to compete with other crops for land in the upland areas An important po~nt emerges on the production side cassava rarely competes for land with the same crops with wh~ch it competes on the demand sJ.de That is cassava rarely competes WJ.th food or feed grains There J.s some competition with maJ.ze J.n the central plain of Tha1land and to a more lim1ted extent J.n Mindinao J.n the Philippines but the one area where maize and upland rice overlap with cassava J.S on Java and Lampung and here the three are often found in an intercropping system In areas where rainfall 1s limiting such as the northeast of Thailand or the un1rrigated areas of Taml.l Nadu cassava has no effect1ve competing crop
In most of prmcJ.pally with rubber in Kerala
the other cassava producing areas cassava competes tree crops coconuts in the Philippines coconuts and oil palm and rubber in Malays1a and the off-J.slands of
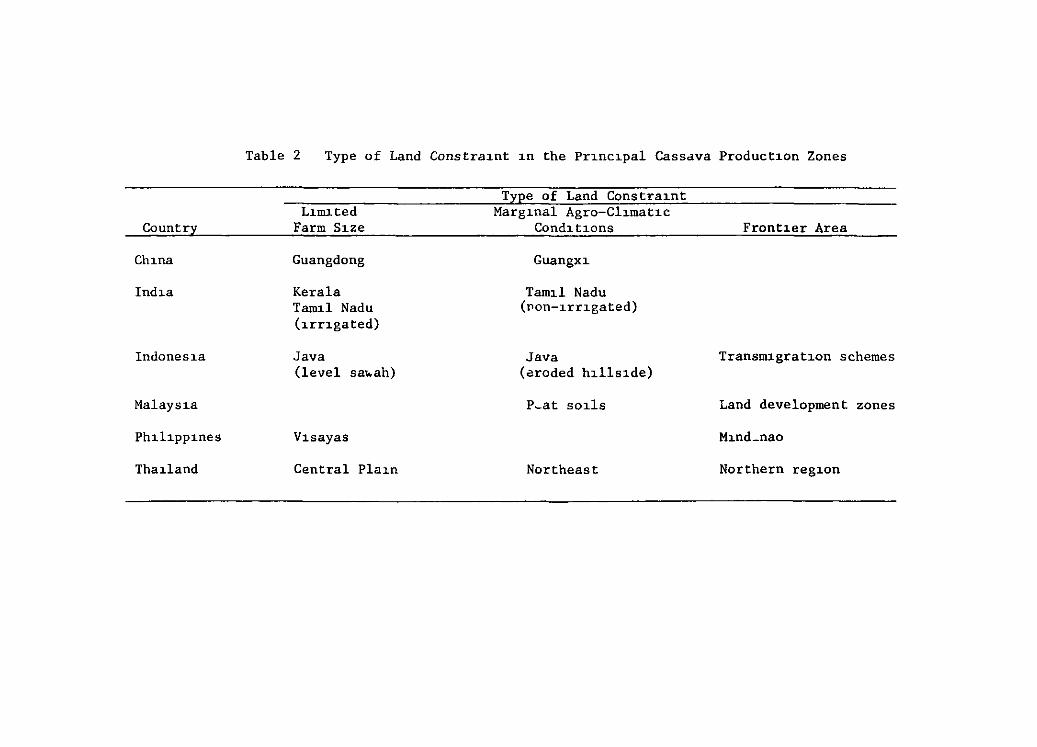
Country
Ch1na
Ind1a
Indones1a
Malays1a
Ph1l1pp1nes
Thalland
Table 2 Type of Land Constra1nt 1n the Pr1nc1pal Cassava Product1on Zones
LHnJ. ted Farm S1ze
Guangdong
Kerala Tam1l Nadu (1rngated)
Java (level sa\o.ah)
V1sayas
Central Pla1n
Type of Land Constra1nt Marg1nal Agro-Cl1mat1c
Cond1t1ons
Guangx1
Tam1l Nadu (pon-1rr1gated)
Java (aroded h1lls1de)
P-at SOllS
Northeast
Front1er Area
Transm1grat1on schemes
Land development zones
Mlnd_nao
Northern reg1on
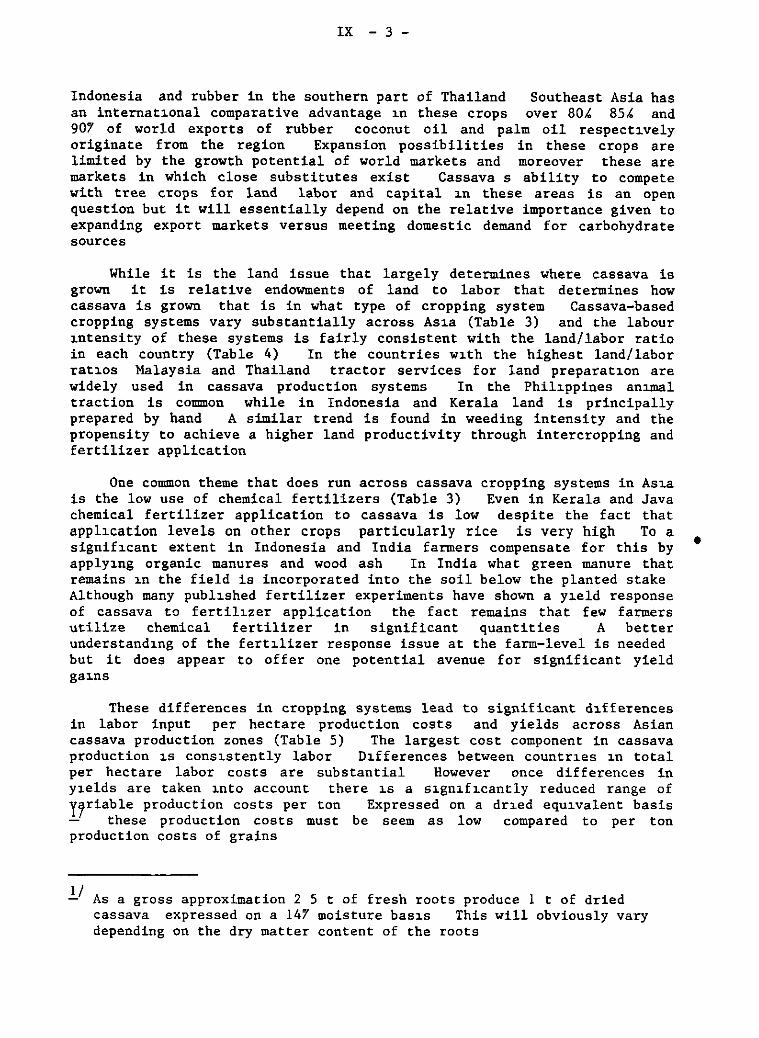
IX - 3 -
Indonesia and rubber in the southern part of Thailand Southeast Asia has an internat~onal comparative advantage ~n these crops over 80k 8Sk and 907 of world exports of rubber coconut oil and palm oil respect~vely originate from the region Expansion possibilities in these crops are limited by the growth potential of world markets and moreover these are markets in which close substitutes exist Cassava s ability to compete with tree crops for land labor and capital ~n these areas is an open question but it will essentially depend on the relative importance given to expanding export markets versus meeting domestic demand for carbohydrate sources
While it is the land issue that largely determines where cassava is grown it is relative endowments of land to labor that determines how cassava is grown that is in what type of cropping system Cassava-based cropping systems vary substantially across As~a (Table 3) and the labour ~ntensity of these systems is fairly consistent with the land/labor ratio in each country (Table 4) In the countries w~th the highest land/labor rat~os Malaysia and Thailand tractor services for land preparatJ.on are widely used in cassava production systems In the Phil~ppines an~mal
traction is common while in Indonesia and Kerala land is principally prepared by hand A similar trend is found in weeding intensity and the propensity to achieve a higher land productivity through intercropping and fertilizer application
One common theme that does run across cassava cropping systems in As~a is the low use of chemical fertilizers (Table 3) Even in Kerala and Java chemical fertilizer application to cassava is low despite the fact that appl~cation levels on other crops particularly rice is very high To a signifJ.cant extent in Indonesia and India farmers compensate for this by apply~ng organic manures and wood ash In India what green manure that remains J.n the field is incorporated into the soil below the planted stake Although many publ~shed fertilizer experimenta have shown a y~eld response of cassava to fertilJ.Zer application the fact remains that few farmers utilize chemical fertilizer in significant quantities A better understandJ.ng of the fertJ.lizer response issue at the farm-level is needed but it does appear to offer one potential avenue for significant yield gaJ.nS
These differences in cropping systems lead to significant dJ.fferences in labor input per hectare production costs and yields across Asian cassava production zones (Table S) The largest cost component in cassava production ~s consJ.stently labor D~fferences between countr~es J.n total per hectare labor costs are substantial However once differences in yJ.elds are taken ~nto account there ~s a s~gn~fJ.cantly reduced range of yyriable production costs per ton Expressed on a dr1ed equJ.valent basis - these production costs must be seem as low compared to per ton production costs of grains
1_/ As a gross approximation 2 S t of fresh roots produce l t of dried cassava expressed on a 147 moisture basJ.s This will obviously vary depending on the dry matter content of the roots
•
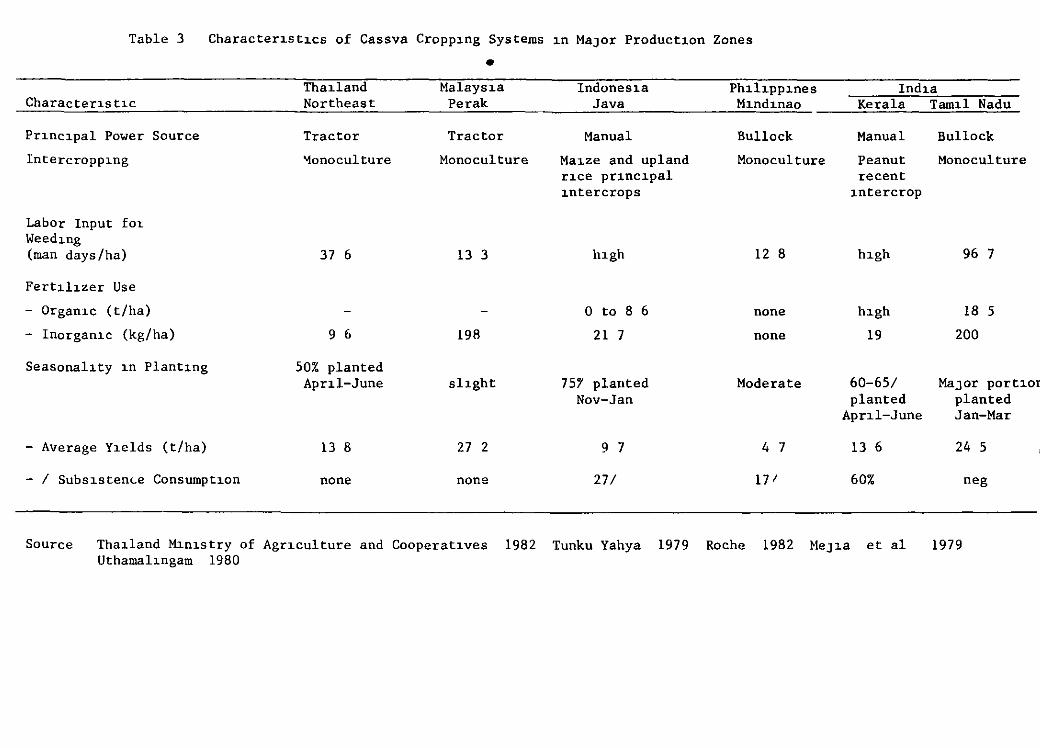
Table 3 Character1st1cs of Cassva Cropp1ng Systems 1n MaJor Product1on Zones
• Thaüand Malays1a Indones1a Ph1hpp1nes Ind1a
Charac ter1s U e Northeast Perak Java M1nd1nao Kerala
Pr1nc1pal Power Source Tractor Tractor Manual Bullock Manual
Intercropp1ng '1onoculture Mono culture Ma1ze and upland Monoculture Peanut r1ce pr1nc1pal recent 1ntercrops 1ntercrop
Labor Input fot Weed1ng (roan days/ha) 37 6 13 3 h1gh 12 8 h1gh
Fert1l1Zer Use
- Organ1c (t/ha) - - O to 8 6 non e h1gh
- Inorgan1c (kg/ha) 9 6 198 21 7 non e 19
Seasonal1ty 1n Plant1ng 50% planted Apnl-June shght 7 5? planted Modera te 60-65/
Nov-Jan planted Apr1l-June
- Average Y1elds (t/ha) 13 8 27 2 9 7 4 7 13 6
- 1 Subs1stence Consumpt1on nene non e 27/ 17 1 60%
So urce Tha1land M1n1stry of Agr1culture and Cooperat1ves 1982 Tunku Yahya 1979 Roche 1982 MeJ1a et al Uthamal1ngam 1980
Tamü Nadu
Bullock
Monoculture
96 7
18 5
200
MaJOr port1or planted Jan-Mar
24 5
neg
1979
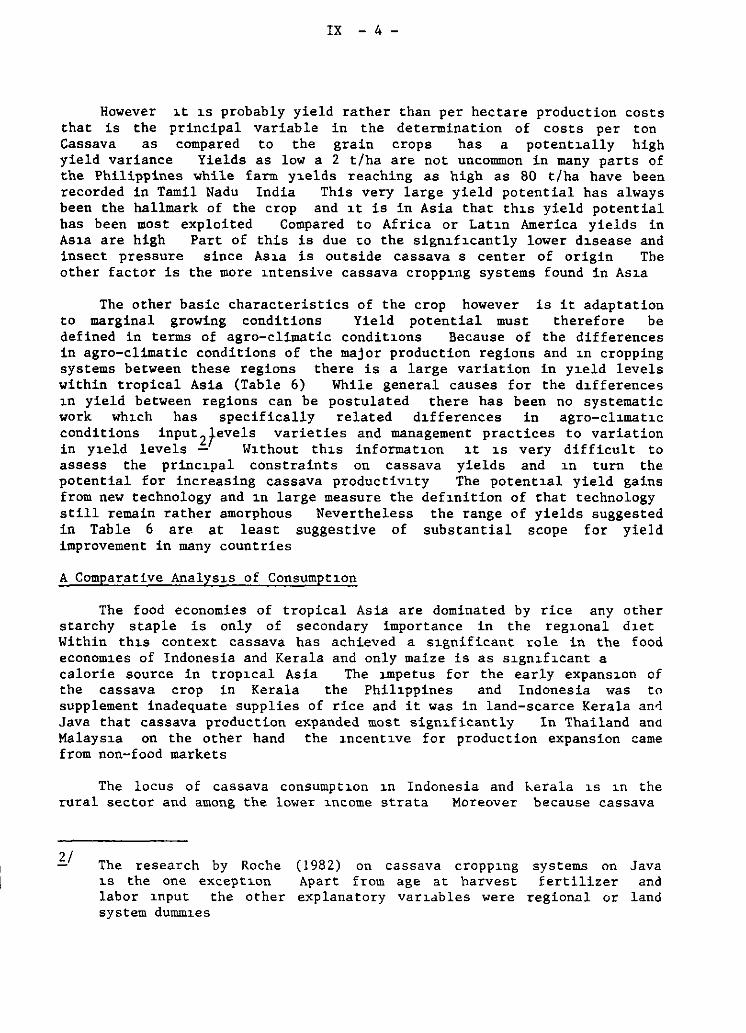
IX - 4 -
However ~t ~s probably yield rather than per hectare production costa that is the principal variable in the determination of costa per ton Cassava as compared to the grain crops has a potent~ally high yield variance Yields as low a 2 t/ha are not uncommon in many parts of the Philippines while farm y1elds reaching as high as 80 t/ha have been recorded in Tamil Nadu India This very large yield potential has always been the hallmark of the crop and ~t is in Asia that th~s yield potential has been most exploited Compared to Africa or Lat~n America yields in As~a are high Part of this is due co the sign~f~cantly lower d1sease and insect pressure since As~a is outside cassava s center of origin The other factor is the more ~ntensive cassava cropp~ng systems found in As~a
The other basic characteristics of the crop however is it adaptation to marginal growing conditions Yield potential must therefore be defined in terms of agro-climstic condit~ons Because of the differences in agro-climstic conditions of the majar production regions and ~n cropping systems between these regions there is a large variation in y~eld levels within tropical Asia (Table 6) While general causes for the d1fferences ~n yield between regions can be postulated there has been no systematic work wh~ch has specifically related d1fferences in agro-cl1mat1c conditions input 2fevels varieties and management practices to variation in y1eld levels - W1thout th~s informat1on 1t 1s very difficult to assess the princ1pal constraints on cassava yields and 1n turn the potential for increasing cassava productiv1ty The potent1al yield gains from new technology and 1n large measure the def1nition of that technology still remain rather amorphous Nevertheless the range of yields suggested in Table 6 are at least suggestive of substancial scope for yield improvement in many countries
A Comparative Analys1s of Consumpt1on
The food economies of tropical Asia are dominated by rice any other starchy staple is only of secondary importance in the reg1onal d1et Within th1s context cassava has achieved a s1gnificant role in the food econom1es of Indonesia and Kerala and only maize is as s1gn1f~cant a calorie source in trop~cal Asia The J.mpetus for the early expans1on cf the cassava crop in Kerala the Phil1ppines and Indonesia ''as to supplement inadequate supplies of rice and it was in land-scarce Kerala an~ Java that cassava production expanded most sign1ficantly In Thailand and Malays1a on the other hand the ~ncent~ve for production expansion came from non-food markets
The locus of cassava consumpt~on 1n Indonesia and kerala ~s ~n the rural sector and among the lower lncome strata Moreover because cassava
The research by Rache 1s the one except~on
labor ~nput the other system dumm~es
( 1982) on cassava cropp~ng
Apart from age at harvest explanatory var~ables were
systems on fertilizer
regional or
Java and
land
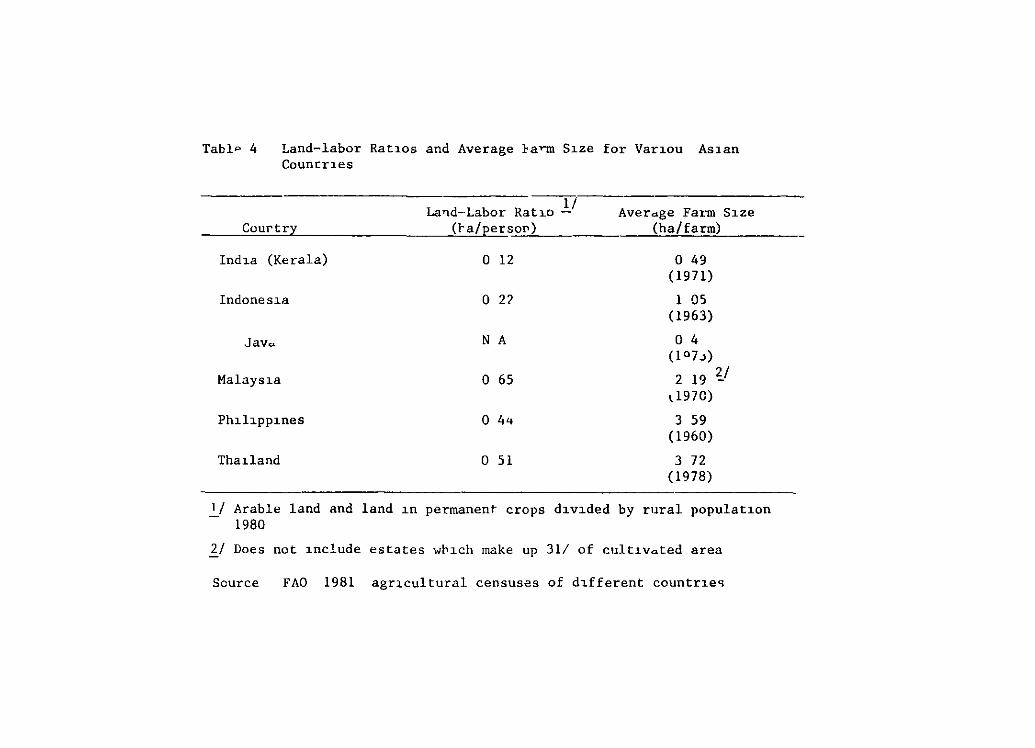
TablP 4 Land-labor Rat1os and Average }arm S1ze for Var1ou As1an Counrr1es
Cuurtry
Ind1a (Kerala)
IndoneSla
Javc;L
Malays1a
Ph1l1pp1nes
Tha1land
17 La~d-Labor Rat10 - Average Farm S1ze
(ra/persor) (ha/farm)
o 12
o 27
N A
o 65
o 44
o 51
o 49 (1971)
1 05 (1963)
o 4 (107.>)
2 19 ?./ \1970)
3 59 (1960)
372 ( 1978)
1/ Arable land and land 1n permanenr crops d1v1ded by rural populat1on - 1980
]j Does not 1nclude estates wl>1ch make up 31/ of cultlvated area
Source FAO 1981 agr1cultural censuscs of d1fferent countr1eq
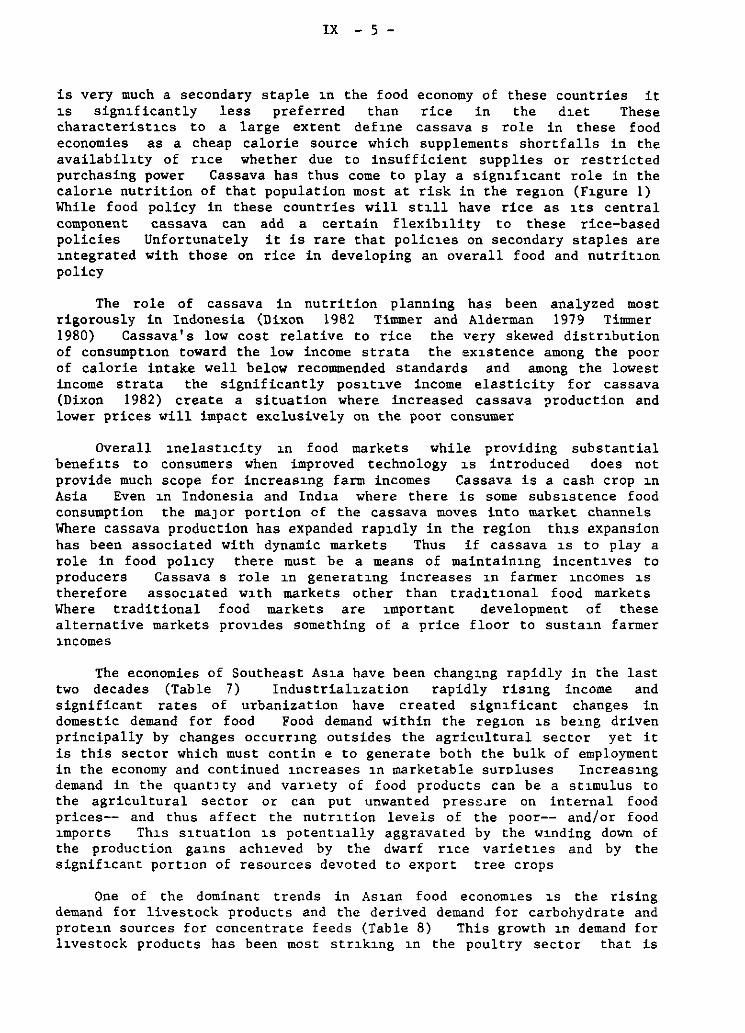
IX - S -
is very much a secondary staple 1n the food economy of these countries it 1s sign1ficantly less preferred than rice in the d1et These characterist1cs to a large extent def1ne cassava s role in these food economies as a cheap calorie source which supplements shortfalls in the availabil1ty of r1ce whether due to insufficient supplies or restricted purchasing power Cassava has thus come to play a sign1f1cant role in the calor1e nutrition of that population most at risk in the reg1on (F1gure 1) While food policy in these countries will st1ll have rice as 1ts central component cassava can add a certain flexib1lity to these rice-based policies Unfortunately it is rare that polic1es on secondary staples are 1ntegrated with those on rice in developing an overall food and nutrit1on policy
The role of cassava in nutrition planning has been analyzed most rigorously in Indonesia (Dixon 1982 Timmer and Alderman 1979 Timmer 1980) Cassava's low cost relative to rice the very skewed distr1bution of consumpt1on toward the low income strata the ex1stence among the peor of calorie intake well below recommended standards and among the lowest income strata the significantly pos1t1ve income elasticity for cassava (Dixon 1982) create a situation where increased cassava ;:>roduction and lower prices will impact exclusively on the poor consumer
Overall 1nelast1city 1n food markets while providing substantial benefl.ts to consumers when improved technology 1s introduced does not provide much scope for increas1ng farm incomes Cassava is a cash crop 1n Asia Even 1n Indonesia and Ind1a where there is sorne subs1stence food consumption the maJar portian cf the cassava moves into market channels Where cassava production has expanded rap1ály in the region th1s expansion has been associated with dynamic markets Thus if cassava 1s to play a role in food pol1cy there must be a means of maintain1ng incent1ves to producers Cassava s role 1n generat1ng increases 1n farmer 1ncomes 1s therefore assoc1ated w1th markets other than trad1t1onal food markets Where tradiCional food markets are 1mportant development of these alternative markets prov1des something of a price floor to susta1n farmer 1.ncomes
The economies of Southeast As1a have been chang1ng rapidly in the last two decades (Table 7) Industrial1zation rapidly ris1ng income and significant rates of urbanization have created sign1ficant changes in domestic demand for food Food demand within the reg1on 1s be1.ng driven principally by changes occurr1ng outsides the agricultura! sector yet it is this sector which must contin e to generate both the bulk of employment in the economy and continued 1ncreases 1n marketable surnluses Increas1ng demand in the quantJ ty and var1ety of food products can be a st1mulus to the agricultura! sector or can put unwanted presz.1re on interna! food prices-- and thus affect the nutr1tion levels of the peor-- and/or food 1mports Th1s s1tuation 1s potent1ally aggravated by the w1nding down of the production ga1ns ach1eved by the dwarf r1ce variet1es and by the signif1cant port1on of resources devoted to export tree crops
One of the dominant trends in As1an food econom1es 1s the rising demand for livestock products and the derived demand for carbohydrate and prote1n sources for concentrate feeds (Table 8) This growth 1n demand for l1vestock products has been most str1k1ng 1n the poultry sector that is
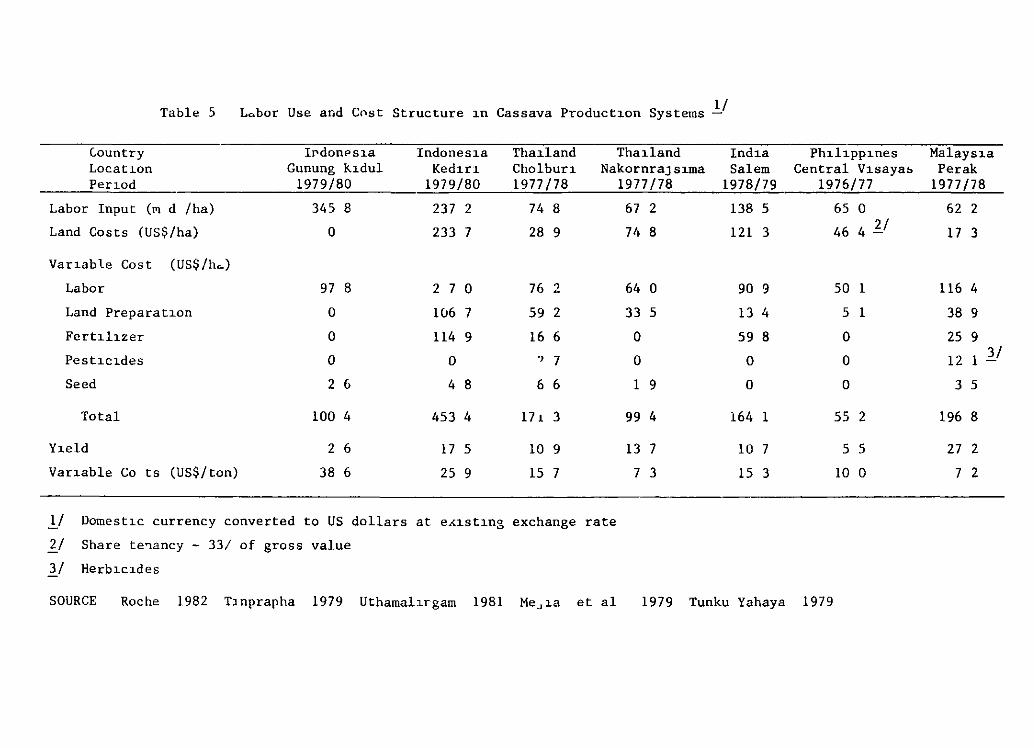
Table 5 Labor Use and Cnst Structure 1n Cassava Product1on Systerns l/
C.ountry lf'dOOPS1a Indones1a Tha1land Thaüand Locat~on Gunung K1dul Ked1r1 Cholbur1 NakornraJs1rna Per1od 1979/80 1979/80 1977/78
Labor Input (~ d /ha) 345 8 237 2 74 8
Land Costs (US$/ha) o 233 7 28 9
Var1able Cost (US$ /h~)
Labor 97 8 2 7 o 76 2
Land Preparat1on o lú6 7 59 2
Fert1luer o 114 9 16 6
Pest1c1des o o ? 7
Seed 2 6 4 8 6 6
Total lOO 4 453 4 17 1 3
Y1eld 2 6 17 5 10 9
Var1able Co ts (US$/ton) 38 6 25 9 15 7
1/ Dornest1c currency converted to US dollars at eÁ1st1n3 exchange rate
11 Share te~ancy - 33/ of gross value
ll Herb1c1des
1977/78
67 2
7'• 8
64 o 33 5
o o l 9
99 4
13 7
7 3
Ind1a Salero
1978/79
138 5
121 3
90 9
13 4
59 8
o o
164 l
10 7
15 3
Ph1l1pp1nes Central V1saya&
1976/77
65 o 46 4 ]j
50 l
5 l
o o o
55 2
5 5
10 o
SOURCE Rache 1982 T1nprapha 1979 Utharnal1rgam 1981 MeJ1a et al 1979 Tunku Yahaya 1979
Malays1a Perak
1977/78
62 2
17 3
116 4
38 9
25 9
12 l 31
3 5
196 8
27 2
7 2
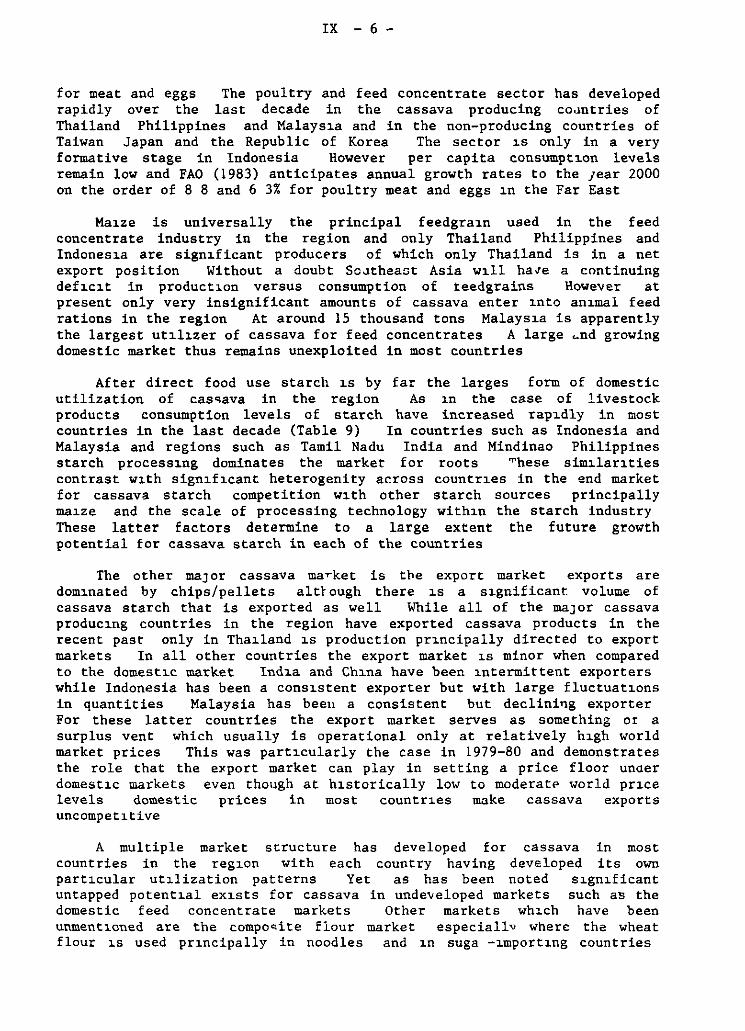
IX - 6 -
for meat and eggs The poultry and feed concentrare sector has developed rapidly over the last decade in the cassava producing coJntries of Thailand Philippines and Malays1a and in the non-producing countries of Taiwan Japan and the Republic of Korea The sector 1s only in a very formative stage in Indonesia However per capita consumpt1on levels remain low and FAO (1983) anticipares annual growth rates to the ¡ear 2000 on the order of 8 8 and 6 3% for poultry meat and eggs 1n the Far East
Ma1ze is universally the principal feedgra1n used in the feed concentrare industry in the region and only Thailand Philippines and Indones1a are sign1ficant producE'rs of which only Thailand is in a net export position Without a doubt SoJtheaot Asia w1ll ha.re a continuing def1c1t in product1on versus consumption of teedgrains However at present only very insignificant amounts of cassava enter 1nto an1mal feed rations in the region At around 15 thousand tons Malays1a is apparently the largest ut1l1zer of cassava for feed concentrares A large ~nd growing domestic market thus remains unexploited in most countries
After direct food use starch 1s by far the larges form of domestic utilization of cas~ava in the region As 1n the case of livestock products consumption levels of starch have increased rap1dly in most countries in the last decade (Table 9) In countries such as Indonesia and Malaysia and regions such as Tamil Nadu India and Mindinao Philippines starch process1ng dominares the market for roots ~hese sim1lar1ties contrast w1th sign1f1cant heterogenity across countr1es in the end market for cassava starch competition w1th other starch sources principally ma1ze and the scale of processing technology with1n the starch industry These latter factors determine to a large extent the future growth potential for cassava starch in each of the countries
The other maJOr cassava market is t¡,e export market exports are dom1nated by chips/pellets al ti" ough there 1s a s1gnificant volume of cassava starch that is exported as well While all of the maJor cassava produc1ng countries in the region have exported cassava products in the recent past only in Tha1land 1s production pr1ncipally directed to export markets In all other countries the export market 1s minor when compared to the domest1c market Ind1a and Ch1na have been 1ntermittent exporters while Indonesia has been a cons1stent exporter but with large fluctuat1ons in quantities Malaysia has beeu a consistent but declining exporter For these latter countries the export market serves as something or a surplus vent which usually is operational only at relatively h1gh world market prices This was part1cularly the case in 1979-80 and demonstrates the role that the el<port market can play in setting a price floor unaer domest1c markets even though at h1storically low to moderatP world pr1ce levels domestic prices in most countr1es =ke cassava exporta uncompetnive
A multiple market structure has developed for cassava in most countries in the reg1on with each country having developed its own part1cular ut1lization patterns Yet as has been noted s1gn1ficant untapped potent1al ex1sts for cassava in undeveloped markets such as the domestic feed concentrare markets Other markets wh1ch have been unment1oned are the compo~ite flour market especiallv wherc the wheat flour 1s used pr1ncipally in noodles and 1n suga -1mport1ng countries
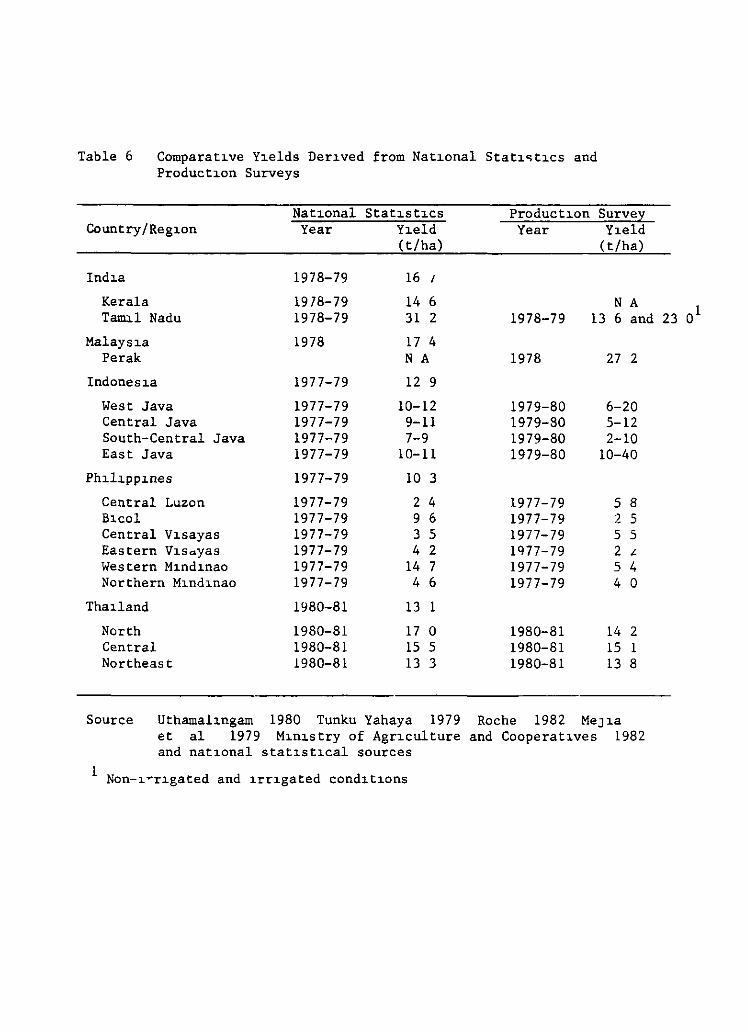
Table 6 Comparat~ve Y~elds Der~ved from Nat~onal Stat~~t~cs and Product~on Surveys
Nat~onal Stat~st~cs
Country /Repon Year Y~eld
(t/ha)
Ind~a 1978-79 16 1
Kerala 19 78-79 14 6 Tanu.l Nadu 1978-79 31 2
Malays~a 1978 17 4 Perak N A
Indones~a 1977-79 12 9
West Java 1977-79 10-12 Central Java 1977-79 9-11 South-Central Java 1977-79 7-9 East Java 1977-79 10-11
Ph~l~pp~nes 1977-79 10 3
Central Luzon 1977-79 2 4 B~col 1977-79 9 6 Central v~sayas 1977-79 3 5 Eas tern VH • .yas 1977-79 4 2 Western M~nd~nao 1977-79 14 7 Northern M~nd~nao 1977-79 4 6
Thaüand 1980-81 13 1
North 1980-81 17 o Central 1980-81 15 5 Northeast 1980-81 13 3
Source Uthamal~ngam 1980 Tunku Yahaya 1979 et al 1979 M~n~stry of Agr~culture and nat~onal stat~st~cal sources
1 Non-~-r~gated and ~rr~gated cond~t~ons
Product~on Surve¡;: Year Y~eld
( t/ha)
N A 1978-79 13 6 and
1978 27 2
1979-80 6-20 1979-80 5-12 1979-80 2-10 1979-80 10-40
1977-79 5 8 1977-79 2 5 1977-79 5 5 1 q77-79 2 ¿
1977-79 5 4 1977-79 4 o
1980-81 14 2 1980-81 15 l 1980-81 13 8
Rache 1982 MeJ~a
and Cooperat~ves 1982
23 o1
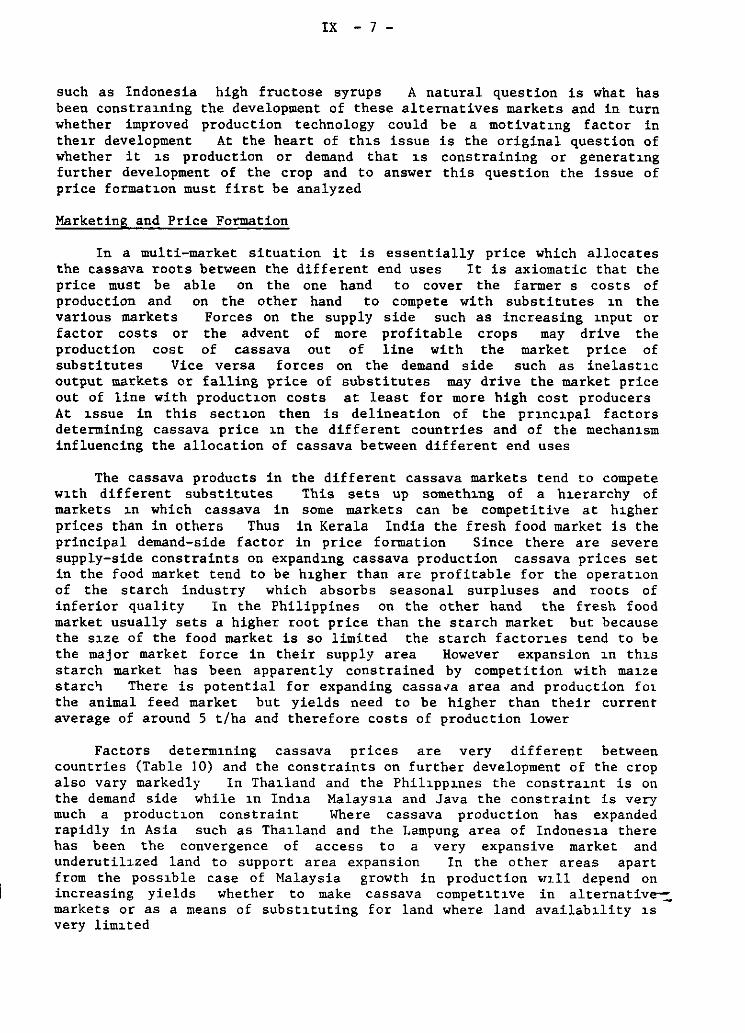
IX - 7 -
such as Indonesia high fructose syrups A natural question is what has been constra1ning the development of these alternatives markets and in turn whether improved production technology could be a motivat1ng factor in the1r development At the heart of th1s issue is the original question of whether it 1s production or demand that 1s constraining or generat1ng further development of the crop and to answer this question the issue of price format1on must first be analyzed
Marketing and Price Formation
In a multi-market situation it is essentially price which allocates the cassava roots between the different end uses It is axiomatic that the price must be able on the one hand to cover the farmer s costs of production and on the other hand to compete with substitutes 1n the various markets Forces on the supply side such as increasing 1nput or factor costs or the advent of more profitable crops may drive the production cost of cassava out of line with the market price of substitutes Vice versa forces on the demand side such as inelast1c output markets or falling price of substitutes may drive the market price out of line with product1on costs at least for more high cost producers At 1ssue in this sect1on then is delineation of the pr1nc1pal factors determining cassava price 1n the different countries and of the mechan1sm influencing the allocation of cassava between different end uses
The cassava products in the different cassava markets tend to compete w1th different substitutes This sets up someth1.ng of a h1.erarchy of markets 1.n which cassava in some markets can be competitive at h1gher prices than in others Thus in Kerala India the fresh food market is the principal demand-side factor in price formation Since there are severe supply-side constraints on expand1ng cassava production cassava prices set in the food market tend to be h1gher than are profitable for the operat1on of the starch industry which absorbs seasonal surpluses and roots of inferior quality In the Philippines on the other hand the fresh food market usually sets a higher root price than the starch market but because the s1ze of the food market is so limited the starch factor1es tend to be the major market force in their supply area However expansion 1n th1s starch market has been apparently constrained by competition with ma1Ze starc~ There is potential for expanding cassava area and production fot the animal feed market but yields need to be higher than their current average of around S t/ha and therefore costs of production lower
Factors determ1ning cassava prices are very different between countries (Table JO) and the constraints on further development of the crop also vary markedly In Tha1land and the Phil1pp1.nes the constra1.nt is on the demand side while 1n Ind1a Malays1a and Java the constraint is very much a product1on constraint Where cassava production has expanded rapidly in Asia such as Tha1land and the Lampung area of Indones1a there has been the convergence of access to a very expansive market and underutil1zed land to support area expansion In the other areas apart from the poss1ble case of Malaysia growth in production >nll depend on increasing yields whether to make cassava compet1t1ve in alternative-: markets or as a means of subst1tuting for land where land availab1lity 1s very lim1ted
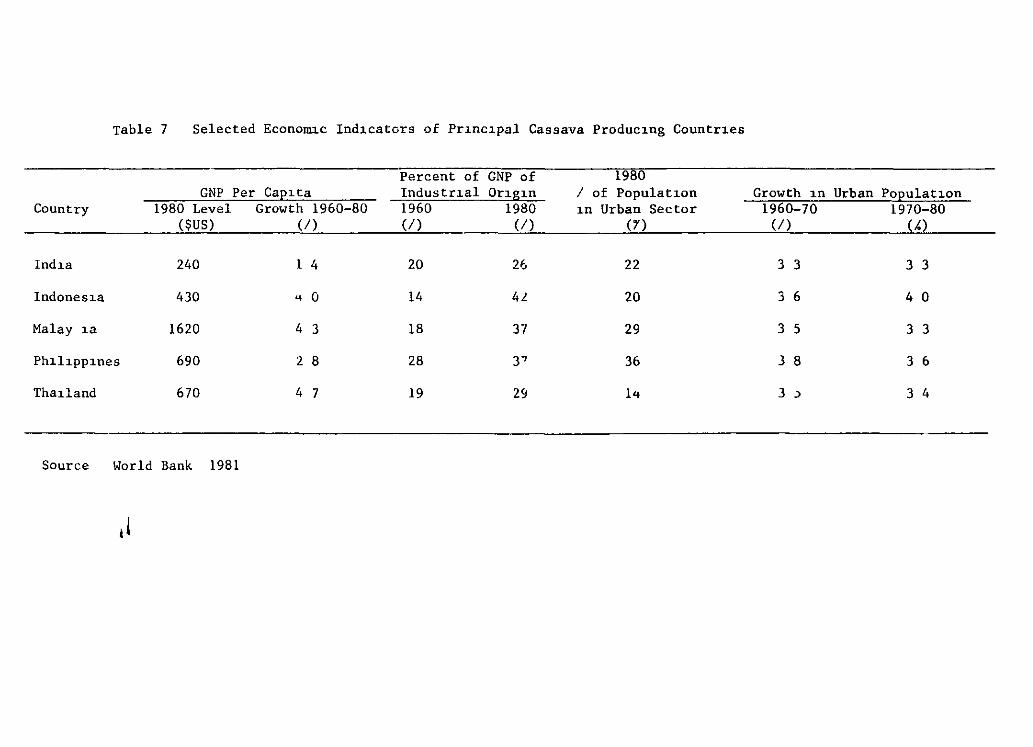
rable 7 Selected Econom~c Ind~cators of Pr~nclpal Cassava Produc1ng Countr~es
Percent of GNP of - 1980 GNP Per Ca21ta Industrlal Or1g1n 1 of Populat~on Growth ~n Urban Po2ulat~on
Country 1980 Level Growth 1960-80 1960 1980 1n Urban Sector 1960-70 1970-80 ($US) (/) (/) (/) (r) (/) (.()
Indla 240 1 4 20 26 22 3 3 3 3
Indones1a 430 " o 14 4L 20 3 6 4 o
Malay ~a 1620 4 3 18 37 29 3 5 3 3
Ph1l~pp~nes 690 2 8 28 3' 36 3 8 3 6
Tha1land 670 4 7 19 29 1« 3 :> 3 4
Source World Bank 1981
1 ¡
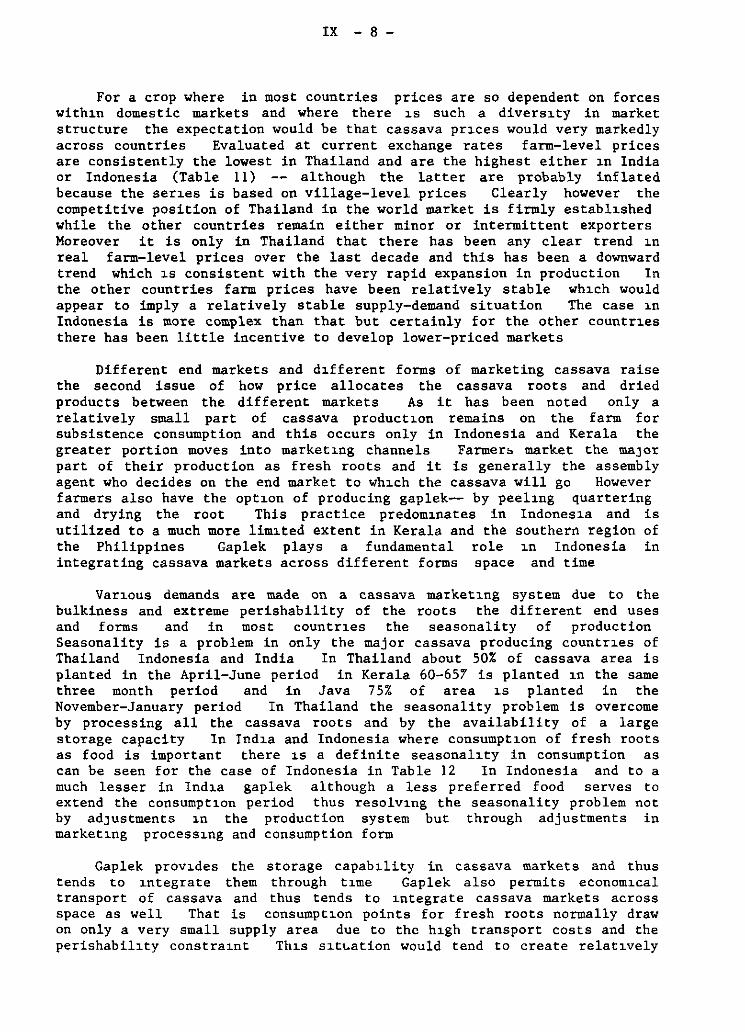
IX - 8 -
For a crop where in most countries prices are so dependent on forces withl.n domestic markets and where there 1.s such a divers1.ty in market structure the expectation would be that cassava pr1.ces would very markedly across countries Evaluated at current exchange rates farm-level prices are consistently the lowest in Thailand and are the highest either 1.n India or Indonesia (Table 11) -- although the latter are probably inflated because the ser1.es is based on village-level prices Clearly however the competitive position of Thailand in the world market is firmly establ1.shed while the other countries remain either minor or intermittent exporters Moreover it is only in Thailand that there has been any clear trend l.n real farm-level prices over the last decade and this has been a downward trend which l.S consistent with the very rapid expansion in production In the other countries farm prices have been relatively stable wh1.ch would appear to imply a relatively stable supply-demand situation The case 1.n Indonesia is more complex than that but certainly for the other countrl.es there has been little incentive to develop lower-priced markets
Different end markets and d1.fferent forms of marketing cassava raise the second issue of how price allocates the cassava roots and dried products between the different markets As it has been noted only a relatively small part of cassava productl.on remains on the farm for subsistence consumption and this occurs only in Indonesia and Kerala the greater portien moves into market1.ng channels Farmero market the maJor part of their production as fresh roots and it is generally the assembly agent who decides on the end market to wh1.ch the cassava will go However farmers also have the opt1.on of producing gaplek-- by peel1.ng quartering and drying the root This practice predom1.nates in Indonesl.a and is utilized to a much more lim1.ted extent in Kerala and the southern region of the Philippines Gaplek plays a fundamental role 1.n Indonesia in integrating cassava markets across different forms space and time
Var1.ous demands are made on a cassava marketl.ng system due to the bulkiness and extreme perishability of the roots the difterent end uses and forms and in most countr1.es the seasonality of production Seasonality is a problem in only the major cassava producing countr1.es of Thailand Indonesia and India In Thailand about 50% of cassava area is planted in the April-June period in Kerala 60-657 is planted 1.n the same three month period and in Java 75% of area l.s planted in the November-January period In Thailand the seasonality problem is overcome by processing all the cassava roots and by the availability of a large storage capacity In Ind1.a and Indonesia where consumptl.on of fresh roots as food is important there l.S a definite seasonal1.ty in consumption as can be seen for the case of Indonesia in Table 12 In Indonesia and to a much lesser in Ind1.a gaplek although a less preferred food serves to extend the consumptl.on period thus resolv1.ng the seasonality problem not by adJustments 1.n the production system but through adjustments in market1.ng process1.ng and consumption form
Gaplek prov1.des the storage capab1.lity in cassava markets and thus tends to l.ntegrate them through t1.me Gaplek also permits econom1.cal transport of cassava and thus tends to 1.ntegrate cassava markets across space as well That is consumpt1.on points for fresh roots normally draw on only a very small supply area due to thc h1.gh transport costs and the perishabil1.ty constra1.nt Th1.s sl.tt.ation would tend to create relat1.vely
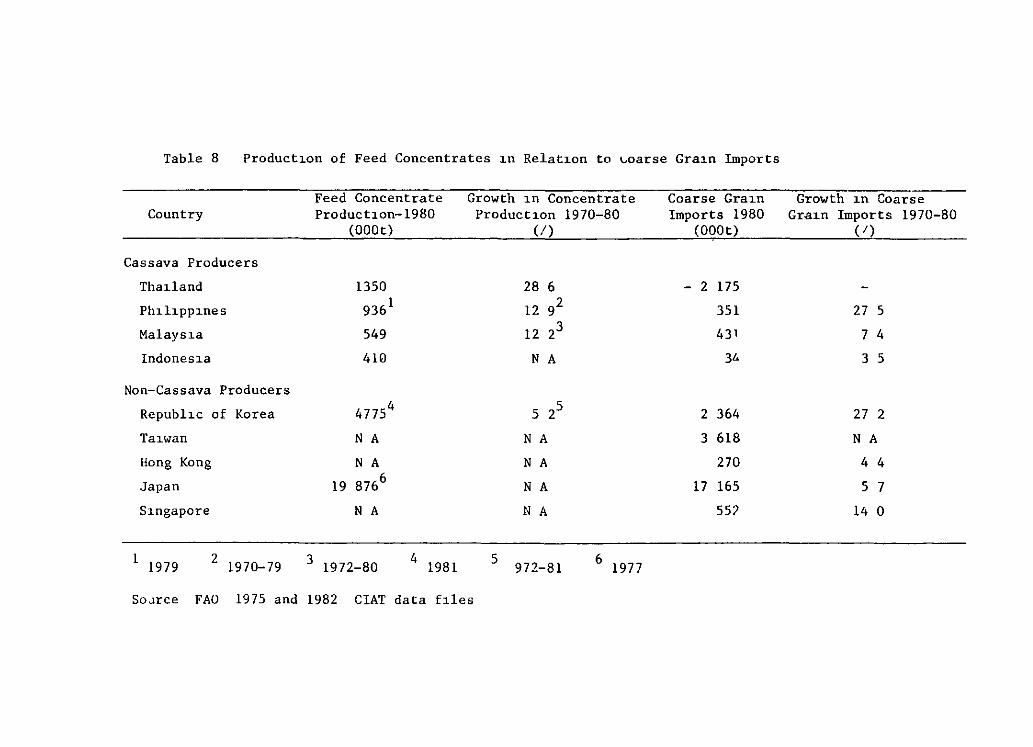
Table 8 ProductLon of Feed Concentrates Ln RelatLon to ~oarse GraLn Imports
Feed Concentrate Growth Ln Concentrate Coarse GraLn Growth Ln Coarse Country ProductLon-1980 ProductLon 1970-80 Imports 1980 GraLn Imports 1970-80
(OOOt) (/) (OOOt) (!)
Cassava Producers
Thaüand 1350 28 6 - 2 175
PhLhppLnes 936 1 12 92 351 27 5
Ma1aysLa 549 12 23 431 7 4
IndonesLa 4Hl N A 3L. 3 5
Non-Cassava Producers
RepublLc of Korea 4775 4 5 25 2 364 27 2
Ta~wan N A N A 3 618 N A
Hong Kong N A N A 270 4 4
Japan 19 8766 N A 17 165 5 7
SLngapore N A N A 55? 14 o
1 1979
2 1970-79 3 1972-80 4 1981 5
972-81 6 1977
SoJrce FAO 1975 and 1982 CIAT data fLles
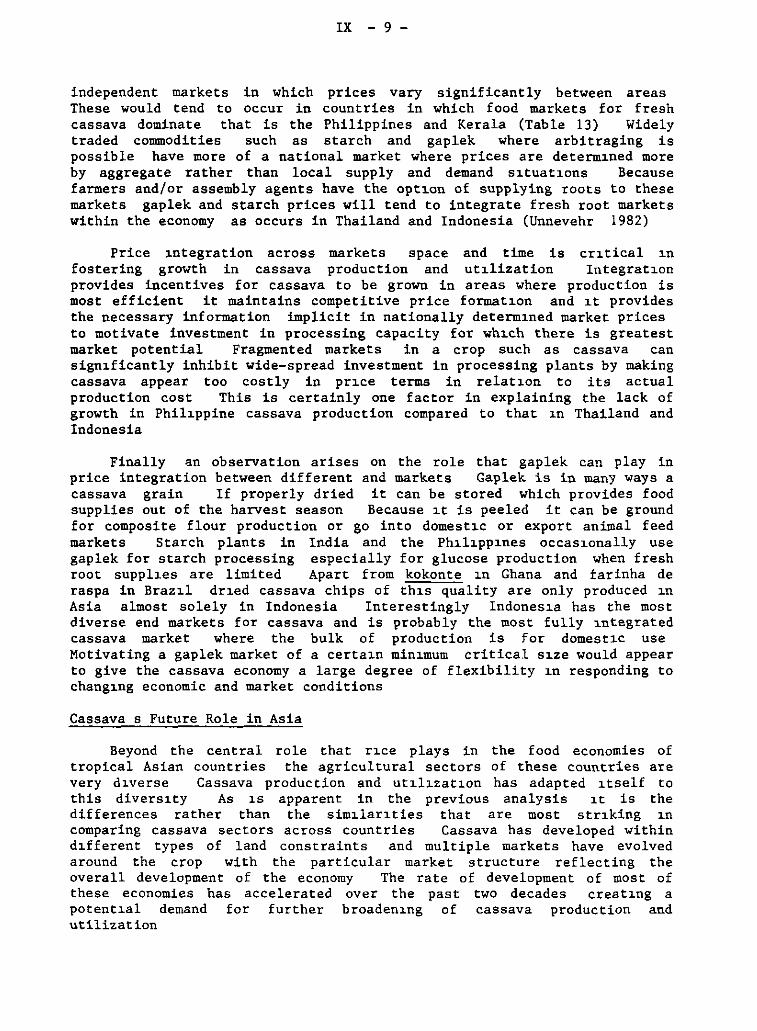
IX - 9 -
independent markets in which prices vary significantly between areas These would tend to occur in countries in which food markets for fresh cassava dominate that is the Philippines and Kerala (Table 13) Widely traded commodities such as starch and gaplek where arbitraging is possible have more of a national market where prices are determ~ned more by aggregate rather than local supply and demand s~tuat~ons Because farmers and/or assembly agents have the opt~on of supplying roots to these markets gaplek and starch prices will tend to integrate fresh root markets within the economy as occurs in Thailand and Indonesia (Unnevehr 1982)
Price 1ntegration across markets space and time is cr~tical 1n fostering growth in cassava production and ut~lization Integrat~on
provides incentives for cassava to be grown in areas where production is most efficient it maintains competitive price format~on and 1t provides the necessary information implicit in nationally determ1ned market prices to motivate investment in processing capacity for wh1ch there is greatest market potential Fragmented markets in a crop such as cassava can sign~ficantly inhibit wide-spread investment in processing plants by making cassava appear too costly in pr~ce terms in relat1on to its actual production cost This is certainly one factor in explaining the lack of growth in Phil~ppine cassava production compared to that 1n Thailand and Indonesia
Finally an observation arises on the role that gaplek can play in price integration between different and markets Gaplek is in many ways a cassava grain If properly dried it can be stored which provides food supplies out of the harvest season Because ~t is peeled it can be ground for composite flour production or go into domest1c or export animal feed markets Starch plants in India and the Ph1l~pp~nes occas~onally use gaplek for starch processing especially for glucose production when fresh root suppll.es are limited Apart from kokonte 1n Ghana and farinha de raspa in Braz~l dr1ed cassava chips of th1s quality are only produced 1n Asia almost solely in Indonesia Interestingly Indones~a has the most diverse end markets for cassava and is probably the most fully ~ntegrated
cassava market where the bulk of production is for domest1c use Motivating a gaplek market of a certa1n min1mum critica! s~ze would appear to give the cassava economy a large degree of flexibility 1n responding to chang~ng economic and market conditions
Cassava s Future Role in Asia
Beyond the central role that r1ce plays in the food economies of tropical Asian countries the agricultura! sectors of these countries are very d1verse Cassava production and ut~ll.zauon has adapted 1tself to this divers1ty As ~s apparent in the previous analysis 1t is the differences rather than the sim~lar1ties that are most str1king ~n
comparing cassava sectors across countries Cassava has developed within d1fferent types of land constraints and multiple markets have evolved around the crop with the particular market structure reflecting the overall development of the economy The rate of development of most of these economies has accelerated over the past two decades creat~ng a potent~al demand for further broaden~ng of cassava production and utilization
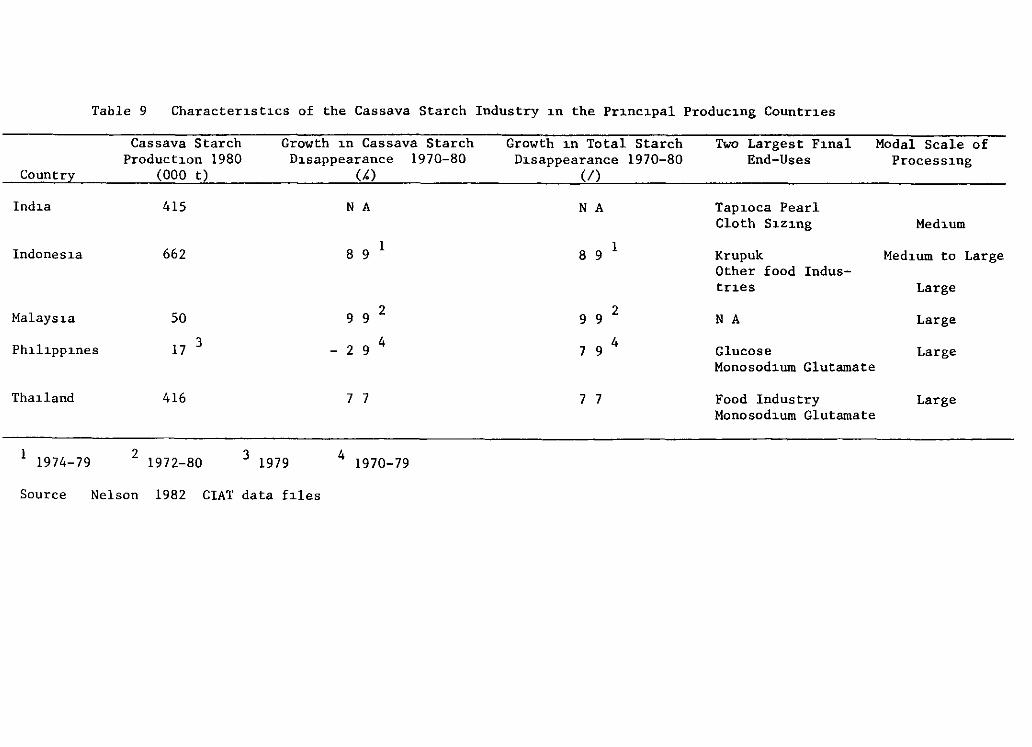
Table 9 Character1st1cs of the Cassava Starch Industry 1n the Pr1nc1pal Produc1ng Countr1es
Country
Ind1a
Indones1a
Malays1a
Ph1l1pp1nes
Tha1land
1 1974-79
Cassava Starch Productwn 1980
(000 t)
415
662
50
17 3
416
2 1972-80
Growth 1n Cassava Starch
3 1979
D1.sappearance (4)
N A
8 9 1
9 9 2
- 2 9 4
7 7
4 1970-79
1970-80
Source Nelson 1982 CIAT data f1les
Growth 1n Total Starch D1sappearance 1970-80
(/)
N A
8 9 1
9 9 2
7 9 4
7 7
Two Largest F1nal End-Uses
Tap1oca Pearl Cloth Su1ng
Krupuk Other food Industr1es
N A
Glucose Monosod1um Glutamate
Food Industry Monosod1um Glutamate
Modal Scale of Process1ng
Med1um
Med1um to Large
Large
Large
Large
Large
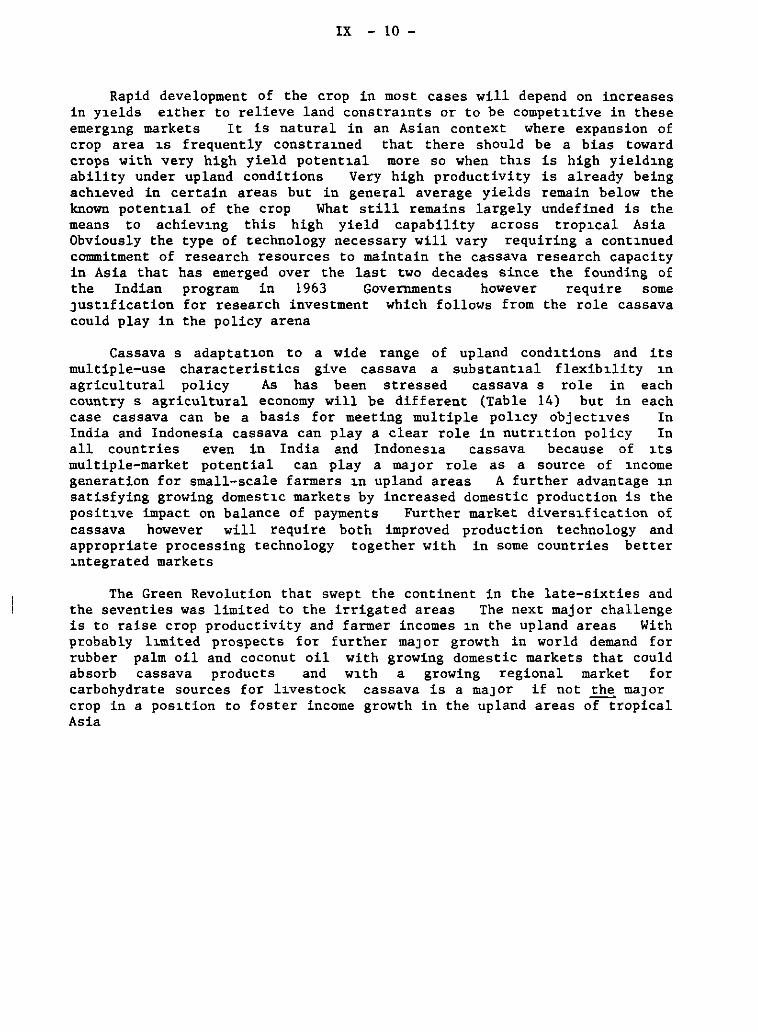
IX - 10 -
Rapid development of the crop in most cases will depend on increases in y1elds e1ther to relieve land constra1nts or to be compet1tive in these emerg1ng markets It is natural in an Asian context where expansion of crop area 1s frequently constra1ned that there should be a bias toward crops with very high yield potent1al more so when th1s is high yield1ng ability under upland conditions Very high productivity is already being ach1eved in certain areas but in general average yields remain below the known potent1al of the crop What still remains largely undefined is the means to achiev1ng this high yield capability across trop1cal Asia Obviously the type of technology necessary will vary requiring a cont1nued commitment of research resources to maintain the cassava research capacity in Asia that has emerged over the last two decades since the founding of the Indian program in 1963 Governments however require some JUStl.fication for research investment which follows from the role cassava could play in the policy arena
Cassava s adaptatl.on to a wide range of upland cond1tions and its multiple-use characteristics give cassava a substant1al flexib1lity 1n agricultura! policy As has been stressed cassava s role in each country s agricultura! economy will be different (Table 14) but in each case cassava can be a basis for meeting multiple pol1cy object1ves In India and Indonesia cassava can play a clear role in nutr1tion policy In all countries even in India and Indones1a cassava because of 1ts multiple-market potential can play a maJor role as a source of 1ncome generation for small-scale farmers 1n upland areas A further advantage 1n satisfying growing domest1c markets by increased domestic production is the posit1ve impact on balance of payments Further market divers1fication of cassava however will require both improved production technology and appropriate processing technology together with in some countries better 1ntegrated markets
The Green Revolution that swept the continent in the late-sixties and the seventies was limited to the irrigated areas The next major challenge is to raise crop productivity and farmer incomes 1n the upland areas With probably l1mited prospects for further maJor growth in world demand for rubber palm oil and coconut oil with growing domestic markets that could absorb cassava products and w1th a growing regional market for carbohydrate sources for l1vestock cassava is a maJor if not the maJor crop in a pos1tion to foster income growth in the upland areas of'tropical Asia
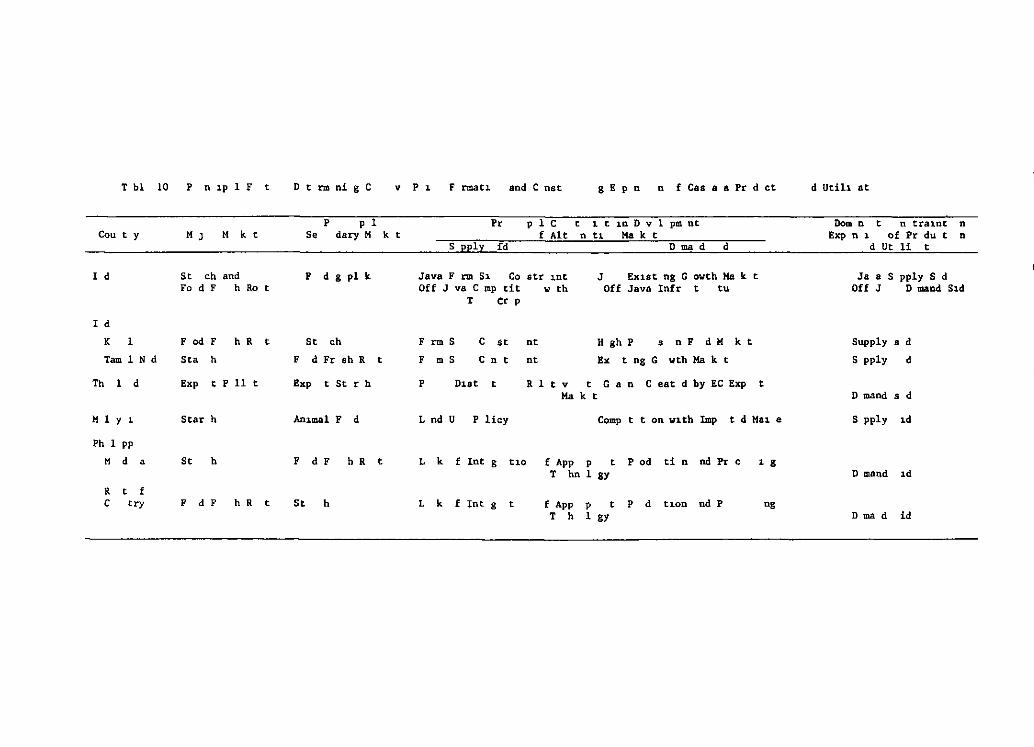
T bl 10 P n 1p 1 F t DtrmnigC v P 1 F rmat1 and e nst g E p n n f Cas a a Pr d ct d Utib at
p p 1 Pr p 1 e t 1 t 1n D v 1 pm nt Dom n t n tra1nt n Cou t y M J M k t Se dary M k t f A1t nt1 Ha k t Exp n 1 of Pr du t n
S 1 íd O ma d d d Ut 1i t
1 d St eh and F d g p1 k Java F rm S1 Co str 1nt J Ex1st ng G owth Ma k t Ja a S pp1y S d Fo d F h Ro t Off J va e mp tit w th Off Java Infr t tu Off J D mand Sld
T cr p
1 d
K 1 F od F h R t se eh F rm S e se nt H gh P S n F d M k t Supp1y S d
Tam 1 N d Sta h F d Fr sh R t F m S e n e nt Ex t ng G wth Ha k t S pp1y d
Th 1 d Exp t p 11 t Exp t St r h p Dut t R 1 t V t G a n e eat d by EC Exp t Ha k t Dmandsd
H 1 y 1 Star h An1ma1 F d L nd U P liey Comp t t on wl th Imp tdMue S pp1y ld
Ph 1 pp
M d a Se h F d F h R t L k f Int g t10 f App p t P od ti n nd Pr e 1 g T hn 1 gy D mand ld
R t f e try F d F h R t St h L k f Int g t f App p t p d t10n nd P ng
T h 1 gy D ma d id
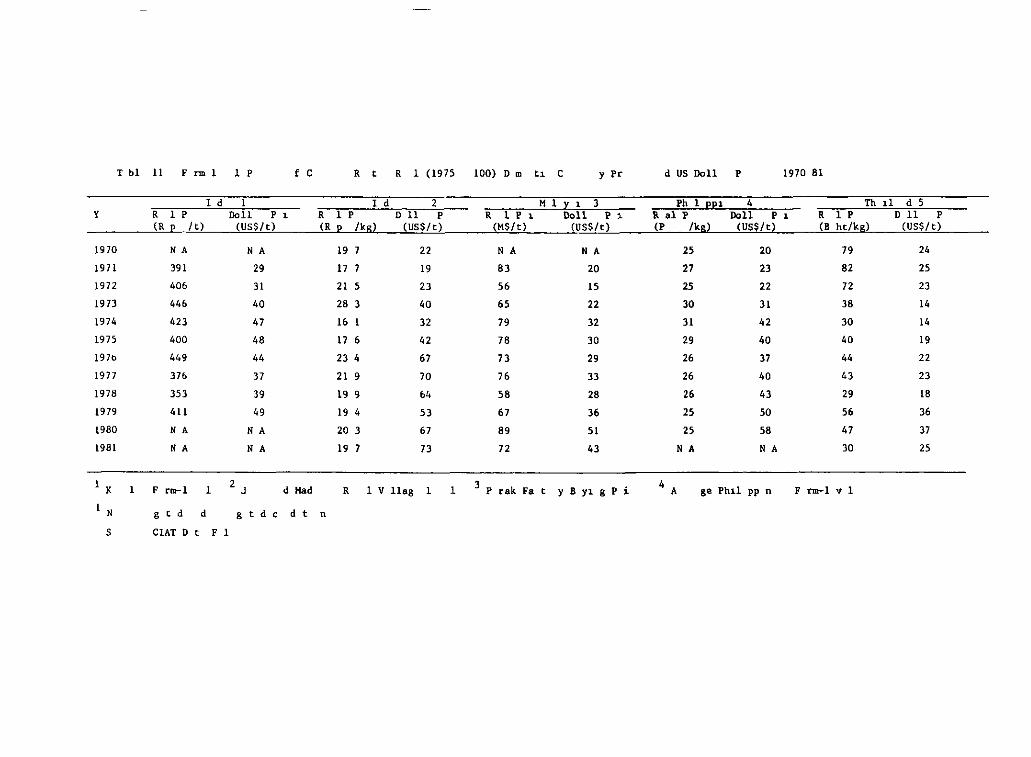
T b1 11 F nn 1 1 p f e R t R 1 (1975 lOO) D m t1 e y Pr d us Doll p 1970 81
I d 1 I d 2 -.rr- l J Ph 1 E:E:l 4 Th 11 d 5 y R 1 p Doll p l R 1 p Dll p R 1 p l Doll p ' R al P Doll p 1 R 1 p Dll p
(R p 1 t) (US$/t) (R p /kg) (US$/t) (M$/t) (US$/t) (P /kg) (US$/t) (B ht/kg) (US$/t)
1970 N A N A 19 7 22 N A N A 25 20 79 24
1971 J91 29 17 7 19 8J 20 27 2J 82 25
1972 406 JI 21 5 2J 56 15 25 22 72 2J
1973 446 40 28 3 40 65 22 30 31 38 14
1974 423 47 16 1 32 79 32 31 42 JO 14
1975 400 48 17 6 42 78 30 29 40 40 19
197b 449 44 23 4 67 73 29 26 37 44 22
1977 376 37 21 9 70 76 33 26 40 4J 23
1978 353 J9 19 9 64 58 28 26 43 29 18
1979 411 49 19 4 53 67 36 25 50 56 36
1980 N A N A 20 3 67 89 51 25 58 47 37
1981 N A N A 19 7 73 72 43 N A N A JO 25
1 K 1 F rnr1 1 2 J d Mad R 1 V !lag 1 1 3 P rak Fa t y B y1 g P i 4 A ge Phll pp n F rm-1 V 1
1 N g t d d g t d e d t n
S CIAT D t F 1
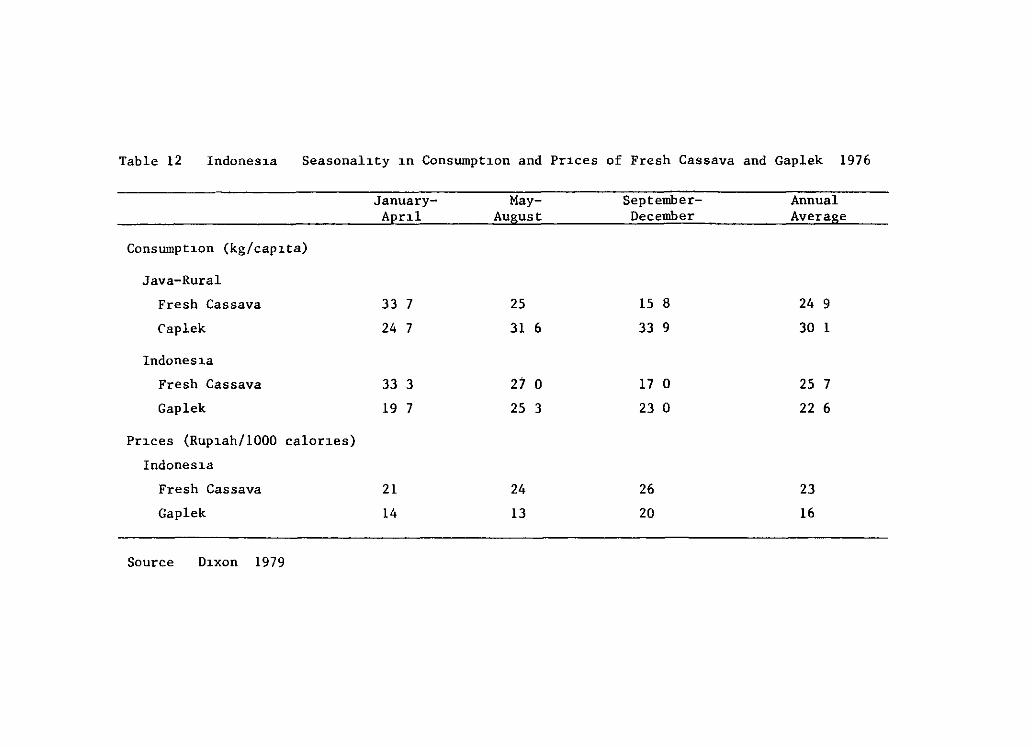
Table 12 Indones1a Seasonal1ty 1n Consurnpt1on and Pr1ces of Fresh Cassava and Gaplek 1976
Consurnpt1on (kg/cap1ta)
Java-Rural
Fresh Cassava
C'aplek
Indones1a
Fresh Cassava
Gaplek
Pr1ces (Rup1ah/1000 calor1es)
Indones1a
Fresh Cassava
Gap le k
So urce D1xon 1979
January- May- Septernber- Annual Apr1l August Decernber Average
33 7
24 7
33 3
19 7
21
14
25
31 6
27 o 25 3
24
13
15 8
33 9
17 o 23 o
26
20
24 9
30 1
25 7
22 6
23
16
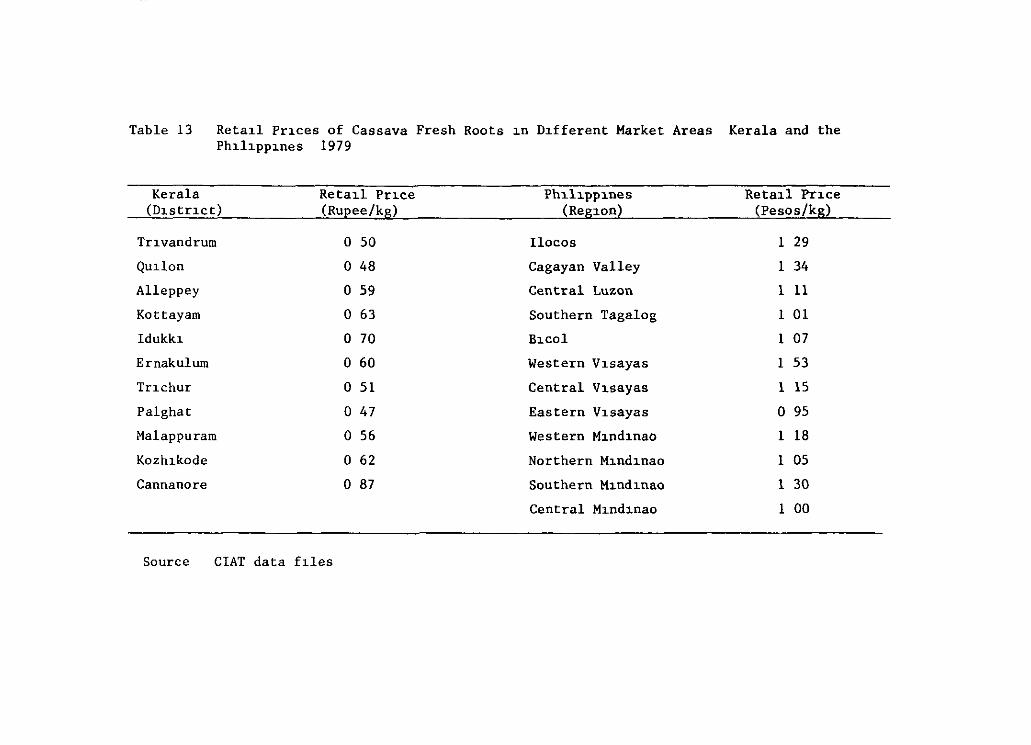
Table 13 Reta1l Pr1ces of Cassava Fresh Roots 1n D1fferent Market Areas Kerala and the Ph1l1pp1nes 1979
Kerala (D1stnct)
Tr1vandrum
Qu1lon
Alleppey
Kottayam
Idukk1
Ernakulum
Tnchur
Palghat
Malappuram
Kozh1kode
Cannanore
Reta1l Pr1ce Ph1l1pp1nes Reta1l Pr1ce (Rupee/kg) (Reg10n) (Pes()_sjl<g)
o 50 llocos 1 29
o 48 Cagayan Valley 1 34
o 59 Central Luzon 1 11
o 63 Southern Tagalog 1 01
o 70 B1C01 1 07
o 60 Western V1sayas 1 53
o 51 Central V1sayas 1 15
o 47 Eastern V1sayas o 95
o 56 Western M1nd1nao 1 18
o 62 Northern M1nd1nao 1 05
o 87 Southern M1nd1nao 1 30
Central M1nd1nao 1 00
Source CIAT data hles
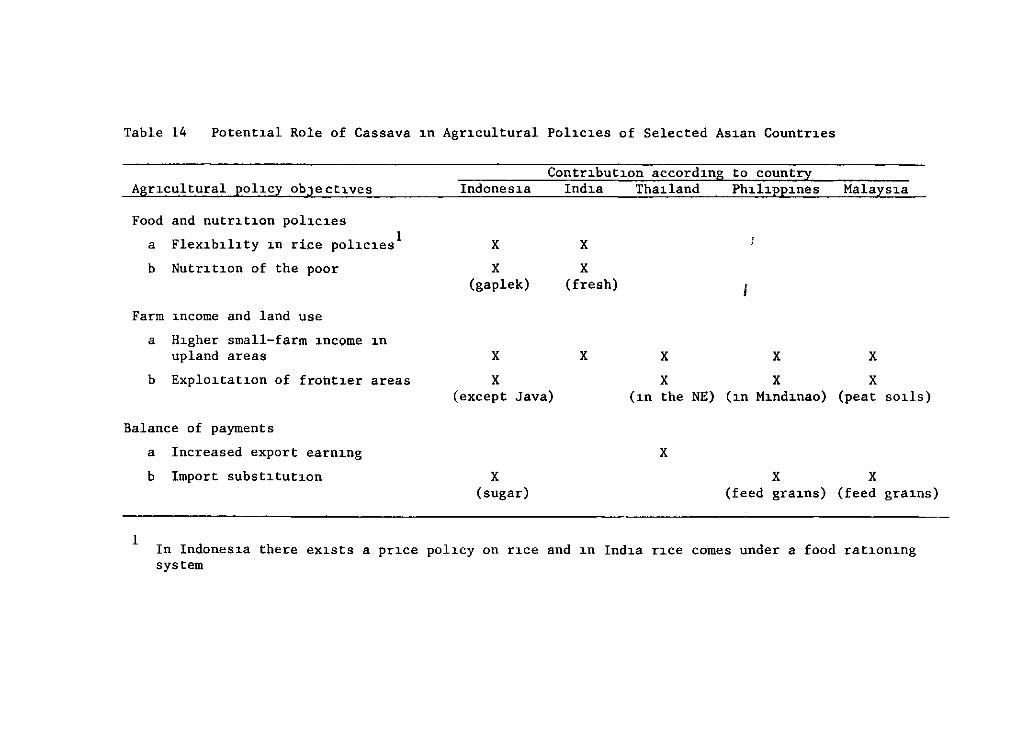
Table 14 Potent1al Role of Cassava 1n Agr1cultural Pol1c1es of Selected As1an Countr1es
Contr1but1on accord1ng to country Agr1cultural pol1cy ObJeCt1ves Indones1a Ind1a Tha1land Ph1l1pp1nes Malays1a
Food and nutr1t1on pol1c1es 1 a Flex1b1l1ty 1n rice pol1c1es
b Nutr1t1on of the poor
Farm 1ncome and land use
a H1gher small-farm 1nc0me 1n upland areas
b Explo1tat1on of froht1er areas
Balance of payments
a Increased export earn1ng
b Import subst1tut1on
X
X (gaplek)
X
X (except Java)
X (sugar)
X
X (fresh)
X X
X
1
X
X
X
X (1n the NE) (1n M1nd1nao) (peat so1ls)
X
X X (feed gra1ns) (feed gra1ns)
1 In Indones1a there ex1sts a pr1ce pol1cy on r1ce and 1n Ind1a r1ce comes under a food rat1on1ng system
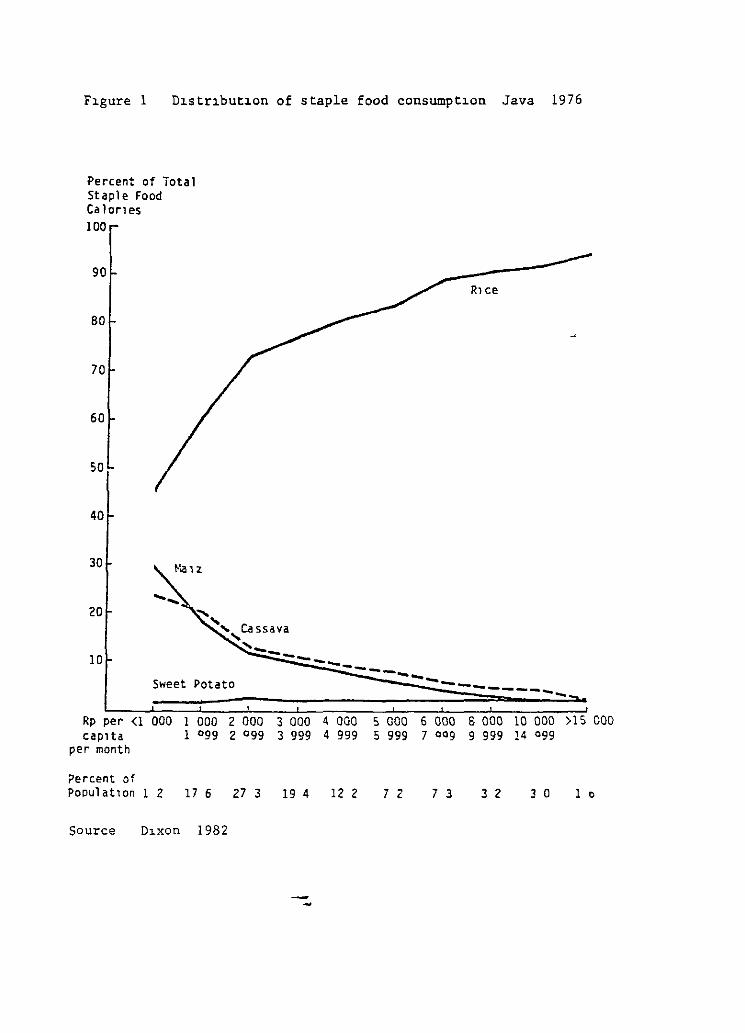
F~gure 1 D~str~but~on of staple food consumpt~on Java 1976
Percent of iotal Staple Food Calones 100
90
80
70
60
50
40
30 Han
....... 20 ~,
',Ca ssava ,_
R1ce
--JOL~~~:--~--~~~::=::::; ---... --Sweet Potato ---------
Rp per <1 000 B 000 10 000 >15 000 1 000 2 000 3 000 4 000 5 000 6 000 cap1 ta 1 099 2 099 3 999 4 999 S 999 7 009 9 999 14 099
per month
?ercent of Populat1on 1 2 17 6 27 3 19 4 12 2 7 2 7 3 3 2 3 o 1 o
So urce D1.xon 1982
--