Embed Size (px)
Citation preview
Michael WhiteheadSingapore – 23 September 2015
Global AgInvestingAsia 2015
“Assessing the Agricultural Investment Landscape in Asia & Oceania”

Page 2
Note: *GCC - *Gulf Cooperation of Council countries **Pacific Islands comprises of Guam, Solomon Islands, Fiji, Kiribati, Samoa, American Samoa, Cook Islands, Timor Leste, Tonga, Vanuatu and New Caledonia. Fiji operations comprises of Commercial/International Banking, Large Corporate & Institutional Banking, and Retail Banking & Wealth Management
KEY:Commercial/ International Banking
Large Corporate & Institutional Banking Private Banking
Retail Banking & Wealth Management
Partner Bank Representative Office
ANZ has an established regional network across 34 markets which include 15 Asian markets and representation in Europe, America and Middle East.
LAOS
VIETNAM
THAILAND
UAE(GCC*)
MYANMAR
MALAYSIA
SOUTH KOREA
JAPAN
HONG KONG
TAIWAN
UNITED STATES OF AMERICANew York
PHILIPPINES
INDONESIA
PAPUA NEW GUINEA
PACIFIC ISLANDS**
NEW ZEALAND
CHINA
SINGAPORE
AUSTRALIA
London
UNITED KINGDOM
ANZ Super Regional Network
INDIA
CAMBODIA
GERMANYFrankfurt
FRANCEParis
>2

Page 3
>3
ANZ – A Leader in Australian & New Zealand Agriculture
Deep experience and knowledge of the Agriculture sector
Key Commodity Expertise
• Dairy
• Protein
• Wine
• Oilseeds
ü Agricultural suppliers
ü Producers and growers
ü Storage and handling
ü Global trading houses
ü Transport and packing
ü 1st stage processing
ü 2nd stage processing
Supports all points of the value chain from ‘paddock to plate’
• Grains & Rice
• Cotton
• Sugar
• Forestry
> ANZ has been banking clients in the Agribusiness industry since 1886 and is the only Australian and New Zealand (NZ) bank with a specialist Institutional Agribusiness division
> ANZ is the No. 1 relationship bank in Australia and NZ in Agribusiness (Peter Lee survey)
> As the preferred bank to many of Australia and New Zealand’s largest trading houses, producers and exporters you can be confident we have the expertise and experience to help your business succeed
> In Australia ANZ has relationships throughout the value chain of the various agribusiness sectors:
ü ANZ’s customers process 3 out of 4 litres of Australian milk
ü 3 of the 5 largest beef producers and 5 out of 6 largest meat processors
ü 65% of grain export companies
ü 95% of Australian sugar export companies
ü 80% of Australian cotton export companies
> In NZ we bank:
ü 4 of largest dairy processors accounting for 95% of dairy products
ü 2 of the 4 largest meat processors
ü the 5 largest seafood companies
> We have led some of the biggest agribusiness transactions in Asia Pacific region in a rapidly consolidating industry
> Our Agribusiness team in Australia comprises more than 25 professionals from the industry along with specialists in the commodity and financial markets

Page 4
• Growing number of investment options
• Increased opportunities to improve liquidity
• New structures to suit new investors
• Familiarity with agri leading to direct investing and co-investing
• Requirement for capable management and good governance
Recent Trends in Agri Funding and Investment…
Page 5Source: Allens Agribusiness Survey
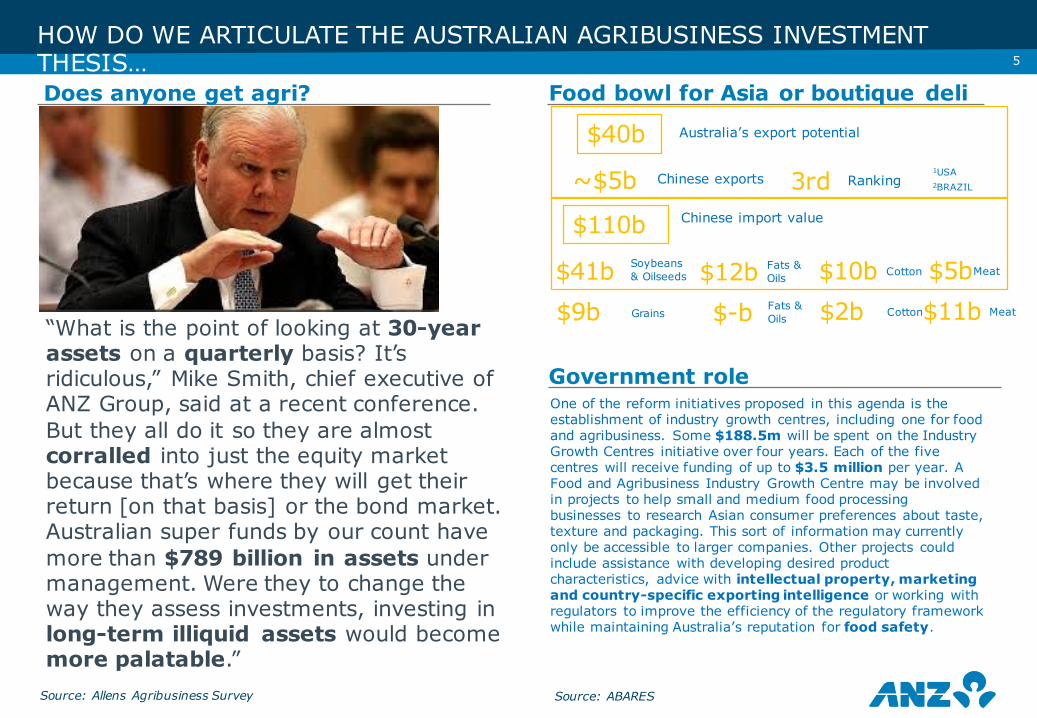
HOW DO WE ARTICULATE THE AUSTRALIAN AGRIBUSINESS INVESTMENT THESIS…Does anyone get agri?
$40b Australia’s export potential
~$5b Chinese exports 3rd Ranking
$110b Chinese import value
$41b Soybeans & Oilseeds $12b
Food bowl for Asia or boutique deli
“What is the point of looking at 30-year assets on a quarterly basis? It’s ridiculous,” Mike Smith, chief executive of ANZ Group, said at a recent conference. But they all do it so they are almost corralled into just the equity market because that’s where they will get their return [on that basis] or the bond market. Australian super funds by our count have more than $789 billion in assets under management. Were they to change the way they assess investments, investing in long-term illiquid assets would become more palatable.”
Government role
1USA2BRAZIL
Fats & Oils $10b Cotton $5bMeat
$9b Grains $-b Fats & Oils $2b Cotton$11b Meat
Source: ABARES
One of the reform initiatives proposed in this agenda is the establishment of industry growth centres, including one for food and agribusiness. Some $188.5m will be spent on the Industry Growth Centres initiative over four years. Each of the five centres will receive funding of up to $3.5 million per year. A Food and Agribusiness Industry Growth Centre may be involved in projects to help small and medium food processing businesses to research Asian consumer preferences about taste, texture and packaging. This sort of information may currently only be accessible to larger companies. Other projects could include assistance with developing desired product characteristics, advice with intellectual property, marketing and country-specific exporting intelligence or working with regulators to improve the efficiency of the regulatory framework while maintaining Australia’s reputation for food safety.
>5

Page 6
• Incoming Trends/Economic Drivers
Assessing The Agri Investment Landscape…
Page 7
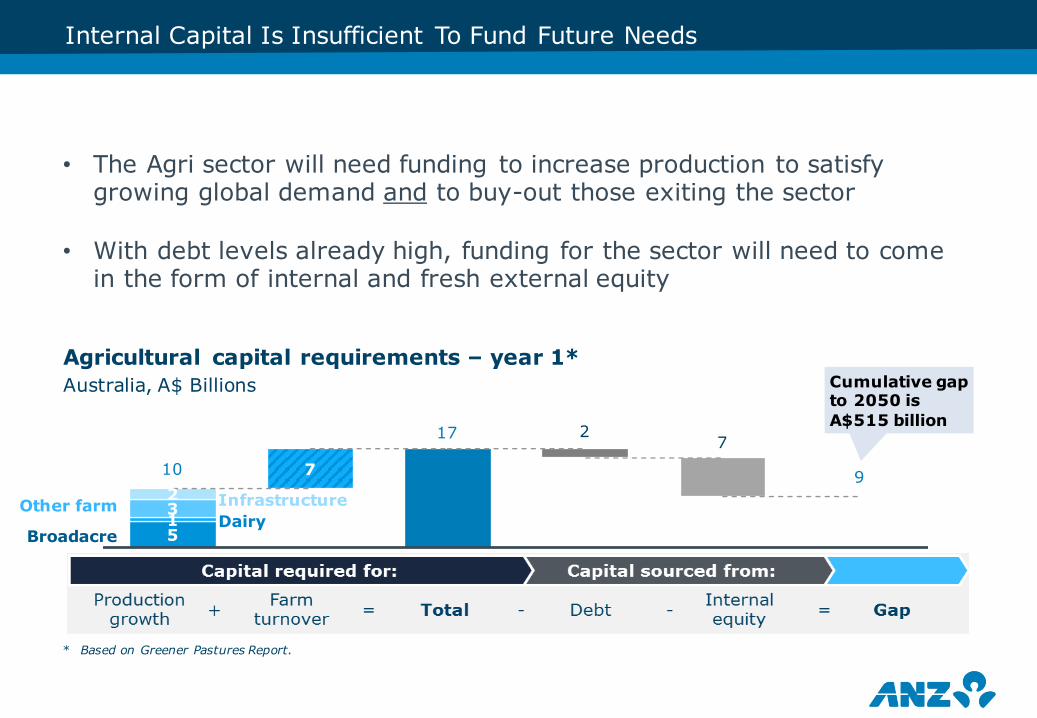
Internal Capital Is Insufficient To Fund Future Needs
5
7
132
17
910
Broadacre
Other farmDairyInfrastructure
72
Agricultural capital requirements – year 1* Australia, A$ Billions Cumulative gap
to 2050 is A$515 billion
* Based on Greener Pastures Report.
• The Agri sector will need funding to increase production to satisfy growing global demand and to buy-out those exiting the sector
• With debt levels already high, funding for the sector will need to come in the form of internal and fresh external equity

Page 8
>8
There Is Already A Global Race To Capture The Opportunity – Australia Is Making Progress
• Three years on from our report, we have seen positive developments:
• FTA’s with key markets • increasing capital options and • recognition that foreign equity is good for the sector
• For shorter-term success the industry must be focussed particularly on:
• increasing farm productivity • a focus on high value/ high growth sectors • greater supply chain efficiency• Building links with key markets and operators
Page 9
>9
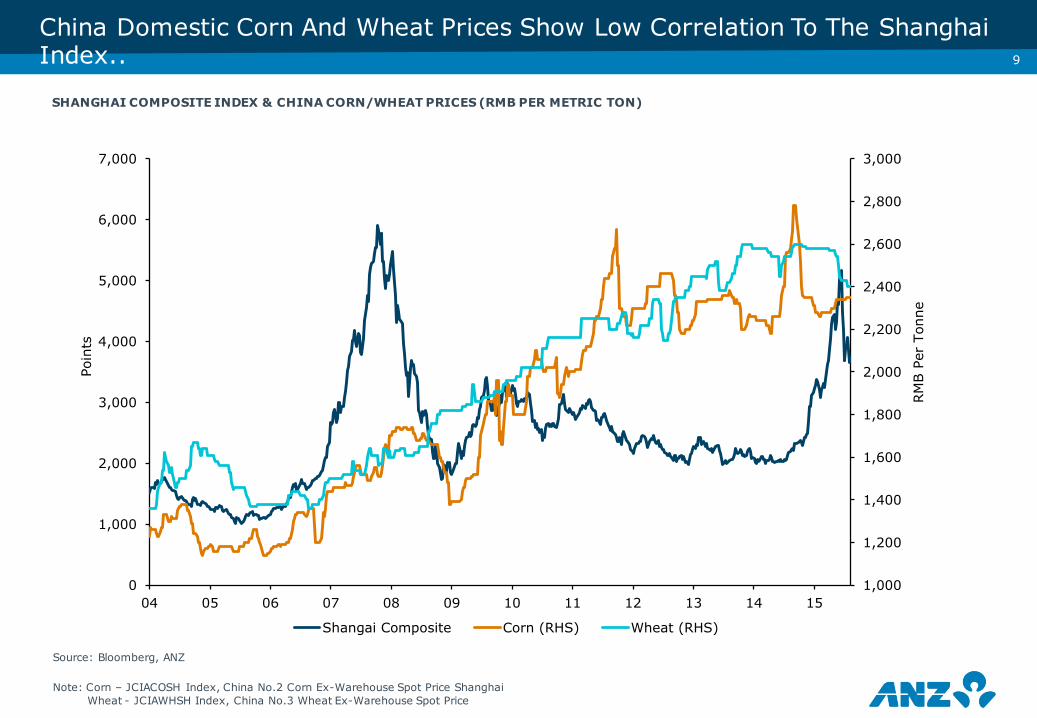
China Domestic Corn And Wheat Prices Show Low Correlation To The Shanghai Index..
Source: Bloomberg, ANZ
SHANGHAI COMPOSITE INDEX & CHINA CORN/WHEAT PRICES (RMB PER METRIC TON)
Note: Corn – JCIACOSH Index, China No.2 Corn Ex-Warehouse Spot Price ShanghaiWheat - JCIAWHSH Index, China No.3 Wheat Ex-Warehouse Spot Price
1,000
1,200
1,400
1,600
1,800
2,000
2,200
2,400
2,600
2,800
3,000
0
1,000
2,000
3,000
4,000
5,000
6,000
7,000
04 05 06 07 08 09 10 11 12 13 14 15
Shangai Composite Corn (RHS) Wheat (RHS)
Poin
ts
RM
B P
er T
onne

Page 10
>10
-
20
40
60
80
100
120
140
2003 2005 2007 2009 2011 2013 2015E
Foreign Investment in China Outward FDI
Between 2003-14, ODI increased at 39.3% per annum when compared to the inward investment which experienced a CAGR of 7.6%
In 2013, total Chinese outward FDI crossed US$ 100bn and increased by 11% yoy in 2014
China has become a net capital provider to the world in 2014…USD billions
1,539
16,200
8,549
3,916
9,401 10,105
9,185 8,351
2007 2008 2009 2010 2011 2012 2013 2014
In 2013-14, China is the 5th largest investor in Australia after US, UK, Japan, Netherlands…USD billions
Slowdown in the mining and energy sector investment led to fall in overall china investment in Australia in 2014
Australian real estate sector attracted the major funds in 2014...AUD m
4,372
2,025
1,101
992
667
165
140
46%
21%
12%
10%
7%
2%
1%
Commercial real estate
Infrastructure
Leisure and retail
Mining
Energy (oil & gas)
Manufacturing
Agribusiness
Agribusiness is estimated to have received $140m in 2014. But with ChAFTA in place, deal activity is expected to increase in the sector
China Investment – More To Come?
Source: KPMG, E&Y, ANZ

Page 11
1.51.8
1.7
3.8
2015 2020
Low Speed High Speed
>11
Urban household consumption remains strong, with increasing protein intake…
‘High speed’ consumers may account for 90% of growth in household consumption in future..Urban private consumption, USD trillions
Source: BCG
High Speed consumers consisting middle class and above are estimated to account for US$2.1tr of the total anticipated growth in urban consumption
Low Speed
Consumers
High Speed
Consumers
Emergence Of A New Segment In Urban Consumers Called ‘High Speed’ Consumers
Source: National Bureau of Statistics China, ANZ
Page 12
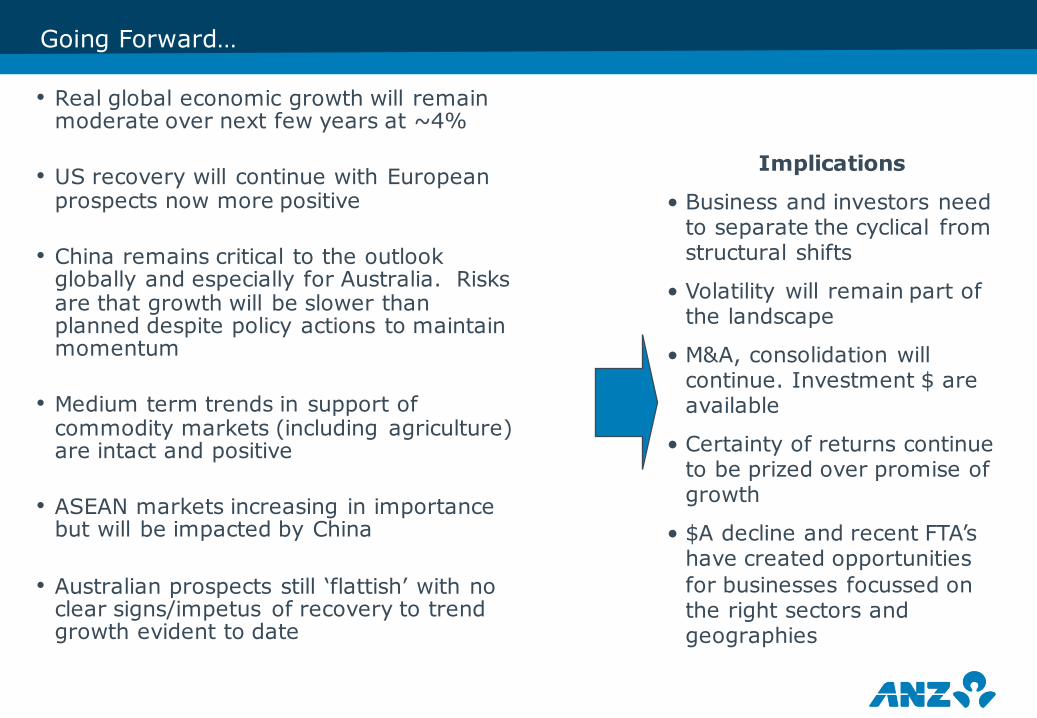
Going Forward…
• Real global economic growth will remain moderate over next few years at ~4%
• US recovery will continue with European prospects now more positive
• China remains critical to the outlook globally and especially for Australia. Risks are that growth will be slower than planned despite policy actions to maintain momentum
• Medium term trends in support of commodity markets (including agriculture) are intact and positive
• ASEAN markets increasing in importance but will be impacted by China
• Australian prospects still ‘flattish’ with no clear signs/impetus of recovery to trend growth evident to date
Implications
• Business and investors need to separate the cyclical from structural shifts
• Volatility will remain part of the landscape
• M&A, consolidation will continue. Investment $ are available
• Certainty of returns continue to be prized over promise of growth
• $A decline and recent FTA’s have created opportunities for businesses focussed on the right sectors and geographies

Page 13
• Rising Chinese wages seeing “Factory Asia” drifting south into the ASEAN
• India and Indonesia moving to large, young working-age populations
• ASEAN and India transitioning from uncertain agricultural income to more certain manufacturing income, boosting demand for goods, especially protein
• As increased Asian manufacturing strains inefficient electricity grids, alternative energies and bio-fuels become more important
• Current low hard/energy commodity prices offers opportunity to invest in soft commodity development at lower cost…cheaper energy to clear fields, cheaper fertilisers, etc.
Urban Population – ASEAN vs Aust/NZ
Economically Active Population
70
72
74
76
78
80
82
84
86
88
15
20
25
30
35
40
45
50
55
60 70 80 90 00 10
Urban population (% of Total) Ur
ban
Popu
latio
n (%
of T
otal
)
ASEAN World New Zealand, RHS
Activity Will Relocate Out Of China And Drive Income Formation And Consumption Elsewhere In Asia

Page 14
>14>14
ASEAN Emerging As A Major Economic Force And A Driver Of Global Growth1
Real GDP growth(CAGR 2013-19F, %)
10
6
4
0
< $5,000
$5,000 - $10,000
> $10,000
GDP per capita, 2013, PPP
Population 2013, BillionPopulation above 15 yearsMedian Age
KEY
10.03
GDP in USD Trillion
Economic Growth (2013-18F)
Share of World GDP (%)
Economic growth in the ASEAN region is projected to be double that of developed countries during the 2013 - 2018 period
-
5
10
15
20
25
30
35
2005 2010 2015 2020 2025
ASEAN US EU Japan China
Note 1: For detailed statistics on each ASEAN Countries, Australia & New Zealand refer: Appendix ISource: IMF, Euromonitor, CIA, ASEAN Secretariat, Nielsen, ADB, World Bank, McKinsey, WTO & ANZ Analysis
1.8%2.2%
2.6% 2.8% 2.9%
5.6%
6.4%6.8%
EU Brazil USA NZ Australia ASEAN India ChinaMalaysia, GDP: $0.31
6.8%1.36
China, GDP: $9.50
1.24
India, GDP: $1.88
5.2%0.03
5.7%
Vietnam, GDP: $0.17
0.09
Philippines, GDP: $0.27
0.103.8%
Thailand, GDP: $0.39
0.07
5.7%
Indonesia, GDP: $0.87
0.25
37
27
82.0%
70.9%
65.8%24
71.1%29
77.3%29
73.9%28
81.9%36
6.4%
6.1%
3.0% 0.00584.0%34
Singapore, GDP: $0.30
3.0% 0.0281.0%38
Australia, GDP: $1.5
2.7% 0.00580.0%38
New Zealand, GDP: $0.02
Page 15
>15
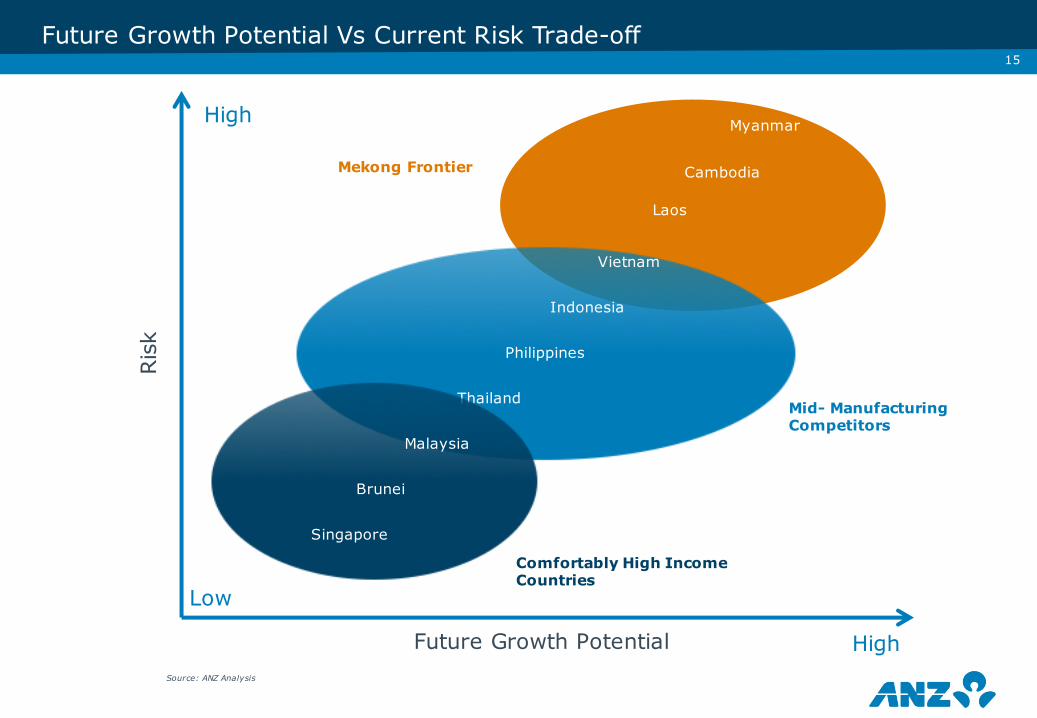
Future Growth Potential Vs Current Risk Trade-off
Ris
k
Future Growth Potential
High
High
Low
Thailand
Philippines
Indonesia
Vietnam
Laos
Cambodia
Myanmar
Mekong Frontier
Mid- Manufacturing Competitors
Comfortably High Income Countries
Brunei
Singapore
Malaysia
Source: ANZ Analysis
Page 16
• How much of the investment focus is on each region?
Assessing the Agri Investment Landscape…
Page 17
>17
• Looking at capital flows into Agri, it’s important to examine the wider economic context
• Build-up of global liquidity – investment funds looking toward global Agri to bring balance to their portfolios and to increase returns in a low interest rate environment
• Offshore industry players consolidating supply, extending market reach and diversifying seasonal/climatic exposure
• Individuals seeking alternative investments
• Small % of global funds but large $ finding their way towards Australia
• Analysis of the world’s largest Agri funds shows around 13% of the $40b invested and raised in Agri was allocated to Australia
• Australian Agri sector remains quite fragmented with few larger players (of global scale). Many investors are seeking large opportunities with an estimate 90% allocated to pastoral ventures
• Smaller players are often less investment ready – structure, understanding of trade-offs and market/investor expectations
Capital Flows Have Increased
Page 18
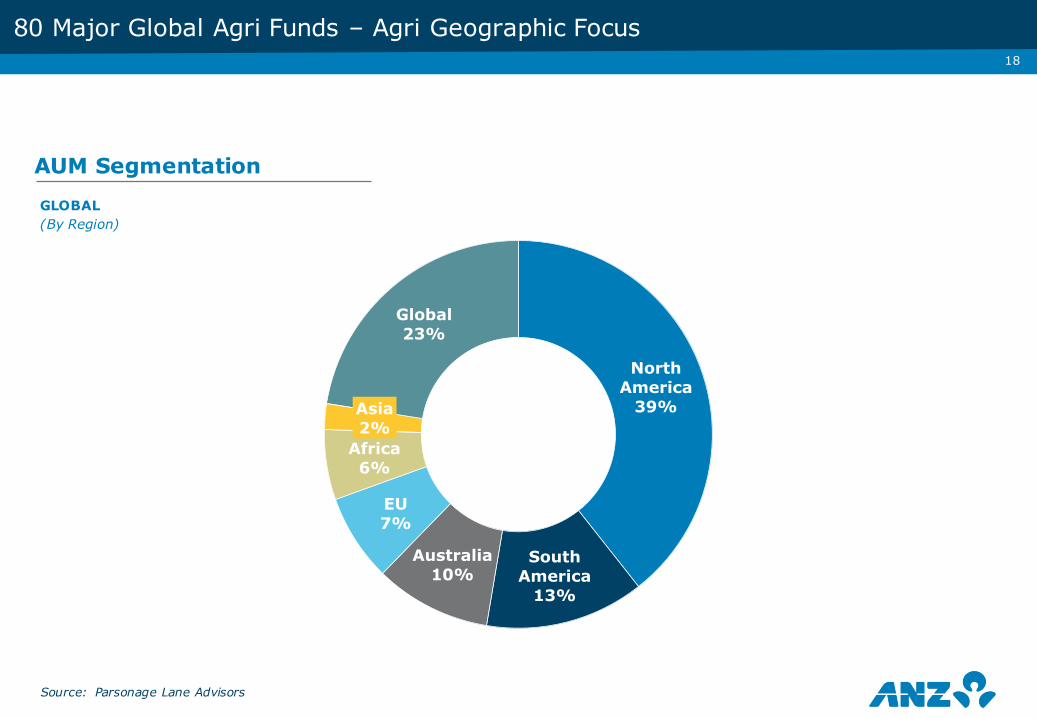
North America
39%
South America
13%
Australia10%
EU7%
Africa6%
Asia2%
Global23%
Source: Parsonage Lane Advisors
GLOBAL(By Region)
AUM Segmentation
>18
80 Major Global Agri Funds – Agri Geographic Focus
Page 19
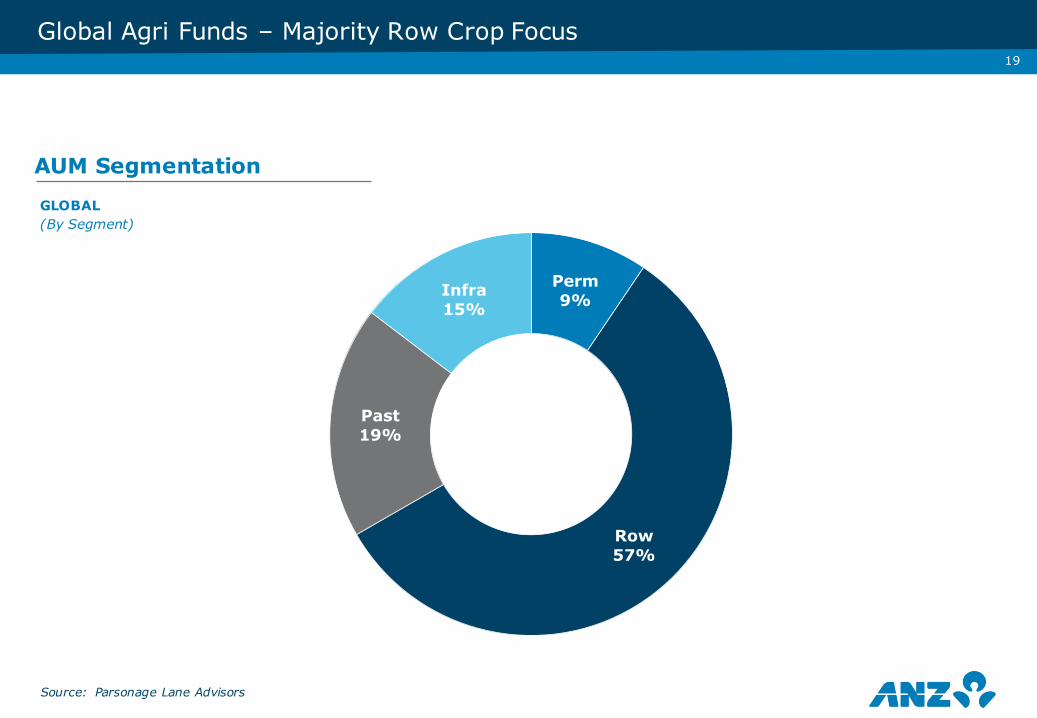
Perm9%
Row57%
Past19%
Infra15%
GLOBAL(By Segment)
AUM Segmentation
>19
Global Agri Funds – Majority Row Crop Focus
Source: Parsonage Lane Advisors

Page 20
Perm8% Row
4%
Past88%
AUSTRALIA(By Segment)
AUM Segmentation
>20
Capital Focus In Australia - Mainly On Pastoral
Source: Parsonage Lane Advisors
Page 21
• How do the different sectors compare in each space?
Assessing the Agri Investment Landscape…

Page 22
-
10%
20%
30%
40%
<$50 $50-$99 $100-$199 $200-$499 $500-$999 $1,000+
(USD '000)
461 341 270
520
1,200
89 133
-
10
20
30
40
NSW Vic Qld SA WA Tas NTNo. of farms ('000) Avg. Farm Size (ha)
-
6%
12%
18%
24%
15-24 25-34 35-44 45-54 55-64 65 +
Farmers and Farm Managers Employed Total
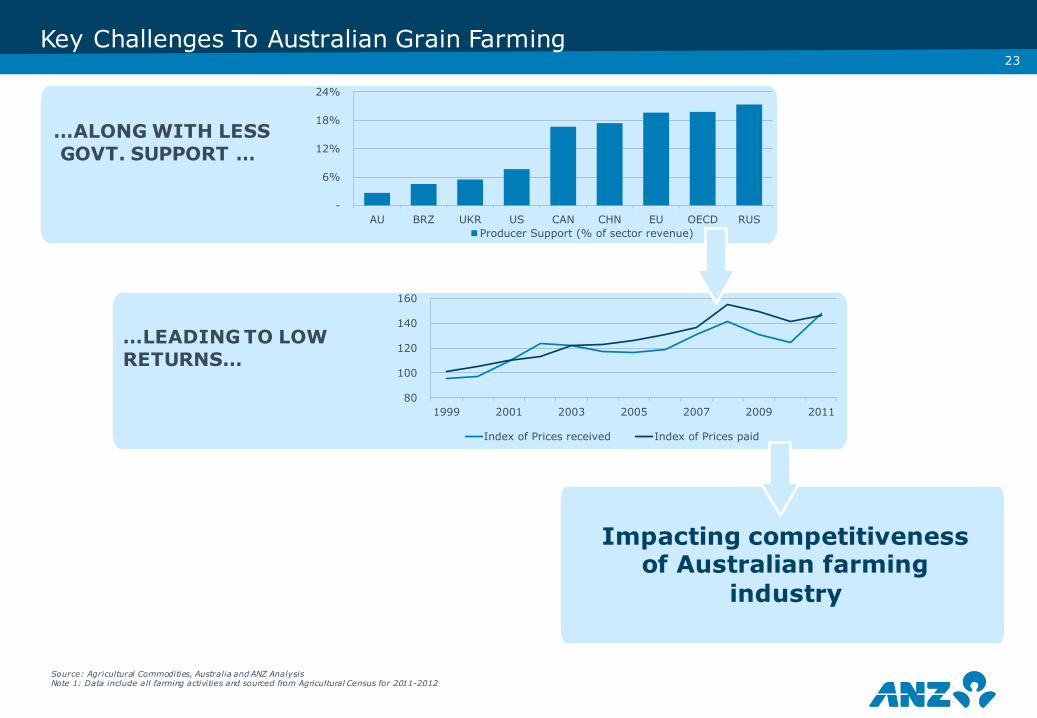
22Key Challenges To Australian Grain Farming
AGEING AUSTRALIAN FARMERS…
Source: Agricultural Commodities, Australia and ANZ AnalysisNote 1: Data include all farming activities and sourced from Agricultural Census for 2011-2012
SMALL FARM SIZES…
…LOW TURNOVERS…
Page 23
-
6%
12%
18%
24%
AU BRZ UKR US CAN CHN EU OECD RUSProducer Support (% of sector revenue)
80
100
120
140
160
1999 2001 2003 2005 2007 2009 2011
Index of Prices received Index of Prices paid
>23Key Challenges To Australian Grain Farming
…ALONG WITH LESSGOVT. SUPPORT …
Source: Agricultural Commodities, Australia and ANZ AnalysisNote 1: Data include all farming activities and sourced from Agricultural Census for 2011-2012
…LEADING TO LOW RETURNS…
Impacting competitiveness of Australian farming
industry
Page 24Source: Allens Agribusiness Survey, Dec 2014
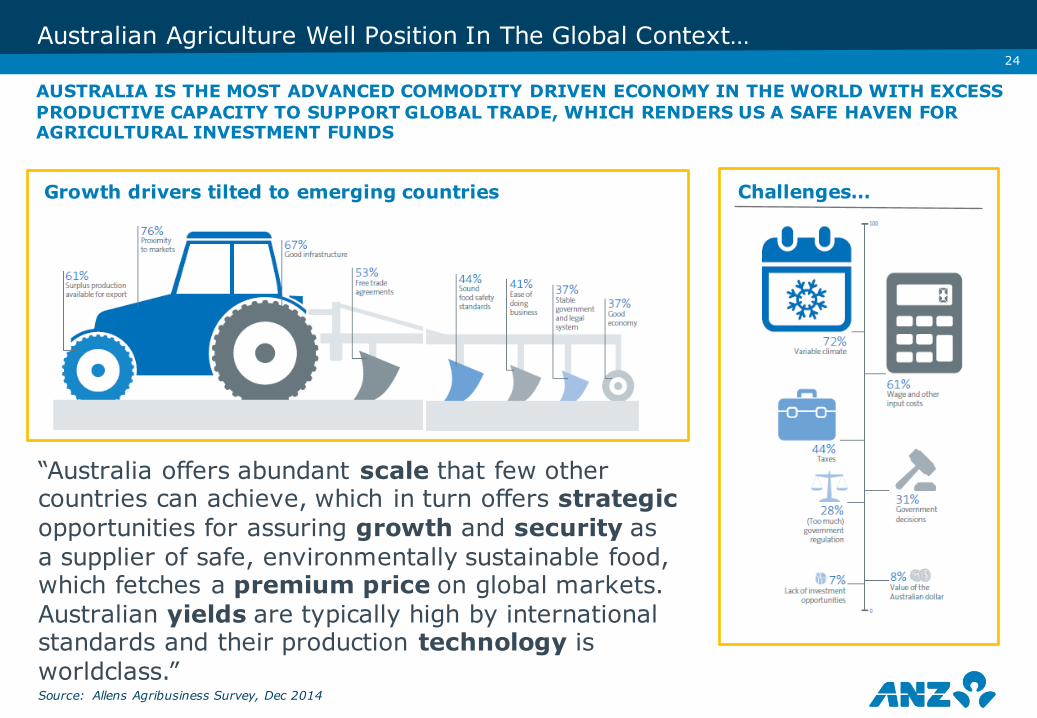
Australian Agriculture Well Position In The Global Context…
AUSTRALIA IS THE MOST ADVANCED COMMODITY DRIVEN ECONOMY IN THE WORLD WITH EXCESS PRODUCTIVE CAPACITY TO SUPPORT GLOBAL TRADE, WHICH RENDERS US A SAFE HAVEN FOR AGRICULTURAL INVESTMENT FUNDS
Growth drivers tilted to emerging countries Challenges…
“Australia offers abundant scale that few othercountries can achieve, which in turn offers strategicopportunities for assuring growth and security as a supplier of safe, environmentally sustainable food,which fetches a premium price on global markets.Australian yields are typically high by internationalstandards and their production technology is worldclass.”
>24
Page 25
• Sector by sector…
Assessing the Agri Investment Landscape…
Page 26
26
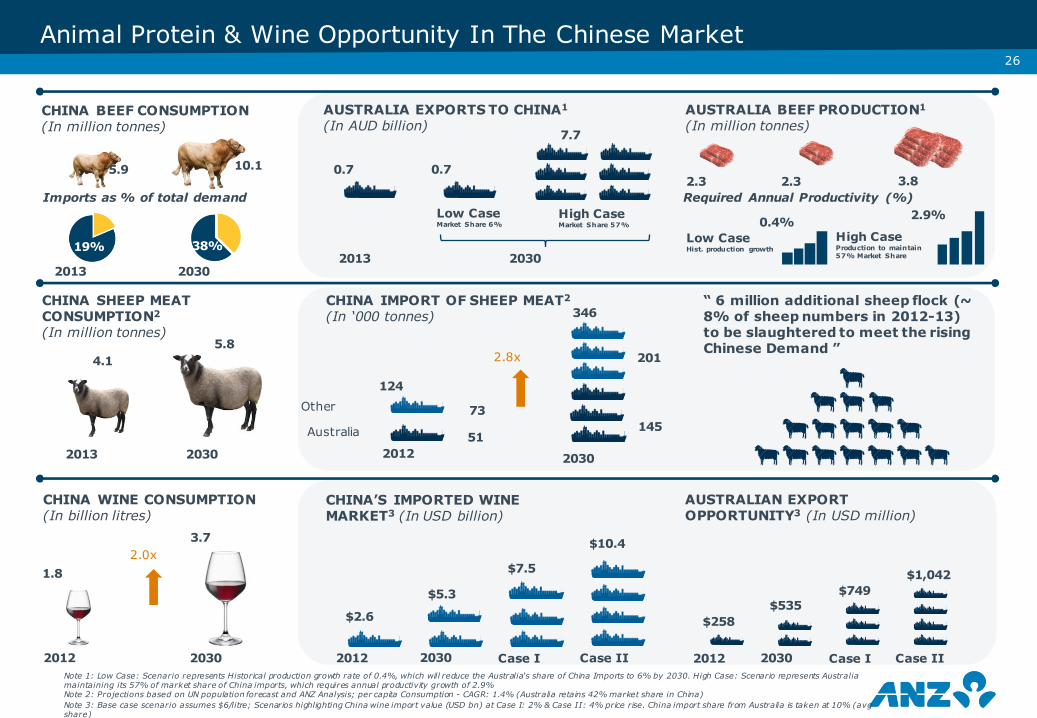
Animal Protein & Wine Opportunity In The Chinese Market
Note 1: Low Case: Scenario represents Historical production growth rate of 0.4%, which will reduce the Australia's share of China Imports to 6% by 2030. High Case: Scenario represents Australia maintaining its 57% of market share of China imports, which requires annual productivity growth of 2.9%Note 2: Projections based on UN population forecast and ANZ Analysis; per capita Consumption - CAGR: 1.4% (Australia retains 42% market share in China) Note 3: Base case scenario assumes $6/litre; Scenarios highlighting China wine import value (USD bn) at Case I: 2% & Case II: 4% price rise. China import share from Australia is taken at 10% (avg share)
Case I 2012 Case I Case II
CHINA WINE CONSUMPTION(In billion litres)
2012
1.8
2030
3.7
CHINA’S IMPORTED WINE MARKET3 (In USD billion)
$2.6
$5.3
2012 2030 Case II 2030
$7.5
$10.4
AUSTRALIAN EXPORT OPPORTUNITY3 (In USD million)
$258$535
$749$1,042
2.0x
CHINA SHEEP MEAT CONSUMPTION2
(In million tonnes)
2013 2030
CHINA IMPORT OF SHEEP MEAT2
(In ‘000 tonnes)“ 6 million additional sheep flock (~ 8% of sheep numbers in 2012-13) to be slaughtered to meet the rising Chinese Demand ”
Australia
Other
4.15.8
2012 2030
51
73
124
145
201
346
CHINA BEEF CONSUMPTION(In million tonnes)
5.9 10.1
Imports as % of total demand
19% 38%
7.7
0.70.7
Low CaseMarket Share 6%
High CaseMarket Share 57%
2013 2030
AUSTRALIA EXPORTS TO CHINA1
(In AUD billion)
Low CaseHist. production growth
0.4% 2.9%
High CaseProduction to maintain57% Market Share
AUSTRALIA BEEF PRODUCTION1
(In million tonnes)
2.3 3.82.3Required Annual Productivity (%)
2.8x
2013 2030

Page 27
27
Dairy Industry Opportunity In The Chinese Market
Note 1: Projections based on the assumption that China imports proportion of consumption will be at 2013 level (WMP=32%, SMP=78%, Cheese= 16%)Note 2: Projections based on the assumption that China imports from Australia as a proportion of total imports will be at 2013 level (WMP=2%, SMP=4%, Cheese= 20%)Note 3: Estimates based on constant per capita consumptionNote 4: Estimates based on ANZ projections (WMP: 2.6%, SMP: 3.0% & Cheese: 3.7%)Note 5: Export opportunity for Australia based on 2013 export prices
WHOLE MILK POWDER (WMP) CONSUMPTION (In million tonnes)
WMP IMPORTS1 (In ’000 tonnes) WMP IMPORTS FROM AUSTRALIA2,5
(In ’000 tonnes & AUD m)
1.8 1.92.8
20302013
Low Case3 High Case4
559
597877
20302013
Low Case3 High Case4
20302013
Low Case3 High Case4
12.113.0
19.0
SKIM MILK POWDER (SMP) CONSUMPTION (In ‘000 tonnes)
SMP IMPORTS1 (In ’000 tonnes) SMP IMPORTS FROM AUSTRALIA2,5
(In ’000 tonnes & AUD m)
267285
455
20302013
Low Case3 High Case4
210
224357
20302013
Low Case3 High Case4
20302013
Low Case3 High Case4
9.410.0
16.0
CHEESE CONSUMPTION (In ‘000 tonnes)
CHEESE IMPORTS1
(In ’000 tonnes)CHEESE IMPORTS FROM AUSTRALIA2,5
(In ’000 tonnes & AUD m)
310331 608
20302013
Low Case3 High Case4
51
54100
20302013
Low Case3 High Case4
20302013
Low Case3 High Case4
10.411.1
20.4
$3.8
$31.6
$55.7
$35.5
$2.4
$24.9
$44.0
$3.0
$42.4
Page 28
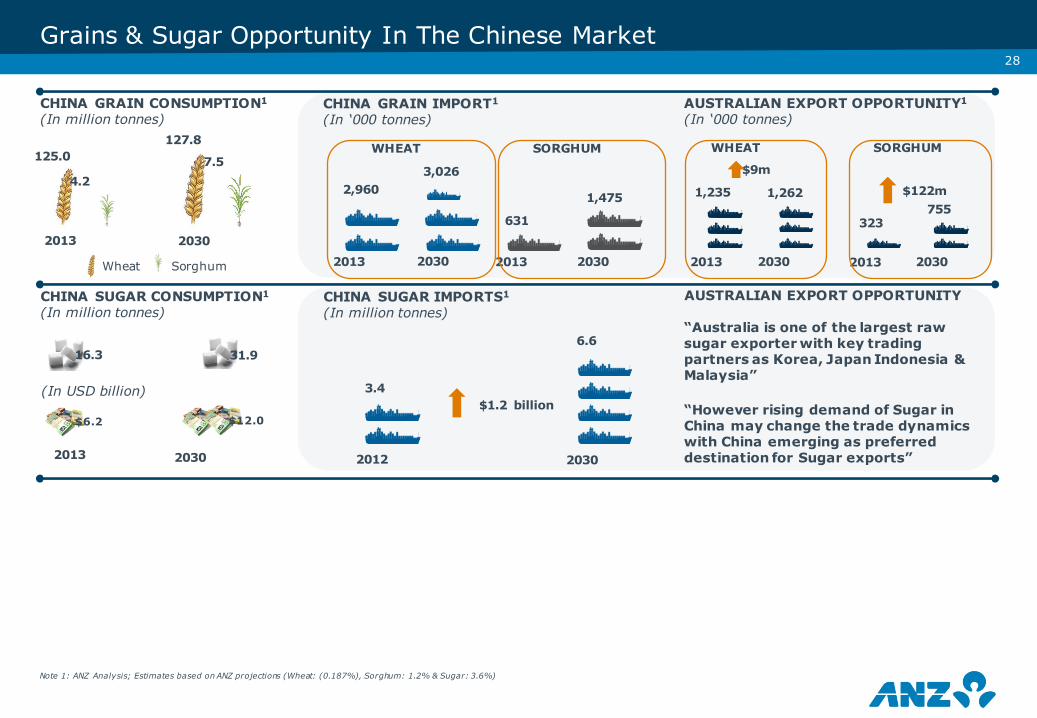
28
Grains & Sugar Opportunity In The Chinese Market
Note 1: ANZ Analysis; Estimates based on ANZ projections (Wheat: (0.187%), Sorghum: 1.2% & Sugar: 3.6%)
CHINA GRAIN CONSUMPTION1
(In million tonnes)
2013 2030
CHINA GRAIN IMPORT1
(In ‘000 tonnes)
2,9603,026
2013 2030 2013 2030 2013 2030 2013 2030
631
1,475
AUSTRALIAN EXPORT OPPORTUNITY1
(In ‘000 tonnes)
1,235 1,262
323755
CHINA SUGAR CONSUMPTION1
(In million tonnes)
2013 2030
CHINA SUGAR IMPORTS1
(In million tonnes)
3.4
2012 2030
6.6
AUSTRALIAN EXPORT OPPORTUNITY
125.0127.8
4.27.5
$122m
$9m
WHEAT SORGHUM WHEAT SORGHUM
$6.2 $12.0
16.3 31.9
(In USD billion)$1.2 billion
“Australia is one of the largest raw sugar exporter with key trading partners as Korea, Japan Indonesia & Malaysia”
“However rising demand of Sugar in China may change the trade dynamics with China emerging as preferred destination for Sugar exports”
Wheat Sorghum
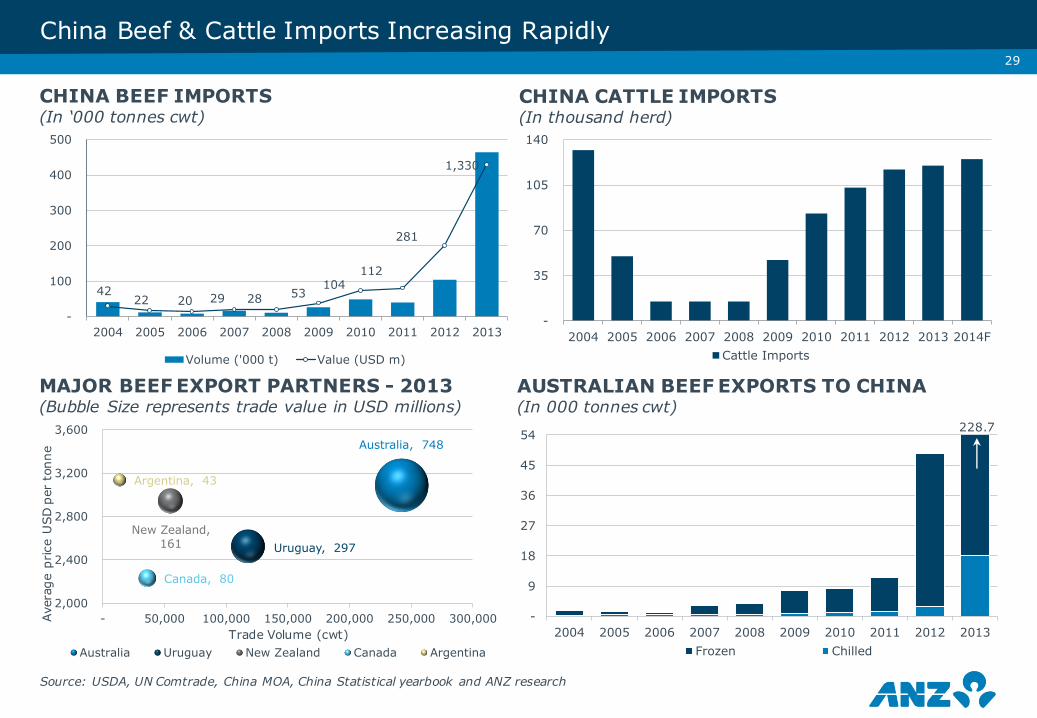
Page 29
China Beef & Cattle Imports Increasing RapidlyAv
erag
e pr
ice
USD
per
ton
ne
Trade Volume (cwt)
228.7
CHINA BEEF IMPORTS(In ‘000 tonnes cwt)
CHINA CATTLE IMPORTS(In thousand herd)
MAJOR BEEF EXPORT PARTNERS - 2013(Bubble Size represents trade value in USD millions)
AUSTRALIAN BEEF EXPORTS TO CHINA(In 000 tonnes cwt)
Source: USDA, UN Comtrade, China MOA, China Statistical yearbook and ANZ research
42 22 20 29 28 53
104 112
281
1,330
-
100
200
300
400
500
2004 2005 2006 2007 2008 2009 2010 2011 2012 2013
Volume ('000 t) Value (USD m)
-
35
70
105
140
2004 2005 2006 2007 2008 2009 2010 2011 2012 2013 2014FCattle Imports
Australia, 748
Uruguay, 297 New Zealand,
161
Canada, 80
Argentina, 43
2,000
2,400
2,800
3,200
3,600
- 50,000 100,000 150,000 200,000 250,000 300,000
Australia Uruguay New Zealand Canada Argentina
-
9
18
27
36
45
54
2004 2005 2006 2007 2008 2009 2010 2011 2012 2013Frozen Chilled
29
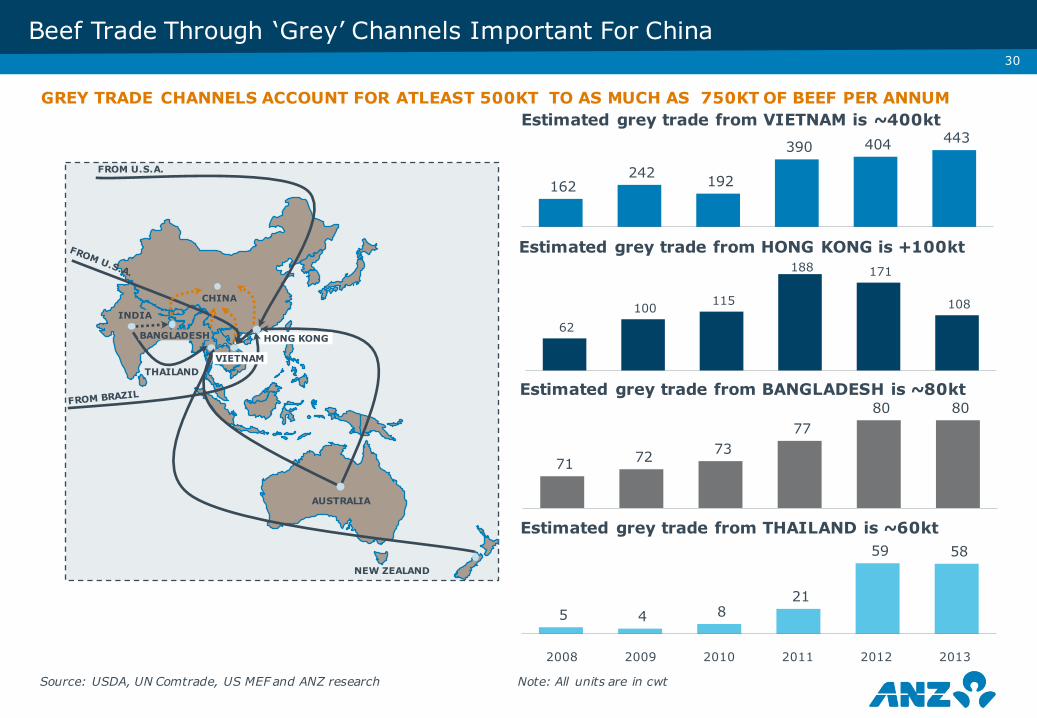
Page 30
Beef Trade Through ‘Grey’ Channels Important For China
GREY TRADE CHANNELS ACCOUNT FOR ATLEAST 500KT TO AS MUCH AS 750KT OF BEEF PER ANNUM
THAILAND
INDIA
AUSTRALIA
NEW ZEALAND
HONG KONG
CHINA
FROM U.S.A.
VIETNAM
BANGLADESH
Note: All units are in cwtSource: USDA, UN Comtrade, US MEF and ANZ research
Estimated grey trade from VIETNAM is ~400kt
Estimated grey trade from HONG KONG is +100kt
162 242 192
390 404 443
62 100 115
188 171
108
Estimated grey trade from BANGLADESH is ~80kt
71 72 73 77
80 80
Estimated grey trade from THAILAND is ~60kt
5 4 8 21
59 58
2008 2009 2010 2011 2012 2013
30
Page 31
-
2,000
4,000
6,000
8,000
10,000
12,000
14,000
16,000
2007 2010 2013 2016 2019 2022 2025 2028
Live Cattle Imports In Feedlots Progeny Indonesian Breeding Cattle Herd
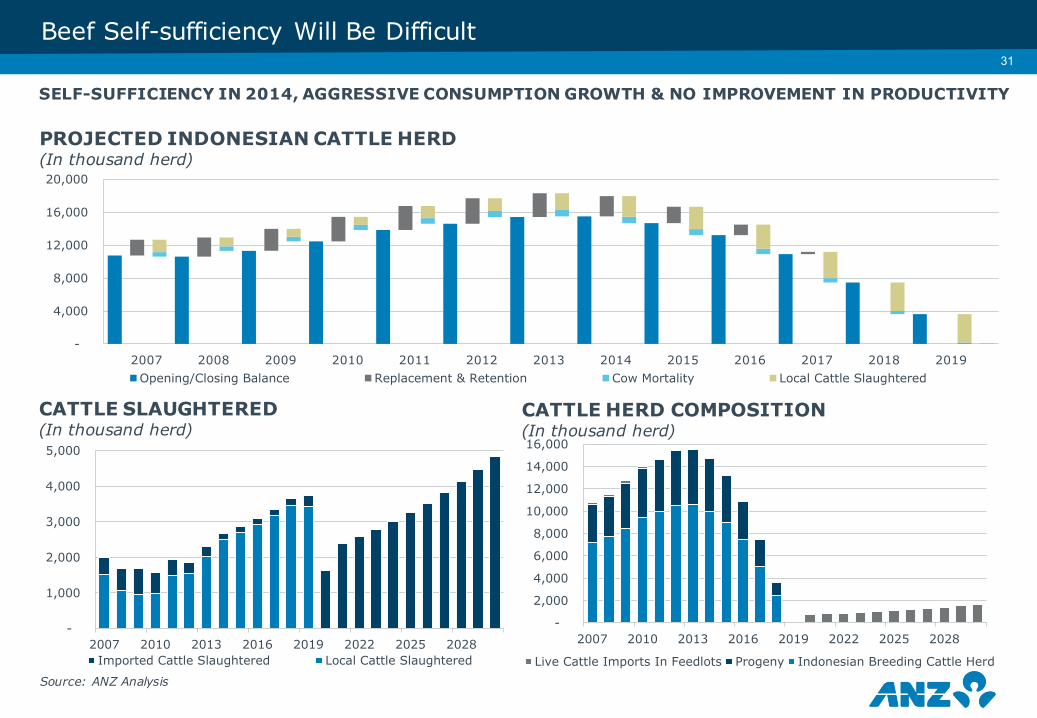
Beef Self-sufficiency Will Be Difficult
SELF-SUFFICIENCY IN 2014, AGGRESSIVE CONSUMPTION GROWTH & NO IMPROVEMENT IN PRODUCTIVITY
>31
PROJECTED INDONESIAN CATTLE HERD(In thousand herd)
CATTLE SLAUGHTERED (In thousand herd)
CATTLE HERD COMPOSITION (In thousand herd)
-
4,000
8,000
12,000
16,000
20,000
Opening/Closing Balance Replacement & Retention Cow Mortality Local Cattle Slaughtered2007 2008 2009 2010 2011 2012 2013 2014 2015 2016 2017 2018 2019
-
1,000
2,000
3,000
4,000
5,000
2007 2010 2013 2016 2019 2022 2025 2028Imported Cattle Slaughtered Local Cattle Slaughtered
Source: ANZ Analysis
Page 32
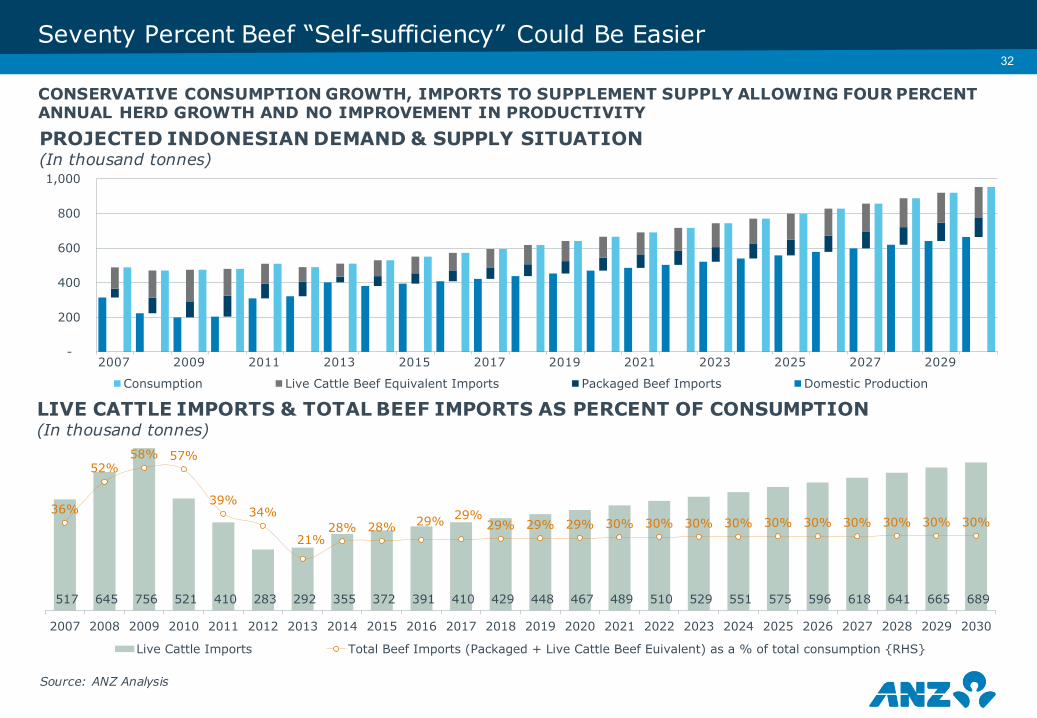
517 645 756 521 410 283 292 355 372 391 410 429 448 467 489 510 529 551 575 596 618 641 665 689
36%
52%58% 57%
39%34%
21%28% 28% 29% 29%
29% 29% 29% 30% 30% 30% 30% 30% 30% 30% 30% 30% 30%
2007 2008 2009 2010 2011 2012 2013 2014 2015 2016 2017 2018 2019 2020 2021 2022 2023 2024 2025 2026 2027 2028 2029 2030
Live Cattle Imports Total Beef Imports (Packaged + Live Cattle Beef Euivalent) as a % of total consumption {RHS}
CONSERVATIVE CONSUMPTION GROWTH, IMPORTS TO SUPPLEMENT SUPPLY ALLOWING FOUR PERCENT ANNUAL HERD GROWTH AND NO IMPROVEMENT IN PRODUCTIVITY
Seventy Percent Beef “Self-sufficiency” Could Be Easier>32
PROJECTED INDONESIAN DEMAND & SUPPLY SITUATION(In thousand tonnes)
LIVE CATTLE IMPORTS & TOTAL BEEF IMPORTS AS PERCENT OF CONSUMPTION(In thousand tonnes)
-
200
400
600
800
1,000
Consumption Live Cattle Beef Equivalent Imports Packaged Beef Imports Domestic Production
2007 2009 2011 2013 2015 2017 2019 2021 2023 2025 2027 2029
Source: ANZ Analysis

Page 33
>33Vietnam - Strong Consumption Increases Import Dependency
Vietnam Meat Consumption Per CapitaIn Kilograms
Vietnam Herd Size
-
10
20
30
40
50
60
2005 2006 2007 2008 2009 2010 2011 2012 2013 2014 2015
Beef Pork Chicken Lamb
-
2,000
4,000
6,000
8,000
10,000
12,000
2005 2006 2007 2008 2009 2010 2011 2012 2013
Beef Buffalo
Vietnam Beef Imports forecastBubble size represent the cumulative imports from 2015-23 in thousands cwt
Korea,3,218
China,4,623
Indonesia, 1,356
Malaysia, 1,889
Philippines, 1,977
Vietnam, 6,068
-
2.0%
4.0%
6.0%
8.0%
10.0%
12.0%
1.0% 1.5% 2.0% 2.5% 3.0% 3.5% 4.0%
Imp
ort
s C
AG
R (
20
15
-20
23
)
Consumption CAGR (2015-2023)
S Korea China Indonesia Malaysia Philippines Viet NamSource: OECD FAO Database
Page 34
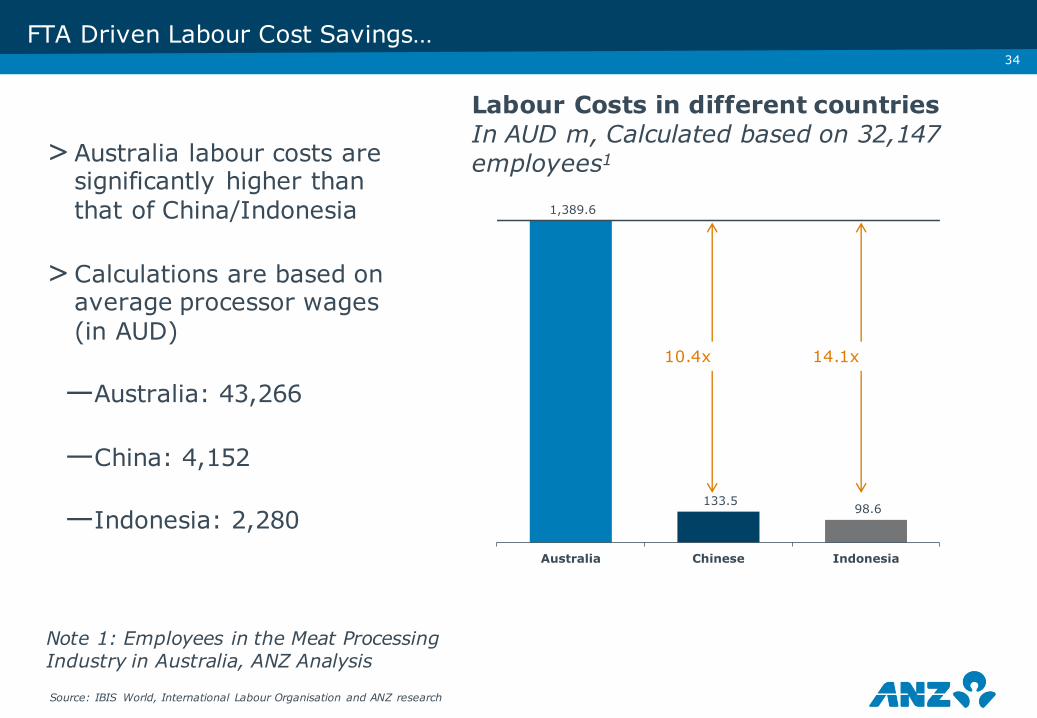
1,389.6
133.5 98.6
Australia Chinese Indonesia
>34
FTA Driven Labour Cost Savings…
>Australia labour costs are significantly higher than that of China/Indonesia
>Calculations are based on average processor wages (in AUD)
—Australia: 43,266
—China: 4,152
—Indonesia: 2,280
10.4x
Labour Costs in different countriesIn AUD m, Calculated based on 32,147 employees1
Note 1: Employees in the Meat Processing Industry in Australia, ANZ Analysis
Source: IBIS World, International Labour Organisation and ANZ research
14.1x

Page 35
• Live cattle demand will trend upwards, despite individual market hiccups• Already leading to growth in feedlots, as well as DD by new market entrants• In addition, new dairy structures increasingly examining barn operation potential• Feed requirements for both dairy and beef will grow as share of grain production
Australia Beef Exports (In Shipped weight tonnes)
LIVE CATTLE EXPORTS
Grass fed beef80%
Grain fed beef20%
Source: Australian Feedlot Association & ANZ Analysis
Protein Demand Will Inevitably See Cattle Numbers Rise -Beef And Dairy Demand Will Boost Feed Requirements
51%
28%
5%
5%
3%2%2% 4%
Indonesia Vietnam Israel Russia
Malaysia China Philippines Other
>35
Page 35

Page 36
Increasing Cattle In The Feedlots Put More Pressure On Feed Supplies…
-
300,000
600,000
900,000
1,200,000
Q1 '13 Q2 '13 Q3 '13 Q4 '13 Q1 '14 Q2 '14 Q3 '14 Q4 '14 Q1 '15 Q2 '15
AUS FEEDLOTS CATTLE
Source: Australia Lot Feeders Association
Source: ABARES
AVG. FARM YIELD IN AUSTRALIAtonnes per hectare
2.41 2.412.012.09
2.97
1.712.07
2.99
1.71
Barley Grain sorghum Wheat2013–14 2014–15 s 2015–16 f
14.8%
15.2%
15.6%
16.0%
16.4%
'15 '16 '17 '18 '19 '20 '21 '22 '23 '24Estimated Feed requirement as % of Grain production
FEED REQUIREMENT – MEAT1 INDUSTRYas a % of Grain production
Note 1: Include Beef & Veal, Mutton, Lamb and PorkSource: OECD – FAO, JCS, ABS
CAGR of feed requirement is estimated to be double that of grain production during 2015-24
Dry weather conditions increase the cattle in the feedlots, which coupled with anticipated drop in yields, may put more pressure on the feed grain supply in the short term

Page 37
>37
Recent Investments And Announcement Are Largely Focused On Beef And Dairy Sector..
Recent investments and announcement indicate high interest in BEEF and DAIRY cattle farms and processing plants from Chinese investors..
Hailiang Group
Purchased cattle and cropping properties in Qld for $40m in 2015
Gippsland Dairy farm
310 ha dairy farm is sold to Chinese investors for more than $8m in May 2015
Chongqing Hondo Agri Group
Confirmed to purchase $100m worth of cattle stations in Australia within 12 months
New Hope Group
Estimated to invest $500m in Australian dairy farms and processing plants
GreenlandGroup
Announced interest in investing across dairy, beef, vineyards and food companies
Taihua Foods/Churchill Abattoir
Taihua Foods signed a JV to raise $35m to upgrade the plant to export status and increase processing volumes
Major constraints to attract investments into Australian agriculture include..
—Concern on profitability of Australian farms, given the investment into the farm land is capital intensive
—Limited financial information about family-owned business and lack of scale necessary for integrating into Chinese supply chains
—Some potential investors, who are outside the agribusiness looking to diversify their portfolio or looking for new growth opportunities, have limited capabilities in identifying suitable investments
Source: KPMG, Theland.com website, ABS
Page 38
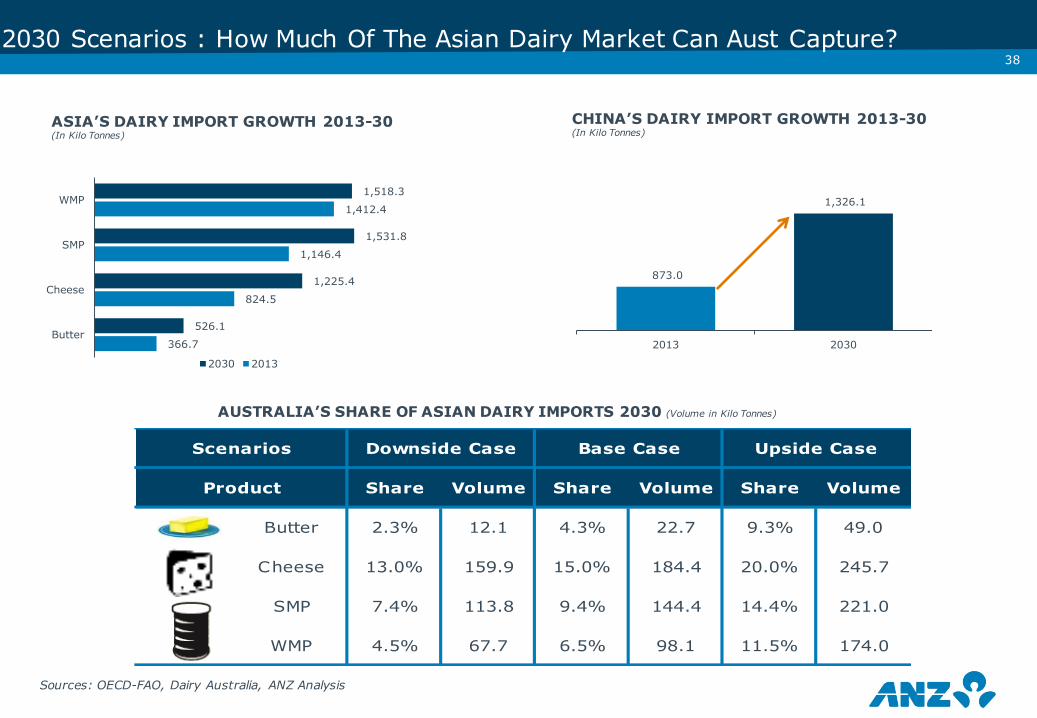
873.0
1,326.1
2013 2030366.7
824.5
1,146.4
1,412.4
526.1
1,225.4
1,531.8
1,518.3
Butter
Cheese
SMP
WMP
2030 2013
>382030 Scenarios : How Much Of The Asian Dairy Market Can Aust Capture?
Sources: OECD-FAO, Dairy Australia, ANZ Analysis
ASIA’S DAIRY IMPORT GROWTH 2013-30(In Kilo Tonnes)
CHINA’S DAIRY IMPORT GROWTH 2013-30(In Kilo Tonnes)
AUSTRALIA’S SHARE OF ASIAN DAIRY IMPORTS 2030 (Volume in Kilo Tonnes)
Share Volume Share Volume Share Volume
Butter 2.3% 12.1 4.3% 22.7 9.3% 49.0
Cheese 13.0% 159.9 15.0% 184.4 20.0% 245.7
SMP 7.4% 113.8 9.4% 144.4 14.4% 221.0
WMP 4.5% 67.7 6.5% 98.1 11.5% 174.0
Downside Case Base Case Upside CaseScenarios
Product

Page 39
CountryExport Value
(AUD bn,2013)
Of Australian
imports
Milk & Cream, nor concentrated nor
sweetened
Milk & Cream, concentrated or
sweetened
Buttermilk & Yoghurt
Whey & natural milk products Butter & other fats Cheese & curd
ChinaRank 4 3 3 10 3 2
Share 11% 3% 5% 2% 4% 23%
Saudi ArabiaRank - 6 4 - 8 9
Share - 4% 3% - 2% 4%
JapanRank - 2 - 3 5 1
Share - 17% - 10% 5% 30%
Hong KongRank 2 5 1 2 2 1
Share 25% 5% 28% 14% 26% 30%
IndonesiaRank 3 3 8 6 3 3
Share 6% 14% 3% 2% 8% 17%
SingaporeRank 2 2 1 5 3 1
Share 22% 21% 28% 6% 21% 37%
MalaysiaRank 2 3 5 8 2 1
Share 24% 12% 11% 3% 21% 42%
PhilippinesRank 5 3 2 12 4 3
Share 6% 6% 15% 2% 2% 16%
ThailandRank 2 2 4 6 2 2
Share 10% 11% 8% 6% 19% 26%
KoreaRank 2 2 6 - 4 4
Share 19% 24% 3% - 8% 5%
Viet NamRank 2 6 5 7 2 3
Share 36% 3% 3% 3% 5% 8%
>39
1.8
1.6
1.2
5.2
1.3
1.1
1.0
0.9
0.8
Share of imports
x% > = 25%
15%<= x% <25%
5%<= x% <15%
0%<= x%< 5%
The above table shows the ranking and share of Australian dairy products in major export markets. For example, in China Cheese and curd market, Australian imports are ranked number 2 by value of imports and share of Australian imports is 23% of total
Australia’s Current Competitive Position
Source : UN Comtrade, ANZ Analysis
0.5
0.8

Page 40
>40
Increasing The Cattle Herd And Improvement In The Yield Levels Require Significant Capital Investment In To Australian Dairy Sector…
-
1,000
2,000
3,000
4,000
2014 2015 E 2016 E 2017 E 2018 E 2019 E 2020 E 2021 E 2022 E 2023 E 2024 E 2025 E
Cows in Milk and Dry Calves Heifers 1-2 yrs Heifers over 2 yrs Other Dairy cattle
Australian Dairy Cattle Herd In thousand heads
Required Increase in YieldIn litres per cow
5,611
2014
6,469
2020 E
7,283
2025 E
+
Cattle herd should increase at CAGR 2% through 2025..
—Demand for Dairy is expected to remain strong in the long term, especially from Asian region given its favourable demographics and rising income levels (which drive food preferences)
—Australia is best placed to meet this increase in demand but not without increasing the cattle herd and improving the milk yield per cow from the current levels
—This growth in the domestic industry can only be facilitated with significant investment in to the sector
Source: ABS, ABARES and ANZ analysis
Page 41
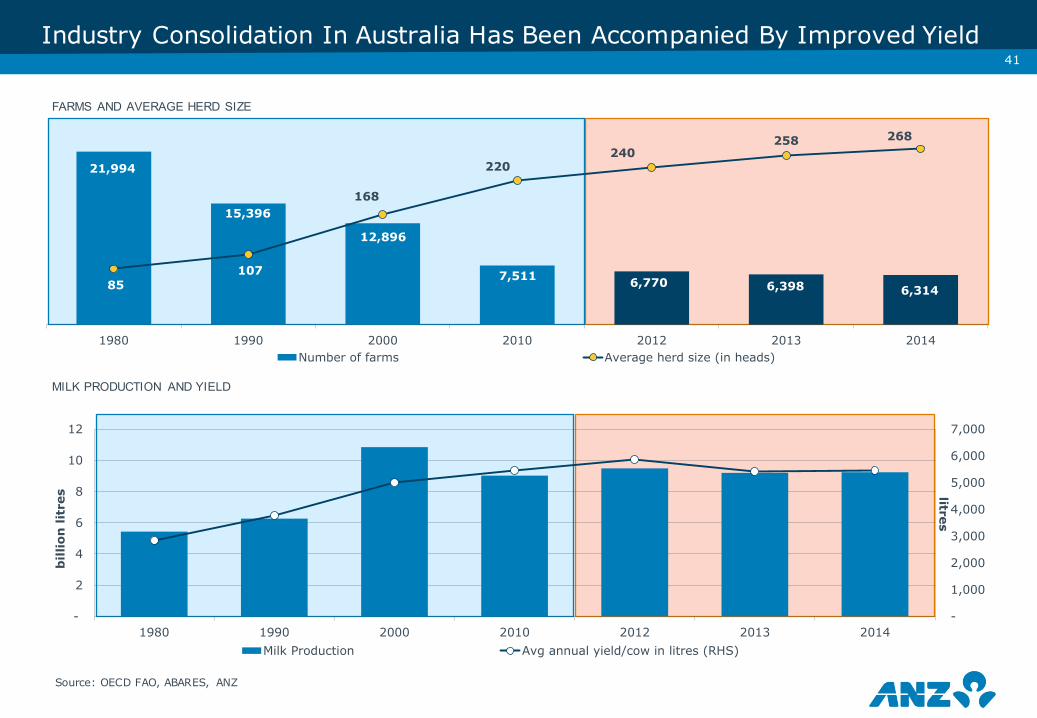
21,994
15,396
12,896
7,511 6,770 6,398 6,314 85 107
168
220 240
258 268
1980 1990 2000 2010 2012 2013 2014Number of farms Average herd size (in heads)
-
1,000
2,000
3,000
4,000
5,000
6,000
7,000
-
2
4
6
8
10
12
1980 1990 2000 2010 2012 2013 2014
litres
bill
ion
lit
res
Milk Production Avg annual yield/cow in litres (RHS)
>41
Industry Consolidation In Australia Has Been Accompanied By Improved Yield
FARMS AND AVERAGE HERD SIZE
MILK PRODUCTION AND YIELD
Source: OECD FAO, ABARES, ANZ

Page 42
>42
Date Company DetailsMERGERS AND ACQUISITIONS
May 2015 Murray Goulburn Tasmania expansion
May 2015 Aust Dairy Farms Capital raising for farms ($17m)
Apr 2015 AFMH Acquired Moxey Farms
Mar 2015 Lion Sell cheese business to WCB for $137m
Mar 2015 Hope Dairies Farming and IMF export plans
Dec 2014 Parmalat Acquired Longwarry for $67m
Oct 2014 ACE Farming Acquired farms – now has 20
Aug 2014 PZ Cussons Acquired five:am yoghurt for $87m
Jul 2014 R&R Icecream Acquired Peters Food Group
Mar 2014 Parmalat Acquired Harvey Food for $79m
Mar 2014 Saputo Acquired WCB
Feb 2014 UDP Acquired by William Hui for $70m
Nov 2013 Fonterra Purchased 6% of Bega
Nov 2013 Fonterra Acquired Tamar Valley Dairy
LISTING ON ASXMay 2015 Murray Goulburn Voted to list
Oct 2014 Aust Dairy Farms Relisted, raised capital for farm purchases
Dairy Sector Activity – Sign Of Capital Focus
Page 43
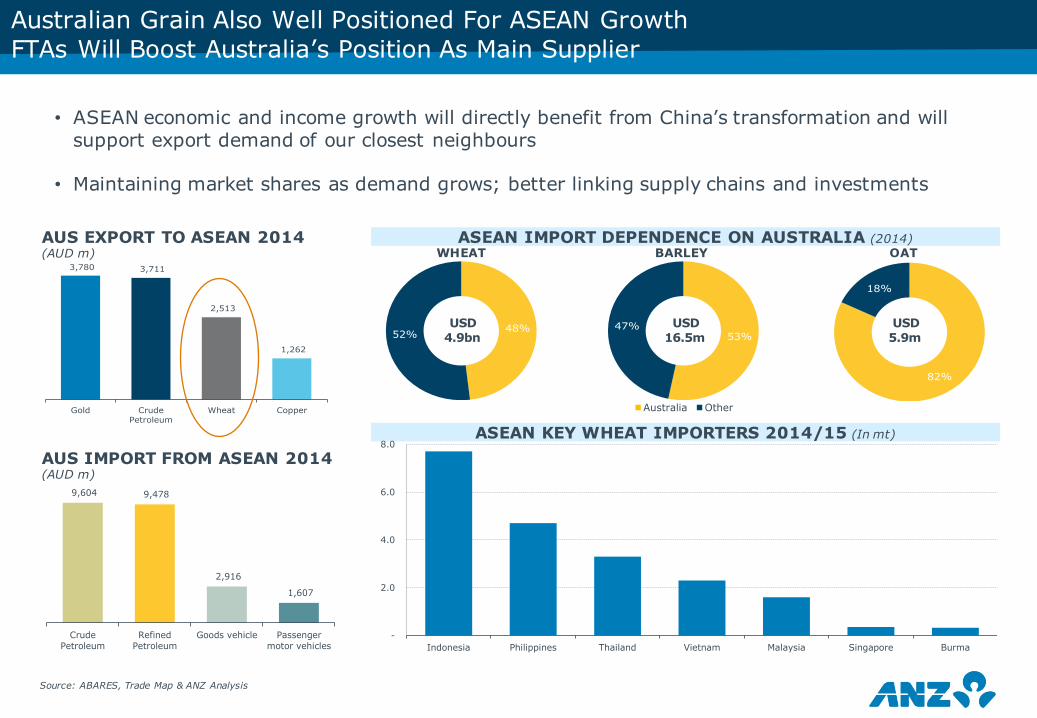
3,780 3,711
2,513
1,262
Gold CrudePetroleum
Wheat Copper
48%52% 53%47%
82%
18%
AUS EXPORT TO ASEAN 2014 (AUD m)
AUS IMPORT FROM ASEAN 2014 (AUD m)
ASEAN IMPORT DEPENDENCE ON AUSTRALIA (2014)WHEAT BARLEY OAT
USD 4.9bn
USD 16.5m
USD 5.9m
ASEAN KEY WHEAT IMPORTERS 2014/15 (In mt)
Source: ABARES, Trade Map & ANZ Analysis
47% 53%
Australia Other
Australian Grain Also Well Positioned For ASEAN GrowthFTAs Will Boost Australia’s Position As Main Supplier
-
2.0
4.0
6.0
8.0
Indonesia Philippines Thailand Vietnam Malaysia Singapore Burma
9,604 9,478
2,916
1,607
CrudePetroleum
RefinedPetroleum
Goods vehicle Passengermotor vehicles
• ASEAN economic and income growth will directly benefit from China’s transformation and will support export demand of our closest neighbours
• Maintaining market shares as demand grows; better linking supply chains and investments

Page 44
>Page 44
NE Asia & SE Asia Account For Nearly Two Thirds Of The Trade…
• North East Asia, home to the Australia’s major trade partner - China dominates the export markets. NE Asia accounts for ~32% of the exports of the six key commodities
• It is closely followed by SE Asian countries, which represent ~29% of the six key commodities’ exports
• Middle East region is at a distant third, at 17% of these exports, with wheat, barley and rice being the major import items
AUS EXPORTS MARKETS - 2014‘000 tonnes
Source: Data sourced from UN Comtrade and it represents calendar yearHS Codes considered for data include Wheat – 1001, Barley - 1003, Sorghum - 1007 , Oats - 1004 , Rice - 1006 , Canola - 1205
18,283 6,134 359 256 410 2,561
20.1% 11.6%
0.5% 0.1% 14.6%
10.0%
5.2%
--
-
0.02% -
17.5%
74.0% 98.1%
55.3%
11.2% 25.5%
0.3%
0.03% -
6.2%
0.01%
8.4%
43.3%
0.5% 0.4%
5.5%
0.1%
4.2%
13.5% 13.9% 1.0% 32.9% 74.0%
51.9%
Wheat Barley Sorghum Oats Rice Canola/Rapeseed
Middle East North Africa North East Asia S Asia SE Asia Other

Page 45
22%
24% 54%
JAPA
N
AUSTRALIAN EXPORTS BY REGION(In mt)
CONSUMPTION(In mt)
ASIA IMPORT MIX
6.4
6.4
2013
2030
121.7
136.6
2013
2030
2.7
3.7
2013
2030
4.3
4.6
2013
2030
5.5
7.8
2013
2030
69% 9%
16% 6%
95%
4% 1%
41%
6% 42%
11%
71%
15%
11% 3%
4
8
12
16
20
2007 2009 2011 2013
Africa Asia Middle East Oceania
AUSTRALIA EXPORT(In mt)
PRODUCTION(In mt)
2030:
2013:
0.00
0.00
0.02
0.02
0.00
0.00
133.12
120.66
1.16
0.83
IND
ON
ESIA
KO
REA
VIE
TNA
MC
HIN
A
Asia To Provide New Grain Export Opportunities For Australia
Source: USDA Foreign Agricultural Services , ABARES and ANZ AnalysisNote 1: As of 2012Note 2: OECD forecast till 2022 is extrapolated for 2030 based on 2013 to 2022 data
5
10
15
20
25
2007 2009 2011 2013Indonesia Korea VietnamChina Japan Others AsiaOther Global
2030:
2013:
2030:
2013:
2030:
2013:
2030:
2013:
41% 6% 42%
11%
Australia Canada US Other
>45
Page 46
ANZ InsightsStrictly Confidential
DR
AFT
FO
R I
NTE
RN
AL
DIS
CU
SSIO
N O
NLY
(20)
(10)
-
10
20
30
2008 2009 2010 2011 2012 2013
46
Farm Production
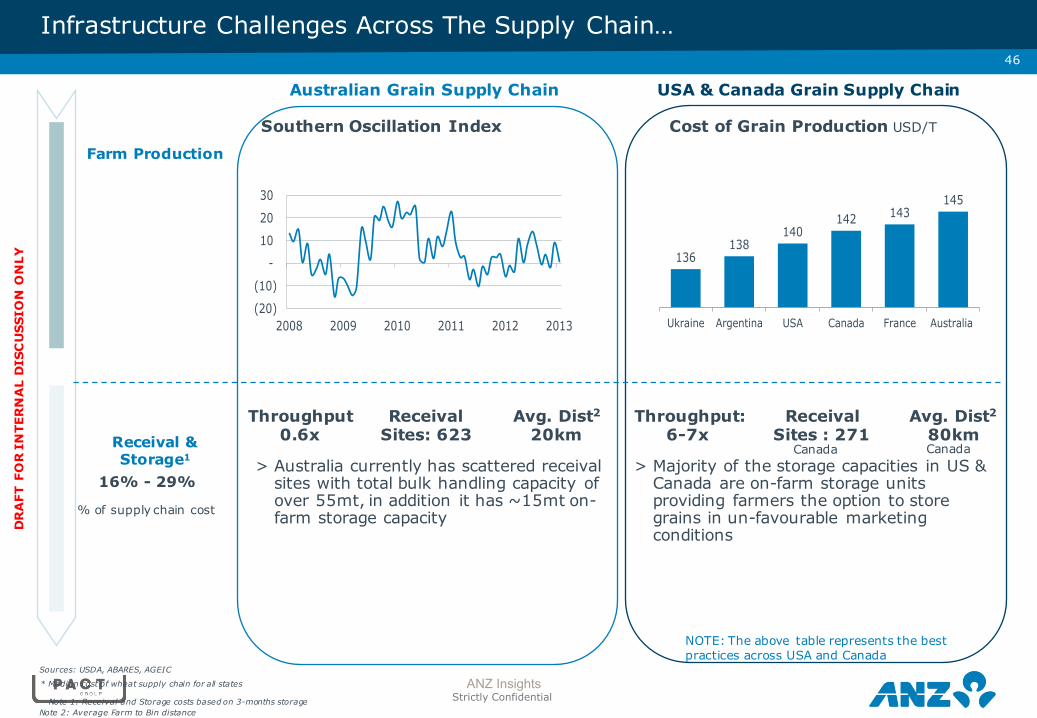
Receival & Storage1
16% - 29%
Note 1: Receival and Storage costs based on 3-months storage
Infrastructure Challenges Across The Supply Chain…
Australian Grain Supply Chain
Throughput 0.6x
Receival Sites: 623
Avg. Dist2
20kmThroughput:
6-7xReceival
Sites : 271Avg. Dist2
80km
* Median cost of wheat supply chain for all states
Note 2: Average Farm to Bin distance
USA & Canada Grain Supply Chain
Southern Oscillation Index Cost of Grain Production USD/T
Sources: USDA, ABARES, AGEIC
NOTE: The above table represents the best practices across USA and Canada
136138
140142 143
145
Ukraine Argentina USA Canada France Australia
> Australia currently has scattered receival sites with total bulk handling capacity of over 55mt, in addition it has ~15mt on-farm storage capacity
> Majority of the storage capacities in US & Canada are on-farm storage units providing farmers the option to store grains in un-favourable marketing conditions
% of supply chain cost
Canada Canada

Page 47
ANZ InsightsStrictly Confidential
DR
AFT
FO
R I
NTE
RN
AL
DIS
CU
SSIO
N O
NLY
30% - 34%
8%-9%
47
Port Facilities
Others4
Sea Freight
…Leading To High Supply Chain Cost ~70 USD/Tonne…
Transit Time: 6 days
Shipping USD 9/ton
Transit Time 26 days
Shipping USD 31/ton
International Shipment3: 3.4
International Shipments3: 3.6
Note 5: Charge for a 40-foot dry container or a semi-trailer (total freight including agent fees, port, airport, and other charges).
Costs5: USD 1,020
Costs5: USD 680
Note 1: Logistics Performance IndexNote 2: Ease of tracking cargo score
Note 3: Ease of arranging competitively priced shipments score
Transportation6
27% - 39%
Axle Load: 16-19 ton
LPI Index1: 3.7
Axle Load: 23 ton
LPI Index1: 3.9
Tracking2: 3.8
Tracking2: 4.1
> Grain transport facility in Australia is deteriorating, with large maintenance investments required, specially into rail infrastructure
> In USA, train lines can move grain 1,000 km at a cost of USD 10/tonne compared to USD 25/tonne in Australia for less than 500 km
> Australia’s proximity to Asia provides it with significant cost advantage in terms of sea freight particularly for South-East Asia
> Western exports into Asian countries are challenged to a greater extent due the freight disadvantages it has to Australia
NOTE: The above table represents the best practices across USA and Canada
Australian Grain Supply Chain USA & Canada Grain Supply Chain
Note 4: Other charges include GRDC Levy and other levyNote 6: Transportation costs based on Rail charges for 200km distance between receival site and port
Western Australia To Indonesia
USA To Indonesia
Page 48
ANZ InsightsStrictly Confidential
DR
AFT
FO
R I
NTE
RN
AL
DIS
CU
SSIO
N O
NLY
48
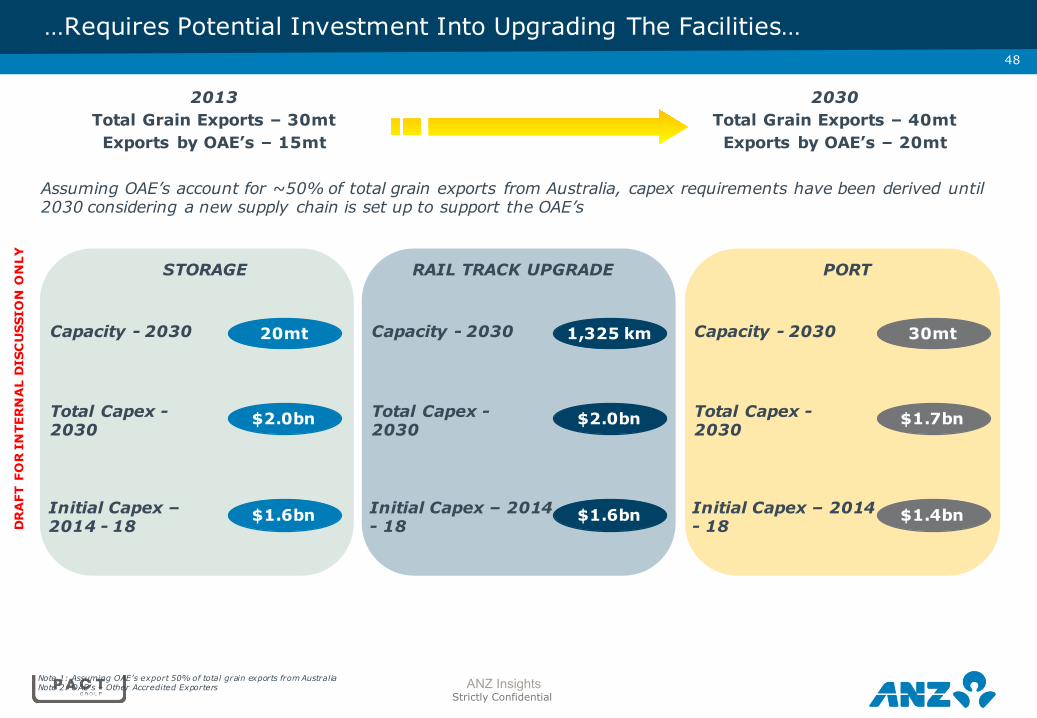
…Requires Potential Investment Into Upgrading The Facilities…
STORAGE RAIL TRACK UPGRADE PORT
20mt
$2.0bn
2013Total Grain Exports – 30mtExports by OAE’s – 15mt
2030Total Grain Exports – 40mtExports by OAE’s – 20mt
Assuming OAE’s account for ~50% of total grain exports from Australia, capex requirements have been derived until 2030 considering a new supply chain is set up to support the OAE’s
$1.6bn
Capacity - 2030
Total Capex -2030
Initial Capex –2014 - 18
1,325 km
$2.0bn
$1.6bn
Capacity - 2030
Total Capex -2030
Initial Capex – 2014 - 18
30mt
$1.7bn
$1.4bn
Capacity - 2030
Total Capex -2030
Initial Capex – 2014 - 18
Note 1: Assuming OAE’s export 50% of total grain exports from AustraliaNote 2: OAE’s – Other Accredited Exporters
Page 49
ANZ InsightsStrictly Confidential
DR
AFT
FO
R I
NTE
RN
AL
DIS
CU
SSIO
N O
NLY
49
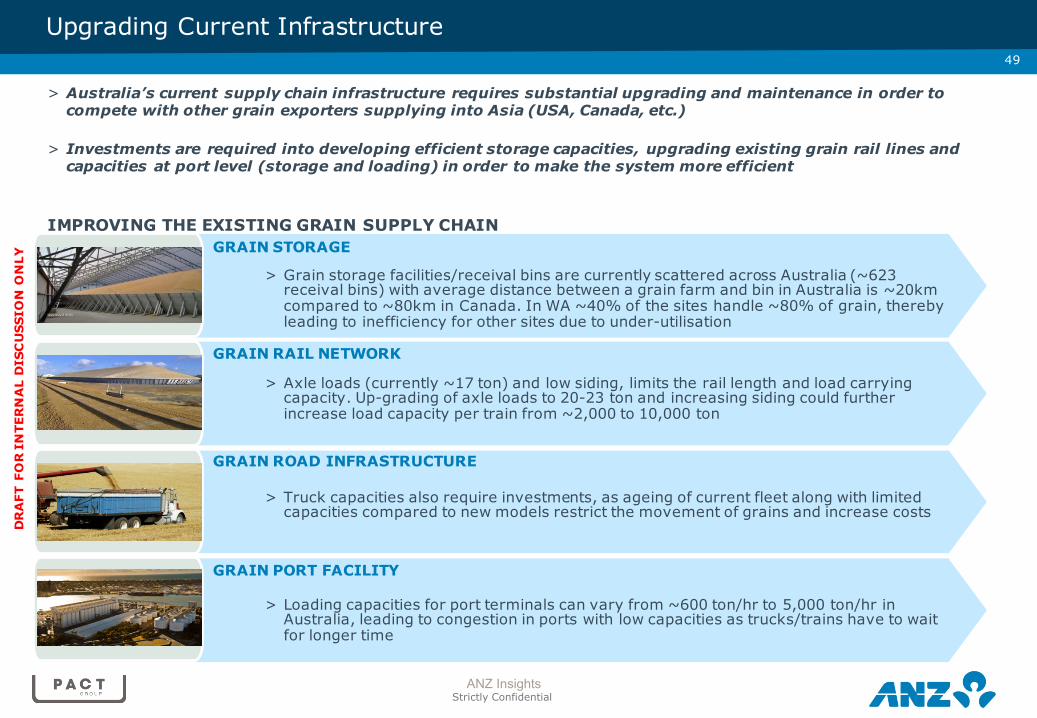
Upgrading Current Infrastructure
> Australia’s current supply chain infrastructure requires substantial upgrading and maintenance in order to compete with other grain exporters supplying into Asia (USA, Canada, etc.)
> Investments are required into developing efficient storage capacities, upgrading existing grain rail lines and capacities at port level (storage and loading) in order to make the system more efficient
IMPROVING THE EXISTING GRAIN SUPPLY CHAIN
> Grain storage facilities/receival bins are currently scattered across Australia (~623 receival bins) with average distance between a grain farm and bin in Australia is ~20km compared to ~80km in Canada. In WA ~40% of the sites handle ~80% of grain, thereby leading to inefficiency for other sites due to under-utilisation
GRAIN STORAGE
GRAIN RAIL NETWORK
> Axle loads (currently ~17 ton) and low siding, limits the rail length and load carrying capacity. Up-grading of axle loads to 20-23 ton and increasing siding could further increase load capacity per train from ~2,000 to 10,000 ton
GRAIN ROAD INFRASTRUCTURE
> Truck capacities also require investments, as ageing of current fleet along with limited capacities compared to new models restrict the movement of grains and increase costs
GRAIN PORT FACILITY
> Loading capacities for port terminals can vary from ~600 ton/hr to 5,000 ton/hr in Australia, leading to congestion in ports with low capacities as trucks/trains have to wait for longer time
Page 50
>50
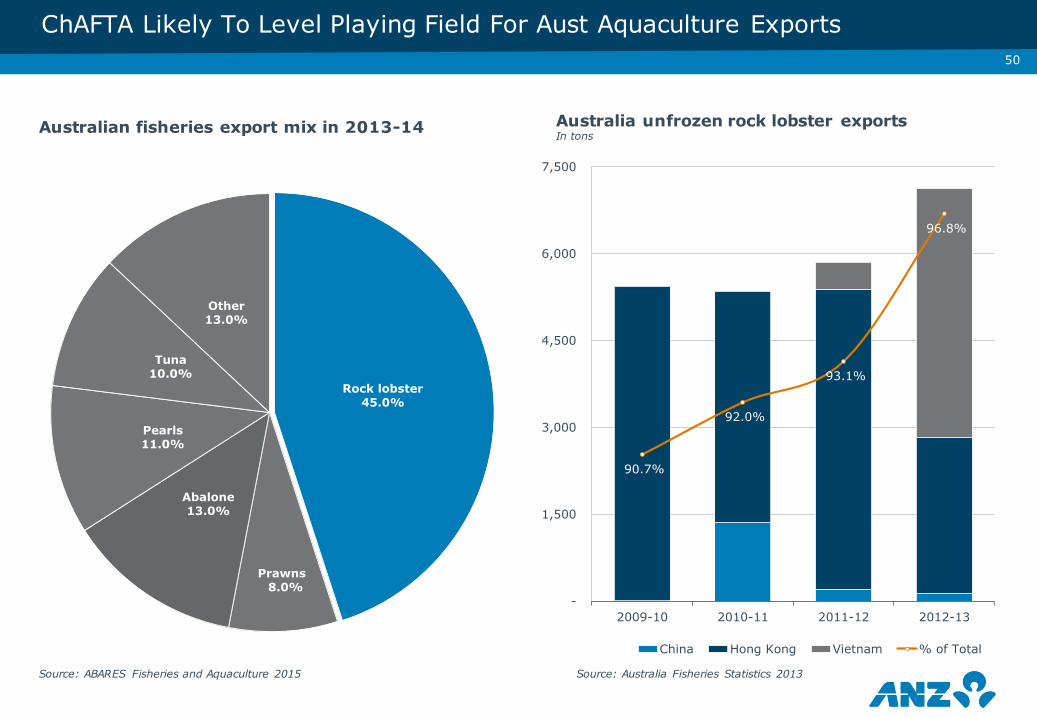
Rock lobster 45.0%
Prawns8.0%
Abalone 13.0%
Pearls11.0%
Tuna10.0%
Other13.0%
Australian fisheries export mix in 2013-14
90.7%
92.0%
93.1%
96.8%
-
1,500
3,000
4,500
6,000
7,500
2009-10 2010-11 2011-12 2012-13
China Hong Kong Vietnam % of Total
Australia unfrozen rock lobster exports In tons
ChAFTA Likely To Level Playing Field For Aust Aquaculture Exports
Source: Australia Fisheries Statistics 2013Source: ABARES Fisheries and Aquaculture 2015

Page 51
• What issues impact agri investing in Australia?
Assessing the Agri Investment Landscape…
Page 52
>52
There are many reasons behind individual decisions to invest fresh capital but the core factors will generally include:
• Economic fit of the project (with existing strategy/business)
• Defendable strong fundamentals for the commodity
• Existing strong management, if management is to be retained
• Ability to achieve financial hurdle rates, taking into account the volatility of the Agri sector
• To achieve control of the enterprise
For those seeking capital, this requires trade-offs and a careful weighing up of their ability to co-exist with a partner
Why Invest?

Page 53
AUSTRALIAN AGRICULTURE
OF AUSTRALIA’S GDP
12%
GENERATES OVER
A$150BANNUALLY
A$32BIN EXPORTS
A$ 1.2TINVESTED IN ALL SUPERANNUATION
APRA REGULATED ENTITIES
A$ 364BINVESTED IN ALL
MYSUPER PRODUCTS
OF THIS ONLY0.3%
IS INVESTED IN AGRICULTURE
SECTOR BY MYSUPER PRODUCTS
“THE AGRICULTURE SECTOR IS A HIGHLY INEFFICIENT, MOSTLY FRAGMENTED MARKET, WITH LOW LIQUIDITY AND A NEED FOR ACTIVE MANAGEMENT. THESE CONDITIONS HAVE HISTORICALLY
PRESENTED AN EXCELLENT OPPORTUNITY TO EXTRACT VALUE” 1
>53Superannuation Fund Investment In Australian Agricultural Assets
Source: BDO International report; Note 1: ‘An analysis : Australian Superannuation fund investment in agriculture 2014/15’ – BDOInternational

Page 54
>54
MEASURES ANNOUNCED BY AUSTRALIAN GOVERNMENT
Rising Scrutiny Of Foreign Investments In Agricultural Land
Ø From 1st Mar 2015, screening threshold at which the Foreign Investment ReviewBoard must be notified of a transaction related to agricultural land reduced to A$15m from A$ 252m
Ø New screening threshold to apply to the cumulative value of agricultural landowned by the foreign investor (value of past acquisitions will be added to theproposed purchase in assessing threshold; particularly relevant to farmaggregation transactions)
Ø To record and track foreign ownership of agricultural land, a national register offoreign ownership will be established
Ø From 1st Jul 2015, the Australian Taxation Office (ATO) to start collectinginformation on all new foreign investment in agricultural land, irrespective ofvalue. Federal Government to also work with state and territory governments toprovide ATO access to land title transfer information
Source: PWC LegalTalk Alert – Closer scrutiny of foreign investments in agricultural land (13th Feb 2015)

Page 55
The Family Farm Model… Problem Or Competitive Advantage?
Is family farm appropriate?
Source: Allens Agribusiness Survey 2014
>55
5%Poor governance
Page 56
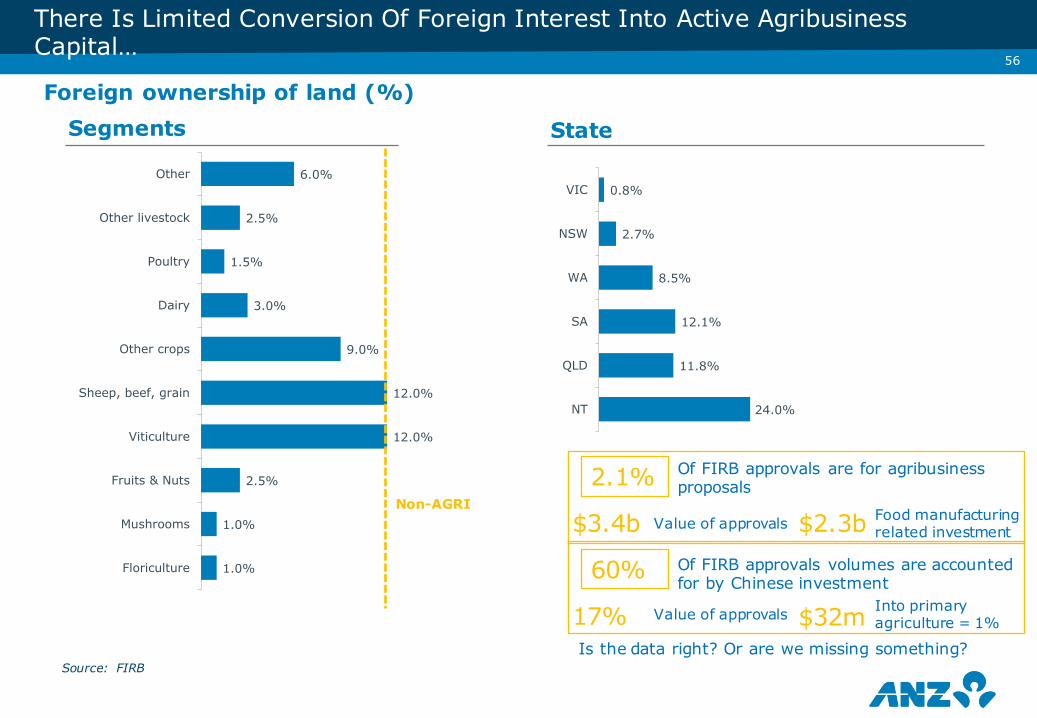
24.0%
11.8%
12.1%
8.5%
2.7%
0.8%
NT
QLD
SA
WA
NSW
VIC
1.0%
1.0%
2.5%
12.0%
12.0%
9.0%
3.0%
1.5%
2.5%
6.0%
Floriculture
Mushrooms
Fruits & Nuts
Viticulture
Sheep, beef, grain
Other crops
Dairy
Poultry
Other livestock
Other
Source: FIRB
Foreign ownership of land (%)
State
There Is Limited Conversion Of Foreign Interest Into Active Agribusiness Capital…
Non-AGRI
Segments
2.1% Of FIRB approvals are for agribusiness proposals
$3.4b Value of approvals $2.3b Food manufacturing related investment
60% Of FIRB approvals volumes are accounted for by Chinese investment
17% Value of approvals $32m Into primary agriculture = 1%
Is the data right? Or are we missing something?
>56

Page 57
>57
Factors Driving The Food & Agriculture Investments…
Why Funds do not invest in Agricultural sector? What will drive investment attractiveness in the future?
5.7
5.4
5
4.9
4.8
4.6
4.4
4.2
Lack of investable products
Lack of asset manager whocover agricultural investments
Limited listed agriculturalinvestment opportunities
Agricultural investmentsdisproportionately increase the
Management expense ratio
Lack of information regardinginvestment in the industry
Agricultural returns are toovolatile
Expected level of return is low
Initial investment cost is toohigh
Survey conducted by BDO for gauging the factors that drive the investment by Australian Superannuation funds in Agribusiness Rated on a scale of 1 (Highly disagree) to 7 (Highly Agree) 1. Increase in available opportunities and liquidity
2. Different funding structures to suit investors
3. Heightened interests for direct or co-investing
4. Relevant expertise and strong governance
— Limited investment products and management teams
— Sector is highly fragmented with majority of investment is done by private owners who have relevant knowledge
— Different debt structures including mezzanine financing, convertible debt etc.,
— Sovereign investment funds and State owned companies, PE firms prefer this mode of investing
— Investors value expertise of the agri-asset managers to a greater extent than other asset classes
— Adherence to sustainable and responsible farming is one of the key aspect
Source: Valoral Advisors, BDO – Australian Superannuation Fund Investment in Agriculture 2014/15

Page 58
• What structures are available?
Assessing the Agri Investment Landscape…
Page 59
>59
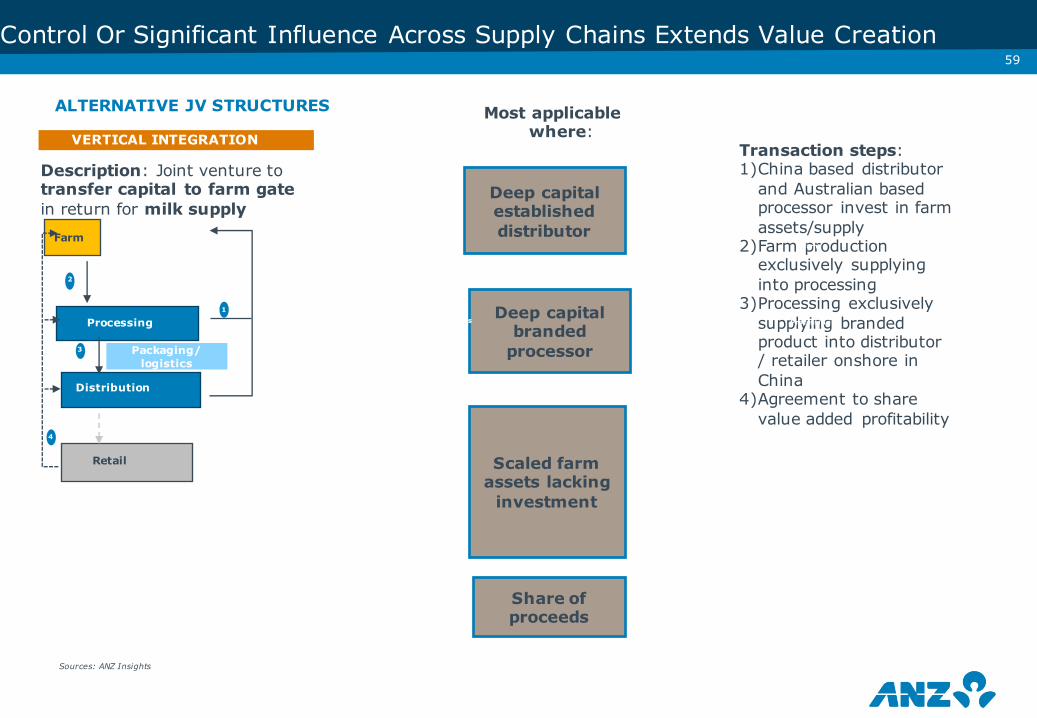
Control Or Significant Influence Across Supply Chains Extends Value Creation
ALTERNATIVE JV STRUCTURES
Sources: ANZ Insights
VERTICAL INTEGRATION
Description: Joint venture to transfer capital to farm gate in return for milk supply
Farm
2
1
Processing
Transaction steps:1)China based distributor
and Australian based processor invest in farm assets/supply
2)Farm production exclusively supplying into processing
3)Processing exclusively supplying branded product into distributor / retailer onshore in China
4)Agreement to share value added profitability
Most applicable where:
Deep capital established distributor
Scaled farm assets lacking
investment
Share of proceeds
Deep capital branded
processor
CONSOLIDATION
PURE INVESTMENT
Distribution
Retail
Processor B
Distribution
Processing
Farm
3
43
Packaging/logistics
Page 60
>60
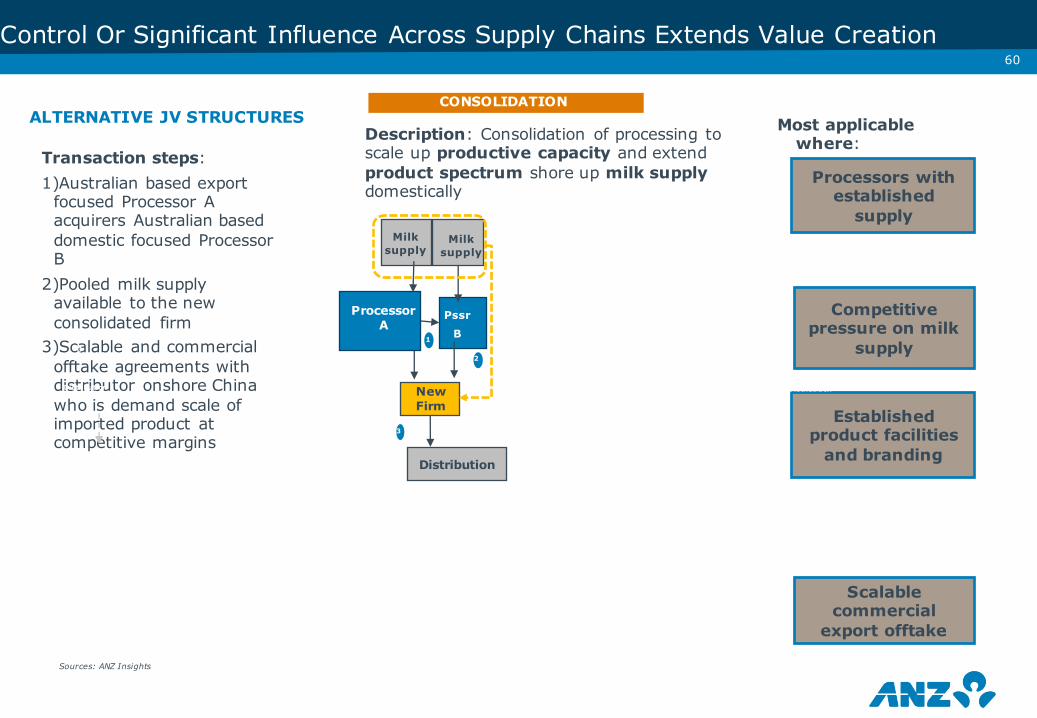
ALTERNATIVE JV STRUCTURES
Sources: ANZ Insights
CONSOLIDATIONDescription: Consolidation of processing to scale up productive capacity and extend product spectrum shore up milk supply domestically
2
Processor A
Transaction steps:1)Australian based export
focused Processor A acquirers Australian based domestic focused Processor B
2)Pooled milk supply available to the new consolidated firm
3)Scalable and commercial offtake agreements with distributor onshore China who is demand scale of imported product at competitive margins
Most applicable where:
Processors with established
supply
Established product facilities
and branding
Scalable commercial
export offtake
Competitive pressure on milk
supply
Distribution
Pssr
B
Milk supply
New Firm
Distribution
Farm
3
4
1
Milk supply
Distribution
3
CONSOLIDATION
Control Or Significant Influence Across Supply Chains Extends Value Creation

Page 61
>61
ALTERNATIVE JV STRUCTURES
Sources: ANZ Insights
VERTICAL INTEGRATION PURE INVESTMENT
Description: New industry entrants looking for long term capital yield could look at particular streams of the supply chain or look to consolidate leveraging their capital base and existing farmer expertise
Most applicable where:
Distribution
Processor B
Distribution
Retail
Processing
Farm
Inve
stor
1
3
1)Scalable farm estimated 1,000 herd2)Strong off-takers for milk supply and
ability to leverage pricing 3)Capacity to automate milking to
increase yield / management skills
1)Capacity for export markets2)Established branded product3)Ability to generate high value products,
i.e. IMF, UHT, cheeses and flavoured drinks
1)Network with Australian branded product supplier and China retail offtakers
2)Capital to invest in packaging/logistics onshore China particularly cold storage
1)Well established or strategically niched retail market with significant demand
2)Access to distributor with a branded imported product line
Control Or Significant Influence Across Supply Chains Extends Value Creation

Page 62
• Investment examples
Assessing the Agri Investment Landscape…
Page 63
63
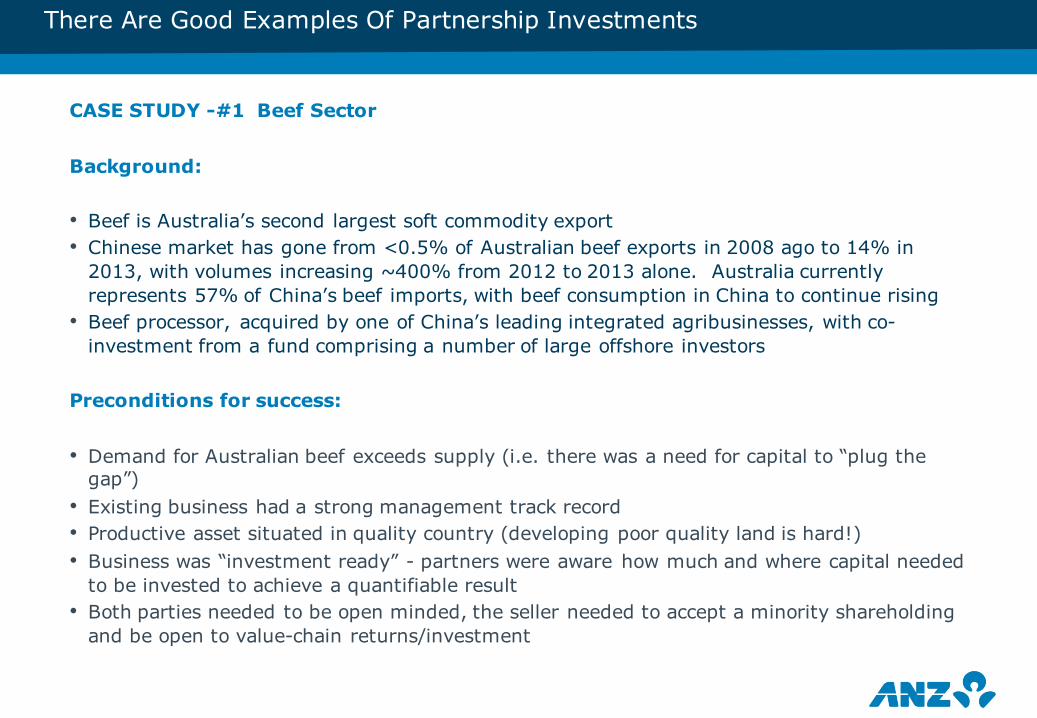
There Are Good Examples Of Partnership Investments
CASE STUDY -#1 Beef Sector
Background:
• Beef is Australia’s second largest soft commodity export• Chinese market has gone from <0.5% of Australian beef exports in 2008 ago to 14% in
2013, with volumes increasing ~400% from 2012 to 2013 alone. Australia currently represents 57% of China’s beef imports, with beef consumption in China to continue rising
• Beef processor, acquired by one of China’s leading integrated agribusinesses, with co-investment from a fund comprising a number of large offshore investors
Preconditions for success:
• Demand for Australian beef exceeds supply (i.e. there was a need for capital to “plug the gap”)
• Existing business had a strong management track record• Productive asset situated in quality country (developing poor quality land is hard!)• Business was “investment ready” - partners were aware how much and where capital needed
to be invested to achieve a quantifiable result• Both parties needed to be open minded, the seller needed to accept a minority shareholding
and be open to value-chain returns/investment
Page 64
64
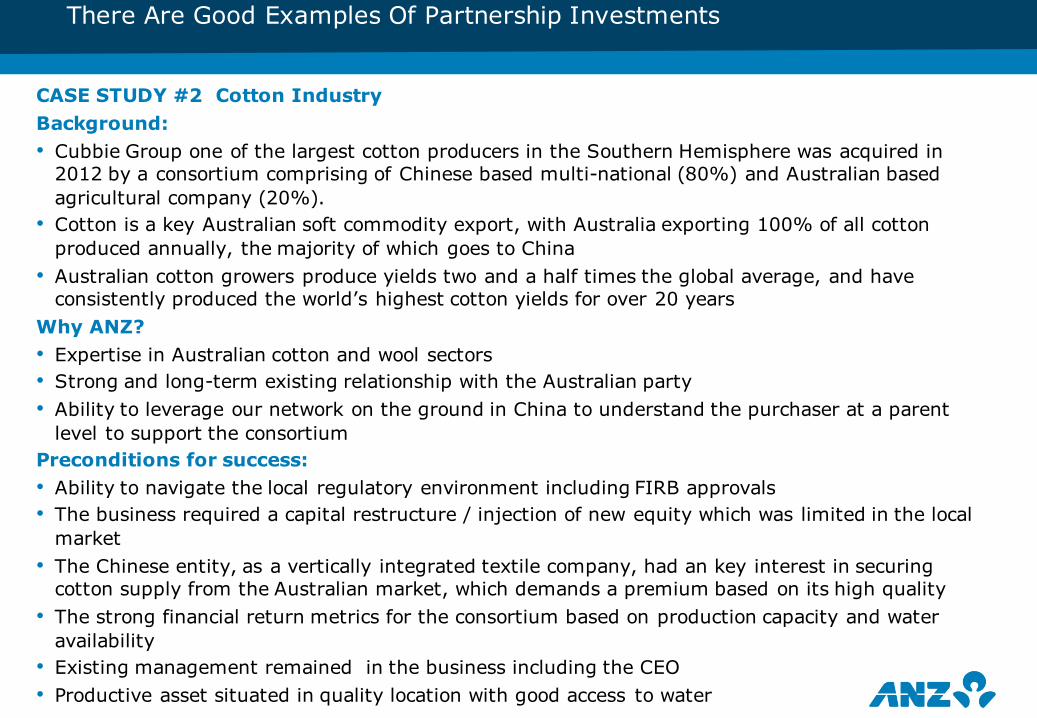
There Are Good Examples Of Partnership Investments
CASE STUDY #2 Cotton IndustryBackground:• Cubbie Group one of the largest cotton producers in the Southern Hemisphere was acquired in
2012 by a consortium comprising of Chinese based multi-national (80%) and Australian based agricultural company (20%).
• Cotton is a key Australian soft commodity export, with Australia exporting 100% of all cotton produced annually, the majority of which goes to China
• Australian cotton growers produce yields two and a half times the global average, and have consistently produced the world’s highest cotton yields for over 20 years
Why ANZ?• Expertise in Australian cotton and wool sectors• Strong and long-term existing relationship with the Australian party• Ability to leverage our network on the ground in China to understand the purchaser at a parent
level to support the consortiumPreconditions for success: • Ability to navigate the local regulatory environment including FIRB approvals• The business required a capital restructure / injection of new equity which was limited in the local
market• The Chinese entity, as a vertically integrated textile company, had an key interest in securing
cotton supply from the Australian market, which demands a premium based on its high quality • The strong financial return metrics for the consortium based on production capacity and water
availability• Existing management remained in the business including the CEO• Productive asset situated in quality location with good access to water
Page 65
• What the producer needs to ask?
• What the investor needs to discuss with them?
Assessing the Agri Investment Landscape…
Page 66
>66
• Where does all of this leave me, the farmer? • Good if I wanted to sell, but what if I want to grow? • What models are available to me?
(JV with farmers or newcomers, equity partnerships, supply chain alliance vs ownership, passive investment, issues of ceding a share and management decision making, professional boards/structures/labour vs owner/manager).
• Where do I find these people and their money anyway? • Do I know what I want? • Am I investor ready? • Has a 3rd party been introduced as a check? • Do I have strong supply chain relationships, do I produce what
the market wants/needs/will pay a premium for? • If not, what do I have to do to get there? • Do I have the skills or do I need help? • Do I have inherent structural road blocks?
What Should The Farmer Be Asking Themselves?
Page 67
As at December 2011:
IMPORTANT NOTICE: The distribution of this document may be restricted by law in certain jurisdictions. Persons who receive this document outside Australia must inform themselves about and observe all relevant restrictions.
1. Australia and New Zealand Banking Group Limited (ACN 005 357 522) (“ANZ”) and its related bodies corporate and affiliates are represented in various countries.
Country/region specific information:
Australia. This document is distributed in Australia by ANZ. ANZ holds an Australian Financial Services licence no. 234527.
United Kingdom. ANZ is authorised and regulated in the United Kingdom by the Financial Services Authority (“FSA”). This document is distributed in the United Kingdom by ANZ solely for the information of persons who would come within the FSA definition of “eligible counterparty” or “professional client”. It is not intended for and must not be distributed to any person who would come within the FSA definition of “retail client”. Nothing here excludes or restricts any duty or liability to a customer which ANZ may have under the UK Financial Services and Markets Act 2000 or under the regulatory system as defined in the Rules of the FSA.
Non-Independent Investment Research disclaimer: This investment research has not been prepared in accordance with legal requirements designed to promote the independence of investment research. Further it is not subject to any prohibition on dealing ahead of the dissemination of investment research.
New Zealand. This document is distributed in New Zealand by ANZ National Bank Limited (“ANZ NZ”).
United States. If and when the material accompanying this document is received by any US persons or other persons within the United States or its territories or possessions, the following statement and the text below is applicable: ANZ Securities, Inc. (“ANZ S”) is a member of FINRA (www.finra.org) and registered with the SEC. ANZ S’s address is 277 Park Avenue, 31st Floor, New York, NY 10172, United States of America (Tel: +1 212 801 9160 Fax: +1 212 801 9163).
This document is distributed in the United States by ANZ S (an affiliated company of ANZ), which accepts responsibility for its content. Further information on any securities referred to in this document may be obtained from ANZ S upon request. Any US person's) receiving this document and wishing to effect transactions in any securities referred to in this document must contact ANZ S, not its affiliates.
Indonesia. This document is distributed by PT. ANZ Panin Bank (“ANZ Panin”). ANZ Panin is incorporated and licensed in Indonesia with limited liability.
Vietnam. This document is distributed in Vietnam by ANZ Bank (Vietnam) Limited (“ANZ VN”). ANZ VN is a wholly-owned foreign bank incorporated and licensed in Vietnam.
China. If and when the material accompanying this document is distributed by ANZ, ANZ NZ, ANZ S, ANZ Panin, ANZ VN or ANZ Bank (Europe) Limited (“ANZBEL”), the following statement and the text below is applicable: No action has been taken by ANZ, ANZ NZ, ANZ S, ANZ Panin, ANZ VN or ANZBEL or any affiliated entity which would permit a public offering of any products or services of such an entity or distribution or re-distribution of this document in the People’s Republic of China (“PRC”). Accordingly, the products and services of such entities are not being offered or sold within the PRC by means of this document or any other document. This document may not be distributed, re-distributed or published in the PRC, except under circumstances that will result in compliance with any applicable laws and regulations.
If and when the material accompanying this document relates to the products and/or services of Australia and New Zealand Bank (China) Company Limited ("ANZ C"), the following statement and the text below is applicable: This document is distributed by ANZ C in the Mainland of the PRC.
Hong Kong. This document is distributed in Hong Kong by the Hong Kong branch of ANZ, which is registered by the Hong Kong Securities andFutures Commission to conduct Type 1 (dealing in securities), Type 4 (advising on securities) and Type 6 (advising on corporate finance) regulated activities. In Hong Kong, this document may only be made available to “professional investors” in accordance with Part 1 of Schedule 1 to the Securities and Futures Ordinance (Cap. 571 of the Laws of Hong Kong). Please note that the contents of this document have not been reviewed by any regulatory authority in Hong Kong. If you are in any doubt about any of the contents of this document, you should obtain independent professional advice.
Singapore. This document is distributed in Singapore by the Singapore branch of ANZ solely for the information of “accredited investors”, “expert investors” or (as the case may be) “institutional investors” (each term as defined in the Securities and Futures Act Cap. 289 of Singapore). ANZ is licensed in Singapore under the Banking Act Cap. 19 of Singapore and is exempted from holding a financial adviser’s licence under Section 23(1)(a) of the Financial Advisers Act Cap. 100 of Singapore. In respect of any matters arising from, or in connection with the distribution of this document in Singapore, contact the ANZ Chief Economist, Asia.
Taiwan. This document is distributed in Taiwan by the Taipei branch of ANZ, which is registered as a branch of a foreign bank and holds a securities investment consulting enterprise license issued by the Taiwan Financial Supervisory Commission. In Taiwan, this document may only be made available to ANZ customers who have requested or have consented to receive distribution of this document and who have entered into a securities investment consulting agreement with ANZ.
Germany. This document is distributed in Germany by the Frankfurt Branch of ANZ solely for the information of its professional clients.
Papua New Guinea. This document is issued by Australia and New Zealand Banking Group (PNG) Limited (Company Registration No. 1-6419) (“ANZ PNG”).
2. European Economic Area (“EEA”).
If the attached or related publication contains:
commentary or opinions on market information only, this document is distributed in the EEA by ANZ Bank (Europe) Limited (“ANZBEL”) which is authorised and regulated by the FSA in the United Kingdom; or
suggesting trading strategies and/or recommendations relating to interest rate, FX or commodity trades in the OTC market generally, this document is distributed in the EEA by ANZBEL as agent for ANZ, to persons who would come within the FSA definition of “eligible counterparty” or “professional client” in other countries in the EEA. This document is distributed in those countries solely for the information of such persons upon their request. It is not intended for, and must not be distributed to, any person there who would come within the FSA definition of “retail client”.
3. Information relevant to all countries.
Disclaimer
The distribution of the attached or related publication including this disclaimer (“this document”) may be restricted by law in certain jurisdictions. In particular, the products and services described in this document (including, but not limited to, physical commodities, options, derivative products and/or futures) may not be eligible for sale in all jurisdictions or to certain categories of investors. Persons who receive this document outside Australia must inform themselves about and observe all relevant restrictions.
This document is issued on the basis that it is only for the information of the particular person to whom it is provided. This document may not be reproduced, distributed or published by any recipient for any purpose. This document has been prepared without takinginto account the objectives, financial situation or needs of any person. Nothing in this document is intended to be an offer to sell, or a solicitation of an offer to buy, or a recommendation or advice to buy or sell or not to buy or sell any product, instrument or investment, to effect any transaction or to conclude any legal act of any kind. If, despite the foregoing, any services or products referred to in this document are deemed to be offered in the jurisdiction in which this document is received, no such service or product is intended for nor available to persons resident in that jurisdiction if it would be contradictory to local law or regulation. Such local laws, regulations and other limitations always apply with non-exclusive jurisdiction of local courts. Recipients should seek independent financial, legal, tax and other relevant advice appropriate to their circumstances prior to making any investment decision.
The views and recommendations expressed in this document are the author’s. They are based on information known by the author andon sources which the author believes to be reliable, but may involve material elements of subjective judgement and analysis. Unless specifically stated otherwise: they are current on the date of this document and are subject to change without notice; and, all price information is indicative only. Any of the views and recommendations which comprise estimates, forecasts or other projections, are subject to significant uncertainties and contingencies that cannot reasonably be anticipated. On this basis, such views and recommendations may not always be achieved or prove to be correct. Indications of past performance in this document will not necessarily be repeated in the future. No representation is being made that any investment will or is likely to achieve profits or losses similar to those achieved in the past, or that significant losses will be avoided.
Additionally, this document may contain ‘forward looking statements’. Actual events or results or actual performance may differ materially from those reflected or contemplated in such forward looking statements. All investments entail a risk and may result in both profits and losses. Foreign currency rates of exchange may adversely affect the value, price or income of any products or services described in this document. The products and services described in this document are not suitable for all investors, and transacting in these products or services is considered risky. ANZ and its related bodies corporate and affiliates, and the officers, employees, contractors and agents of each of them (including the author) (“Affiliates”), do not make any representation as to the accuracy,completeness or currency of the views or recommendations expressed in this document.
Except as required by law, and only to the extent so required: neither ANZ nor its Affiliates warrant or guarantee the performance of any of the products or services described in this document or any return on any associated investment; and, ANZ and its Affiliates expressly disclaim any responsibility and shall not be liable for any loss, damage, claim, liability, proceedings, cost or expense (“Liability”) arising directly or indirectly and whether in tort (including negligence), contract, equity or otherwise out of or in connection with this document.
If this document has been distributed by electronic transmission, such as e-mail, then such transmission cannot be guaranteed to be secure or error-free as information could be intercepted, corrupted, lost, destroyed, arrive late or incomplete, or contain viruses. ANZ and its Affiliates do not accept any Liability as a result of electronic transmission of this document.
Disclosure of Interests
ANZ and its Affiliates may have an interest in the products and services described in this document as follows:
• They may receive fees from customers for dealing in the products and/or services described in this document, and their staff and introducers of business may share in such fees or receive a bonus that may be influenced by total sales.
• They or their clients may have or have had interests or long or short positions in the products and/or services described in this document, and may at any time make purchases and/or sales in them as principal or agent. In addition, ANZ and its Affiliates may act or have acted as market-maker in products described in this document.
• ANZ may rely on information barriers to control the flow of information contained in one or more areas within ANZ into other areas, units, divisions or affiliates of ANZ.
This date and author of the attached or related publication is specified in the body of the attached or related publication. Neither ANZ nor its Affiliates accept any responsibility to inform you of any matter that subsequently comes to their notice, which may affect the accuracy, completeness or currency of the information contained in this document. Further details on the above disclosures are available upon request by contacting your ANZ advisor.
Disclaimer>67