Embed Size (px)
Citation preview
1insight.jci.org doi:10.1172/jci.insight.85841
R e s e a R c h a R t i c l e
Authorship note: K. Gabrusiewicz and B. Rodriguez contributed equally to this work.
Conflict of interest: The authors have declared that no conflict of interest exists.
Submitted: December 4, 2015 Accepted: January 15, 2016 Published: February 25, 2016
Reference information: JCI Insight. 2016;1(2):e85841. doi:10.1172/jci.insight.85841.
Glioblastoma-infiltrated innate immune cells resemble M0 macrophage phenotypeKonrad Gabrusiewicz,1 Benjamin Rodriguez,2 Jun Wei,1 Yuuri Hashimoto,1 Luke M. Healy,3 Sourindra N. Maiti,4 Ginu Thomas,5 Shouhao Zhou,6 Qianghu Wang,7 Ahmed Elakkad,5 Brandon D. Liebelt,1 Nasser K. Yaghi,1 Ravesanker Ezhilarasan,8 Neal Huang,1 Jeffrey S. Weinberg,1 Sujit S. Prabhu,1 Ganesh Rao,1 Raymond Sawaya,1 Lauren A. Langford,9 Janet M. Bruner,9 Gregory N. Fuller,9 Amit Bar-Or,3 Wei Li,2 Rivka R. Colen,5 Michael A. Curran,10 Krishna P. Bhat,11 Jack P. Antel,3 Laurence J. Cooper,4 Erik P. Sulman,8 and Amy B. Heimberger1
1Department of Neurosurgery, The University of Texas MD Anderson Cancer Center, Houston, Texas, USA. 2Division of
Biostatistics, Dan L. Duncan Cancer Center and Department of Molecular and Cellular Biology, Baylor College of Medicine,
Houston, Texas, USA. 3Neuroimmunology Unit, Department of Neurology and Neurosurgery, Montreal Neurological
Institute and Hospital, McGill University, Montreal, Quebec, Canada. 4Division of Pediatrics, 5Department of Diagnostic
Radiology, 6Department of Biostatistics, 7Department of Bioinformatics and Computational Biology, 8Department of
Radiation Oncology, 9Department of Neuropathology, 10Department of Immunology, and 11Department of Translational
Molecular Pathology, The University of Texas MD Anderson Cancer Center, Houston, Texas, USA.
IntroductionGlioblastomas can be highly infiltrated by diverse immune cells, including microglia, monocyte-derived macrophages, and myeloid-derived suppressor cells (MDSCs) (1, 2). Previous studies demonstrated a posi-tive correlation between the number of microglia and macrophages and the grade of glioma (3, 4). Based on microscopic morphology, microglia and macrophages are presumptively activated (5, 6). However, whether this response represents an active antitumor defense mechanism (M1) or a tumor-supportive one (M2) remains to be determined. Glioblastoma-associated macrophages are recruited by a variety of tumor-de-rived signals, such as TGF-β (7), and presumably adopt a tumor-supportive phenotype capable of mediat-ing immune suppression and promoting invasion (8). We have shown that the presence of macrophages is a negative prognosticator for survival in genetically engineered murine models of high-grade gliomas (9) and that both macrophages and microglia are predominant within the glioblastoma microenvironment but have impaired antitumor immunological functions (10). MDSCs, which are precursors of macrophages, are also immunosuppressive (11) and play a tumor-supportive role (12). These immune cell populations can assume the M1 and/or M2 phenotype depending on the environmental context (12, 13).
Classically activated macrophages assume the M1 phenotype characterized by the expression of STAT1 and are capable of stimulating antitumor immune responses by presenting antigens to adaptive immune cells, producing proinflammatory cytokines, and phagocytosing tumor cells (14). In comparison, the alter-natively activated pathway, M2, is characterized by expression of the scavenger receptors CD163, CD204,
Glioblastomas are highly infiltrated by diverse immune cells, including microglia, macrophages, and myeloid-derived suppressor cells (MDSCs). Understanding the mechanisms by which glioblastoma-associated myeloid cells (GAMs) undergo metamorphosis into tumor-supportive cells, characterizing the heterogeneity of immune cell phenotypes within glioblastoma subtypes, and discovering new targets can help the design of new efficient immunotherapies. In this study, we performed a comprehensive battery of immune phenotyping, whole-genome microarray analysis, and microRNA expression profiling of GAMs with matched blood monocytes, healthy donor monocytes, normal brain microglia, nonpolarized M0 macrophages, and polarized M1, M2a, M2c macrophages. Glioblastoma patients had an elevated number of monocytes relative to healthy donors. Among CD11b+ cells, microglia and MDSCs constituted a higher percentage of GAMs than did macrophages. GAM profiling using flow cytometry studies revealed a continuum between the M1- and M2-like phenotype. Contrary to current dogma, GAMs exhibited distinct immunological functions, with the former aligned close to nonpolarized M0 macrophages.
2insight.jci.org doi:10.1172/jci.insight.85841
R e s e a R c h a R t i c l e
mannose receptor C type 1 (CD206), and intracellular STAT3 and the production of immunosuppressive cytokines (15). M2 polarization prevents the production of cytokines required to support tumor-specific CD8+ T, CD4+ Th1, and Th17 cells and promotes the function of tumor-supportive CD4+ regulatory T cells. M2 macrophages do not constitute a uniform population and often are further divided into M2a, M2b, and M2c subsets. The M2a subtype is activated by IL-4 and IL-13. M2b is elicited by IL-1R ligands or exposure to immune complexes plus LPS, while M2c is induced by IL-10 and TGF-β (16). We have shown that glioblastoma cancer stem cells can recruit and polarize microglia and macrophages to a M2 phenotype, inhibit phagocytosis, and induce secretion of immunosuppressive cytokines, resulting in inhibition of T cell proliferation (8). Although a high degree of M2-polarized cell accumulation is presumed to occur within the glioblastoma microenvironment (17–19), thus far, no researchers have undertaken a comprehensive phenotypic and/or genotypic characterization of glioblastoma-infiltrating innate immune cells or fully ana-lyzed operational pathways.
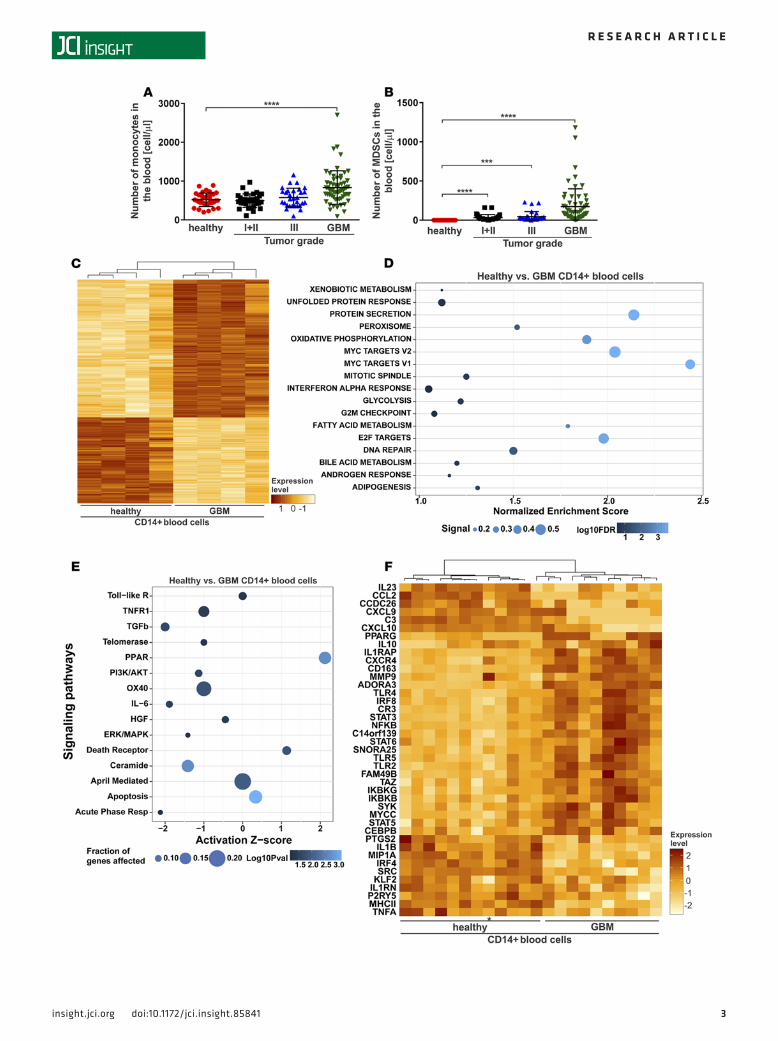
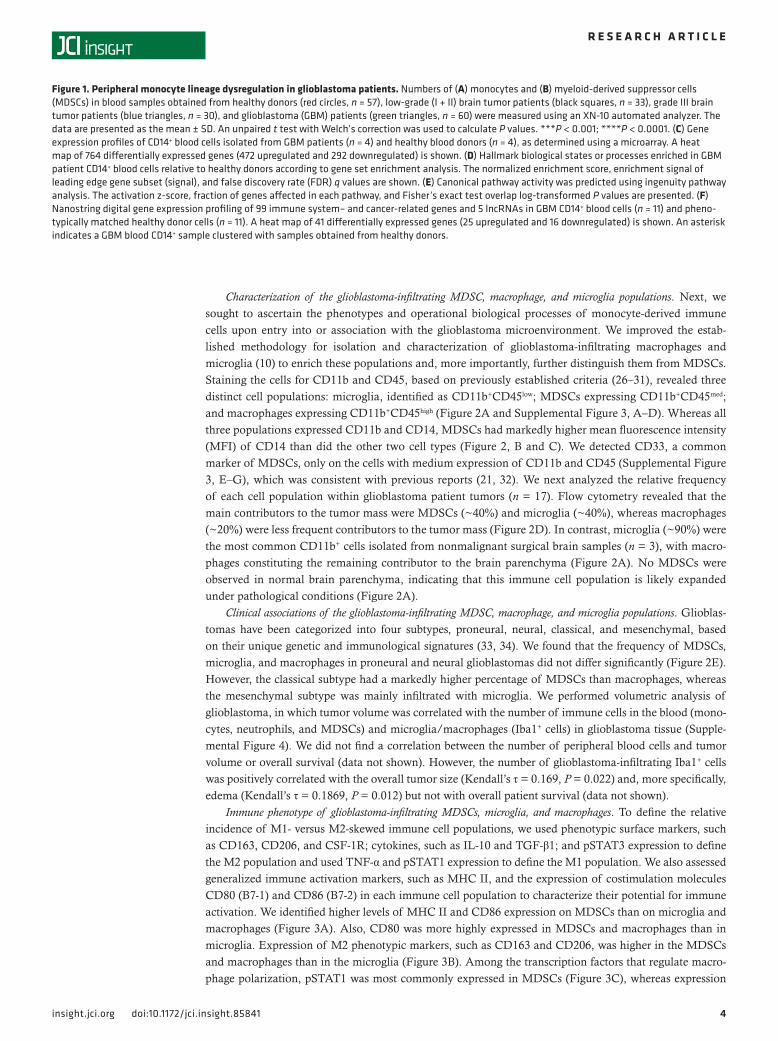
ResultsPeripheral monocyte lineage dysregulation in glioblastoma patients. To identify the presence of monocytes and MDSCs in glioma patients, we conducted an analysis of circulating cells and found a higher number of both cell types in glioblastoma patients relative to healthy donors and patients with lower grade glio-mas (Figure 1, A and B). An increased number of MDSCs correlated with increased glioma grade and glioblastoma patients receiving steroids (Figure 1B and Supplemental Figure 1A; supplemental material available online with this article; doi:10.1172/jci.insight.85841DS1). We did not find a significant dif-ference in the number of monocytes between glioblastoma patients who were given steroids prior to resection at the time of blood draw and those not given steroids (Supplemental Figure 1B). Researchers have defined immune-suppressive neutrophilic and monocytic MDSCs based on their surface expression of CD33+CD11b+CD14–CD15+ and CD33+CD11b+CD14+CD15–, respectively (20, 21). In the blood of glioblastoma patients, we identified three myeloid cell populations: the predominant monocytic sub-set of MDSCs (CD33+CD11b+CD14highCD15–), a minor population of neutrophilic MDSCs express-ing CD33+CD11b+CD14lowCD15+, and CD11b+CD14low monocytes (Supplemental Figure 1, C and D). We also observed an increase in the number of immune-suppressive neutrophils (CD11b+CD16+) in the peripheral blood of glioblastoma patients that correlated with increased glioma grade and glioblastoma patients receiving steroids (Supplemental Figure 1, E and F), which was consistent with previous reports of neutrophilia in cancer patients (22, 23).
To elucidate the operational pathways in CD14+ cells, given their frequency and role in immune suppression, we examined the gene expression profiles in CD14+ blood cells isolated from glioblastoma patients and healthy blood donors by microarray. Among 764 differentially expressed genes, expression of 472 genes was upregulated and that of 292 genes was downregulated, respectively (Figure 1C and Supplemental Table 1). Gene set enrichment analysis (GSEA) identified hallmarks of biological states or processes enriched in glioblastoma patient CD14+ blood cells relative to healthy donors, including transcriptional regulation by MYC and E2F, protein secretion, oxidative phosphorylation, and fatty acid metabolism (Figure 1D). MYC has previously been shown to have a role in tumor-supportive microglia (24), and E2F is involved in macrophage differentiation (25). GSEA enrichment plots and expression heat maps are shown in Supplemental Figure 2. We next investigated alterations of canonical pathway activity in the gene expression profiles. Ingenuity pathway analysis (IPA) predicted increased activity of the PPAR pathway (activation z-score = 2.1) but decreased activity of the TGF-β pathway (activation z-score = –2.0), IL-6 (z-score = –1.9), and acute phase response (activation z-score = –2.1) in glioblastoma patient CD14+ blood cells relative to healthy donors (Figure 1E).
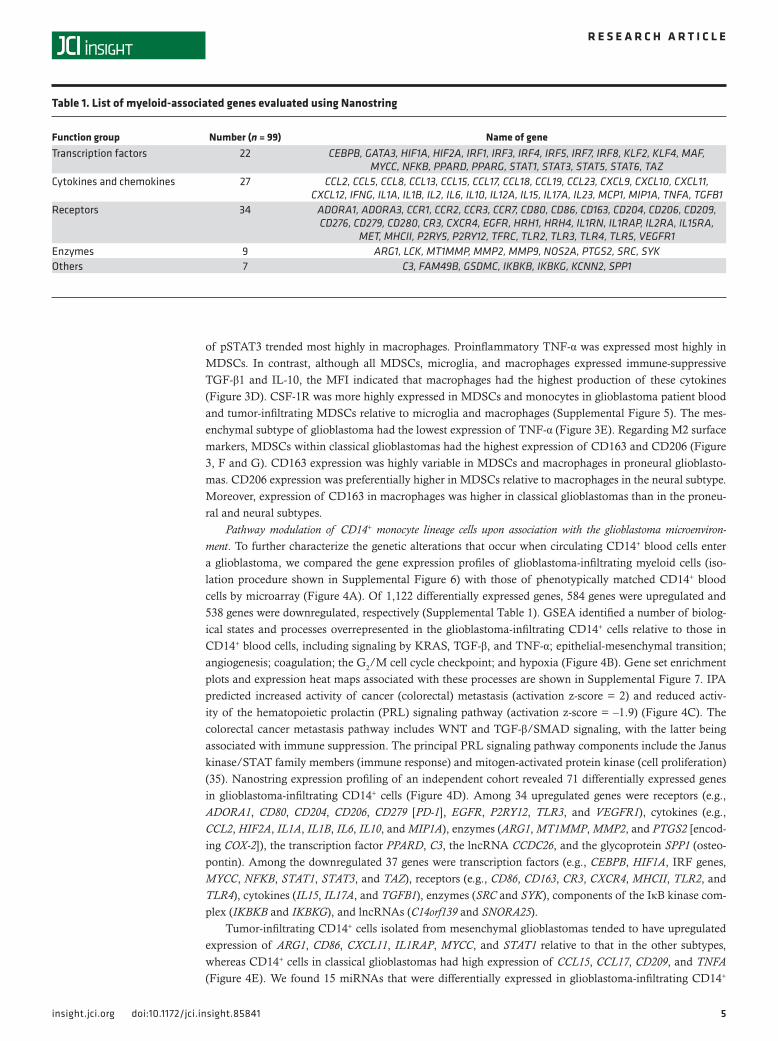
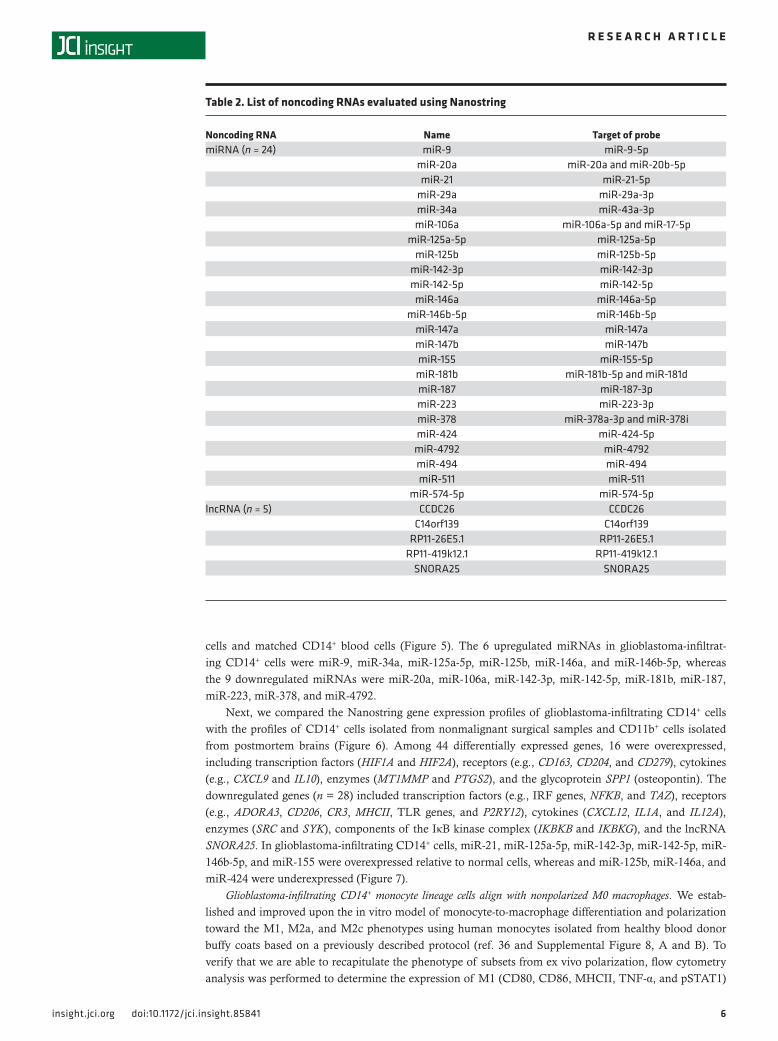
In Nanostring analysis, we profiled the expression of 99 immune system– and cancer-related genes (Table 1), 24 miRNAs regulating myeloid cell functions, and 5 lncRNAs (Table 2) in glioblastoma patient CD14+ blood cells and those from healthy donors (Figure 1F). Among the 25 upregulated genes in CD14+ cells from glioblastoma patients were transcription factors (e.g., CEBPB, IRF8, MYCC, NFKB, PPARG, STAT3, and TAZ), receptors (e.g., ADORA3, CD163, and TLR genes), the extracellular matrix protease MMP9, the cytokine IL10, components of the IκB kinase complex (IKBKB and IKBKG), lncRNAs (C14orf139 and SNORA25), and miR-574-5p. Among the downregulated genes (n = 16) specific to glioblastoma patient CD14+ blood cells were tran-scription factors (IRF4 and KLF2), receptors (MHCII, IL1RN, and P2RY5), cytokines (CCL2, IL23, and TNFA), enzymes (PTGS2 and SRC), complement component 3 (C3), the lncRNA CCDC26, miR-21, and miR-146a.
3insight.jci.org doi:10.1172/jci.insight.85841
R e s e a R c h a R t i c l e
4insight.jci.org doi:10.1172/jci.insight.85841
R e s e a R c h a R t i c l e
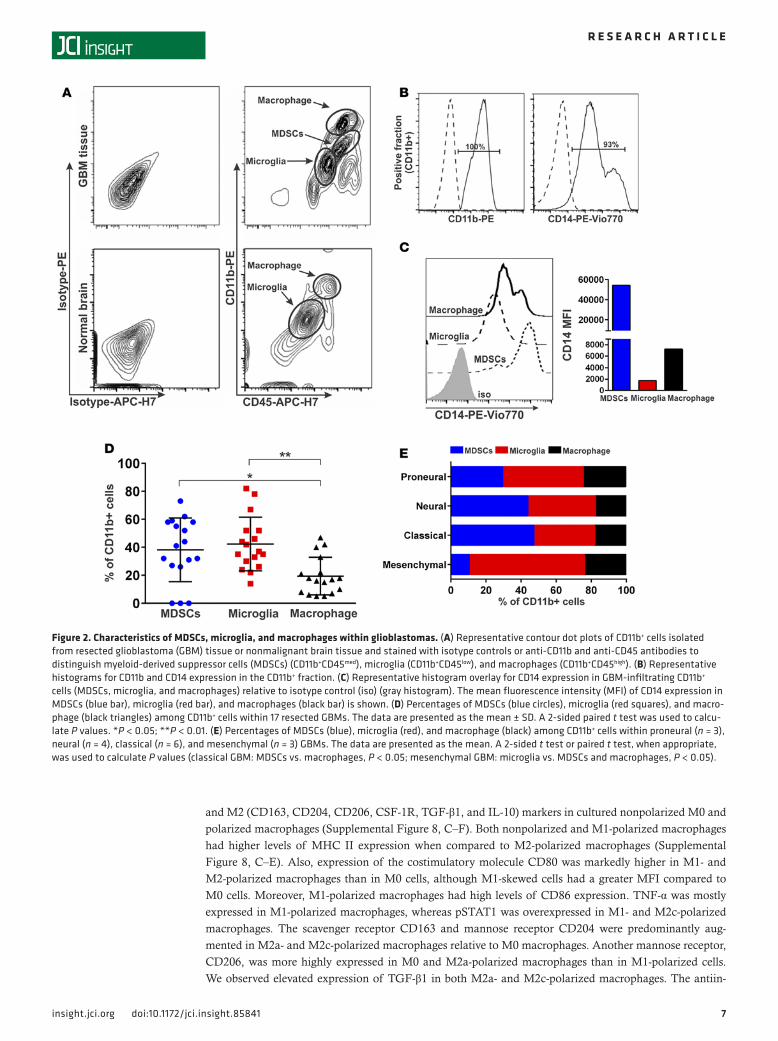
Characterization of the glioblastoma-infiltrating MDSC, macrophage, and microglia populations. Next, we sought to ascertain the phenotypes and operational biological processes of monocyte-derived immune cells upon entry into or association with the glioblastoma microenvironment. We improved the estab-lished methodology for isolation and characterization of glioblastoma-infiltrating macrophages and microglia (10) to enrich these populations and, more importantly, further distinguish them from MDSCs. Staining the cells for CD11b and CD45, based on previously established criteria (26–31), revealed three distinct cell populations: microglia, identified as CD11b+CD45low; MDSCs expressing CD11b+CD45med; and macrophages expressing CD11b+CD45high (Figure 2A and Supplemental Figure 3, A–D). Whereas all three populations expressed CD11b and CD14, MDSCs had markedly higher mean fluorescence intensity (MFI) of CD14 than did the other two cell types (Figure 2, B and C). We detected CD33, a common marker of MDSCs, only on the cells with medium expression of CD11b and CD45 (Supplemental Figure 3, E–G), which was consistent with previous reports (21, 32). We next analyzed the relative frequency of each cell population within glioblastoma patient tumors (n = 17). Flow cytometry revealed that the main contributors to the tumor mass were MDSCs (~40%) and microglia (~40%), whereas macrophages (~20%) were less frequent contributors to the tumor mass (Figure 2D). In contrast, microglia (~90%) were the most common CD11b+ cells isolated from nonmalignant surgical brain samples (n = 3), with macro-phages constituting the remaining contributor to the brain parenchyma (Figure 2A). No MDSCs were observed in normal brain parenchyma, indicating that this immune cell population is likely expanded under pathological conditions (Figure 2A).
Clinical associations of the glioblastoma-infiltrating MDSC, macrophage, and microglia populations. Glioblas-tomas have been categorized into four subtypes, proneural, neural, classical, and mesenchymal, based on their unique genetic and immunological signatures (33, 34). We found that the frequency of MDSCs, microglia, and macrophages in proneural and neural glioblastomas did not differ significantly (Figure 2E). However, the classical subtype had a markedly higher percentage of MDSCs than macrophages, whereas the mesenchymal subtype was mainly infiltrated with microglia. We performed volumetric analysis of glioblastoma, in which tumor volume was correlated with the number of immune cells in the blood (mono-cytes, neutrophils, and MDSCs) and microglia/macrophages (Iba1+ cells) in glioblastoma tissue (Supple-mental Figure 4). We did not find a correlation between the number of peripheral blood cells and tumor volume or overall survival (data not shown). However, the number of glioblastoma-infiltrating Iba1+ cells was positively correlated with the overall tumor size (Kendall’s τ = 0.169, P = 0.022) and, more specifically, edema (Kendall’s τ = 0.1869, P = 0.012) but not with overall patient survival (data not shown).
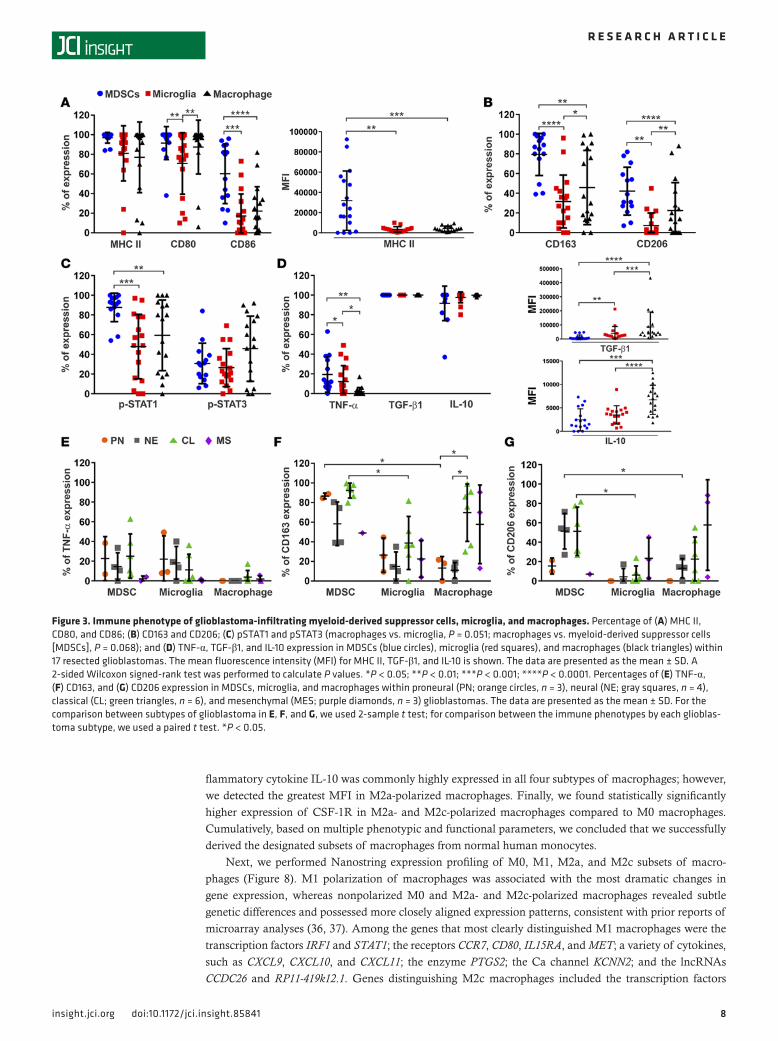
Immune phenotype of glioblastoma-infiltrating MDSCs, microglia, and macrophages. To define the relative incidence of M1- versus M2-skewed immune cell populations, we used phenotypic surface markers, such as CD163, CD206, and CSF-1R; cytokines, such as IL-10 and TGF-β1; and pSTAT3 expression to define the M2 population and used TNF-α and pSTAT1 expression to define the M1 population. We also assessed generalized immune activation markers, such as MHC II, and the expression of costimulation molecules CD80 (B7-1) and CD86 (B7-2) in each immune cell population to characterize their potential for immune activation. We identified higher levels of MHC II and CD86 expression on MDSCs than on microglia and macrophages (Figure 3A). Also, CD80 was more highly expressed in MDSCs and macrophages than in microglia. Expression of M2 phenotypic markers, such as CD163 and CD206, was higher in the MDSCs and macrophages than in the microglia (Figure 3B). Among the transcription factors that regulate macro-phage polarization, pSTAT1 was most commonly expressed in MDSCs (Figure 3C), whereas expression
Figure 1. Peripheral monocyte lineage dysregulation in glioblastoma patients. Numbers of (A) monocytes and (B) myeloid-derived suppressor cells (MDSCs) in blood samples obtained from healthy donors (red circles, n = 57), low-grade (I + II) brain tumor patients (black squares, n = 33), grade III brain tumor patients (blue triangles, n = 30), and glioblastoma (GBM) patients (green triangles, n = 60) were measured using an XN-10 automated analyzer. The data are presented as the mean ± SD. An unpaired t test with Welch’s correction was used to calculate P values. ***P < 0.001; ****P < 0.0001. (C) Gene expression profiles of CD14+ blood cells isolated from GBM patients (n = 4) and healthy blood donors (n = 4), as determined using a microarray. A heat map of 764 differentially expressed genes (472 upregulated and 292 downregulated) is shown. (D) Hallmark biological states or processes enriched in GBM patient CD14+ blood cells relative to healthy donors according to gene set enrichment analysis. The normalized enrichment score, enrichment signal of leading edge gene subset (signal), and false discovery rate (FDR) q values are shown. (E) Canonical pathway activity was predicted using ingenuity pathway analysis. The activation z-score, fraction of genes affected in each pathway, and Fisher’s exact test overlap log-transformed P values are presented. (F) Nanostring digital gene expression profiling of 99 immune system– and cancer-related genes and 5 lncRNAs in GBM CD14+ blood cells (n = 11) and pheno-typically matched healthy donor cells (n = 11). A heat map of 41 differentially expressed genes (25 upregulated and 16 downregulated) is shown. An asterisk indicates a GBM blood CD14+ sample clustered with samples obtained from healthy donors.
5insight.jci.org doi:10.1172/jci.insight.85841
R e s e a R c h a R t i c l e
of pSTAT3 trended most highly in macrophages. Proinflammatory TNF-α was expressed most highly in MDSCs. In contrast, although all MDSCs, microglia, and macrophages expressed immune-suppressive TGF-β1 and IL-10, the MFI indicated that macrophages had the highest production of these cytokines (Figure 3D). CSF-1R was more highly expressed in MDSCs and monocytes in glioblastoma patient blood and tumor-infiltrating MDSCs relative to microglia and macrophages (Supplemental Figure 5). The mes-enchymal subtype of glioblastoma had the lowest expression of TNF-α (Figure 3E). Regarding M2 surface markers, MDSCs within classical glioblastomas had the highest expression of CD163 and CD206 (Figure 3, F and G). CD163 expression was highly variable in MDSCs and macrophages in proneural glioblasto-mas. CD206 expression was preferentially higher in MDSCs relative to macrophages in the neural subtype. Moreover, expression of CD163 in macrophages was higher in classical glioblastomas than in the proneu-ral and neural subtypes.
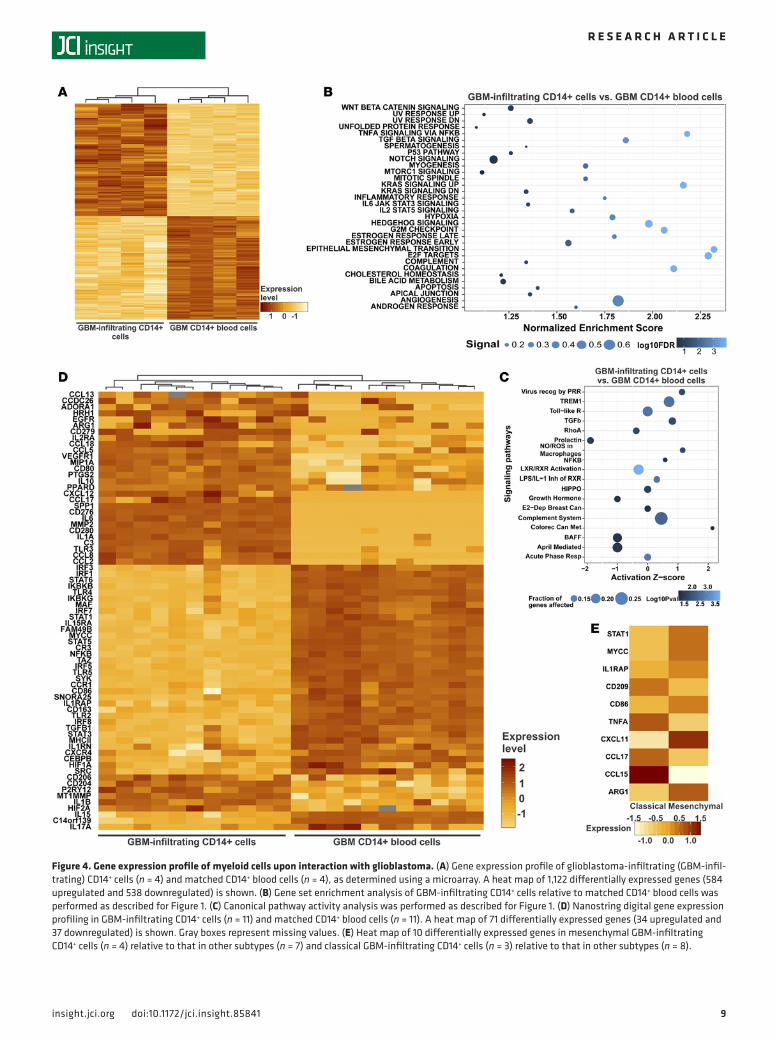
Pathway modulation of CD14+ monocyte lineage cells upon association with the glioblastoma microenviron-ment. To further characterize the genetic alterations that occur when circulating CD14+ blood cells enter a glioblastoma, we compared the gene expression profiles of glioblastoma-infiltrating myeloid cells (iso-lation procedure shown in Supplemental Figure 6) with those of phenotypically matched CD14+ blood cells by microarray (Figure 4A). Of 1,122 differentially expressed genes, 584 genes were upregulated and 538 genes were downregulated, respectively (Supplemental Table 1). GSEA identified a number of biolog-ical states and processes overrepresented in the glioblastoma-infiltrating CD14+ cells relative to those in CD14+ blood cells, including signaling by KRAS, TGF-β, and TNF-α; epithelial-mesenchymal transition; angiogenesis; coagulation; the G2/M cell cycle checkpoint; and hypoxia (Figure 4B). Gene set enrichment plots and expression heat maps associated with these processes are shown in Supplemental Figure 7. IPA predicted increased activity of cancer (colorectal) metastasis (activation z-score = 2) and reduced activ-ity of the hematopoietic prolactin (PRL) signaling pathway (activation z-score = –1.9) (Figure 4C). The colorectal cancer metastasis pathway includes WNT and TGF-β/SMAD signaling, with the latter being associated with immune suppression. The principal PRL signaling pathway components include the Janus kinase/STAT family members (immune response) and mitogen-activated protein kinase (cell proliferation) (35). Nanostring expression profiling of an independent cohort revealed 71 differentially expressed genes in glioblastoma-infiltrating CD14+ cells (Figure 4D). Among 34 upregulated genes were receptors (e.g., ADORA1, CD80, CD204, CD206, CD279 [PD-1], EGFR, P2RY12, TLR3, and VEGFR1), cytokines (e.g., CCL2, HIF2A, IL1A, IL1B, IL6, IL10, and MIP1A), enzymes (ARG1, MT1MMP, MMP2, and PTGS2 [encod-ing COX-2]), the transcription factor PPARD, C3, the lncRNA CCDC26, and the glycoprotein SPP1 (osteo-pontin). Among the downregulated 37 genes were transcription factors (e.g., CEBPB, HIF1A, IRF genes, MYCC, NFKB, STAT1, STAT3, and TAZ), receptors (e.g., CD86, CD163, CR3, CXCR4, MHCII, TLR2, and TLR4), cytokines (IL15, IL17A, and TGFB1), enzymes (SRC and SYK), components of the IκB kinase com-plex (IKBKB and IKBKG), and lncRNAs (C14orf139 and SNORA25).
Tumor-infiltrating CD14+ cells isolated from mesenchymal glioblastomas tended to have upregulated expression of ARG1, CD86, CXCL11, IL1RAP, MYCC, and STAT1 relative to that in the other subtypes, whereas CD14+ cells in classical glioblastomas had high expression of CCL15, CCL17, CD209, and TNFA (Figure 4E). We found 15 miRNAs that were differentially expressed in glioblastoma-infiltrating CD14+
Table 1. List of myeloid-associated genes evaluated using Nanostring
Function group Number (n = 99) Name of geneTranscription factors 22 CEBPB, GATA3, HIF1A, HIF2A, IRF1, IRF3, IRF4, IRF5, IRF7, IRF8, KLF2, KLF4, MAF,
MYCC, NFKB, PPARD, PPARG, STAT1, STAT3, STAT5, STAT6, TAZCytokines and chemokines 27 CCL2, CCL5, CCL8, CCL13, CCL15, CCL17, CCL18, CCL19, CCL23, CXCL9, CXCL10, CXCL11,
CXCL12, IFNG, IL1A, IL1B, IL2, IL6, IL10, IL12A, IL15, IL17A, IL23, MCP1, MIP1A, TNFA, TGFB1Receptors 34 ADORA1, ADORA3, CCR1, CCR2, CCR3, CCR7, CD80, CD86, CD163, CD204, CD206, CD209,
CD276, CD279, CD280, CR3, CXCR4, EGFR, HRH1, HRH4, IL1RN, IL1RAP, IL2RA, IL15RA, MET, MHCII, P2RY5, P2RY12, TFRC, TLR2, TLR3, TLR4, TLR5, VEGFR1
Enzymes 9 ARG1, LCK, MT1MMP, MMP2, MMP9, NOS2A, PTGS2, SRC, SYKOthers 7 C3, FAM49B, GSDMC, IKBKB, IKBKG, KCNN2, SPP1
6insight.jci.org doi:10.1172/jci.insight.85841
R e s e a R c h a R t i c l e
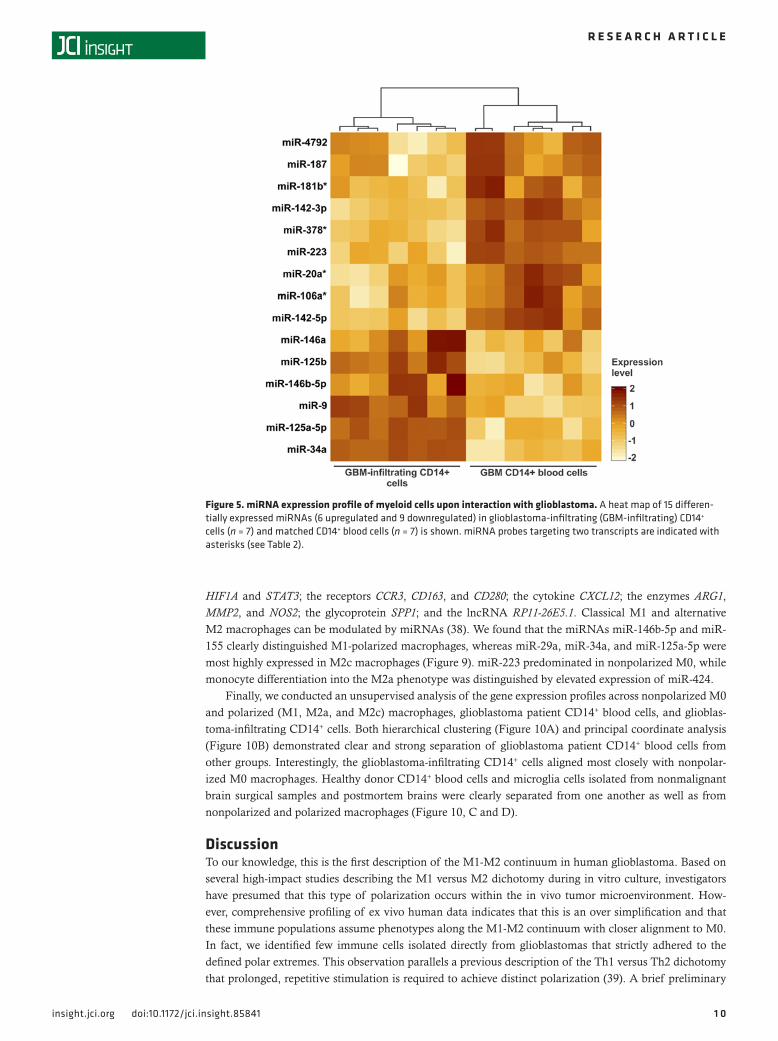
cells and matched CD14+ blood cells (Figure 5). The 6 upregulated miRNAs in glioblastoma-infiltrat-ing CD14+ cells were miR-9, miR-34a, miR-125a-5p, miR-125b, miR-146a, and miR-146b-5p, whereas the 9 downregulated miRNAs were miR-20a, miR-106a, miR-142-3p, miR-142-5p, miR-181b, miR-187, miR-223, miR-378, and miR-4792.
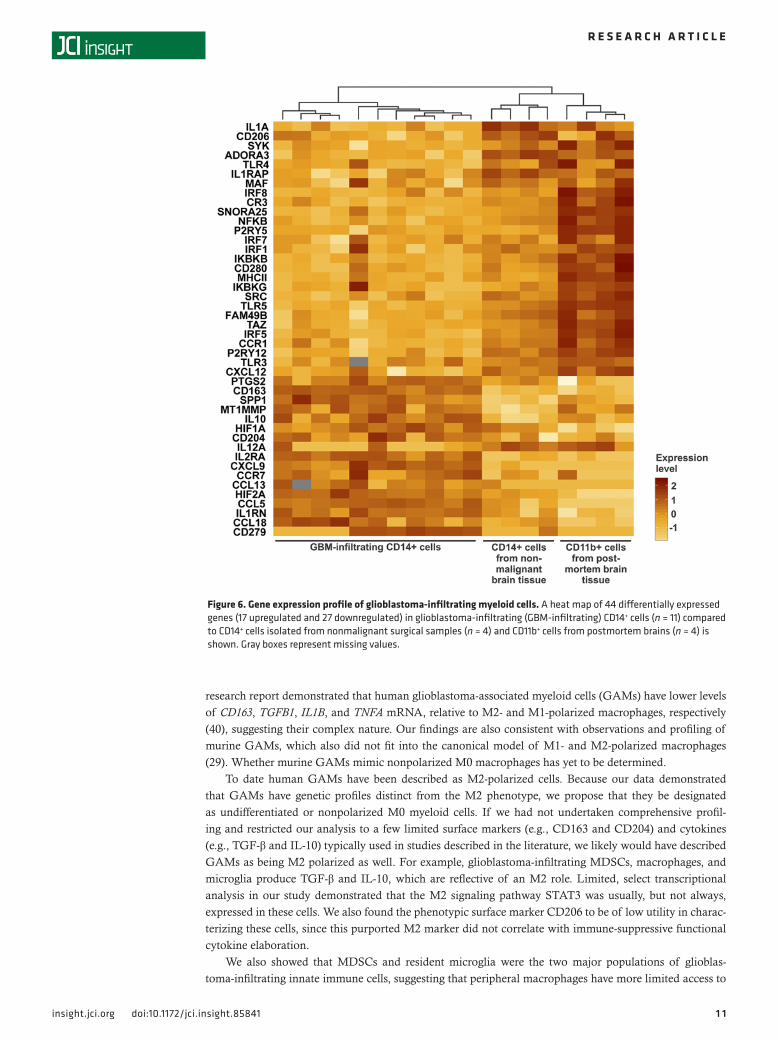
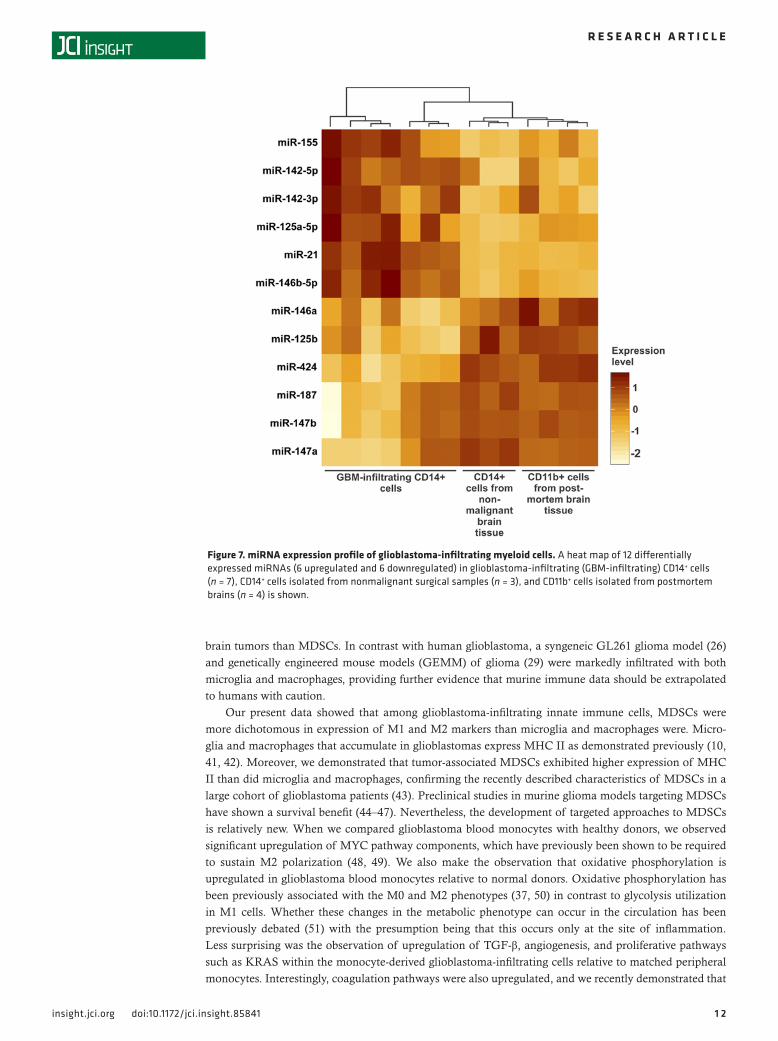
Next, we compared the Nanostring gene expression profiles of glioblastoma-infiltrating CD14+ cells with the profiles of CD14+ cells isolated from nonmalignant surgical samples and CD11b+ cells isolated from postmortem brains (Figure 6). Among 44 differentially expressed genes, 16 were overexpressed, including transcription factors (HIF1A and HIF2A), receptors (e.g., CD163, CD204, and CD279), cytokines (e.g., CXCL9 and IL10), enzymes (MT1MMP and PTGS2), and the glycoprotein SPP1 (osteopontin). The downregulated genes (n = 28) included transcription factors (e.g., IRF genes, NFKB, and TAZ), receptors (e.g., ADORA3, CD206, CR3, MHCII, TLR genes, and P2RY12), cytokines (CXCL12, IL1A, and IL12A), enzymes (SRC and SYK), components of the IκB kinase complex (IKBKB and IKBKG), and the lncRNA SNORA25. In glioblastoma-infiltrating CD14+ cells, miR-21, miR-125a-5p, miR-142-3p, miR-142-5p, miR-146b-5p, and miR-155 were overexpressed relative to normal cells, whereas and miR-125b, miR-146a, and miR-424 were underexpressed (Figure 7).
Glioblastoma-infiltrating CD14+ monocyte lineage cells align with nonpolarized M0 macrophages. We estab-lished and improved upon the in vitro model of monocyte-to-macrophage differentiation and polarization toward the M1, M2a, and M2c phenotypes using human monocytes isolated from healthy blood donor buffy coats based on a previously described protocol (ref. 36 and Supplemental Figure 8, A and B). To verify that we are able to recapitulate the phenotype of subsets from ex vivo polarization, flow cytometry analysis was performed to determine the expression of M1 (CD80, CD86, MHCII, TNF-α, and pSTAT1)
Table 2. List of noncoding RNAs evaluated using Nanostring
Noncoding RNA Name Target of probemiRNA (n = 24) miR-9 miR-9-5p
miR-20a miR-20a and miR-20b-5pmiR-21 miR-21-5p
miR-29a miR-29a-3pmiR-34a miR-43a-3pmiR-106a miR-106a-5p and miR-17-5p
miR-125a-5p miR-125a-5pmiR-125b miR-125b-5p
miR-142-3p miR-142-3pmiR-142-5p miR-142-5pmiR-146a miR-146a-5p
miR-146b-5p miR-146b-5pmiR-147a miR-147amiR-147b miR-147bmiR-155 miR-155-5pmiR-181b miR-181b-5p and miR-181dmiR-187 miR-187-3pmiR-223 miR-223-3pmiR-378 miR-378a-3p and miR-378imiR-424 miR-424-5p
miR-4792 miR-4792miR-494 miR-494miR-511 miR-511
miR-574-5p miR-574-5plncRNA (n = 5) CCDC26 CCDC26
C14orf139 C14orf139RP11-26E5.1 RP11-26E5.1
RP11-419k12.1 RP11-419k12.1SNORA25 SNORA25
7insight.jci.org doi:10.1172/jci.insight.85841
R e s e a R c h a R t i c l e
and M2 (CD163, CD204, CD206, CSF-1R, TGF-β1, and IL-10) markers in cultured nonpolarized M0 and polarized macrophages (Supplemental Figure 8, C–F). Both nonpolarized and M1-polarized macrophages had higher levels of MHC II expression when compared to M2-polarized macrophages (Supplemental Figure 8, C–E). Also, expression of the costimulatory molecule CD80 was markedly higher in M1- and M2-polarized macrophages than in M0 cells, although M1-skewed cells had a greater MFI compared to M0 cells. Moreover, M1-polarized macrophages had high levels of CD86 expression. TNF-α was mostly expressed in M1-polarized macrophages, whereas pSTAT1 was overexpressed in M1- and M2c-polarized macrophages. The scavenger receptor CD163 and mannose receptor CD204 were predominantly aug-mented in M2a- and M2c-polarized macrophages relative to M0 macrophages. Another mannose receptor, CD206, was more highly expressed in M0 and M2a-polarized macrophages than in M1-polarized cells. We observed elevated expression of TGF-β1 in both M2a- and M2c-polarized macrophages. The antiin-
Figure 2. Characteristics of MDSCs, microglia, and macrophages within glioblastomas. (A) Representative contour dot plots of CD11b+ cells isolated from resected glioblastoma (GBM) tissue or nonmalignant brain tissue and stained with isotype controls or anti-CD11b and anti-CD45 antibodies to distinguish myeloid-derived suppressor cells (MDSCs) (CD11b+CD45med), microglia (CD11b+CD45low), and macrophages (CD11b+CD45high). (B) Representative histograms for CD11b and CD14 expression in the CD11b+ fraction. (C) Representative histogram overlay for CD14 expression in GBM-infiltrating CD11b+ cells (MDSCs, microglia, and macrophages) relative to isotype control (iso) (gray histogram). The mean fluorescence intensity (MFI) of CD14 expression in MDSCs (blue bar), microglia (red bar), and macrophages (black bar) is shown. (D) Percentages of MDSCs (blue circles), microglia (red squares), and macro-phage (black triangles) among CD11b+ cells within 17 resected GBMs. The data are presented as the mean ± SD. A 2-sided paired t test was used to calcu-late P values. *P < 0.05; **P < 0.01. (E) Percentages of MDSCs (blue), microglia (red), and macrophage (black) among CD11b+ cells within proneural (n = 3), neural (n = 4), classical (n = 6), and mesenchymal (n = 3) GBMs. The data are presented as the mean. A 2-sided t test or paired t test, when appropriate, was used to calculate P values (classical GBM: MDSCs vs. macrophages, P < 0.05; mesenchymal GBM: microglia vs. MDSCs and macrophages, P < 0.05).
8insight.jci.org doi:10.1172/jci.insight.85841
R e s e a R c h a R t i c l e
flammatory cytokine IL-10 was commonly highly expressed in all four subtypes of macrophages; however, we detected the greatest MFI in M2a-polarized macrophages. Finally, we found statistically significantly higher expression of CSF-1R in M2a- and M2c-polarized macrophages compared to M0 macrophages. Cumulatively, based on multiple phenotypic and functional parameters, we concluded that we successfully derived the designated subsets of macrophages from normal human monocytes.
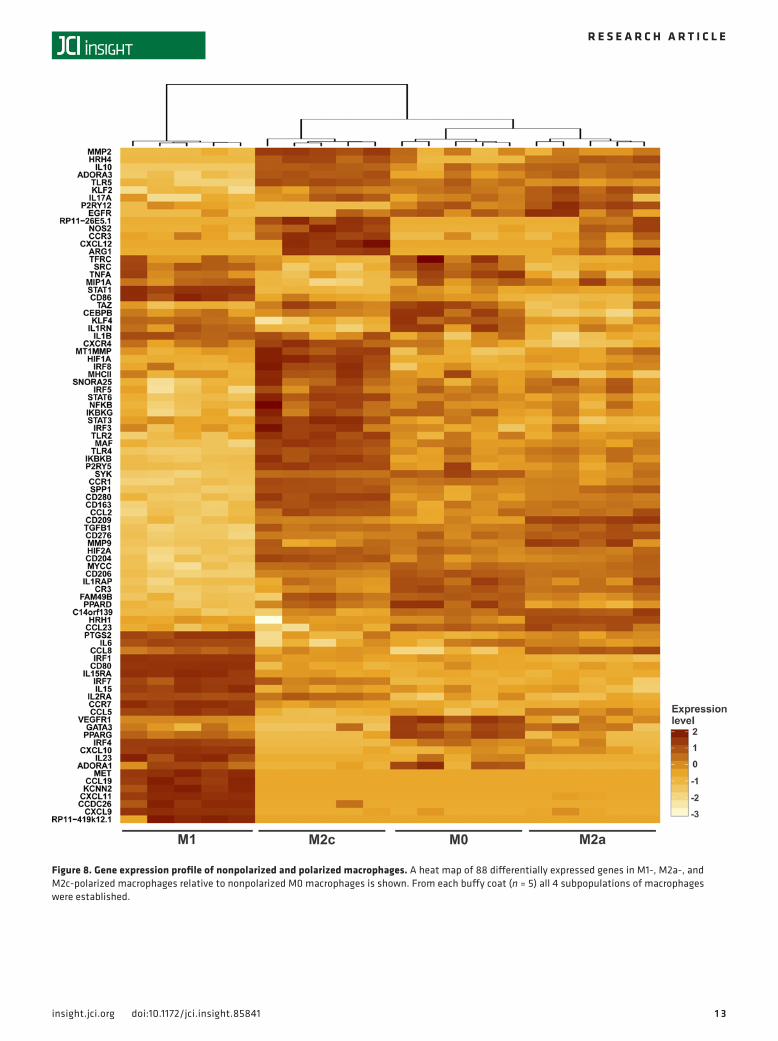
Next, we performed Nanostring expression profiling of M0, M1, M2a, and M2c subsets of macro-phages (Figure 8). M1 polarization of macrophages was associated with the most dramatic changes in gene expression, whereas nonpolarized M0 and M2a- and M2c-polarized macrophages revealed subtle genetic differences and possessed more closely aligned expression patterns, consistent with prior reports of microarray analyses (36, 37). Among the genes that most clearly distinguished M1 macrophages were the transcription factors IRF1 and STAT1; the receptors CCR7, CD80, IL15RA, and MET; a variety of cytokines, such as CXCL9, CXCL10, and CXCL11; the enzyme PTGS2; the Ca channel KCNN2; and the lncRNAs CCDC26 and RP11-419k12.1. Genes distinguishing M2c macrophages included the transcription factors
Figure 3. Immune phenotype of glioblastoma-infiltrating myeloid-derived suppressor cells, microglia, and macrophages. Percentage of (A) MHC II, CD80, and CD86; (B) CD163 and CD206; (C) pSTAT1 and pSTAT3 (macrophages vs. microglia, P = 0.051; macrophages vs. myeloid-derived suppressor cells [MDSCs], P = 0.068); and (D) TNF-α, TGF-β1, and IL-10 expression in MDSCs (blue circles), microglia (red squares), and macrophages (black triangles) within 17 resected glioblastomas. The mean fluorescence intensity (MFI) for MHC II, TGF-β1, and IL-10 is shown. The data are presented as the mean ± SD. A 2-sided Wilcoxon signed-rank test was performed to calculate P values. *P < 0.05; **P < 0.01; ***P < 0.001; ****P < 0.0001. Percentages of (E) TNF-α, (F) CD163, and (G) CD206 expression in MDSCs, microglia, and macrophages within proneural (PN; orange circles, n = 3), neural (NE; gray squares, n = 4), classical (CL; green triangles, n = 6), and mesenchymal (MES; purple diamonds, n = 3) glioblastomas. The data are presented as the mean ± SD. For the comparison between subtypes of glioblastoma in E, F, and G, we used 2-sample t test; for comparison between the immune phenotypes by each glioblas-toma subtype, we used a paired t test. *P < 0.05.
9insight.jci.org doi:10.1172/jci.insight.85841
R e s e a R c h a R t i c l e
Figure 4. Gene expression profile of myeloid cells upon interaction with glioblastoma. (A) Gene expression profile of glioblastoma-infiltrating (GBM-infil-trating) CD14+ cells (n = 4) and matched CD14+ blood cells (n = 4), as determined using a microarray. A heat map of 1,122 differentially expressed genes (584 upregulated and 538 downregulated) is shown. (B) Gene set enrichment analysis of GBM-infiltrating CD14+ cells relative to matched CD14+ blood cells was performed as described for Figure 1. (C) Canonical pathway activity analysis was performed as described for Figure 1. (D) Nanostring digital gene expression profiling in GBM-infiltrating CD14+ cells (n = 11) and matched CD14+ blood cells (n = 11). A heat map of 71 differentially expressed genes (34 upregulated and 37 downregulated) is shown. Gray boxes represent missing values. (E) Heat map of 10 differentially expressed genes in mesenchymal GBM-infiltrating CD14+ cells (n = 4) relative to that in other subtypes (n = 7) and classical GBM-infiltrating CD14+ cells (n = 3) relative to that in other subtypes (n = 8).
1 0insight.jci.org doi:10.1172/jci.insight.85841
R e s e a R c h a R t i c l e
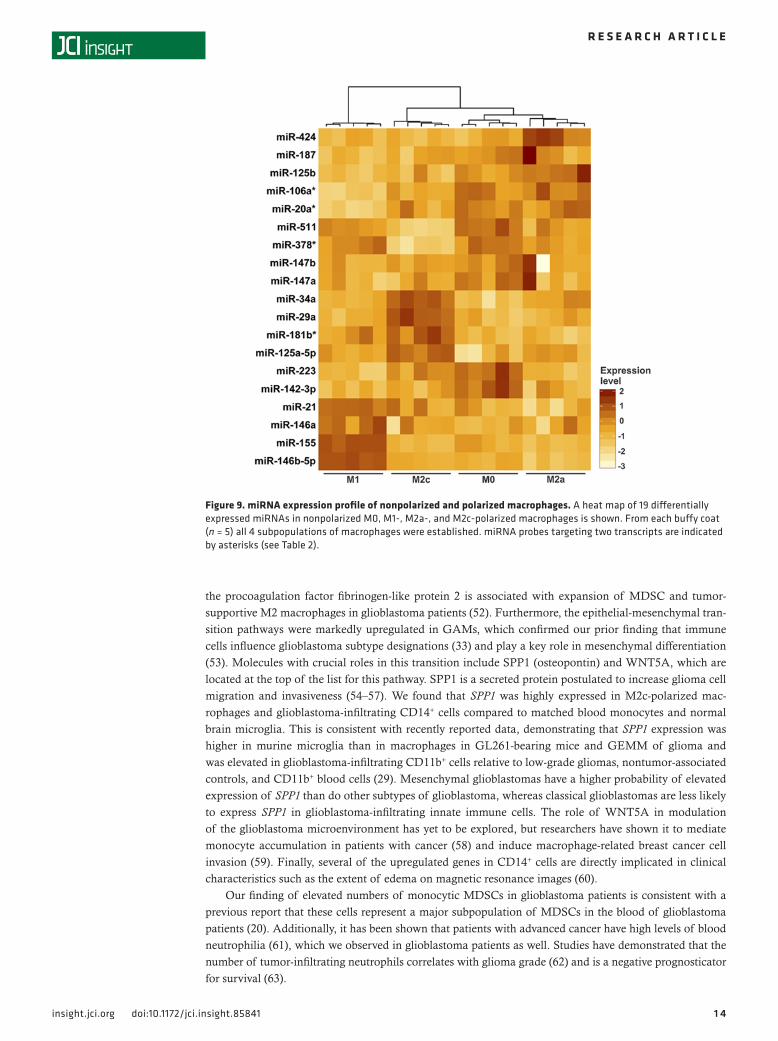
HIF1A and STAT3; the receptors CCR3, CD163, and CD280; the cytokine CXCL12; the enzymes ARG1, MMP2, and NOS2; the glycoprotein SPP1; and the lncRNA RP11-26E5.1. Classical M1 and alternative M2 macrophages can be modulated by miRNAs (38). We found that the miRNAs miR-146b-5p and miR-155 clearly distinguished M1-polarized macrophages, whereas miR-29a, miR-34a, and miR-125a-5p were most highly expressed in M2c macrophages (Figure 9). miR-223 predominated in nonpolarized M0, while monocyte differentiation into the M2a phenotype was distinguished by elevated expression of miR-424.
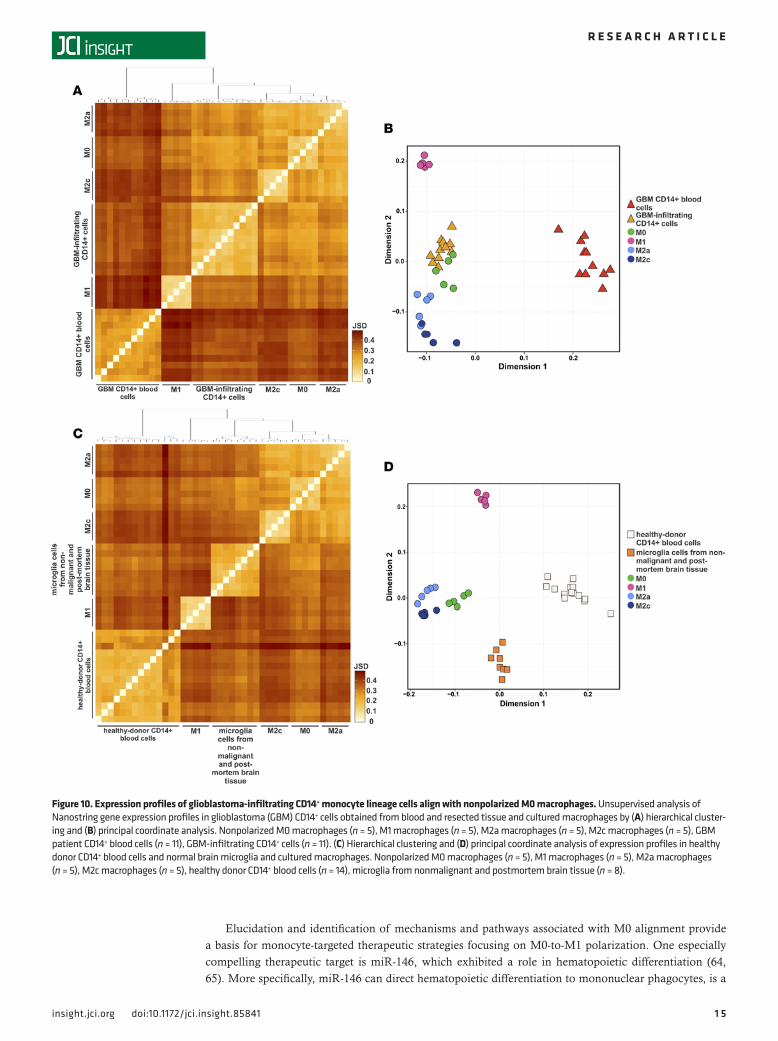
Finally, we conducted an unsupervised analysis of the gene expression profiles across nonpolarized M0 and polarized (M1, M2a, and M2c) macrophages, glioblastoma patient CD14+ blood cells, and glioblas-toma-infiltrating CD14+ cells. Both hierarchical clustering (Figure 10A) and principal coordinate analysis (Figure 10B) demonstrated clear and strong separation of glioblastoma patient CD14+ blood cells from other groups. Interestingly, the glioblastoma-infiltrating CD14+ cells aligned most closely with nonpolar-ized M0 macrophages. Healthy donor CD14+ blood cells and microglia cells isolated from nonmalignant brain surgical samples and postmortem brains were clearly separated from one another as well as from nonpolarized and polarized macrophages (Figure 10, C and D).
DiscussionTo our knowledge, this is the first description of the M1-M2 continuum in human glioblastoma. Based on several high-impact studies describing the M1 versus M2 dichotomy during in vitro culture, investigators have presumed that this type of polarization occurs within the in vivo tumor microenvironment. How-ever, comprehensive profiling of ex vivo human data indicates that this is an over simplification and that these immune populations assume phenotypes along the M1-M2 continuum with closer alignment to M0. In fact, we identified few immune cells isolated directly from glioblastomas that strictly adhered to the defined polar extremes. This observation parallels a previous description of the Th1 versus Th2 dichotomy that prolonged, repetitive stimulation is required to achieve distinct polarization (39). A brief preliminary
Figure 5. miRNA expression profile of myeloid cells upon interaction with glioblastoma. A heat map of 15 differen-tially expressed miRNAs (6 upregulated and 9 downregulated) in glioblastoma-infiltrating (GBM-infiltrating) CD14+ cells (n = 7) and matched CD14+ blood cells (n = 7) is shown. miRNA probes targeting two transcripts are indicated with asterisks (see Table 2).
1 1insight.jci.org doi:10.1172/jci.insight.85841
R e s e a R c h a R t i c l e
research report demonstrated that human glioblastoma-associated myeloid cells (GAMs) have lower levels of CD163, TGFB1, IL1B, and TNFA mRNA, relative to M2- and M1-polarized macrophages, respectively (40), suggesting their complex nature. Our findings are also consistent with observations and profiling of murine GAMs, which also did not fit into the canonical model of M1- and M2-polarized macrophages (29). Whether murine GAMs mimic nonpolarized M0 macrophages has yet to be determined.
To date human GAMs have been described as M2-polarized cells. Because our data demonstrated that GAMs have genetic profiles distinct from the M2 phenotype, we propose that they be designated as undifferentiated or nonpolarized M0 myeloid cells. If we had not undertaken comprehensive profil-ing and restricted our analysis to a few limited surface markers (e.g., CD163 and CD204) and cytokines (e.g., TGF-β and IL-10) typically used in studies described in the literature, we likely would have described GAMs as being M2 polarized as well. For example, glioblastoma-infiltrating MDSCs, macrophages, and microglia produce TGF-β and IL-10, which are reflective of an M2 role. Limited, select transcriptional analysis in our study demonstrated that the M2 signaling pathway STAT3 was usually, but not always, expressed in these cells. We also found the phenotypic surface marker CD206 to be of low utility in charac-terizing these cells, since this purported M2 marker did not correlate with immune-suppressive functional cytokine elaboration.
We also showed that MDSCs and resident microglia were the two major populations of glioblas-toma-infiltrating innate immune cells, suggesting that peripheral macrophages have more limited access to
Figure 6. Gene expression profile of glioblastoma-infiltrating myeloid cells. A heat map of 44 differentially expressed genes (17 upregulated and 27 downregulated) in glioblastoma-infiltrating (GBM-infiltrating) CD14+ cells (n = 11) compared to CD14+ cells isolated from nonmalignant surgical samples (n = 4) and CD11b+ cells from postmortem brains (n = 4) is shown. Gray boxes represent missing values.
1 2insight.jci.org doi:10.1172/jci.insight.85841
R e s e a R c h a R t i c l e
brain tumors than MDSCs. In contrast with human glioblastoma, a syngeneic GL261 glioma model (26) and genetically engineered mouse models (GEMM) of glioma (29) were markedly infiltrated with both microglia and macrophages, providing further evidence that murine immune data should be extrapolated to humans with caution.
Our present data showed that among glioblastoma-infiltrating innate immune cells, MDSCs were more dichotomous in expression of M1 and M2 markers than microglia and macrophages were. Micro-glia and macrophages that accumulate in glioblastomas express MHC II as demonstrated previously (10, 41, 42). Moreover, we demonstrated that tumor-associated MDSCs exhibited higher expression of MHC II than did microglia and macrophages, confirming the recently described characteristics of MDSCs in a large cohort of glioblastoma patients (43). Preclinical studies in murine glioma models targeting MDSCs have shown a survival benefit (44–47). Nevertheless, the development of targeted approaches to MDSCs is relatively new. When we compared glioblastoma blood monocytes with healthy donors, we observed significant upregulation of MYC pathway components, which have previously been shown to be required to sustain M2 polarization (48, 49). We also make the observation that oxidative phosphorylation is upregulated in glioblastoma blood monocytes relative to normal donors. Oxidative phosphorylation has been previously associated with the M0 and M2 phenotypes (37, 50) in contrast to glycolysis utilization in M1 cells. Whether these changes in the metabolic phenotype can occur in the circulation has been previously debated (51) with the presumption being that this occurs only at the site of inflammation. Less surprising was the observation of upregulation of TGF-β, angiogenesis, and proliferative pathways such as KRAS within the monocyte-derived glioblastoma-infiltrating cells relative to matched peripheral monocytes. Interestingly, coagulation pathways were also upregulated, and we recently demonstrated that
Figure 7. miRNA expression profile of glioblastoma-infiltrating myeloid cells. A heat map of 12 differentially expressed miRNAs (6 upregulated and 6 downregulated) in glioblastoma-infiltrating (GBM-infiltrating) CD14+ cells (n = 7), CD14+ cells isolated from nonmalignant surgical samples (n = 3), and CD11b+ cells isolated from postmortem brains (n = 4) is shown.
1 3insight.jci.org doi:10.1172/jci.insight.85841
R e s e a R c h a R t i c l e
Figure 8. Gene expression profile of nonpolarized and polarized macrophages. A heat map of 88 differentially expressed genes in M1-, M2a-, and M2c-polarized macrophages relative to nonpolarized M0 macrophages is shown. From each buffy coat (n = 5) all 4 subpopulations of macrophages were established.
1 4insight.jci.org doi:10.1172/jci.insight.85841
R e s e a R c h a R t i c l e
the procoagulation factor fibrinogen-like protein 2 is associated with expansion of MDSC and tumor-supportive M2 macrophages in glioblastoma patients (52). Furthermore, the epithelial-mesenchymal tran-sition pathways were markedly upregulated in GAMs, which confirmed our prior finding that immune cells influence glioblastoma subtype designations (33) and play a key role in mesenchymal differentiation (53). Molecules with crucial roles in this transition include SPP1 (osteopontin) and WNT5A, which are located at the top of the list for this pathway. SPP1 is a secreted protein postulated to increase glioma cell migration and invasiveness (54–57). We found that SPP1 was highly expressed in M2c-polarized mac-rophages and glioblastoma-infiltrating CD14+ cells compared to matched blood monocytes and normal brain microglia. This is consistent with recently reported data, demonstrating that SPP1 expression was higher in murine microglia than in macrophages in GL261-bearing mice and GEMM of glioma and was elevated in glioblastoma-infiltrating CD11b+ cells relative to low-grade gliomas, nontumor-associated controls, and CD11b+ blood cells (29). Mesenchymal glioblastomas have a higher probability of elevated expression of SPP1 than do other subtypes of glioblastoma, whereas classical glioblastomas are less likely to express SPP1 in glioblastoma-infiltrating innate immune cells. The role of WNT5A in modulation of the glioblastoma microenvironment has yet to be explored, but researchers have shown it to mediate monocyte accumulation in patients with cancer (58) and induce macrophage-related breast cancer cell invasion (59). Finally, several of the upregulated genes in CD14+ cells are directly implicated in clinical characteristics such as the extent of edema on magnetic resonance images (60).
Our finding of elevated numbers of monocytic MDSCs in glioblastoma patients is consistent with a previous report that these cells represent a major subpopulation of MDSCs in the blood of glioblastoma patients (20). Additionally, it has been shown that patients with advanced cancer have high levels of blood neutrophilia (61), which we observed in glioblastoma patients as well. Studies have demonstrated that the number of tumor-infiltrating neutrophils correlates with glioma grade (62) and is a negative prognosticator for survival (63).
Figure 9. miRNA expression profile of nonpolarized and polarized macrophages. A heat map of 19 differentially expressed miRNAs in nonpolarized M0, M1-, M2a-, and M2c-polarized macrophages is shown. From each buffy coat (n = 5) all 4 subpopulations of macrophages were established. miRNA probes targeting two transcripts are indicated by asterisks (see Table 2).
1 5insight.jci.org doi:10.1172/jci.insight.85841
R e s e a R c h a R t i c l e
Elucidation and identification of mechanisms and pathways associated with M0 alignment provide a basis for monocyte-targeted therapeutic strategies focusing on M0-to-M1 polarization. One especially compelling therapeutic target is miR-146, which exhibited a role in hematopoietic differentiation (64, 65). More specifically, miR-146 can direct hematopoietic differentiation to mononuclear phagocytes, is a
Figure 10. Expression profiles of glioblastoma-infiltrating CD14+ monocyte lineage cells align with nonpolarized M0 macrophages. Unsupervised analysis of Nanostring gene expression profiles in glioblastoma (GBM) CD14+ cells obtained from blood and resected tissue and cultured macrophages by (A) hierarchical cluster-ing and (B) principal coordinate analysis. Nonpolarized M0 macrophages (n = 5), M1 macrophages (n = 5), M2a macrophages (n = 5), M2c macrophages (n = 5), GBM patient CD14+ blood cells (n = 11), GBM-infiltrating CD14+ cells (n = 11). (C) Hierarchical clustering and (D) principal coordinate analysis of expression profiles in healthy donor CD14+ blood cells and normal brain microglia and cultured macrophages. Nonpolarized M0 macrophages (n = 5), M1 macrophages (n = 5), M2a macrophages (n = 5), M2c macrophages (n = 5), healthy donor CD14+ blood cells (n = 14), microglia from nonmalignant and postmortem brain tissue (n = 8).
1 6insight.jci.org doi:10.1172/jci.insight.85841
R e s e a R c h a R t i c l e
negative regulator of classical NF-κB activation, and targets IRAK1 and TRAF. We found that miR-146 was upregulated in the M1-polarized macrophages but downregulated in glioblastoma-infiltrating CD14+ cells relative to normal brain-infiltrating CD14+ cells. The expression was further decreased in glioblas-toma patient CD14+ blood cells compared to healthy donors. As we demonstrated previously, the role of a given miRNA is contextual, and it can be exploited as an immune therapeutic (66, 67). Whether delivery of miR-146 can induce M0-to-M1 polarization and exert a therapeutic effect in glioma models will be determined in future studies.
MethodsAdditional details can be found in the Supplemental Methods.
Human subjects. Patient tumors were graded pathologically as newly diagnosed adult glioblastoma (n = 43 total for all studies) by a neuropathologist according to the World Health Organization classifi-cation. At least 2 g of viable, nonnecrotic tumor was required to obtain sufficient quantities of immune cells for analysis and was processed within 1 hour after resection. Peripheral blood was drawn from the patients intra-operatively and from healthy donors. Control CD14+ cells (general marker of mye-loid lineage cells) (68) (n = 4; age range of 26–35) were derived from tissue samples surgically resected from nonmalignant cases of intractable epilepsy (Montreal Neurological Institute). These samples were obtained from tissues removed during the approach to the lesion site. CD11b+ cells (marker for innate immune cells) from postmortem brain tissue (n = 4, age 67 and 78, gray and white matter, postmortem delay 7–9 hours) were obtained from The Netherlands Brain Bank (NBB) at Netherlands Institute for Neuroscience, Amsterdam (http://www.brainbank.nl/). Human glioblastoma or nonmalignant central nervous system tissue was digested with Liberase TM Research Grade Enzyme (Roche Diagnostics), which contains highly purified collagenase I and II. This approach significantly improves cell isolation over standard collagenase digestion (69). After enzymatic digestion, myelin was removed by centrifu-gation in a Percoll gradient (70), which has been shown to result in the most viable myeloid cells (71).
Isolation of myeloid cells from fresh human glioblastoma tissue. Freshly resected human glioblastoma tis-sue was minced into small pieces using a scalpel, dissociated using a Pasteur pipette, and suspended in Roswell Park Memorial Institute (RPMI) 1640 medium with L-glutamine (Mediatech Inc.) containing Liberase TM Research Grade Enzyme at a final concentration of 30 μg/ml. The prepared mixture was incubated for 1 hour at 37°C with agitation. After brief centrifugation, the pellet was resuspended in 20 ml of 1.03 Percoll underlaid with 10 ml of 1.095 Percoll, and overlaid with 10 ml of fluorescence-activated cell sorter buffer (5% FBS, Sigma-Aldrich) in PBS (Mediatech Inc.). The tube was centrifuged at 1,200 g for 20 minutes at room temperature with no brake. After centrifugation, the cell layer on top of the 1.095 Percoll was collected, filtered through a 70-μm nylon strainer (BD Biosciences), washed, stained with Trypan blue dye (Sigma-Aldrich), and counted in a Neubauer chamber (Fisher Scientific). Afterward, myeloid cells were blocked for nonspecific binding using FcγR-binding inhibitor (Miltenyi Biotec) and magnetically labeled with CD11b or CD14 microbeads (Miltenyi Biotec) at 4°C for 30 minutes. The cell suspension was loaded onto a MACS Column (Miltenyi Biotec) in the magnetic field. The negative frac-tion was discharged. Upon removal of the column from the MACS separation system, CD11b+ or CD14+ cells were eluted as positive fractions.
Isolation of microglia from human nontumoral tissue and postmortem brain tissue. Samples of brain tissue sur-gically resected from cases of intractable epilepsy of nonmalignant origin were processed as described pre-viously (72), and microglia were separated magnetically with CD14 microbeads. Postmortem brain tissue was digested as described previously (73), and microglia were isolated via selection with CD11b magnetic microbeads. Total RNA was extracted using a mirVana miRNA isolation kit (Life Technologies) according to the manufacturer’s protocol.
Isolation of CD14+ monocytes. Peripheral blood mononuclear cells (PBMCs) were purified from healthy blood donors (Gulf Coast Blood Center, Houston, Texas), healthy donors (volunteers), and from glioblastoma patients undergoing resection at The University of Texas MD Anderson Cancer Center by centrifugation on a Ficoll-Hypaque density gradient (Sigma-Aldrich) (66). CD14+ monocytes were isolated from PBMCs via positive selection using CD14 microbeads (Miltenyi Biotech) as per the manufacturer’s instructions.
Monocyte differentiation into the M0, M1, M2a, or M2c phenotype. M1 and M2 macrophages were obtained after 8 days of culture of human CD14+ monocytes in RPMI 1640 medium with L-glutamine (Mediatech Inc.)
1 7insight.jci.org doi:10.1172/jci.insight.85841
R e s e a R c h a R t i c l e
supplemented with 20% heat-inactivated FBS (Sigma-Aldrich) and granulocyte-macrophage colony-stimulat-ing factor (GM-CSF; 50 ng/ml for M1) or macrophage colony-stimulating factor (M-CSF; 100 ng/ml for M2; Peprotech). Nonpolarized M0 macrophages were generated by culturing monocytes in media with GM-CSF and harvested on day 4. For M1 and M2 polarization, on day 4, 50% of complete, fresh M1 or M2 monocyte medium was added for 48 hours. Macrophage skewing was obtained by removing the culture medium on day 6 and culturing cells for an additional 48 hours in monocyte medium with GM-CSF, 100 ng/ml lipopolysaccha-ride from Escherichia coli 055:B5 (Sigma-Aldrich), 50 ng/ml IFN-γ, and 20 ng/ml TNF-α (Peprotech; for M1 polarization); M-CSF and 20 ng/ml IL-4 (R&D Systems; for M2a polarization); or M-CSF, 10 ng/ml IL-10, and TGF-β1 (Peprotech; for M2c polarization).
Accession numbers. All original microarray data and RNA-sequencing data were deposited in the NCBI’s Gene Expression Omnibus (accession GSE77043 and GSE77530).
Statistics. Overall survival, defined as the number of days from the date of diagnosis to the date of death, was estimated using the Kaplan-Meier method. The log-rank test, Cox proportional regression, an accelerated life model, and an additive Cox proportional hazard model were employed to determine the survival differences among individual groups. R statistical software (version 3.0.2) with the survival (ver-sion 2.37-4) and mgcv (version 1.8-6) packages was used for data analysis. For statistical analysis of other results, a random-effects model, a linear mixed-effects model, 2-sided paired and unpaired t tests, or a 2-sided Wilcoxon signed-rank test was performed. Values are shown as mean ± SD. P values less than or equal to 0.05 were considered statistically significant.
Study approval. This study was conducted under protocols LAB03-0687 and LAB06-0008, which were approved by the Institutional Review Board of The University of Texas MD Anderson Cancer Center. The Research Ethics Board of McGill University approved the use of nonidentifiable tissues for research. All material was collected from donors who provided written informed consent for a brain autopsy, and the use of the material and clinical information for research purposes was obtained by the NBB.
Author contributionsKG, BR, JW, and ABH conceived and designed the study. KG, BR, JW, SNM, GT, AE, NKY, RE, and RRC developed methodology. KG, JW, YH, LMH, SNM, GT, AE, BDL, NKY, RE, and NH acquired data. KG, BR, JW, YH, LMH, SNM, GT, SZ, QW, AE, BDL, NKY, RE, WL, RRC, and ABH analyzed and interpreted data. JW, SSP, GR, RS, LAL, JMB, GNF, ABO, LJC, EPS, and JPA contributed reagents/materials. KG, BR, MAC, KPB, JPA, and ABH wrote, reviewed, and revised the manuscript.
AcknowledgmentsThe authors thank Jared Burks, Duncan Mak, and Wendy Schober in the MD Anderson Flow Cytome-try and Cellular Imaging Core Facility for their assistance with flow cytometry and Vectra 2 microscopic data acquisition. They also thank the members of the MD Anderson Sequencing and Microarray Core Facility for RNA sequencing. The authors especially thank Donald Norwood, Lamonne Crutcher, and Audria Patrick for their editorial and administrative support; Benjamin Lichtiger at the MD Anderson Blood Bank; and Alicia Ledoux of the MD Anderson Tissue Bank. This study was funded by NIH grants RO1 CA120813, RO1 HG007538, RO1 CA193466, P50 CA093459, P50 CA127001, and P30CA016672; the Dr. Marnie Rose Foundation; The University of Texas MD Anderson GBM Moonshot Program; and the Ethan Dmitrovsky Provost Funds.
Address correspondence to: Amy B. Heimberger, Department of Neurosurgery, The University of Texas MD Anderson Cancer Center, Unit 422, PO Box 301402, Houston, Texas 77230-1402, USA. Phone: 713.792.2400; E-mail: [email protected].
1. Badie B, Schartner JM. Flow cytometric characterization of tumor-associated macrophages in experimental gliomas. Neurosurgery. 2000;46(4):957–961.
2. Kettenmann H, Hanisch UK, Noda M, Verkhratsky A. Physiology of microglia. Physiol Rev. 2011;91(2):461–553. 3. Roggendorf W, Strupp S, Paulus W. Distribution and characterization of microglia/macrophages in human brain tumors. Acta
Neuropathol (Berl). 1996;92(3):288–293. 4. Morimura T, et al. Monocyte subpopulations in human gliomas: expression of Fc and complement receptors and correlation
with tumor proliferation. Acta Neuropathol (Berl). 1990;80(3):287–294.
1 8insight.jci.org doi:10.1172/jci.insight.85841
R e s e a R c h a R t i c l e
5. Wierzba-Bobrowicz T, Kuchna I, Matyja E. Reaction of microglial cells in human astrocytomas (preliminary report). Folia Neuro-pathol. 1994;32(4):251–252.
6. Graeber MB, Scheithauer BW, Kreutzberg GW. Microglia in brain tumors. Glia. 2002;40(2):252–259. 7. Sica A, et al. Macrophage polarization in tumour progression. Semin Cancer Biol. 2008;18(5):349–355. 8. Wu A, et al. Glioma cancer stem cells induce immunosuppressive macrophages/microglia. Neuro Oncol. 2010;12(11):1113–1125. 9. Kong LY, et al. Intratumoral mediated immunosuppression is prognostic in genetically engineered murine models of glioma and
correlates to immunotherapeutic responses. Clin Cancer Res. 2010;16(23):5722–5733. 10. Hussain SF, Yang D, Suki D, Aldape K, Grimm E, Heimberger AB. The role of human glioma-infiltrating microglia/macro-
phages in mediating antitumor immune responses. Neuro Oncol. 2006;8(3):261–279. 11. Gabrilovich DI, Ostrand-Rosenberg S, Bronte V. Coordinated regulation of myeloid cells by tumours. Nat Rev Immunol.
2012;12(4):253–268. 12. Umemura N, et al. Tumor-infiltrating myeloid-derived suppressor cells are pleiotropic-inflamed monocytes/macrophages that
bear M1- and M2-type characteristics. J Leukoc Biol. 2008;83(5):1136–1144. 13. Jia W, Jackson-Cook C, Graf MR. Tumor-infiltrating, myeloid-derived suppressor cells inhibit T cell activity by nitric oxide pro-
duction in an intracranial rat glioma + vaccination model. J Neuroimmunol. 2010;223(1-2):20–30. 14. Martinez FO, Sica A, Mantovani A, Locati M. Macrophage activation and polarization. Front Biosci. 2008;13:453–461. 15. Pollard JW. Tumour-educated macrophages promote tumour progression and metastasis. Nat Rev Cancer. 2004;4(1):71–78. 16. Mantovani A, Sica A, Sozzani S, Allavena P, Vecchi A, Locati M. The chemokine system in diverse forms of macrophage acti-
vation and polarization. Trends Immunol. 2004;25(12):677–686. 17. Komohara Y, Ohnishi K, Kuratsu J, Takeya M. Possible involvement of the M2 anti-inflammatory macrophage phenotype in
growth of human gliomas. J Pathol. 2008;216(1):15–24. 18. Prosniak M, et al. Glioma grade is associated with the accumulation and activity of cells bearing M2 monocyte markers. Clin
Cancer Res. 2013;19(14):3776–3786. 19. Gabrusiewicz K, et al. Macrophage ablation reduces M2-like populations and jeopardizes tumor growth in a MAFIA-based
glioma model. Neoplasia. 2015;17(4):374–384. 20. Gielen PR, et al. Increase in both CD14-positive and CD15-positive myeloid-derived suppressor cell subpopulations in the blood
of patients with glioma but predominance of CD15-positive myeloid-derived suppressor cells in glioma tissue. J Neuropathol Exp Neurol. 2015;74(5):390–400.
21. Raychaudhuri B, et al. Myeloid-derived suppressor cell accumulation and function in patients with newly diagnosed glioblas-toma. Neuro Oncol. 2011;13(6):591–599.
22. Wang J, et al. The clinical significance of tumor-infiltrating neutrophils and neutrophil-to-CD8+ lymphocyte ratio in patients with resectable esophageal squamous cell carcinoma. J Transl Med. 2014;12:7.
23. Hao S, Andersen M, Yu H. Detection of immune suppressive neutrophils in peripheral blood samples of cancer patients. Am J Blood Res. 2013;3(3):239–245.
24. Ellert-Miklaszewska A, Dabrowski M, Lipko M, Sliwa M, Maleszewska M, Kaminska B. Molecular definition of the pro-tum-origenic phenotype of glioma-activated microglia. Glia. 2013;61(7):1178–1190.
25. Zhang H, Qian PY, Ravasi T. Selective phosphorylation during early macrophage differentiation. Proteomics. 2015;15(21):3731–3743.
26. Gabrusiewicz K, Ellert-Miklaszewska A, Lipko M, Sielska M, Frankowska M, Kaminska B. Characteristics of the alternative phenotype of microglia/macrophages and its modulation in experimental gliomas. PLoS One. 2011;6(8):e23902.
27. Parney IF, Waldron JS, Parsa AT. Flow cytometry and in vitro analysis of human glioma-associated macrophages. Laboratory investigation. J Neurosurg. 2009;110(3):572–582.
28. Sedgwick JD, Schwender S, Imrich H, Dorries R, Butcher GW, ter Meulen V. Isolation and direct characterization of resident microglial cells from the normal and inflamed central nervous system. Proc Natl Acad Sci U S A. 1991;88(16):7438–7442.
29. Szulzewsky F, et al. Glioma-associated microglia/macrophages display an expression profile different from m1 and m2 polar-ization and highly express gpnmb and spp1. PLoS One. 2015;10(2):e0116644.
30. Pinton L, et al. Activated T cells sustain myeloid-derived suppressor cell-mediated immune suppression [published online ahead of print December 18, 2015]. Oncotarget. doi:10.18632/oncotarget.6662.
31. Yu J, et al. Myeloid-derived suppressor cells suppress antitumor immune responses through IDO expression and correlate with lymph node metastasis in patients with breast cancer. J Immunol. 2013;190(7):3783–3797.
32. Lechner MG, et al. Functional characterization of human Cd33+ and Cd11b+ myeloid-derived suppressor cell subsets induced from peripheral blood mononuclear cells co-cultured with a diverse set of human tumor cell lines. J Transl Med. 2011;9:90.
33. Doucette TA, et al. Immune heterogeneity of glioblastoma subtypes: extrapolation from the cancer genome atlas. Cancer Immu-nol Res. 2013;1(2):112–122.
34. Verhaak RG, et al. Integrated genomic analysis identifies clinically relevant subtypes of glioblastoma characterized by abnormal-ities in PDGFRA, IDH1, EGFR, and NF1. Cancer Cell. 2010;17(1):98–110.
35. Radhakrishnan A, et al. A pathway map of prolactin signaling. J Cell Commun Signal. 2012;6(3):169–173. 36. Martinez FO, Gordon S, Locati M, Mantovani A. Transcriptional profiling of the human monocyte-to-macrophage differentia-
tion and polarization: new molecules and patterns of gene expression. J Immunol. 2006;177(10):7303–7311. 37. Derlindati E, et al. Transcriptomic analysis of human polarized macrophages: more than one role of alternative activation?
PLoS One. 2015;10(3):e0119751. 38. Squadrito ML, Etzrodt M, De Palma M, Pittet MJ. MicroRNA-mediated control of macrophages and its implications for can-
cer. Trends Immunol. 2013;34(7):350–359. 39. Hsieh CS, Heimberger AB, Gold JS, O’Garra A, Murphy KM. Differential regulation of T helper phenotype development by
interleukins 4 and 10 in an alpha beta T-cell-receptor transgenic system. Proc Natl Acad Sci U S A. 1992;89(13):6065–6069. 40. Hattermann K, et al. Chemokine expression profile of freshly isolated human glioblastoma-associated macrophages/microglia.
Oncol Rep. 2014;32(1):270–276. 41. Mieczkowski J, et al. Down-regulation of IKKbeta expression in glioma-infiltrating microglia/macrophages is associated with
1 9insight.jci.org doi:10.1172/jci.insight.85841
R e s e a R c h a R t i c l e
defective inflammatory/immune gene responses in glioblastoma. Oncotarget. 2015;6(32):33077–33090. 42. Tran CT, et al. Differential expression of MHC class II molecules by microglia and neoplastic astroglia: relevance for the escape
of astrocytoma cells from immune surveillance. Neuropathol Appl Neurobiol. 1998;24(4):293–301. 43. Dubinski D, et al. CD4+ T effector memory cell dysfunction is associated with the accumulation of granulocytic myeloid-de-
rived suppressor cells in glioblastoma patients [published online ahead of print November 17, 2015]. Neuro Oncol.doi:10.1093/neuonc/nov280.
44. Fu C, et al. Identification of a novel membrane protein, HP59, with therapeutic potential as a target of tumor angiogenesis. Clin Cancer Res. 2001;7(12):4182–4194.
45. Fujita M, et al. COX-2 blockade suppresses gliomagenesis by inhibiting myeloid-derived suppressor cells. Cancer Res. 2011;71(7):2664–2674.
46. Kohanbash G, et al. GM-CSF promotes the immunosuppressive activity of glioma-infiltrating myeloid cells through interleu-kin-4 receptor-alpha. Cancer Res. 2013;73(21):6413–6423.
47. Verschuere T, et al. Glioma-derived galectin-1 regulates innate and adaptive antitumor immunity. Int J Cancer. 2014;134(4):873–884.
48. Pello OM, et al. Role of c-MYC in alternative activation of human macrophages and tumor-associated macrophage biology. Blood. 2012;119(2):411–421.
49. Beyer M, et al. High-resolution transcriptome of human macrophages. PLoS One. 2012;7(9):e45466. 50. O’Neill LA, Hardie DG. Metabolism of inflammation limited by AMPK and pseudo-starvation. Nature. 2013;493(7432):346–
355. 51. Kramer PA, Ravi S, Chacko B, Johnson MS, Darley-Usmar VM. A review of the mitochondrial and glycolytic metabolism in
human platelets and leukocytes: implications for their use as bioenergetic biomarkers. Redox biology. 2014;2:206–210. 52. Yan J, et al. FGL2 as a multimodality regulator of tumor-mediated immune suppression and therapeutic target in gliomas.
J Natl Cancer Inst. 2015;107(8):djv137. 53. Bhat KP, et al. Mesenchymal differentiation mediated by NF-kappaB promotes radiation resistance in glioblastoma. Cancer Cell.
2013;24(3):331–346. 54. Jan HJ, et al. Osteopontin regulates human glioma cell invasiveness and tumor growth in mice. Neuro Oncol. 2010;12(1):58–70. 55. Engler JR, et al. Increased microglia/macrophage gene expression in a subset of adult and pediatric astrocytomas. PLoS One.
2012;7(8):e43339. 56. Lu DY, Yeh WL, Huang SM, Tang CH, Lin HY, Chou SJ. Osteopontin increases heme oxygenase-1 expression and subse-
quently induces cell migration and invasion in glioma cells. Neuro Oncol. 2012;14(11):1367–1378. 57. Sreekanthreddy P, et al. Identification of potential serum biomarkers of glioblastoma: serum osteopontin levels correlate with
poor prognosis. Cancer Epidemiol Biomarkers Prev. 2010;19(6):1409–1422. 58. Bergenfelz C, Janols H, Wullt M, Jirstrom K, Bredberg A, Leandersson K. Wnt5a inhibits human monocyte-derived myeloid
dendritic cell generation. Scand J Immunol. 2013;78(2):194–204. 59. Pukrop T, et al. Wnt 5a signaling is critical for macrophage-induced invasion of breast cancer cell lines. Proc Natl Acad Sci U S A.
2006;103(14):5454–5459. 60. van Bruggen N, et al. VEGF antagonism reduces edema formation and tissue damage after ischemia/reperfusion injury in the
mouse brain. J Clin Invest. 1999;104(11):1613–1620. 61. Schmidt H, et al. Elevated neutrophil and monocyte counts in peripheral blood are associated with poor survival in patients
with metastatic melanoma: a prognostic model. Br J Cancer. 2005;93(3):273–278. 62. Fossati G, Ricevuti G, Edwards SW, Walker C, Dalton A, Rossi ML. Neutrophil infiltration into human gliomas. Acta Neuro-
pathol. 1999;98(4):349–354. 63. McNamara MG, et al. Factors impacting survival following second surgery in patients with glioblastoma in the temozolomide
treatment era, incorporating neutrophil/lymphocyte ratio and time to first progression. J Neurooncol. 2014;117(1):147–152. 64. Fallah P, et al. miR-146a and miR-150 promote the differentiation of CD133+ cells into T-lymphoid lineage. Mol Biol Rep.
2013;40(8):4713–4719. 65. Xiao WZ, Lu AQ, Liu XW, Li Z, Zi Y, Wang ZW. Role of miRNA-146 in proliferation and differentiation of mouse neural
stem cells. Biosci Rep. 2015;35(5):e00245. 66. Xu S, et al. Effect of miR-142-3p on the M2 macrophage and therapeutic efficacy against murine glioblastoma. J Natl Cancer
Inst. 2014;106(8):dju162. 67. Wei J, et al. miR-124 Inhibits STAT3 signaling to enhance T cell-mediated immune clearance of glioma. Cancer Res.
2013;73(13):3913–3926. 68. Ziegler-Heitbrock HW, Ulevitch RJ. CD14: cell surface receptor and differentiation marker. Immunol Today. 1993;14(3):121–125. 69. Dolmans MM, et al. Evaluation of Liberase, a purified enzyme blend, for the isolation of human primordial and primary ovar-
ian follicles. Hum Reprod. 2006;21(2):413–420. 70. Hussain SF, Yang D, Suki D, Grimm E, Heimberger AB. Innate immune functions of microglia isolated from human glioma
patients. J Transl Med. 2006;4(1): PMC1501057. 71. Nikodemova M, Watters JJ. Efficient isolation of live microglia with preserved phenotypes from adult mouse brain. J Neuroin-
flammation. 2012;9:147. 72. Durafourt BA, et al. Comparison of polarization properties of human adult microglia and blood-derived macrophages. Glia.
2012;60(5):717–727. 73. Melief J, et al. Phenotyping primary human microglia: tight regulation of LPS responsiveness. Glia. 2012;60(10):1506–1517.