Embed Size (px)
Citation preview
1
? 1.
Glacier acceleration and thinning after ice shelf collapse in the Larsen B embayment, Antarctica
T. A. Scambos', J. A. Bohlander', C. A. Shuman2, and P. Skvarca3
'National Snow and Ice Data Center, 1540 30th Street, University of Colorado,
Boulder CO 80309-0449, phone 303 492-1113, fax 303 492-2468, email
teds@ icehouse.colorado.edu
Oceans and Ice Branch, Code 971, NASA Goddard Space Flight Center,
Greenbelt, MD 20771
3Divisi6n Glaciologia, Instituto Andrtico Argentino, Cerrito 1248, ClOlOAAZ,
Buenos Aires, Argentina
2
Abstract. Ice velocities derived from five Landsat 7 images acquired between January 2000
and February 2003 show a two- to six-fold increase in centerline speed of four glaciers
flowing into the now-collapsed section of the Larsen B Ice Shelf. Satellite laser altimetry
from ICEsat indicates the surface of Hektoria Glacier lowered by up to 3 8 h m in a six-
month period beginning one year after the break-up in March 2002. Smaller elevation losses
are observed for Crane and Jorum glaciers over a later 5-month period. Two glaciers south of the collapse area, Flask and Leppard, show little change in speed or elevation. Seasonal
variations in speed preceding the large post-collapse velocity increases suggest that both
summer melt percolation and changes in the stress field due to shelf removal play a major
role in glacier dynamics.
https://ntrs.nasa.gov/search.jsp?R=20040171402 2018-06-01T18:33:25+00:00Z

2
1. Background and Previous Observations
Floating ice shelves are responding rapidly to climate warming in the Antarctic Peninsula.
Over the past half-century, mean air temperatures there have increased by 2 to 4°C [King and
Comiso, 2003; Skvurca et al., 19991 and in the past 30 years ice shelves in the region have
decreased in area by >13,500 km2 [Vaughn et al., 1996; Scumbos et al., 20031. In three
cases large areas have collapsed suddenly: the Larsen A in January 1995 (1600 km’);
Wilkins in March 1998 (1 100 km2), and the Larsen B in February-March, 2002 (3200 km2). Air temperature increases in the 1990s led to longer melt seasons and an increase in melt
pond extent on the northernmost ice shelves [Fahnestock et al., 20021. In the same period,
Ocean temperatures in the Weddell Sea rose, possibly increasing the rate of basal melting of
the Larsen Ice Shelf and thereby contributing to collapse [Shepherd et al., 20031. However,
both Larsen collapse events occurred during record warm air temperatures, when surface
melt season length and melt pond extent reached new maxima. Areas with melt ponds
disintegrated; adjacent areas with few to none remained. This link between climate warming,
melt ponding, and ice shelf collapse prompted the proposal of a melt-enhanced fracture
mechanism as the main cause of shelf disintegration [Scambos et al., 20001.
Ice shelf removal has been tied to potential glacier flow increases [Thomas, 19791. The
presence of a shelf provides ‘backstress’, or longitudinal compressive force, if a mechanical
connection exists between the shelf ice and surrounding land areas, ice rises, or islands.
However, some models of ice sheet flow show little effect of shelf removal [Hindmarsh,
19961. The magnitude of this effect is critical to understanding ice sheet mass balance and
sea level changes under projected warming conditions.
Melt percolation may also affect the force balance of glaciers. This too has a history in ice
mechanics theory [Weertman, 19731, and recent observations have placed the discussion in
the context of climate change. Measurements of surface flow speed on ice sheets and glaciers
suggest that summer meltwater can descend via crevasses to the bed, seasonally reducing
3
basal stress and increasing flow speed by up to 25%, even when the glaciers contain ice well
below freezing [Zwally et aZ., 200%; Boon and Sharp, 20031.
Following the collapse of Larsen A Ice Shelf in January 1995, interferometric synthetic
aperture radar (InSAR) revealed that two of its tributary glaciers increased in speed by up to
3-fold [Rott et al., 20021. The InSAR image pairs were acquired in late 1995 and late 1999.
Speed increased throughout the glaciers, but along-flow speed profiles for Drygalski Glacier
indicated an abrupt increase in speed gradient in the lowest parts of the glacier trunk. The
location of this speed profile ‘kink’ moved upstream by 8 km in the four-year span. Above
the kink, flow speed increased, but more uniformly. The authors note that acceleration may
have begun prior to the first survey.
Photographs of the Drygalski Glacier valley walls in early 2002 showed remnant ice ridges
(‘ice terraces’) 20 to 40 m above the glacier surface, indicating a substantial surface lowering
[De Angelis and Skvarca, 20031. Additional satellite image evidence suggested rapid speed
increases (surging) for other glaciers flowing into the Larsen A embayment. Here we use
speed and elevation data acquired closer in time to a shelf collapse event to study the effects
of shelf removal and climate warming on glaciers in more detail.
2. Speed and Elevation Measurements
Five satellite images spanning the period of Larsen B Ice Shelf retreat and collapse are
used to map the velocity of six glaciers draining into the Larsen B embayment. Landsat 7
Enhanced Thematic Mapper (ETM+) images from 27 January 2000: 06 December 2001,06
April 2002, 18 December 2002, and 20 February 2003, were used in an image feature-
tracking algorithm [Scumbos et al., 19921 to gather ice motion data along selected flow
centerline points in the lowest 10 to 12 km of the glaciers. We mapped four glaciers feeding
the now-empty northern shelf embayment (Hektoria, Green, Jorum, and Crane) and two
glaciers (Flask and Leppard) flowing into the remaining southern ice shelf areas (Figure 1).
The images are used in sequential pairs, permitting some seasonal resolution of ice flow
variations.
Errors from the image feature-tracking algorithm come from two sources: image mis-
registration; and noise in the correlation matches of image ‘chip’ pairs. For the Larsen B
images, mountain ridges allowed co-registration to within a pixel (15 meters for ETM+ band
8). Noise in adjacent correlation matches for the ice motion vectors is approximately 0.25 to
0.5 pixels. The reported centerline values (Figure 1) are averages of 5 to 50 vectors within a
4
few hundred meters of the selected site. In some cases thin clouds or saturation of tine band 8
data forced different approaches, either using unsaturated bands (band 3 and 4 of ETM+) or in one case manually tracking features. Errors shown in the graphs are based on displacement
measurement errors of a 0 meters (1.33 band 8 pixels) to A0 meters (where other methods
were used).
The first image pair spans summer and winter periods before 2002, so the derived ice
motion measurements approximate the average flow speed just prior to ice shelf collapse.
The second image pair spans the period of the March 2002 Larsen B shelf collapse, including
the warmest summer and most extensive melt season on record at the Matienzo automated
weather station (AWS). Mean summer (December-February) air temperature, MST, was
+1.3" [Skvarca et al., 20041. Glacier speed increased by up to 80% for the four northern
glaciers, with little variation along the centerlines.
The third sequential image pair covers the winter period following collapse. Glaciers south
of the collapse area, Flask and Leppard, show deceleration or no significant change.
However, glaciers draining into the collapsed shelf area accelerated significantly, particularly
where retreat reached the grounding line prior to the image period, Le., for Hektoria and
Green glaciers. Speed gradient in the lower parts of these glaciers also increased greatly. The
pattern is amplified in the last image pair, which spans most of the summer of 2003. This
summer was much cooler than the previous one (MST -1.2"C), with much less melt, and
speed changes for Flask Glacier were small.
At both Jorum and Crane glaciers small sections of shelf ice remained throughout the
Landsat image series. For Jorum, the 2002 winter image pair indicates a decrease in flow
speed, uniform throughout the lower trunk, though speeds are still greater than the pre-
collapse mean. In the last image pair period, both glaciers develop an increased speed
gradient in their lower trunk. At this point, the remaining shelf was 6 km along the
centerline for both glaciers.
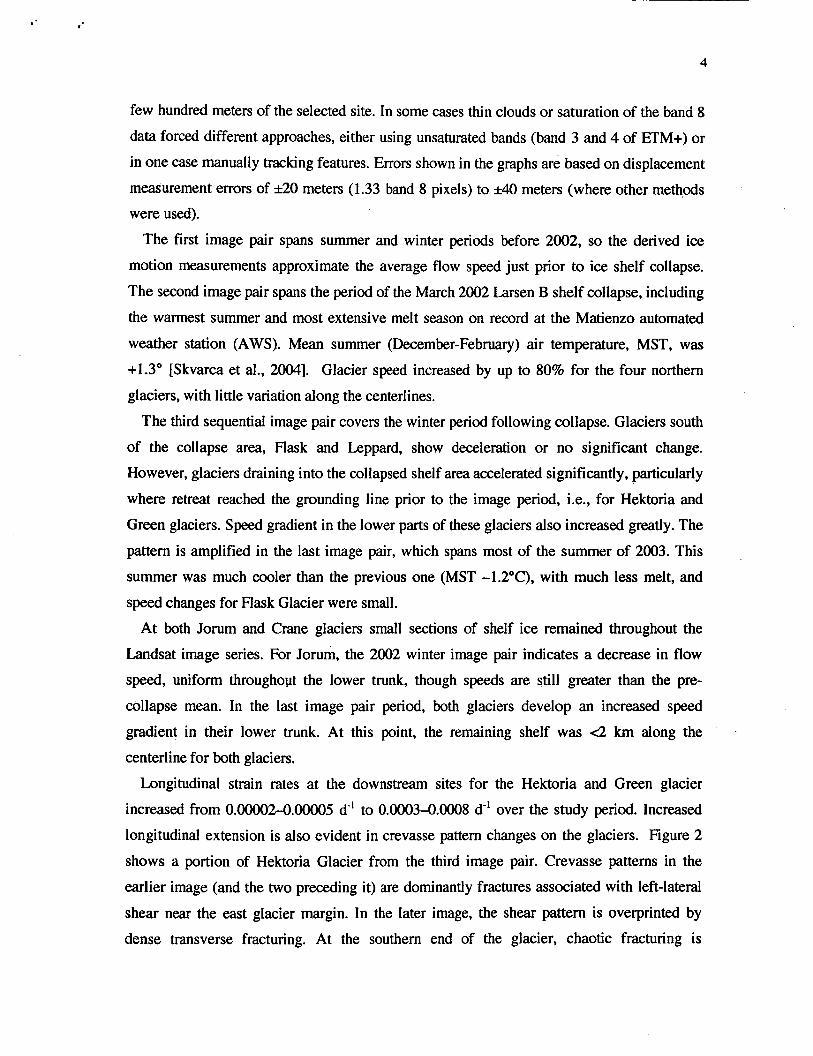
Longitudinal strain rates at the downstream sites for the Hektoria and Green glacier
increased from 0.oooO2-0.oooO5 d-' to 0.0003-0.0008 d-' over the study period. Increased
longitudinal extension is also evident in crevasse pattern changes on the glaciers. Figure 2
shows a portion of Hektoria Glacier from the third image pair. Crevasse patterns in the
earlier image (and the two preceding it) are dominantly fractures associated with left-lateral
shear near the east glacier margin. In the later image, the shear pattern is overprinted by
dense transverse fracturing. At the southern end of the glacier, chaotic fracturing is

5
disintegrating the grounded glacier trunk. Airborne visual observations of continued intense
fracturing at the glacier terminus in February 2004 by one of us (Skvarca) suggest a
continuing increase in glacier speed.
We interpret the speed and acceleration data in Figure 1 to be a combination of at least two
patterns: seasonal variations relative to the long-term trend; and a rapid, progressive
acceleration of the lowest glacier areas, beginning immediately after ice shelf collapse and
progressing upstream. The latter pattern appears to be moderated by even small sections of
remaining shelf.
Contours in Figure 3a map the ice speed increase between the two summer Landsat image
pairs. Here, the same method used for the centerline areas was applied to the entire lower
glacier, resulting in two velocity grids of several hundred vectors. Without continuous
velocity measurements it is difficult to completely separate seasonal changes from shelf-loss-
related changes, but the presented difference map best isolates the effect of shelf loss on the
glacier flow after one year.
Large decreases in glacier surface elevation occurred in the months following collapse.
ICESat (Ice, Cloud, and land Elevation Satellite), launched in January of 2003, acquired
several elevation profiles across the glaciers beginning shortly after launch. The satellite
canies a two-wavelength 40 Hz pulse laser altimeter [Zwally et al., 2002bl that acquires
elevation profiles as a series of laser ‘shot points’ with ground spacing averaging 172 m and
effective spot diameters of about 70 m. Elevations reported here are relative to the EGM%
geoid.
Three elevation profiles from an 8-day ICESat repeat track cross Hektoria Glacier, two in
February and March and the third in September of 2003 (Figure 3a and b). By interpolating
elevations between the first two profiles using flow-aligned shot point pairs, we estimate
elevations in the location of the later profile. Cloud cover rendered all but 10 shots unusable
in the later profile. These 10 elevation values were lower than the interpolated elevations by
5 to 38 meters (and were lower than the February profile located 800 m downstream). We
interpret this as an elevation loss due to thinning (averaging 3 to 21 cm d-*) over the span of
observations. Slope estimates and elevation changes were iterated twice, to approximate the
likely drawdown between the first two profiles. Given the 2002 increase in longitudinal
strain rate, implying annual thinning rates of 10 to 25% of the glacier thickness, these 2003
elevation loss rates are consistent with the large scale of the dynamic changes, but may also
6
indicate a slowing in the rate of acceleration. Glacier thickness is -300 meters near the
grounding line (Scambos et al., 2000).
Under clear sky conditions, ICESat measurements are accurate to *20 cm [Zwally et al.,
2000bI. Thin cloud cover can cause elevation errors of up to -2 meters due to scattering in
the atmospheric pathway. However, the majority of the error here comes from assuming
constant slope between the profiles. We estimate a 6 m error based on the average along-
track elevation differences from smoothed versions of the two earlier profiles, when filtered
at 2.4 km (the spacing between the two outer profiles).
Later acquisitions in a 33-day near-repeat pattern provide coverage of several sections of
the other glaciers in late 2003 and early 2004. Repeat track separations are within 200 m, and
in all cases the later profiles are to the west (upstream). Figure 4 shows profiles of Crane,
Jorum, and lower Flask glacier. The tracks show further shelf disintegration near Crane
Glacier in late 2003. Lower Jorum Glacier and upper Crane Glacier profile pairs show
average elevation reductions of 3.4 to 4.M m (2.7 to 3.1 cm d-') after correction for mean
along-flow slope. For Flask Glacier, slope-corrected elevations repeat to within 0.2*1 m.
3. Seasonal variations versus post-collapse acceleration characteristics
A large acceleration of the lower portions of the Larsen B glaciers began within months of
the collapse of the fronting ice shelf areas. The acceleration, and a dramatic lowering of the
glacier surface, progressed upstream over the ensuing months and has continued several
years after ice shelf removal. Glaciers south of the shelf collapse area do not show these
changes. It appears that a complete removal of the shelf to the grounding line initiates the
progressive acceleration.
Seasonal velocity variations before shelf collapse show a different pattern, in which the
entire centerline speed profile of the lower glacier alternately increases (summer) and
decreases (winter), with little change in longitudinal strain. We attribute this to melt-water
percolation to the bed of the glacier, and an ensuing reduction in basal resistance.
Acknowledgments. This work was supported by NASA grant NAGS-11308, and NSF
grants OPP-98 14550 and OPP-0338 134, and Instituto Antiirtico Argentino.

7
References
Boon, S., and M. Sharp, The role of hydrologically-driven ice fracture in drainage system
evolution on an Arctic glacier, Geophys. Res. Lett. 30 (1 8), doi: 10.1029/ 2003GL018034, 2003.
De Angelis, H., and P. Skvarca, Glacier surge after ice shelf collapse, Science, 299, (5612) 1560-1562,2003.
Fahnestock, M. A., W. Abdalati, and C. Shuman, Long melt seasons on ice shelves of the
Antarctic Peninsula: an analysis using satellite-based microwave emission measurements,
Ann. Glaciol., 34, 127-133,2002.
Hindmarsh, R., Stability of ice rises and uncoupled marine ice sheets, Ann. Glaciol., 23, 105-
115,1996.

8
Jezek, K. C., H. Liu, Z Zhao, and B. Li, Improving a digital elevation model of Antarctica
using radar remote sensing data and GIS techniques, Polar Geography 23,(3), 185-200,
1999.
King, J. C., and J. C. Comiso, The spatial coherence of interannual temperature trends in the
Antarctic Peninsula, Geophys. Res. Lett. 30 (2), 1040, doi: 10.1029/2002GLB15580,2003.
Rack, W., and H. Rott, Pattern of retreat and disintegration of Larsen B ice shelf, Antarctic
Peninsula, Ann. Glaciol. 39,2004 (in press). Rott, H., W. Rack, P. Skvarca, and H. De Angelis, Northern Larsen Ice Shelf, Antarctica:
further retreat after collapse, Ann. Glaciol., 34,277-282,2002.
Scambos, T., M. Dukiewicz, J. Wilson, and R. Bindschadler, Application of image cross-
correlation to the measurement of glacier velocity using satellite image data, Remt. Sens.
Environ., 42 (3), 177-186, 1992.
Scambos, T., C. Hulbe, M. Fahnestock, and J. Bohlander, The link between climate warming
and break-up of ice shelves in the Antarctic Peninsula. J. Glaciol., 46 (154), 516-530,
2000.
Scambos, T., C. Hulbe, and M. Fahnestock, Climate-induced ice shelf disintegration in the
Antarctic Peninsula, in Antarctic Peninsula Climate Variability; historical and
paleoenvironmental perspectives, edited by E. Domack and five others, pp. 79-92, AGU,
Washington, D.C., 2003. Shepherd, A., D. Wingham, T. Payne, and P. Skvarca, Larsen ice shelf has progressively
thinned, Science 302 (5646), 856-859,2003.
Skvarca, P., W. Rack, H. Rott, and T. Ibarzlbal y Donlnglo, Climatic trend, retreat and
disintegration of ice shelves on the Antarctic Peninsula: an overview, Polar Research 18 (2), 151-157, 1999.
Skvarca, P., H. De Angelis, and A. Zakrajsek, Climatic conditions, mass-balance, and
dynamics of Larsen B Ice Shelf, Antarctic Peninsula, prior to collapse, Ann. Glaciol. 39,
2004 (in press).
Thomas, R. H., T. 0. Sanders, and K. E. Rose, Effect of warming on the West Antarctic Ice
Sheet, Nature, 277 (5695), 355-358, 1979.
Vaughan, D. G., and C. S. M. Doake, Recent atmospheric warming and retreat of ice shelves
on the Antarctic Peninsula. Nature, 379,328-33 1, 1996.
Weertman, J., Can a water-filled crevasse reach the bottom surface of a glacier?, Znt. Assoc.
of Scientific. Hydrology Publication, 95, 139-145, 1973.

9
Zwally, H. J. , W. Abdalati, T. Herring, K. Larson, J. Saba, and K. Steffen, Surface meit-
induced acceleration of Greenland ice-sheet flow, Science, 297 (5579), 21 8-222,2002a.
Zwally, H. J., R. Shutz, W. Abdalati, and six others, ICESat’s laser measurements of polar ice, atmosphere, ocean, and land, J. Geodymics , 34 (3-4), 40545,2002b.
FIGURE CAPTIONS
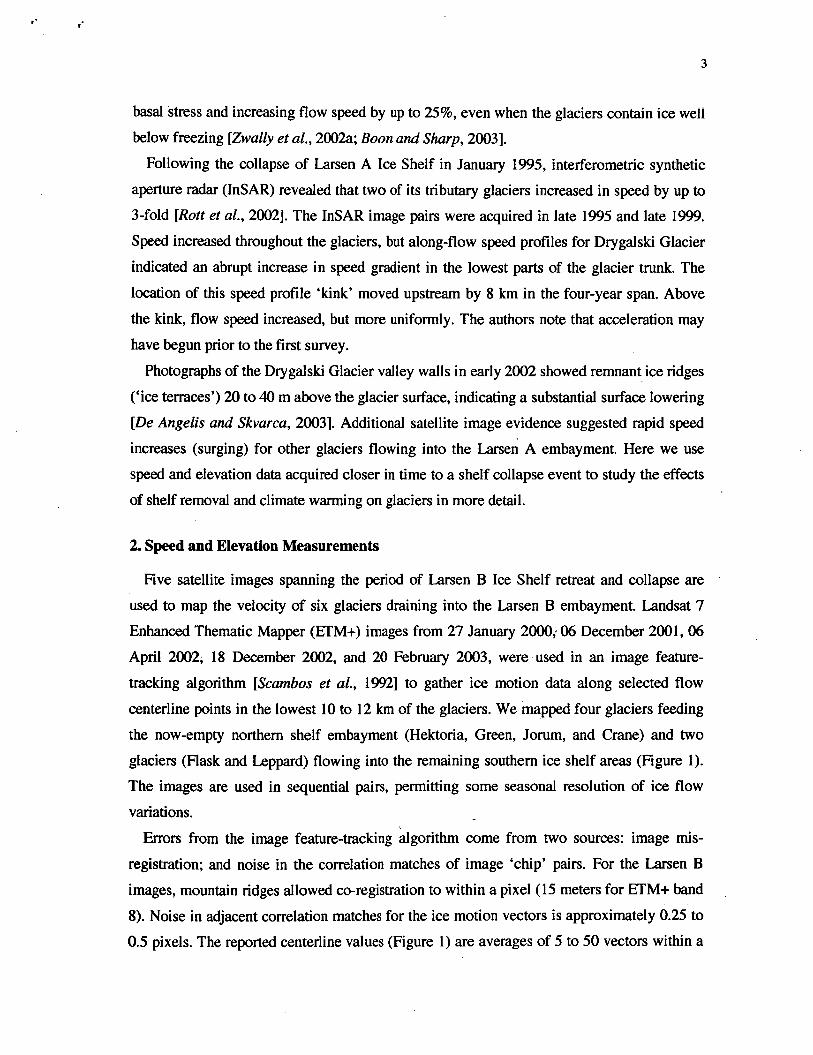
Figure 1. Center panel: MODIS image from 1 November 2003 of the study area with April
ice shelf extents and the grounding line (black; Rack and Rott, 2004) for the Larsen B Ice
Shelf between 1998 and 2002. Red boxes are speed measurement sites along lower glacier
centerlines. Short blue lines indicate locations of ICESat laser altimetry ground tracks over
glacier trunks. Surrounding graphs: centerline ice speeds and downstream site accelerations
for six glaciers. Landsat 7 image acquisition dates are shown as triangles on the x-axes. Grey
bars represent the Feb.-Mar. 2002 shelf collapse event.
Figure 2. Landsat 7 subscenes showing crevasse changes in the lower Hektoria Glacier.
Image area is 6 km by 6 km, north is up.

10
Figure 3, a and b. a: Landsat 7 image from 20 February 2003, with shot point locations
from three ICESat tracks overlain. Contours are ice speed difference in meters per day
between the periods 06 December 2001 - 06 April 2002 and 18 December 2002 - 20 February 2003. Valid elevation locations are shown as red dots. Blue bars connect three
elevations along a flow line. Net elevation difference relative to our estimate is shown as text.
b: ICESat elevation profiles projected up-flow. Red circles are sized to the estimated
elevation error of 6 m.
Figure 4. ICESat elevation profiles of Jorum, Crane, and Flask glaciers. All profiles looking up-glacier. Mean along-flow slopes of the lower 10 km of the glaciers were determined from Jezek et al. [ 19991, and used to adjust the net elevation changes.

nd Jorum Glacier Hektoria Glacier
um
id Leppard Glacier
I + Downstream".: -+ Mid-glacier -0- Upstream t
-+ Mid-glacier
.. - _

. . - *
looking up-glacier 5: . track separation:
Sept. 27 : 800 m upstream Mar. 27: 2385 m upstream h
-5.0 estimated elevation change, m
-6 -4 -2 0 2 4 6 In I I I I I
Distance from flow centerline along satellite track (km)

. I ..
-
-
-
Crane GI., upper profile -0- 23 Oct. 2003 0 23Feb. 2004 separation 160 m
mean diff.: -2.9 m RAMP slope: 0.0072 est. surface change: -4.1 m 120
300 m (D c
280 5'
-
El
3 3 n
260-
-0- 30 Oct. 2003 0 02Mar. 2004 separation 108 m
0 (D .-
- mean diff.: -2.4 m RAMP slope: 0.0089 est. surface change: -3.4m
60 I I I I I I I -1.2 -0.8 -0.4 0 0.4 0.8
80 n
E - 60 C 0 -= 40
- 20 w 9
--c 23 Oct. 2003 0 23Feb. 2004 separation 127 m
Crane GI., lower profile t FA Wl
100
m 80 (D
60 6 e.
40 2 2 0 3
0
I I I I I I I I '
-3.2 -2.4 -1.6 -0.8 0 0.8 1.6 2.4 3.2 Distance from flow centerline along satellite track (km)