Embed Size (px)
Citation preview
GIS APPLICATION IN SOLID WASTE MANAGEMENT
(Term Paper)
By
Ammar, Hussain Taleb ID # 525116
For
CRP 514 Introduction to Geographic Information System (GIS)
Term 061
Course Instructor: Dr. Baqer M. Al-Ramadan
Date: January 24, 2007

GIS Application in SWM, 2007
i
ABSTRACT
Solid Waste Management (SWM) is an integral part of public health and
environmental control. Improper SWM leads to both economical and environmental
sufferings. SWM includes control of generation, storage, collection, transfer/transport,
processing and disposal of waste. Almost all factors related to SWM has both spatial and
non-spatial components, thus, traditional ways of storing and analyzing data keeps data in
isolated form, which results in inefficient management system. This paper will introduce
the use of Geographic Information System (GIS) in the field of SWM. Through different
case studies and discussions, this paper will demonstrate the aid of GIS in areas related to
SWM, to increase system efficiency, reduce workload, save time and cost, and its use as
a decision support system. This paper will concentrate in three different operations of
SWM, which are waste storage, waste collection, and waste disposal. Results from
different case studies, with different solid waste problems, shows that with GIS agencies
and organizations were able to save cost and time, reduce workload, improve
serviceability and respond to customers in less time, solve any problem arise quickly,
increase profit generation.

GIS Application in SWM, 2007
ii
TableofContents
ABSTRACT ............................................................................................................................................. i
List of Figurs ........................................................................................................................................... iv
List of Tables ........................................................................................................................................... v
1. LITERATURE REVIEW ............................................................................................................. 1
2. INTRODUCTION ......................................................................................................................... 2
3. THE NEED FOR GIS ................................................................................................................... 2
4. OBJECTIVE .................................................................................................................................. 3
5. METHODOLOGY ........................................................................................................................ 3
6. WASTE STORAGE ...................................................................................................................... 4
6.1. Case Study .............................................................................................................................. 5
6.1.1. Methodology ................................................................................................................... 5
6.1.2. Existing SWM Situation in Aurangabad City ............................................................ 7
6.1.3. Data Collection and Limitation .................................................................................... 9
6.1.4. GIS Workflow Model .................................................................................................. 10
6.1.5. Implementation in Case Study and Results .............................................................. 13
6.1.6. Discussion ..................................................................................................................... 17
6.2. Other Successful Stories ...................................................................................................... 18
6.2.1. Dyess Air Force, Texas, U.S. ....................................................................................... 18
6.2.2. Garland’s City Solid Waste Department, Texas, U.S. .............................................. 19
GIS Application in SWM, 2007
iii
7. WASTE COLLECTION............................................................................................................. 20
7.1. Case Study ............................................................................................................................ 21
7.1.1. Problems of Routes ...................................................................................................... 22
7.1.2. GIS and Optimization ................................................................................................. 23
7.1.3. GIS Deployment ........................................................................................................... 23
7.1.4. Results ........................................................................................................................... 24
7.2. Other Successful Stories ...................................................................................................... 26
7.2.1. Trabzon Municipality in Turkey. ............................................................................... 26
7.2.2. Dallah Company, Saudi Arabia ................................................................................. 27
8. WASTE DISPOSAL .................................................................................................................... 28
8.1. Case Study ............................................................................................................................ 29
8.1.1. Rules for preliminary landfill sitting ......................................................................... 29
8.1.2. GIS and Methodology of LSS ..................................................................................... 29
8.1.3. Landfill Site Selection Project .................................................................................... 31
8.1.4. Boolean Model Results ................................................................................................ 32
8.1.5. IndexOverlay Model Results ...................................................................................... 33
8.1.6. Conclusion .................................................................................................................... 34
8.2. Other Useful Applications .................................................................................................. 35
9. CONCLUSION ............................................................................................................................ 35
APPENDIX A ........................................................................................................................................... 37
APPENDIX B ........................................................................................................................................... 40
REFERANCES .......................................................................................................................................... 43
GIS Application in SWM, 2007
iv
ListofFigures
Figure 1: Conceptual Design ................................................................................................................ 6
Figure 2: Location of Aurangabad City .............................................................................................. 7
Figure 3: GIS Workflow Model ......................................................................................................... 12
Figure 4: Waste bins with close proximity to sensitive buildings ................................................... 13
Figure 5: a 100m buffering around waste bins ................................................................................ 14
Figure 6: Waste bins close to environmentally sensitive areas ........................................................ 15
Figure 7: Allocation of recyclable waste bins for buildings ............................................................. 16
Figure 8: Allocation of recyclable waste bins for shops ................................................................... 16
Figure 9: residential collection system ............................................................................................... 23
Figure 10:GIS-based routing results in Elgin, Chicago ................................................................... 25
Figure 11: Landfill site selection interface added to ArcMap ......................................................... 30
Figure 12: Boolean model in LSS ....................................................................................................... 30
Figure 13: IndexOverlay model in LSS ............................................................................................. 31
Figure 14: constraints maps for Ottawa, Canada. Using Boolean model ....................................... 32
Figure 15: Map formed by overlay of Boolean model constraints maps for Ottawa,Canada ...... 33
Figure 16: Scord maps for Ottawa, Canada. IndexOverlay ............................................................ 33
Figure 17: map results of IndexOverlay model, by overlaying scored maps ................................. 34
GIS Application in SWM, 2007
v
ListofTables
Table 1: Catagorization of shops according to their waste generation type .................................. 10
Table 2: time and distance comparison for present and optimize routes ....................................... 27
Table 3: weights assigned to scored maps ......................................................................................... 34

GIS Application in SWM, 2007
1
1. LITERATURE REVIEW
Geographic Information Systems (GIS) is a relatively young field, with antecedents that
go back hundreds of years in the fields of cartography and mapping. Today, GIS provides a
digital way for storing, retrieving, manipulating, analyzing, and displaying geographically
referenced data. Since GIS has the potential of including ecological, biological, demographic,
or economic information, it becomes a valuable tool in the environmental and engineering
sciences (Goodchild, 1992).
The Loudoun County Department of Natural Resources used GIS to find potential sites for
new landfills. Layers such as slope, soils, bedrock depth to groundwater ratios, historical
areas, streets, and jurisdictions were combined to design the model (Mitchell, 1998).
Whether restoring habitat, stopping contamination, measuring endangered species
populations, or searching for environmentally sensitive land to acquire, spatially literate users
have learned to utilize the power of GIS for increased efficiency with environmental issues
faced by Government Agencies (Greene, 2000).
As the government system operates now, local governments are working independent of
each other on environmental projects. Prior to this model, illegal construction waste was
collected and hauled to the landfill with an estimated cost $300,000.00 per year. With the
waste sites properly mapped, the municipality can assess what type of waste is present and
recycle much of the materials saving hundreds of thousands of dollars, as well as saving
precious landfill space. The model developed demonstrated how a GIS combined standard
data collection with advanced computer capabilities, allowing the Environmental Services
Department, for the city of San Antonio, to more easily maintain historical data, predict
future environmental impacts more quickly, better optimize their resources, which provided
added project control and better response time, and the result of our case study indicates that a
GIS for the ESD is feasible both economically and environmentally (Susan, 2002).
GIS Application in SWM, 2007
2
2. INTRODUCTION
Solid Waste Management (SWM) is an integral part of the public health and
environmental control. Solid waste generated right from the beginning of humanity, earlier
societies mostly had natural and food waste. Problems were little earlier, however, with rapid
urbanization, growth in urban population, and development of technologies -e.g. packaging-,
the problems of solid waste become more complex as more and more solid waste is generated.
With the passage of time and continuous urbanization as well as increase in population the
situation get more and more critical.
Solid waste management issue is being of particular important in high populated areas.
The increase in public concern about solid waste has resulted in sharp and large increase in
the political priority given to waste management. Improper solid waste management leads to
both economic and environmental sufferings, e.g. uncontrolled throwing of the waste and
badly maintained waste results in growth of diseases as well as increase the presence of
unwanted species such as rats and mosquitoes and bad odor created around the garbage area
leading to unaesthetic conditions which in turn decrease the market value of the area.
3. THE NEED FOR GIS
“(E. Tinmaz and I. Demir, 2005) The issue of waste is not only because of increase
quantities but also largely because of inadequate management system”. One of the major
management issues in solid waste management is improving methods for interpretation of
data “(Dr. Vhora, 2006) Billions spent in improving scientific methods for interpretation of
data, but the steps involved in the said area are much demanding”. Almost all of factors
related to solid waste management have a spatial component as well as non-spatial data.
Manual methods used for analysis of many factors are lengthy and tedious work and in some
problems it will be difficult to solve them without the aid of computer software, e.g.
optimization software, and also there is possibility of merging spatial and non-spatial data. In
most cases solid waste data and records are not managed properly and are often lie in isolated
form. Because of the improper management of the data and records, it becomes difficult to
GIS Application in SWM, 2007
3
assess system functionality and efficiency. For proper management it is important to manage
the data in an integrated way so the complexity of various systems could be reduced to solve
various interrelated issues. Hence the need for geographic information system (GIS) arise,
since GIS helps in dealing with several factors simultaneously which need to be considered
while planning waste management, and because of layers property of GIS there is least chance
of confusion and error, and it is capable to coordinate between spatial and non-spatial data.
Also in GIS information can be related spatially, exchanged, compared, evaluated, and
processed with a very good flexibility. “(S. Upasna and M.S. Natwat, 2003) GIS is a system
designed to allow user to collect, manage, analyze, and retrieve large volume of spatially
referenced data and associated attribute data collected from a variety of sources”
4. OBJECTIVE
Solid waste management includes the control of generation, storage, collection, transfer,
transport, processing and disposal of solid waste. The objective of this paper is to demonstrate
the application of geographic information system (GIS) in different areas related to solid
waste management in order to increase system efficiency, reduce the waste management
workload, save time and cost and to maximize the profit generated and serviceability as well
as its use as a decision support system.
5. METHODOLOGY
The functional elements of solid waste management are the following:
Waste Generation
Waste handling, Separation, processing, and waste storage at the source
Waste Collection & Transfer/Transport
Waste separation, processing, and transformation.
Waste Disposal
GIS Application in SWM, 2007
4
Through different case studies, this paper will start discussing the application of GIS in
solving problems related to waste storage, then demonstrating the usefulness of GIS in
optimizing waste collection systems, and finally will demonstrate its aid in the selection of
waste disposal site (landfills). Also problems due to improper SWM will be discussed.
6. WASTE STORAGE
Waste storage at the source is the second functional element of the solid waste
management. Usually waste is stored in waste bins located in both sides of streets next to
buildings and other sources of waste generation. More attention is given to residential waste
storage because of its direct impact on the public health and attitude, as these storage points
commonly are placed in close proximity to houses. Due to microbiological decomposition of
the waste it is not recommended to store waste for long time. Uncollected garbage will cause
a serious threat to public health as it is a breeding ground for insects, flies, and bacteria and
this could spread desieses. Other drawback of garbage accumulation is the bad odor created
around the garbage area which decreases the market value of the area due un-aesthetic
conditions, and over all leaves a bad impression and poses a threat to the environment.
Common problems related to waste storage are:
Garbage are not lifted in regular intervals
Waste bins are not cleaned in regular bases.
No route plans are prepared.
Improper waste bin allocation: small bins are provided in places of high solid waste
generation rate, bins are unnecessarily provided on some roads, people through their waste
in open dumps because there is no waste bin close enough to them. Waste bins located
near water bodies may contaminate it.
“(Orga. A.,2003) The municipal officers involved in solid waste management will be clear
about the functions and their role in terms of managing the cities efficiently with the help of
geographic information system. There will be complete inventory of the things associated

GIS Application in SWM, 2007
5
with solid waste management and proper logistic management and spatial planning can be
done using GIS analysis based on various generated layers about the SWM issues for
implementing and managing the system at the field”
6.1. Case Study
(Using GIS in Solid waste Management Planning for the city of Aurangabad, India)
The aim of this case study is to analyze the present waste management situation in the
study area of Aurangabad city in India and evaluate the problems that rise due to improper
waste management and design a GIS model that could be able to improve waste management
situation and reduce work load of waste management.
6.1.1. Methodology
The methodology of study includes:
1. Collection of information about the present waste management situation in Aurangabad
city. City information is available in four different mediums which will be brought
together in one plat form where they can be linked together and correlated. These four
mediums are:
- Maps containing spatial information.
- Spatial data about location of waste bins and buildings.
- Attribute information about spatial data.
- Other information source through interview with municipal officials to provide
information about working patterns, and a questionnaire was prepared for the public
to know their behavior regarding waste management and get their opinion in this
regard (Appendix A).
2. Preparing a database about the waste situation.
3. Analysis of present situation, to recognize problems as well as limitations and restrictions
in city waste management.
4. Discussion and critical analysis of SWM models presented in literature studies.
5. Design and implementation of GIS model, and problem analysis using GIS
GIS Application in SWM, 2007
6
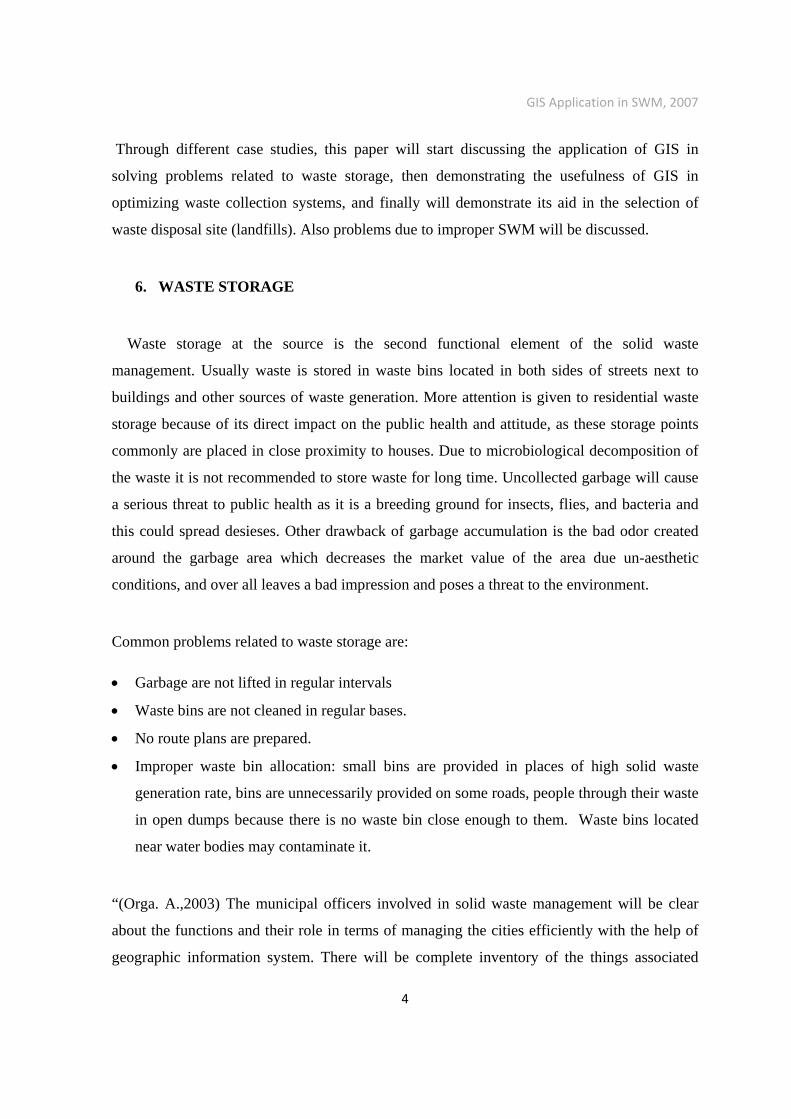
The conceptual model which demonstrates the methodology adopted for the use of GIS in the
waste management planning in this case study is shown in figure 1.
Figure 1: Conceptual Design
GIS Application in SWM, 2007
7
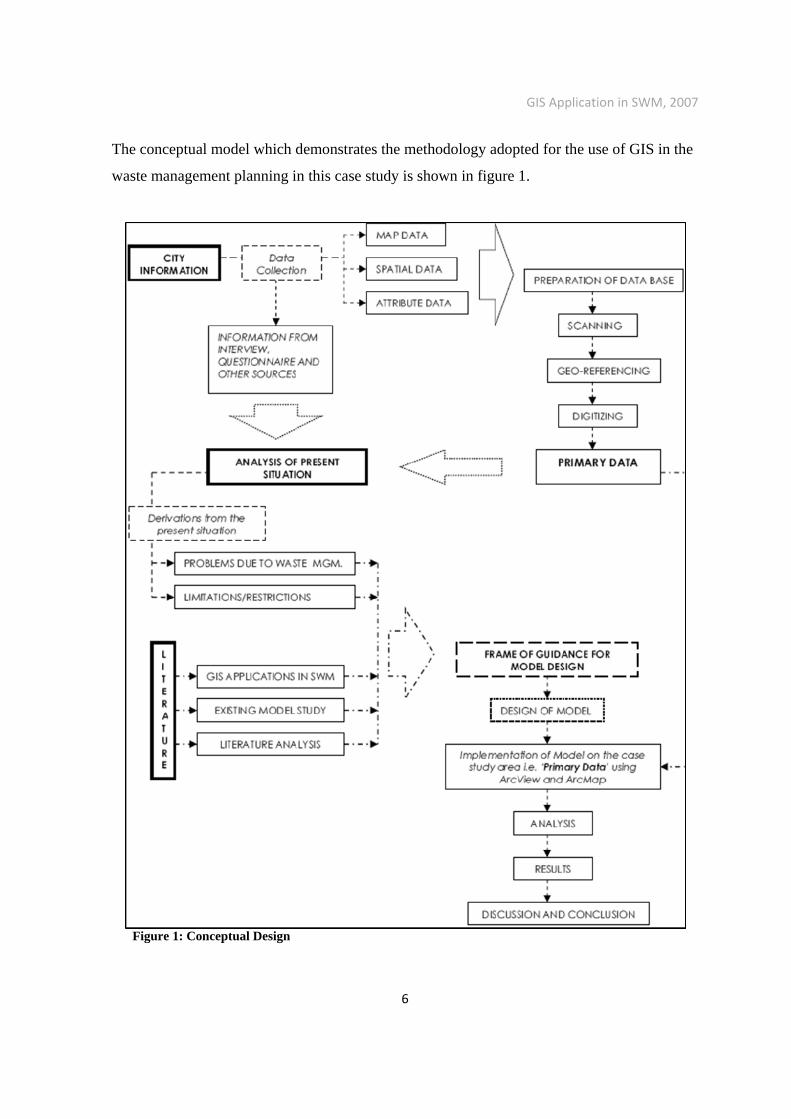
6.1.2. Existing SWM Situation in Aurangabad City
Aurangabad is an average Indian city located in south central India (figure 2). Population
of the city is around one million with a mixed type of income group people. The study area
covers 2 square km of the city.
The information about working pattern is available from interview with municipal
officials. The solid waste management system in the city works in team of area officers. Each
officer is responsible of an area and run the system with the help of four cells of employees
each cell holds the responsibility for part of that area. In each cell there is a sanitary inspector,
helper, and few labors. Because each cell is assigned for particular area, the employee gets
familiar with that area’s problems and requirements, but there is no documentation of working
schedules and employees’ experiences. Therefore, a new recruited employee will learn the
system from his colleges with time. Also the route planning is never prepared and is currently
done as and when need arise.
Waste bins used in the city are RCC cylinders opened from both ends, and it is 0.9m
diameter and 1.2m in height, the volume of the bin is approximately 0.75 cubic meters.
According to Indian guidelines (CPHEEO, 2000), density of mixed waste is about 500 kg/m3.
So the capacity of RCC cylinder waste bin is around 375 kg. According to (National Solid
Figure 2: location of Aurangabad city
GIS Application in SWM, 2007
8
Waste Association (NSWA) India, 2002) the city of Aurangabad is generating 300MT of
municipal solid waste per day, and there are 1635 bins in the city. There for it is around 185
kg/bin, which is less than the carrying capacity of RCC bins. But it is observed that there is
uneven waste produced in the city, there might be some bins that gets filled daily or even in
less time. Unfortunately, the data about the most waste generation areas and along roads is not
available. And also there is no segregation of waste, therefore; there is no idea about quantity
and generation of recyclable waste. It is also observed that in most cases the waste spreads
around bins because of animals spreading waste in search for food or waste fells partially
outside the bin when people through their waste, which results in the accumulation of waste
around bins. This situation of non-segregated waste, open bins, and the accumulation of waste
around the waste cause a death of thousands of cows since cows swallow polythene bags
along with food waste, and this also effect humans because it was discovered that milk from
cows having polythene bags clogging their stomachs can cause disease like tuberculosis and
cancer.
Because bins are open from both ends, in rainy seasons waste drains and pollutes streets,
create a foul smell, and a breeding ground for mosquitoes. Such bins can not be placed close
to environmentally sensitive areas such as streams where it has been noticed that the main
reason of water contamination in streams is due to close proximity of waste bins. Also, there
are several open dumps observed in the city, therefore, there is a need to know the convenient
distance for citizens from their places to the waste bin and to find out areas which do not have
a waste bin within that distant.
In the case of recyclable waste, it is observed that there is no separate bins for recyclable
waste, but the questionnaire survey shows that there is a positive contribution of the
recyclable waste buying businessmen, where they collect most of the recyclable waste from
houses and pay for the resident then they sell it to the recycling industry, and this helps in
reducing workload. According to statistics of National Solid Waste Association (NSWA) of
India, the composition of MSW of Aurangabad city is 25% moisture content, 35% organic
waste, and 40% inert material. The availability of recyclable waste is considered among the
40% inert material.
GIS Application in SWM, 2007
9
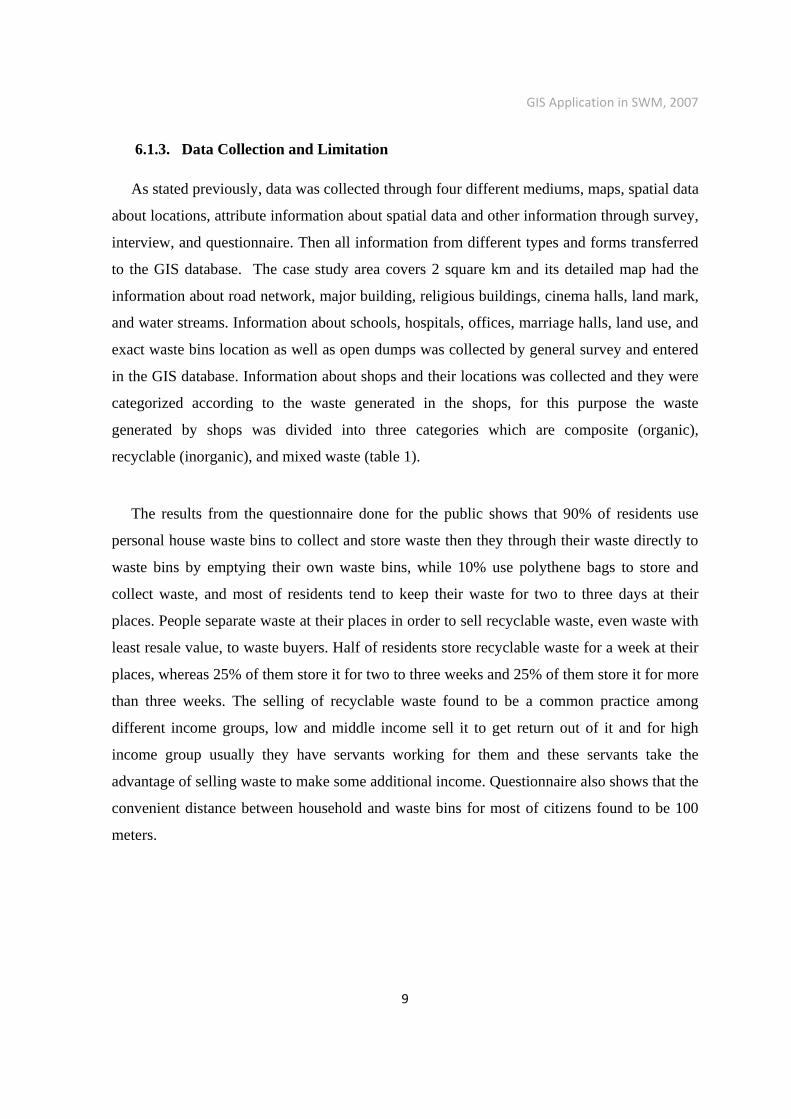
6.1.3. Data Collection and Limitation
As stated previously, data was collected through four different mediums, maps, spatial data
about locations, attribute information about spatial data and other information through survey,
interview, and questionnaire. Then all information from different types and forms transferred
to the GIS database. The case study area covers 2 square km and its detailed map had the
information about road network, major building, religious buildings, cinema halls, land mark,
and water streams. Information about schools, hospitals, offices, marriage halls, land use, and
exact waste bins location as well as open dumps was collected by general survey and entered
in the GIS database. Information about shops and their locations was collected and they were
categorized according to the waste generated in the shops, for this purpose the waste
generated by shops was divided into three categories which are composite (organic),
recyclable (inorganic), and mixed waste (table 1).
The results from the questionnaire done for the public shows that 90% of residents use
personal house waste bins to collect and store waste then they through their waste directly to
waste bins by emptying their own waste bins, while 10% use polythene bags to store and
collect waste, and most of residents tend to keep their waste for two to three days at their
places. People separate waste at their places in order to sell recyclable waste, even waste with
least resale value, to waste buyers. Half of residents store recyclable waste for a week at their
places, whereas 25% of them store it for two to three weeks and 25% of them store it for more
than three weeks. The selling of recyclable waste found to be a common practice among
different income groups, low and middle income sell it to get return out of it and for high
income group usually they have servants working for them and these servants take the
advantage of selling waste to make some additional income. Questionnaire also shows that the
convenient distance between household and waste bins for most of citizens found to be 100
meters.

GIS Application in SWM, 2007
10
Organic waste Recyclable waste Mixed waste
Green grocery Stationary Bakery
Dairy Hardware Restaurant
Meat/beef Garment Cigarette
Fish/chicken Electronics Grocery
Lunch home Cutlery
Tailoring Photo studio
Medical
Cassette
There were some limitations in the data related to both its type and availability, these
limitations include:
Maps were not up to date.
Hospitals location represented in point features, it demonstrates the location but neither
gives the area of hospital nor its boundaries. It will be more convenient to have the
boundary to be more precise about waste bins proximity.
Population density and land occupancy are not available; such information could increase
the precision of the waste generation analysis.
6.1.4. GIS Workflow Model
Frame of guidelines was developed, using data collected, to get a defined direction to the
objective. These guidelines stated the followings:
The model should be flexible to meet future changes.
Come across with some ways to generate revenue for the system without any compromise
with environmental or health issues.
Help to decide the areas which are in need of recyclable waste bins.
Table 1: Categorization of shops according to their waste generation type
GIS Application in SWM, 2007
11
Waste bins should be kept away from land uses related to sensitive issues, like health, and
sentimental values of the citizens. A distance of 20 meters found to be suitable for this
purpose.
Waste bins should be at least 15 meters away from environmentally sensitive areas, such
as streams.
Waste bins should be within a convenient distant for the residents.
Recyclable waste bins will be placed next to an existing waste bin.
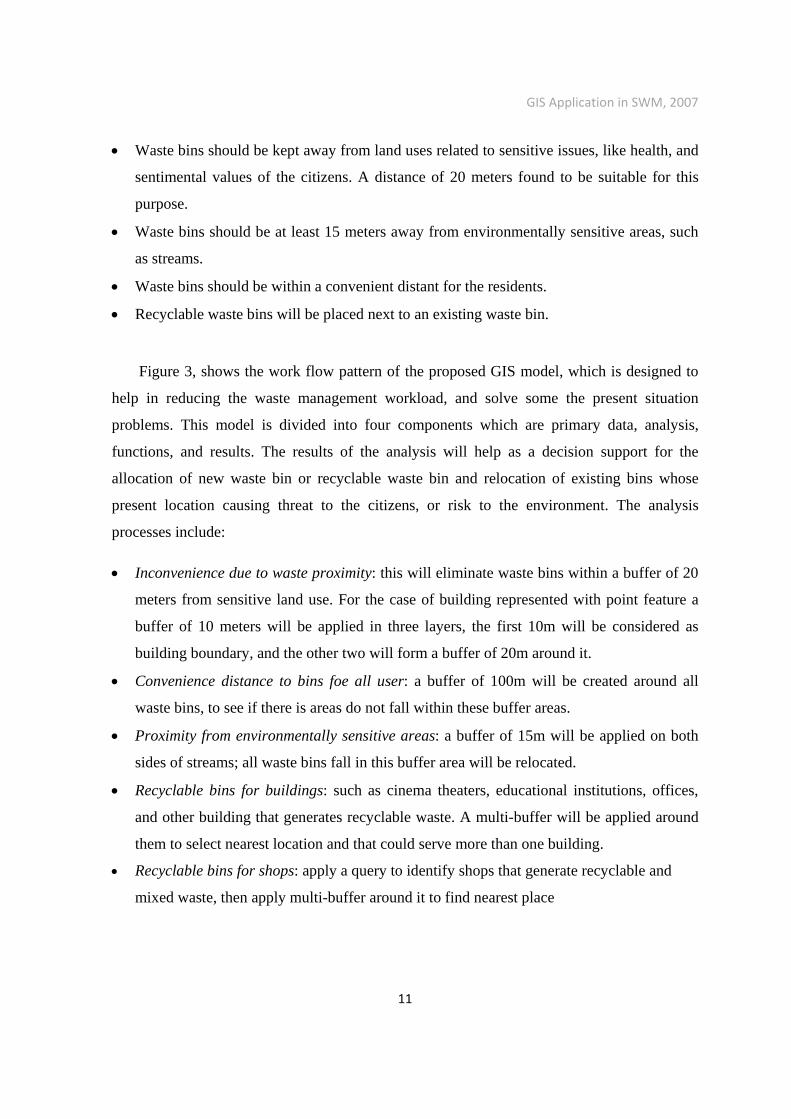
Figure 3, shows the work flow pattern of the proposed GIS model, which is designed to
help in reducing the waste management workload, and solve some the present situation
problems. This model is divided into four components which are primary data, analysis,
functions, and results. The results of the analysis will help as a decision support for the
allocation of new waste bin or recyclable waste bin and relocation of existing bins whose
present location causing threat to the citizens, or risk to the environment. The analysis
processes include:
Inconvenience due to waste proximity: this will eliminate waste bins within a buffer of 20
meters from sensitive land use. For the case of building represented with point feature a
buffer of 10 meters will be applied in three layers, the first 10m will be considered as
building boundary, and the other two will form a buffer of 20m around it.
Convenience distance to bins foe all user: a buffer of 100m will be created around all
waste bins, to see if there is areas do not fall within these buffer areas.
Proximity from environmentally sensitive areas: a buffer of 15m will be applied on both
sides of streams; all waste bins fall in this buffer area will be relocated.
Recyclable bins for buildings: such as cinema theaters, educational institutions, offices,
and other building that generates recyclable waste. A multi-buffer will be applied around
them to select nearest location and that could serve more than one building.
Recyclable bins for shops: apply a query to identify shops that generate recyclable and
mixed waste, then apply multi-buffer around it to find nearest place
GIS Application in SWM, 2007
12
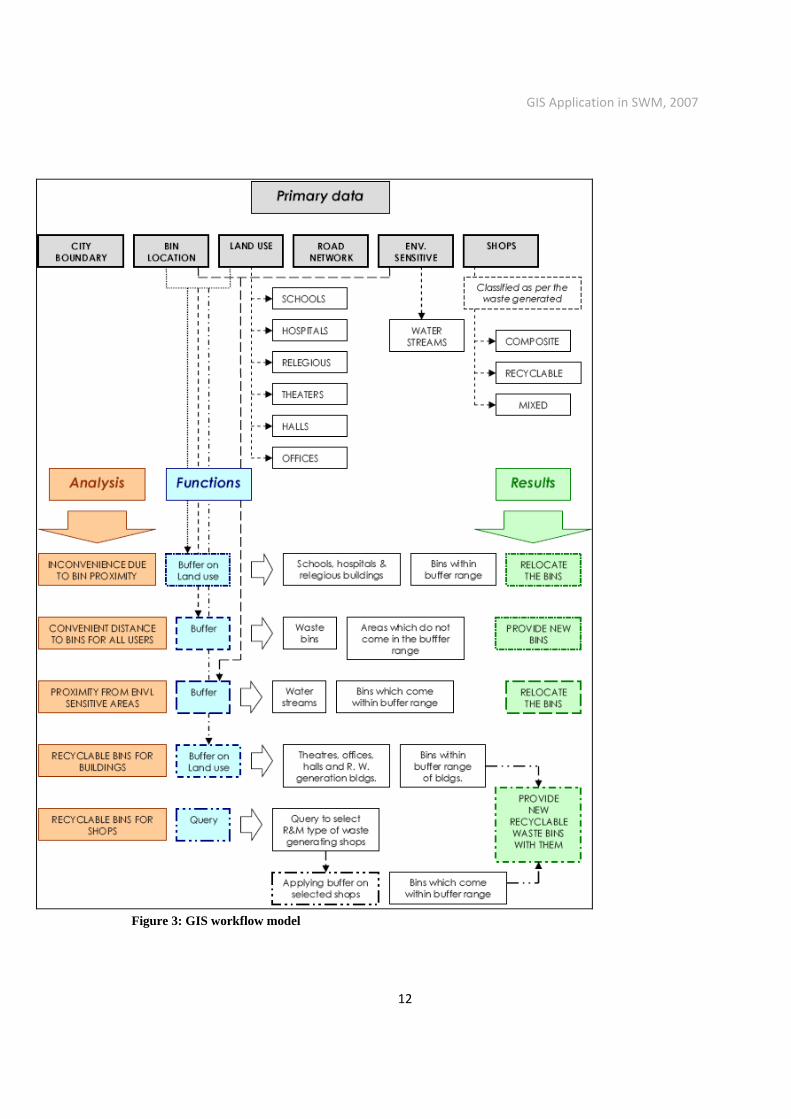
Figure 3: GIS workflow model
GIS Application in SWM, 2007
13
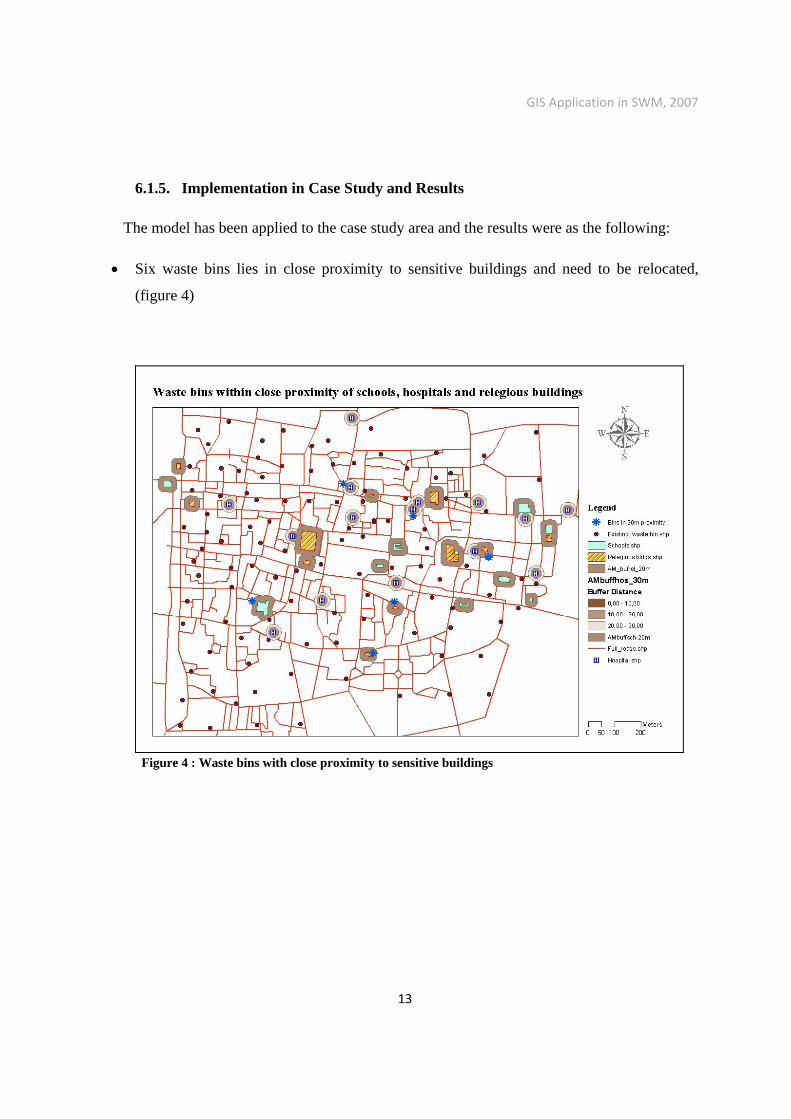
6.1.5. Implementation in Case Study and Results
The model has been applied to the case study area and the results were as the following:
Six waste bins lies in close proximity to sensitive buildings and need to be relocated,
(figure 4)
Figure 4 : Waste bins with close proximity to sensitive buildings
GIS Application in SWM, 2007
14
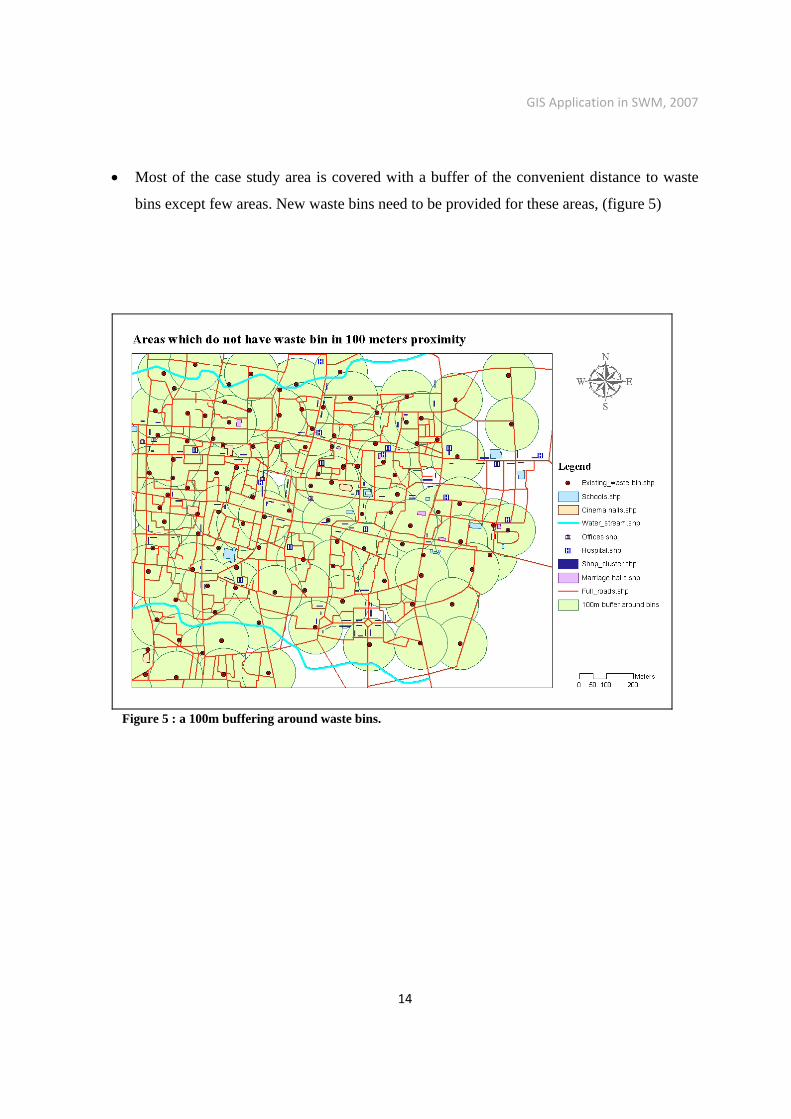
Most of the case study area is covered with a buffer of the convenient distance to waste
bins except few areas. New waste bins need to be provided for these areas, (figure 5)
Figure 5 : a 100m buffering around waste bins.

GIS Application in SWM, 2007
15
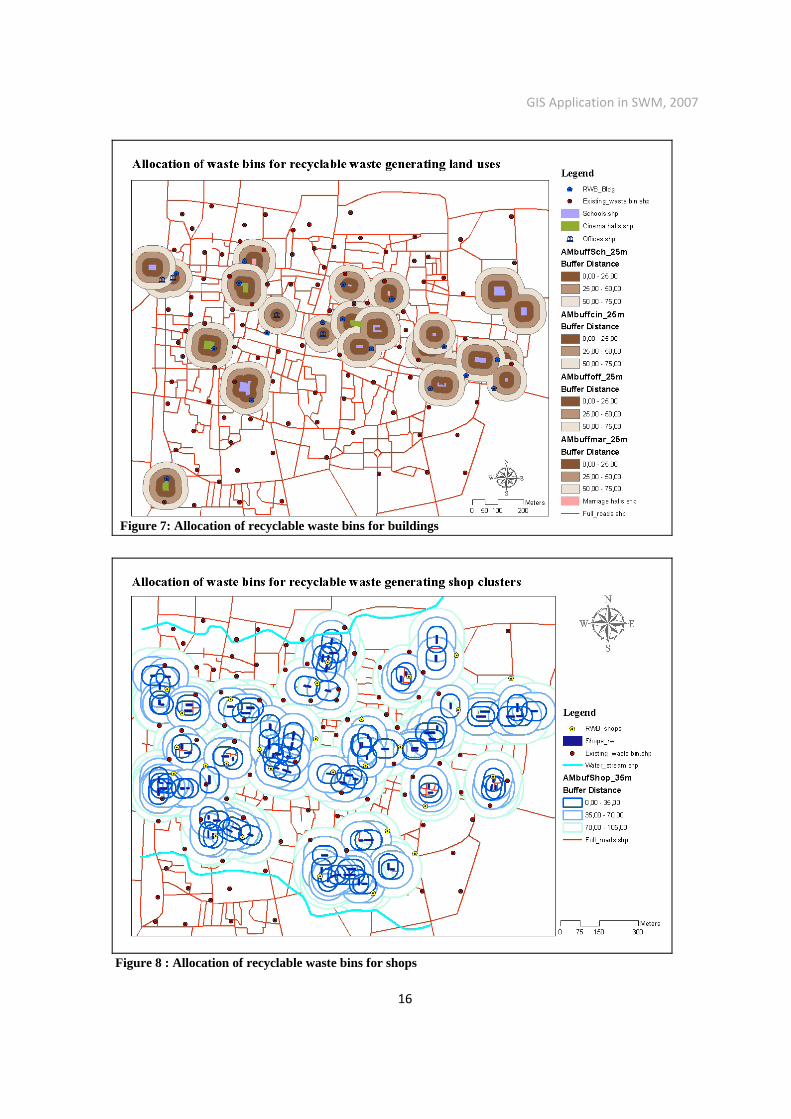
Six waste bins placed close to streams and need to be relocated, (figure 6).
For placement of recyclable waste bins, a three band buffering applies with 25m for each
band around buildings and 35m for each band around shops, (figures 7 and 8). For buildings
17 waste bins are selected in order to place a recyclable waste bin next to them, and only two
building have no waste bin within the range of 75m. for shops 28 location chosen for the
placement of a recyclable waste bin, eight of these location were also chosen for buildings
recyclable waste, therefore a total of 37 recyclable waste bins will be placed in case study
area.
Figure 6: Waste bins close to environmentally sensitive areas
GIS Application in SWM, 2007
16
Figure 7: Allocation of recyclable waste bins for buildings
Figure 8 : Allocation of recyclable waste bins for shops

GIS Application in SWM, 2007
17
6.1.6. Discussion
During the implementation of GIS model in the case study are, all waste bins were considered
in the five steps of analysis. This will cause some conflict because some of waste bins were
required to be relocated due to their close proximity to sensitive areas, and the same waste
bins were considered as a solution for placement of recyclable waste bins. And as stated in the
model guide lines, recyclable waste bins should be placed next to existing waste bins. Thus,
GIS analyst has to remove waste bins that are required to be relocated first then run the next
step of analysis. In my opinion it will be better if the analysis process goes as following:
1) Remove waste bins that are inconvenience due to bin proximity to sensitive buildings.
2) Remove waste bins that are with close proximity from environmentally sensitive areas.
3) Check for convenience distance to bins for all user, and relocate bins, especially thus
removed from previous analysis, to meet this requirement.
4) Allocate recyclable waste bins for both buildings and shops.
Also from GIS analysis, a lot of places satisfy all the requirements, thus, choosing one of
these locations will be sub-solution to the problem it is better if the analyst consider other
factors in the process of allocation of waste bin, such as routing for collection system, since
there is more than one option. The selection of new bin location or relocating other bins
should not only consider public convenience, it should also fulfill other technical factors and
planning aspects
Also there was no consideration for road types, different size of containers, and the
accessibility of different type of waste collection vehicles. And no solution mentioned
regarding waste bins that would be filled in less than one day, and those found almost empty
because they are placed in unnecessary places, to reduce the effect of uneven waste generation
through the city.
As mentioned in the paper, people get paid for their recyclable waste by waste buyers, and
that there is a good contribution from waste buyer where they goes to houses to pay for the
residents for their waste. In the design of the GIS model, placement of recyclable waste bin
GIS Application in SWM, 2007
18
was considered as a way of generation revenue by selling the recyclable waste to waste
industry. The problem is, what would make people through their recyclable waste in
recyclable bins? How would pay for them? And how would they get paid? The model should
consider a way to encourage people to use recyclable waste bins and ensure their
participation.
6.2. Other Successful Stories
Many organization and agencies throughout different nations uses GIS to solve their
problems which are related to waste storage. The key solution for their problems was by
identifying the exact locations of waste storage points and link its attributes to it. Dyess Air
Force in United State and Garland’s City Solid Waste Department in United State are
examples.
6.2.1. Dyess Air Force, Texas, U.S.
Dyess air force base in Abilene, Texas, is like a small city with an area of 6000 acres and
7600 assigned personnel living there. Air Force Civil Engineering requires that trash
dumpsters be tracked and logged for contract maintenance purpose. Surveys are performed
annually to maintain records of dumpsters locations and problems, this completed by driving
around the base and recording in papers. Written records rise some issues: exact location were
hard to describe, unintentionally redundant data collection, survey takes 20 days to be
completed, and during these days several dumpsters may be relocated or removed which
makes the survey out of date before it was completed. To solve these problems engineers
suggest using a mobile GIS (ArcPad) installed in handheld device with built-in GPS. Then a
customized dumpster tracking application was developed. And a list of domain choices in a
pull-down menu were created to simplify the process, reduce the time for entering attributes,
and to ensure that all location will be attributed in the same way. The dumpster attribute
collected are the dumpster number, type, time and date –they are captured automatically-,
problems with dumpster, and serial number. Using the GPS the location of dumpsters was
easily specified, and plotted in the GIS base map.
GIS Application in SWM, 2007
19
After implementation it was revealed that 20% fewer dumpsters were being employed than
required by contract. The dumpster’s data was collected in two days by one person and
produced a high accurate inventory. This represents a 90% reduction in number of man-hour
required for this task. Now using GIS, places with greater demand for dumpster capacity,
dumpsters in need for maintenance, and the physical condition of the dumpster can be
monitored.
6.2.2. Garland’s City Solid Waste Department, Texas, U.S.
The customers served by Garland’s solid waste department were charged a one-time fee for
the cost of the container, and $4 monthly for the service of garbage collection. The city
provides additional container for residents. Garland’s SWD planned to charge customers for
each additional waste container. The last known quantity of additional containers was just
over 10,000, and since customers were not billed monthly for the extra containers, no reliable
records were maintained to track these additional containers. If $4 fee for each additional
container is recovered from the customer, this could provide an additional $40,000 per month
in revenue for Garland’s SWD. But in order to bill accurately for the additional containers, it
was necessary to identify the existing containers and their locations.
The workflow was simple enough, the user needed to be able to attach a number
corresponding to containers to each address. However keeping track of your location and
which locations had been surveyed presented the biggest problems. Thus, GIS mobile system
-ArcPad- installed in a handheld device with GPS was recommended as a solution. Garland’s
SWD prepared a user interface and dialogs with ArcPad application builder that permitted the
user to tap on a parcel on the displayed map, attach a container number attribute to each
address, and after performing this operation the parcel would change to red indicating that it
had been surveyed. After that, this information was integrated into the GIS. To enable
analysts to assess the numbers and locations of additional trash containers. It was estimated to
take four months to collect all the necessary data, however, the project completed a month
ahead.
GIS Application in SWM, 2007
20
Results of the survey showed that there were over 13,000 additional containers in the city.
These additional containers are now mapped and inventoried. The next step is to prepare a
proposal Garland City Council outlining possible fee structures to charge residents for each
additional container.
7. WASTE COLLECTION
Solid waste collection comes at the beginning of solid waste management process. Waste
is usually collected using waste collection vehicle from its source of generation and
transported to the special facility, such as recyclable waste facility, or to a disposal site.
Mainly there are two collection systems, which are:
Hauled Container System: where the waste collection vehicle hauls the container to the
disposal site then emptying it and returns it pack. And this could be done in either of the
following two ways:
1) Conventional Mode: The vehicle visit the first site, hauls the container then emptying
it and return it back to its location.
2) Exchange Container Mode: The vehicle comes to the first site with an empty container
to be exchange with the full container, and after emptying the container it will be
exchanged with the full container in the second site.
Stationary Container System: where the waste is loaded into the collection vehicle and the
vehicle will continue emptying waste containers from different sites till it reaches its
carrying capacity then it goes to disposal site.
The process of waste collection is very complex and too costly. Waste collection has about
50-70% of the total cost for solid waste management system. Thus, a big saving could be
achieved by small changes in collection system, such as route layout and optimization. The
steps to layout a collection route are:
Establishing area maps with info related to solid waste generation points, such as location,
frequency, waste size.
Preparing of pertinent data, tables.
Establishing pre-route, analyze it, and redevelop routes.
GIS Application in SWM, 2007
21
Many issues arise in the process of routes layout. There are too many attributes about
generation points needs to be shown in the map or presented in a separate data sheets, this
makes data tracking and accessibility for query very difficult. The solution for waste
collection routes is achieved through trial and error processes which require a lot of
calculation, and take a lot of time. Moreover, any change in the system, e.g. adding new
customers or roads being closed, will require rerouting of collection system again. Routes
analysis requires calculation of street length, distance from last emptied container to the
disposal site, e.g. landfill, distance between respective containers, and also the system
constraint such as speed limit should be considered. The need to recalculate all these
parameters in each rerouting trial makes routing process a tedious work. System efficiency is
hardly determined using static maps and data sheets. Thus, the need for a solution that would
helps to adjust the routes in more timely and efficiently manner. Geographic information
system (GIS) is capable of producing automated routing which can be edited in easy and fast
ways. In addition, GIS can solve other problems by linking descriptive attributes of a
generation point to its exact location, and all distances that are required for the analysis will
be measured automatically. With customers presented in a map waste collection vehicle can
reach customer in faster, easier, and more accurate way, providing better customer services.
The assessment of system functionality and efficiency will be improved through GIS.
7.1. Case Study
(Vehicle Routing Solution for Waste Management, Inc)
Waste Management, Inc. (WM) is the leading provider of waste management services in
North America. The company network’s of operation includes 293 active landfill disposal
sites, 16 waste-to-energy plants, 72 landfill gas-to-energy facilities, 146 recycling plants, 346
transfer stations and 435 collection operations (depots). Combined, these resources enable
WM to offer a full range of environmental services to nearly 20 million residential and two
million commercial customers throughout the U.S. and Canada. WM provides solid waste
collection services for residential, industrial, municipal and commercial customers in 48
states, the District of Columbia, Canada and Puerto Rico. With nearly 26,000 collection and
GIS Application in SWM, 2007
22
transfer vehicles, and about 19600 daily routes for six days a week, and collect about 80
million tons of solid waste each year.
7.1.1. Problems of Routes
WM fund that the annual operational cost of each collection vehicle is about $120,000.
Thus WM had a good reason make daily routes as profitable and efficient as possible. The
intention was to reduce the operating cost, but managing the daily activity of 19600 routes for
six days a week was not a trivial task. This requires understanding of business line first.
WM is operating three different business lines, which are: residential waste collection,
commercial waste collection, and industrial waste collection. Residential and commercial
wastes are collected by stationary container system. Industrial waste collected by hauled
container systems, using two different modes exchange container mode and conventional
mode. A driver can use a point to point solution for commercial routes, while an arc-routing
model is required for residential routes as it is only permitted to service customer on the right
side of the street (figure 9). Industrial routes are like commercial but the containers are larger,
thus a hauled container system is used which allowed servicing one container at a time. The
difficulty arises when a driver is scheduled to perform different types of services throughout
the day to customers with different container sizes.
WM seeks a solution that will meet three fundamental objectives, which are:
1) Rout reduction : cost saving
2) Workload balancing: number of routes across days of the week
3) Adherence to business constraints.

GIS Application in SWM, 2007
23
7.1.2. GIS and Optimization
A typical set of attributes for a customer would include name, billing information and
address information. The address information is typically referred to mailings. Using typical
information system, it is difficult to determine the proximity to other customers or routes,
resulting in less-than-effective decision support. In GIS customers are represented spatially
using a coordinate system. The location information and all other information are brought
together with other spatial information such as streets. This will allow GIS to represent the
exact distances and time on a street network between any two given points, taking into
account various constraints that all contribute to generating a realistic result, including speed
limits, directional attributes of the streets –e.g. one-way direction- , and accurate segment
distances. GIS consists of both tabular data (in forms and reports) and a map displaying
customer locations, landfills, and other facilities against a background of streets, landmarks,
and other geographical boundaries. The unique coordination of the navigation tree, customer
data and interactive map make the application simple to use.
7.1.3. GIS Deployment
GIS would fundamentally change the way WM services their customers. Getting people to
change for any reason is very difficult. Employees tend to be defensive and resist changing
the way they do their job. To maintain morale and build trust between employees and
Figure 9: residential collection system
GIS Application in SWM, 2007
24
management, WM built a proactive communication plan and included employees at every
step during the rollout and conducted classroom-training class. The objective was to train
multiple people simultaneously while gaining on-the-job experience. The instructor-led
training class was broken into two major components: standard operating procedures and
application training. WM also deployed a series of self web-based training courses that
covered each of the topics individually. Optimization Manager in Baltimore Renee Huff says,
“Driver involvement has been a crucial success factor in implementing GIS at our site.” The
deployment for an individual site was broken into four major components:
Service Boundary Analysis (SBA): gave the site the opportunity to remove any
overlapping territories between neighboring WM sites.
Weekly balancing: attempts to move customers to different days of service to balance the
workload.
The clustering stops: gives the user a first look at the geographies of the routes without
creating individual route sequences.
Optimize each daily route: the creation of the routes, driver and management reviews
concluded the pre-deployment steps.
Deployment also includes review each customer’s container size and frequency. If a customer
has a small container and is serviced three or more times per week, it is better to exchange the
container for a larger one and reduce the frequency of service, thus reducing the cost of
service for that customer.
7.1.4. Results
This GIS-based route management application delivered reduced operational costs by
organizing routes to minimize overlap and thereby reduce the number of vehicles required to
service customers; and sequencing the stops along a route to make the best use of fuel, driver
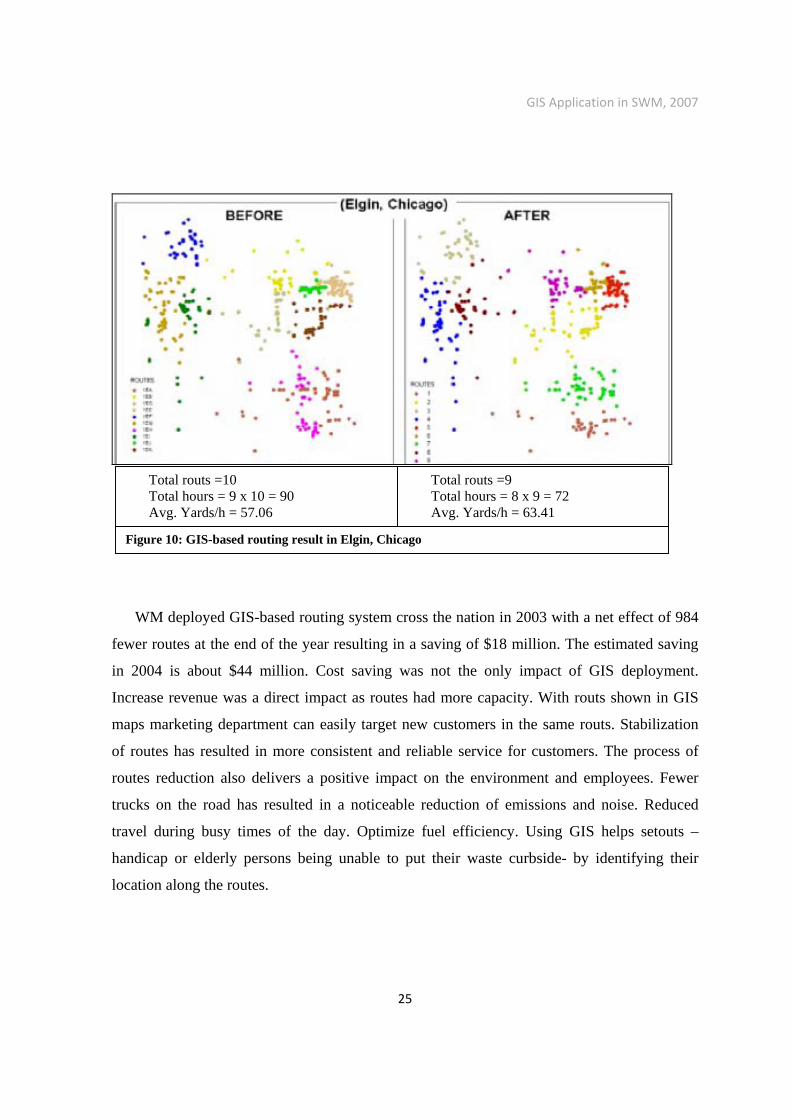
schedules, and disposal trips. As an example, GIS-based routing system was deployed in
Elgin, Chicago. The result shows a reduction of one route which represent 10% of the routes,
reducing the hours per route by one hour, and increase in the productivity of the routes from
57 yards per hour to 63 yards per hour (figure 10)
GIS Application in SWM, 2007
25
WM deployed GIS-based routing system cross the nation in 2003 with a net effect of 984
fewer routes at the end of the year resulting in a saving of $18 million. The estimated saving
in 2004 is about $44 million. Cost saving was not the only impact of GIS deployment.
Increase revenue was a direct impact as routes had more capacity. With routs shown in GIS
maps marketing department can easily target new customers in the same routs. Stabilization
of routes has resulted in more consistent and reliable service for customers. The process of
routes reduction also delivers a positive impact on the environment and employees. Fewer
trucks on the road has resulted in a noticeable reduction of emissions and noise. Reduced
travel during busy times of the day. Optimize fuel efficiency. Using GIS helps setouts –
handicap or elderly persons being unable to put their waste curbside- by identifying their
location along the routes.
Total routs =10 Total hours = 9 x 10 = 90 Avg. Yards/h = 57.06
Total routs =9 Total hours = 8 x 9 = 72 Avg. Yards/h = 63.41
Figure 10: GIS-based routing result in Elgin, Chicago
GIS Application in SWM, 2007
26
7.2. Other Successful Stories
Many organization and agencies throughout different nations uses GIS to solve their
problems which are related to waste collection. In general, they were aiming to save cost and
time, improve response time to customer, balance workload, optimize their system, and
provide a system that will help them in the assessment of efficiency and functionality of
collection system. Trabzon municipality in Turkey and Dallah Company in Saudi Arabia are
examples.
7.2.1. Trabzon Municipality in Turkey.
Trabzon City located in the northeast side of Turkey has about 185000 inhabitants. The city
consists of 39 districts. To collect waste Trabzon municipality has located about 2800 waste
container in the residential area. Waste is collected by collection vehicles using both
stationary container system and hauled container system. Total length of waste collecting road
network is 416 km and collection vehicle travels about 60% of that distance every day. Solid
waste collection has about 85% portion of the total cost for disposal expenditure. A study was
conducted by Yildiz Technical University in Istanbul, Turkey. The objectives of the study are:
To use data gathered by observing the collection of MSWC in 39 districts in the city and
to form a GIS database on the route map of Trabzon
Optimize collection routes and minimize empty miles.
To compare present route with optimized route for cost and time
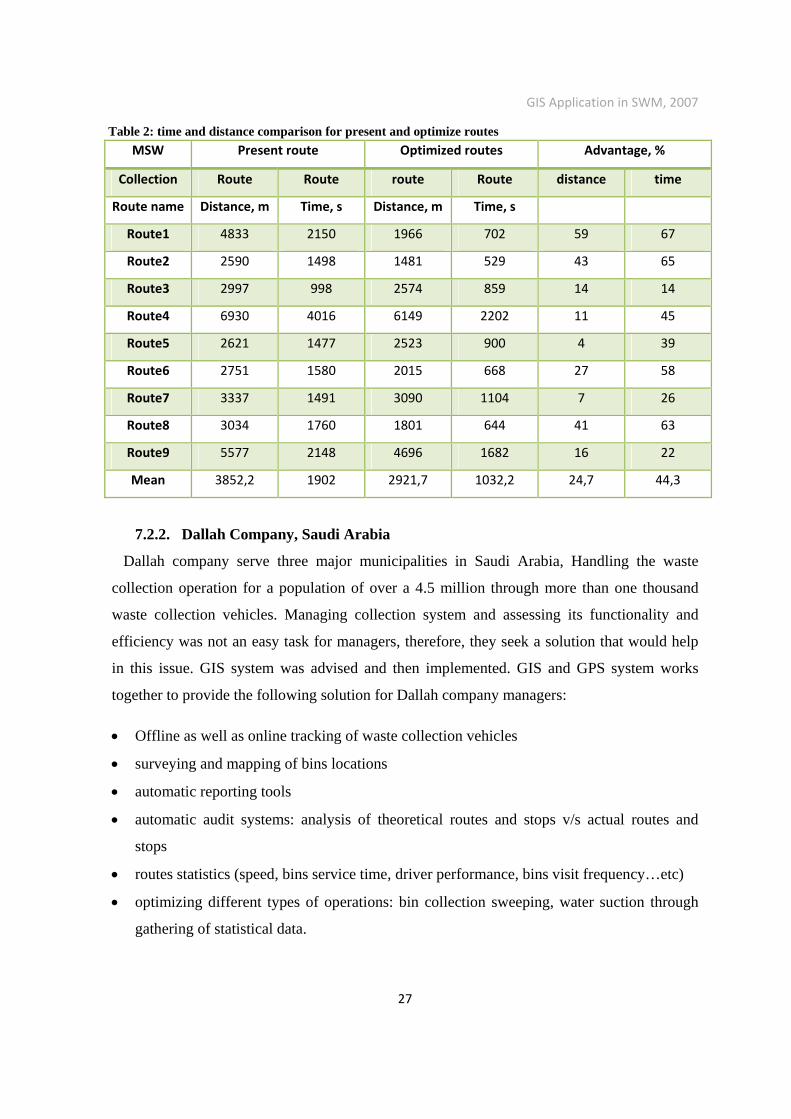
The results of the study shows that if the optimized routes are used in solid waste collection
system, both distance and time will be decreased by 4-59 % and 14-65 %, respectively
(table 2). Monthly costs for optimized and present route are US$55320 and US$73334,
respectively. This difference expresses a decrease by 24.7 % in cost.
GIS Application in SWM, 2007
27
MSW Present route Optimized routes Advantage, %
Collection Route Route route Route distance time
Route name Distance, m Time, s Distance, m Time, s
Route1 4833 2150 1966 702 59 67
Route2 2590 1498 1481 529 43 65
Route3 2997 998 2574 859 14 14
Route4 6930 4016 6149 2202 11 45
Route5 2621 1477 2523 900 4 39
Route6 2751 1580 2015 668 27 58
Route7 3337 1491 3090 1104 7 26
Route8 3034 1760 1801 644 41 63
Route9 5577 2148 4696 1682 16 22
Mean 3852,2 1902 2921,7 1032,2 24,7 44,3
7.2.2. Dallah Company, Saudi Arabia
Dallah company serve three major municipalities in Saudi Arabia, Handling the waste
collection operation for a population of over a 4.5 million through more than one thousand
waste collection vehicles. Managing collection system and assessing its functionality and
efficiency was not an easy task for managers, therefore, they seek a solution that would help
in this issue. GIS system was advised and then implemented. GIS and GPS system works
together to provide the following solution for Dallah company managers:
Offline as well as online tracking of waste collection vehicles
surveying and mapping of bins locations
automatic reporting tools
automatic audit systems: analysis of theoretical routes and stops v/s actual routes and
stops
routes statistics (speed, bins service time, driver performance, bins visit frequency…etc)
optimizing different types of operations: bin collection sweeping, water suction through
gathering of statistical data.
Table 2: time and distance comparison for present and optimize routes
GIS Application in SWM, 2007
28
8. WASTE DISPOSAL
Safe solid waste residual is significant to SWM plan. The residual waste is the material
remains after all possible processing. Open dumps cause threat to the public as well as to the
environment. Thus, waste should be disposed in managed landfill. Landfills are the places in
the surface soils of the earth where the residual solid waste is disposed and sanitary landfills
are those designed to minimize environmental damage. Landfilling is the process of waste
disposing the most important step in development of new sanitary landfill is the selection of
site to be used. Choosing a landfill place is a big challenge since it requires handling of large
amount of spatial data and is controlled by many constraints. Some constraints requires
landfills to be away from the city, e.g. at least 3000 m from hospitals, and others requires
landfills to be placed close to the center of urbanized areas, e.g. hauling distance, also
significant future changes should be considered. In general landfill site considerations are:
Haul distance.
Location restrictions.
Available areas.
Site access.
Soil condition and topography.
Climatic conditions.
Surface water and hydrology.
Geological and hydrogeological conditions .
Local environmental rules.
The public usually demand assurance that all factors have been considered before location
decisions are made. Thus, the need for tools that could help decisions makers in not only
making optimum decision but also showing to the public that the decision is reached through
an objective and transparent process. Using GIS analysis tools, such as overlapping and
buffering, analyst can assure that all constraints were met in easy and fast way. Virginia GIS
reference book listed minimum and optional data requirements for the any GIS model to be
used in landfill management (Appendix B).
GIS Application in SWM, 2007
29
8.1. Case Study
(Ottawa University Landfill Site Selection (LSS) GIS interface.)
Landfill site selection is divided into two main steps: the identification of candidate sites by
preliminary screening sites and the assessing of their suitability according to environmental
impact assessment and criteria, engineering design and costs. This case study focuses on the
first of these. The purpose of preliminary site screening is to eliminate quickly the parcels of
land that are obviously unsuitable and classify those remaining according to their degree of
suitability based on a composite suitability analysis using map overlays and integration. The
criteria used for the preliminary screening include primarily the proximity of potential sites to
geographic objects that may be affected by the landfill or that may affect landfill operations.
8.1.1. Rules for preliminary landfill sitting
Generally, criteria for preliminary landfill sitting are divided into three groups:
1) Environmental factors: include impacts that the landfill may have on the surrounding
biophysical environment.
2) Engineering factors: e.g. the costs associated with acquisition, development, and
operation of each site.
3) Social/Cultural factors: A site may be technically feasible and meet the environmental
and engineering criteria, yet may have to be abandoned due to heavy public opposition.
Hence public involvement in landfill site selection for any specific location is an essential
factor.
8.1.2. GIS and Methodology of LSS
Landfill site selection large amount of data must be evaluated and made available as quickly
as possible. GIS can efficiently stores, retrieves, analyses, and displays information according
to user-defined specifications. Relatively easy presentations of GIS sitting results are also one
of its other advantages. There is several available software, using GIS; however, one of the
most popular that can be customized is ArcGIS Desktop. The ArcGIS applications are
engineered for ease of use and powerful geographic display, query, and analysis. By using
programming language, there would be an unlimited freedom to customize the user interface
for users’ business needs. The approach was to utilize models, which combine and integrate
GIS Application in SWM, 2007
30
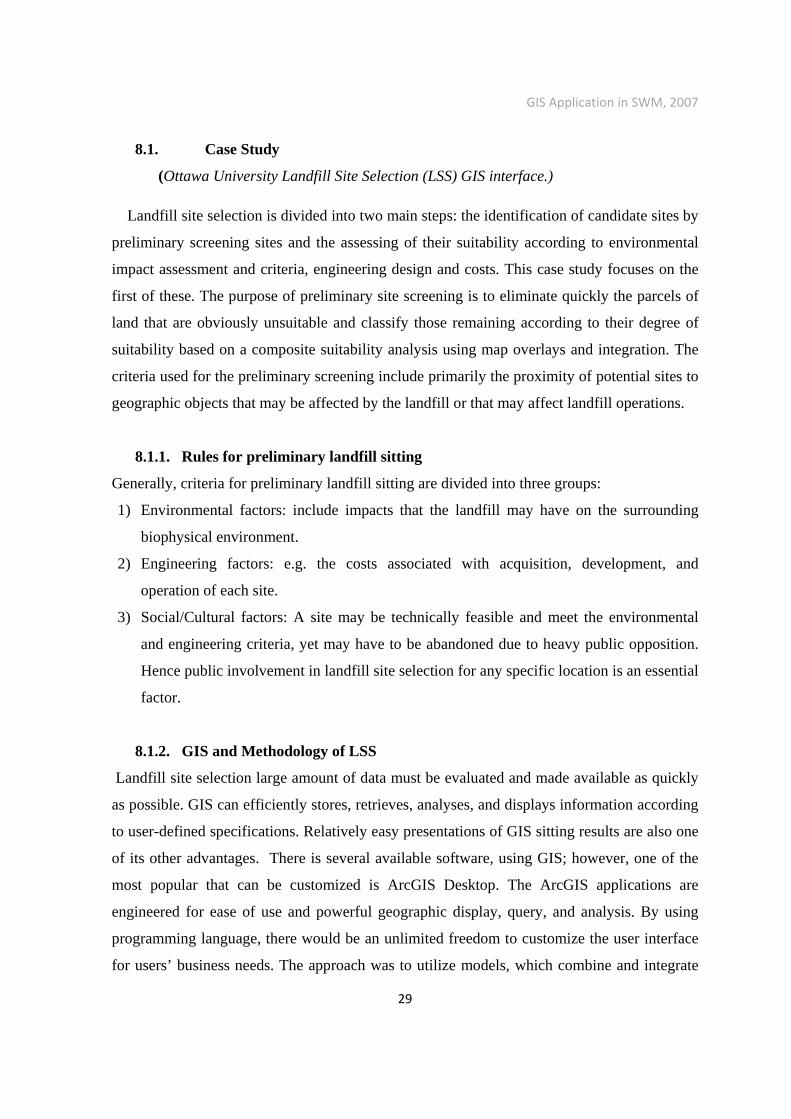
maps to determine an optimal landfill sitting. Thus a Landfill Site Selection (LSS) program
was developed and its toolbar was added to ArcMap interface (figure 11).
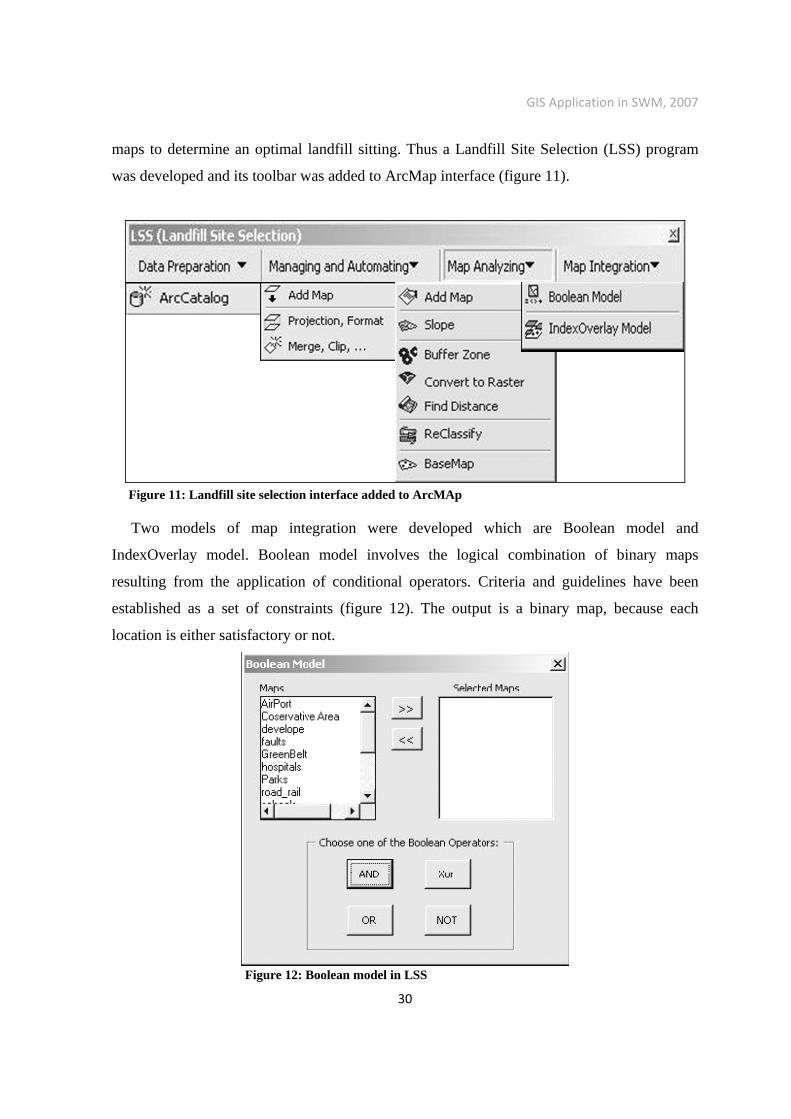
Two models of map integration were developed which are Boolean model and
IndexOverlay model. Boolean model involves the logical combination of binary maps
resulting from the application of conditional operators. Criteria and guidelines have been
established as a set of constraints (figure 12). The output is a binary map, because each
location is either satisfactory or not.
Figure 11: Landfill site selection interface added to ArcMAp
Figure 12: Boolean model in LSS
GIS Application in SWM, 2007
31
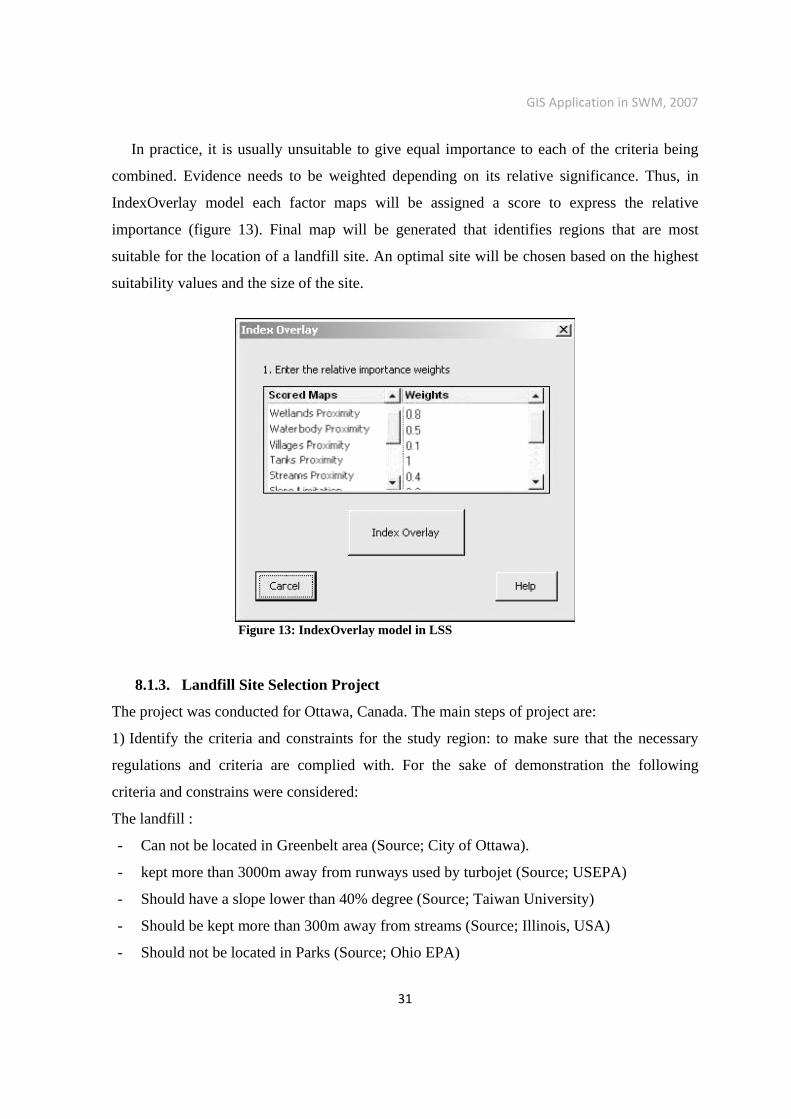
In practice, it is usually unsuitable to give equal importance to each of the criteria being
combined. Evidence needs to be weighted depending on its relative significance. Thus, in
IndexOverlay model each factor maps will be assigned a score to express the relative
importance (figure 13). Final map will be generated that identifies regions that are most
suitable for the location of a landfill site. An optimal site will be chosen based on the highest
suitability values and the size of the site.
8.1.3. Landfill Site Selection Project
The project was conducted for Ottawa, Canada. The main steps of project are:
1) Identify the criteria and constraints for the study region: to make sure that the necessary
regulations and criteria are complied with. For the sake of demonstration the following
criteria and constrains were considered:
The landfill :
- Can not be located in Greenbelt area (Source; City of Ottawa).
- kept more than 3000m away from runways used by turbojet (Source; USEPA)
- Should have a slope lower than 40% degree (Source; Taiwan University)
- Should be kept more than 300m away from streams (Source; Illinois, USA)
- Should not be located in Parks (Source; Ohio EPA)
Figure 13: IndexOverlay model in LSS

GIS Application in SWM, 2007
32
- Must be more than 155m from developed area (Source; Illinois, USA)
- Must be kept more than 60m away from faults (Source; US EPA)
- Should not be located in Wetlands (Source; Regulation 232/98, Canada)
- kept more than 60m away from and water body (Source; Pennsylvania, USA)
- Should be kept more than 60m away from tanks (Source; Tennessee, USA)
- Must be kept more than 150m away from residence (Source; Guilford, USA)
- must be kept more than 3000m away from Hospitals and schools(Source; Illinois, USA)
2) Create and design the database for analysis.
3) Managing and automating maps: e.g. digitizing and scanning.
4) Analyzing maps: using LSS tools.
5) Integrating maps: the two models were considered Boolean and IndexOverlay.
8.1.4. Boolean Model Results
Figure 14 shoes the constraints maps for the study area, and the final constraint map which
includes all of the constraint maps generated by map overlaying is shown in figure 15.
Figure 14: constraints maps for Ottawa, Canada. Using Boolean model
GIS Application in SWM, 2007
33
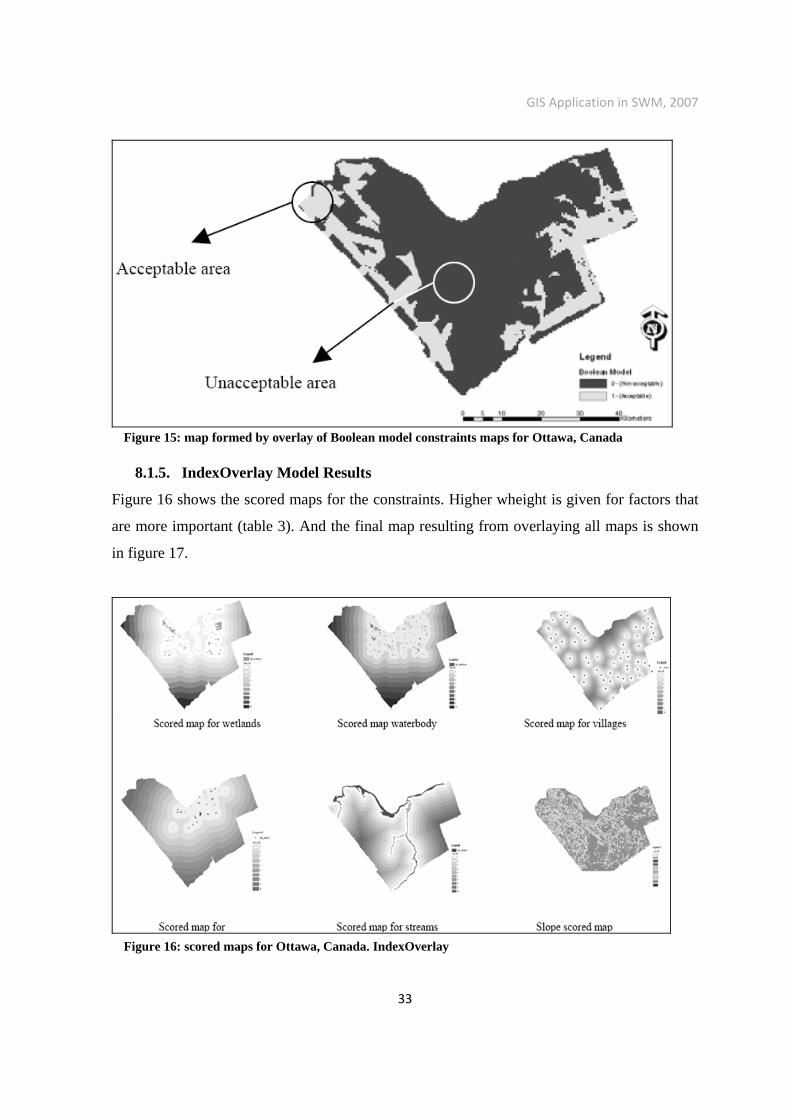
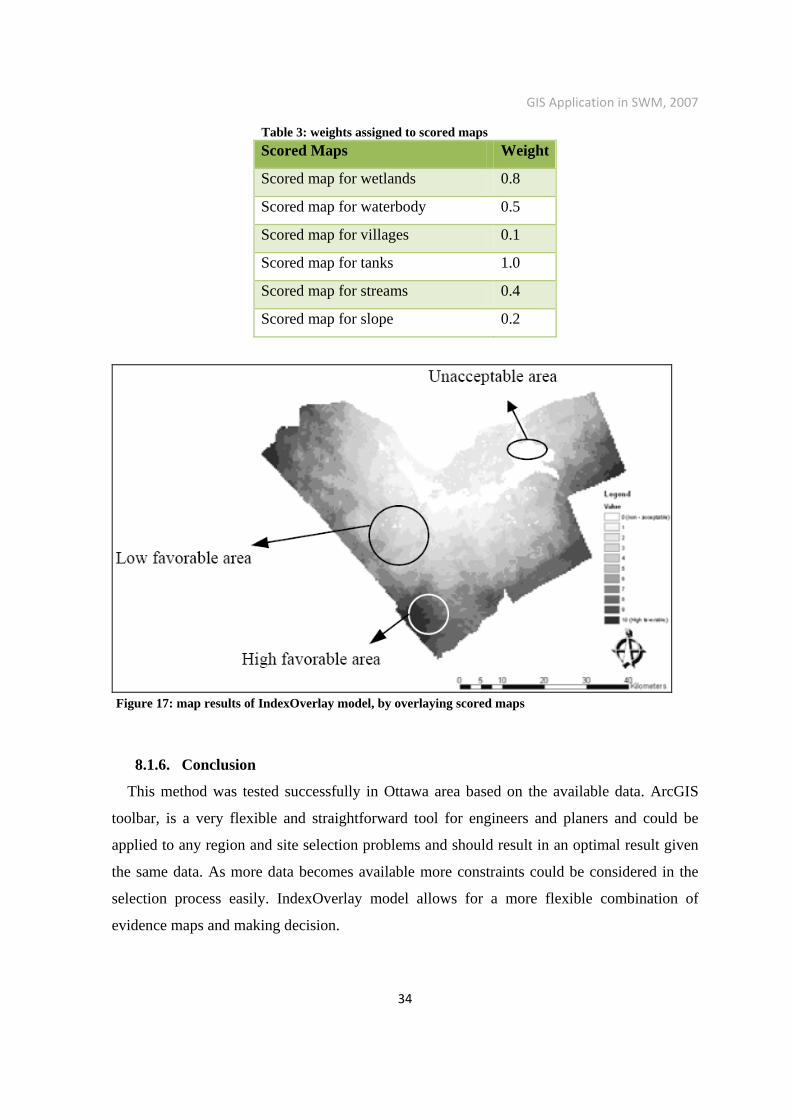
8.1.5. IndexOverlay Model Results
Figure 16 shows the scored maps for the constraints. Higher wheight is given for factors that
are more important (table 3). And the final map resulting from overlaying all maps is shown
in figure 17.
Figure 15: map formed by overlay of Boolean model constraints maps for Ottawa, Canada
Figure 16: scored maps for Ottawa, Canada. IndexOverlay
GIS Application in SWM, 2007
34
Scored Maps Weight
Scored map for wetlands 0.8
Scored map for waterbody 0.5
Scored map for villages 0.1
Scored map for tanks 1.0
Scored map for streams 0.4
Scored map for slope 0.2
8.1.6. Conclusion
This method was tested successfully in Ottawa area based on the available data. ArcGIS
toolbar, is a very flexible and straightforward tool for engineers and planers and could be
applied to any region and site selection problems and should result in an optimal result given
the same data. As more data becomes available more constraints could be considered in the
selection process easily. IndexOverlay model allows for a more flexible combination of
evidence maps and making decision.
Table 3: weights assigned to scored maps
Figure 17: map results of IndexOverlay model, by overlaying scored maps
GIS Application in SWM, 2007
35
8.2. Other Useful Applications
The purpose of proper landfill site management is to dispose of waste efficiently, safely and
economically, with minimal environmental impact to the surrounding area, in both the long
and short term. GIS can be used throughout landfill life cycle. Many researches being carried
out involves the use of a GIS to record, store and display a wide range of information of the
physical data related to landfilling. A GIS is an important tool in the planning and
development of a landfill site and has many purposes from capacity calculation to monitoring
of settlement and methane levels. Also GIS can be used during the landfilling process to
protect the surrounding environment from potential contamination, either from leachate or gas
migration. Best and worst case scenarios can be worked out for leachate contamination, gas
migration, or surface settlement simply and easily on a GIS.
9. CONCLUSION
This paper starts by giving brief introduction about solid waste (SW) and solid waste
management (SWM). Then mentions the benefits of geographic information system (GIS)
that that can be utilized in the field of SWM. The objective of this paper is to demonstrate the
aid of GIS in different areas related to SWM. Three functional elements of SWM were
discussed, which are waste storage, waste collection, and waste disposal.
In areas related to waste storage, the main approach was to use GIS to identify the exact
location of waste storage points and link its attributes to its location. This approach have been
used in different ways: in the case of Aurangabad city, India, this approach was used to
identify waste bins that are improperly placed in order to relocate them, to allocate new
recyclable waste bins, and to balance workload. For the case of Dayees Air Force in Texas,
U.S. the same approach used to record condition of waste dumpsters and schedule them for
maintenance and the use of GIS save a lot of working hours that was required for this job. For
the case of Garland’s city in Texas, U.S. the same approach used to identify owners of the
additional trash containers provided by the city municipality.
GIS Application in SWM, 2007
36
Waste collection is complex and costly process it has more than half of the budget allocated
for waste management services. The goal was to make collection system as efficient as
possible. The key solution to achieve this goal was by optimizing routes, and tracking
collection vehicles. The implementation of GIS-based routing system results in big time and
money saving. Also route optimization has other intangible advantages, such as reduce noise
and car emission.
The use of a GIS in waste disposal management starting from the site investigation stage of
a landfill site, through the site's development and filling, and then during its post closure care,
will allow the many different parameters of the complex life of a landfill to be recorded,
displayed, and analyzed. This will ensure that the maximum capacity of a landfill has been
achieved with the minimal environmental impact on the surrounding environment.

GIS Application in SWM, 2007
37
APPENDIXA
Questionnaire for the public
Case of Aurangabad city, India
GIS Application in SWM, 2007
38
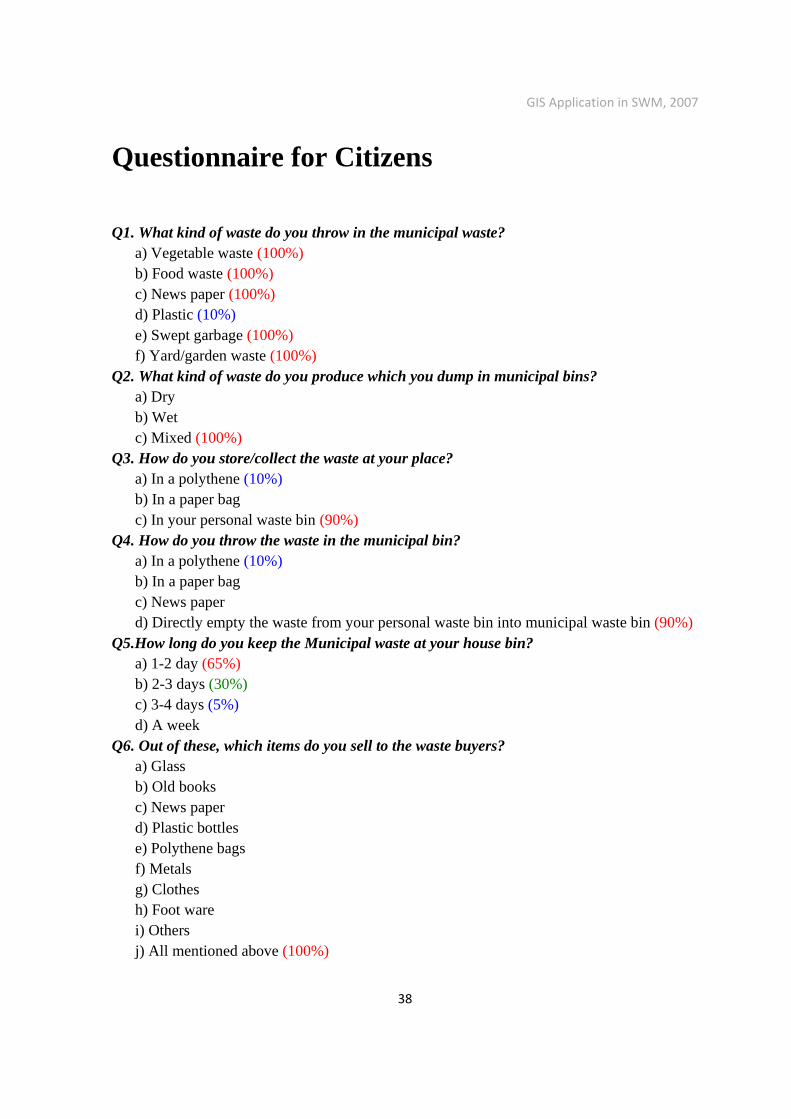
Questionnaire for Citizens Q1. What kind of waste do you throw in the municipal waste?
a) Vegetable waste (100%) b) Food waste (100%) c) News paper (100%) d) Plastic (10%) e) Swept garbage (100%) f) Yard/garden waste (100%)
Q2. What kind of waste do you produce which you dump in municipal bins? a) Dry b) Wet c) Mixed (100%)
Q3. How do you store/collect the waste at your place? a) In a polythene (10%) b) In a paper bag c) In your personal waste bin (90%)
Q4. How do you throw the waste in the municipal bin? a) In a polythene (10%) b) In a paper bag c) News paper d) Directly empty the waste from your personal waste bin into municipal waste bin (90%)
Q5.How long do you keep the Municipal waste at your house bin? a) 1-2 day (65%) b) 2-3 days (30%) c) 3-4 days (5%) d) A week
Q6. Out of these, which items do you sell to the waste buyers? a) Glass b) Old books c) News paper d) Plastic bottles e) Polythene bags f) Metals g) Clothes h) Foot ware i) Others j) All mentioned above (100%)
GIS Application in SWM, 2007
39
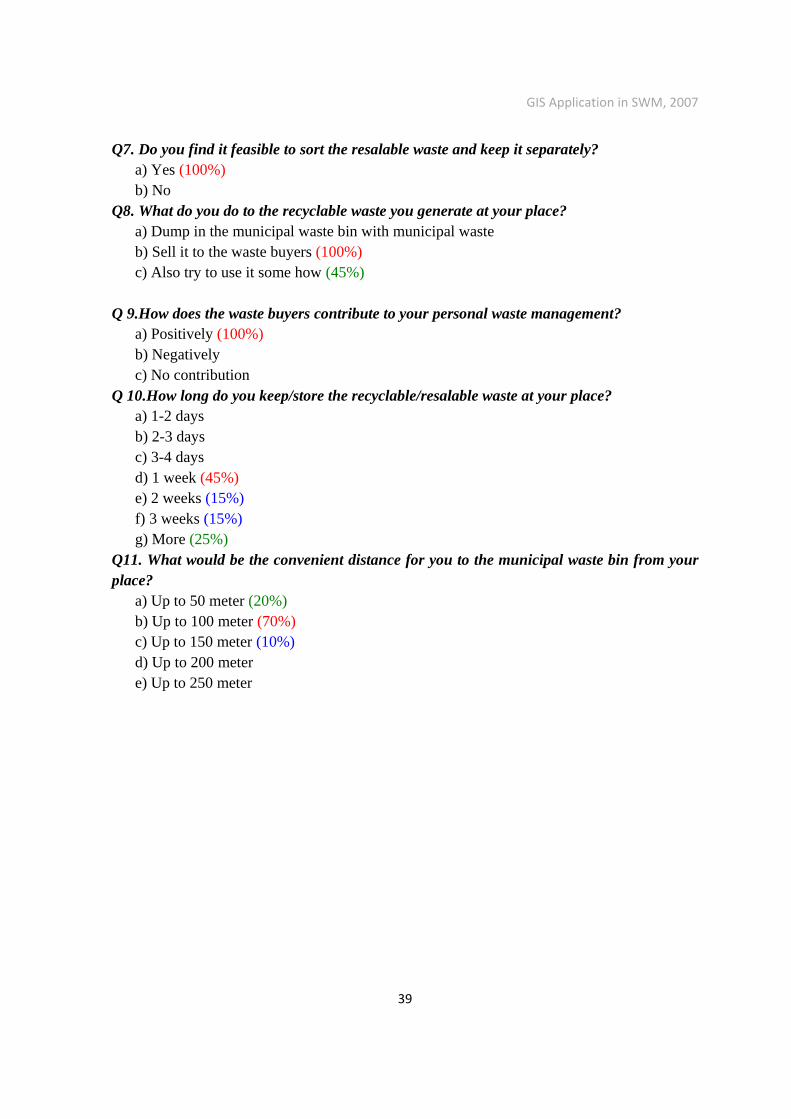
Q7. Do you find it feasible to sort the resalable waste and keep it separately? a) Yes (100%) b) No
Q8. What do you do to the recyclable waste you generate at your place? a) Dump in the municipal waste bin with municipal waste b) Sell it to the waste buyers (100%) c) Also try to use it some how (45%)
Q 9.How does the waste buyers contribute to your personal waste management?
a) Positively (100%) b) Negatively c) No contribution
Q 10.How long do you keep/store the recyclable/resalable waste at your place? a) 1-2 days b) 2-3 days c) 3-4 days d) 1 week (45%) e) 2 weeks (15%) f) 3 weeks (15%) g) More (25%)
Q11. What would be the convenient distance for you to the municipal waste bin from your place?
a) Up to 50 meter (20%) b) Up to 100 meter (70%) c) Up to 150 meter (10%) d) Up to 200 meter e) Up to 250 meter
GIS Application in SWM, 2007
40
APPENDIXB
Landfill Layers
Virginia GIS Reference Book
GIS Application in SWM, 2007
41
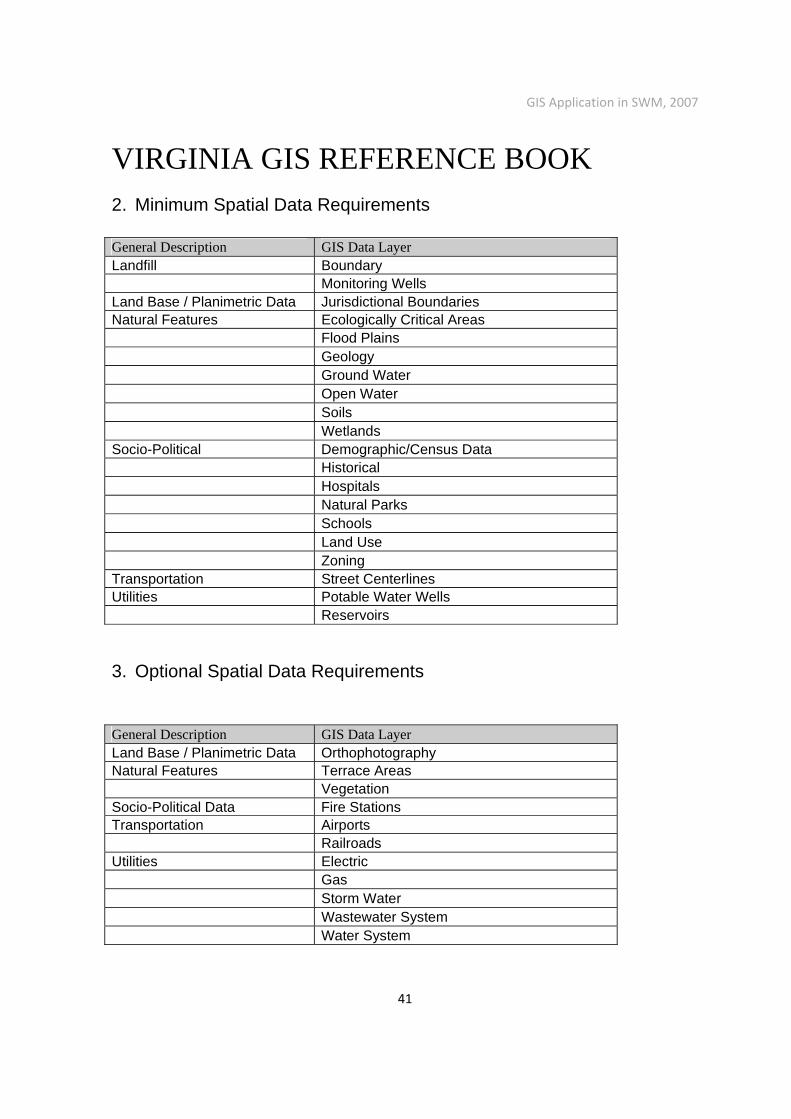
VIRGINIA GIS REFERENCE BOOK 2. Minimum Spatial Data Requirements
General Description GIS Data Layer Landfill Boundary Monitoring Wells Land Base / Planimetric Data Jurisdictional Boundaries Natural Features Ecologically Critical Areas Flood Plains Geology Ground Water Open Water Soils Wetlands Socio-Political Demographic/Census Data Historical Hospitals Natural Parks Schools Land Use Zoning Transportation Street Centerlines Utilities Potable Water Wells Reservoirs 3. Optional Spatial Data Requirements
General Description GIS Data Layer Land Base / Planimetric Data Orthophotography Natural Features Terrace Areas Vegetation Socio-Political Data Fire Stations Transportation Airports Railroads Utilities Electric Gas Storm Water Wastewater System Water System
GIS Application in SWM, 2007
42
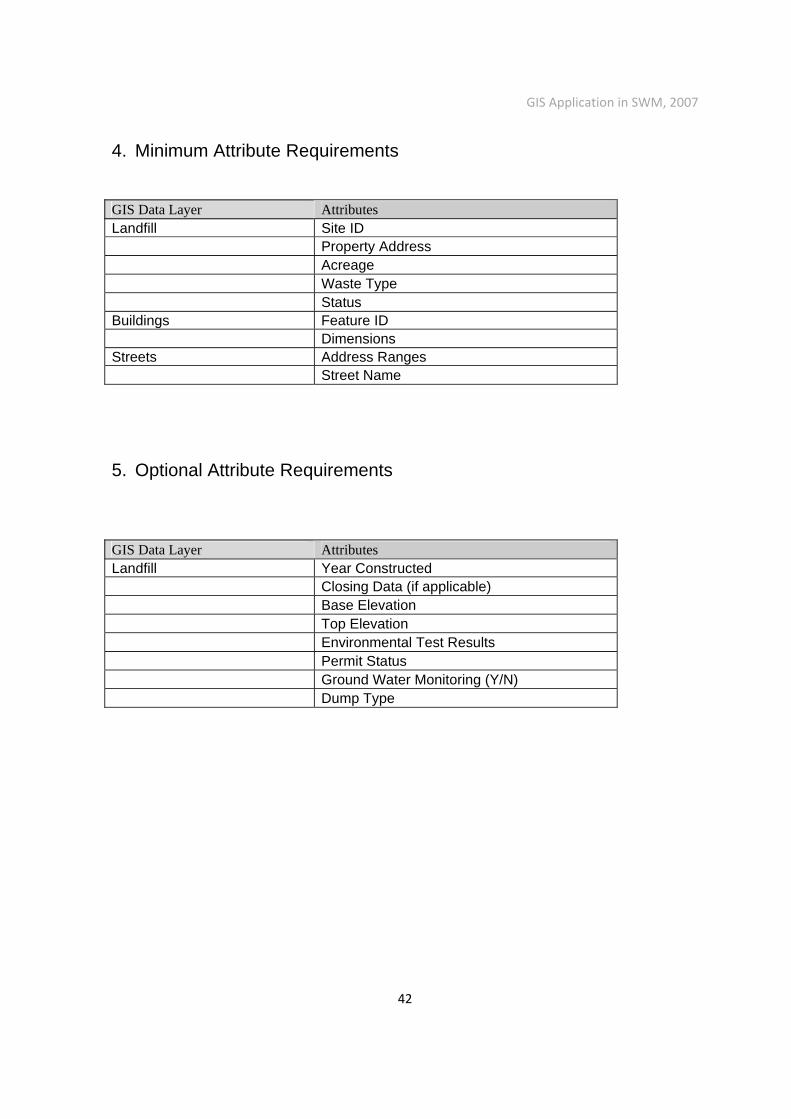
4. Minimum Attribute Requirements
GIS Data Layer Attributes Landfill Site ID Property Address Acreage Waste Type Status Buildings Feature ID Dimensions Streets Address Ranges Street Name
5. Optional Attribute Requirements
GIS Data Layer Attributes Landfill Year Constructed Closing Data (if applicable) Base Elevation Top Elevation Environmental Test Results Permit Status Ground Water Monitoring (Y/N) Dump Type
GIS Application in SWM, 2007
43
References1. Virginia GIS reference book, www.geodecisions.com
2. Michelle M. Groce, 2002, Routes, Requests, Bids, and Citations: GIS in Solid Waste
Services, the Twenty-Second Annual ESRI User Conference, San Diego, California, July
8 – 12, 2002.
3. Aurobindo Ogra, 2002, Logistics Management and Spatial Planning for Solid Waste
Management System using Geographic Information System, Map Asia Conference 2003,
Kuala Lumpur, Malaysia, 13-15 October, 2003.
4. Byung-In Kim, Bob Kraas, Surya N Sahoo, C.V. Ramanakumar, Mansour Raad;
Seongbae Kim, 2004, Web-Based Vehicle Routing Solutions for Waste Management,
Inc, the Twenty-Fourth Annual ESRI User Conference, San Diego, Calafornia, August 9-
13, 2004.
5. Shaikh Moiz Ahmed, 2006, Using GIS in Solid Waste Management Planning : A case
study for Aurangabad, India , www.diva-
portal.org/diva/getDocument?urn_nbn_se_liu_diva-6470-1__fulltext.pdf
6. William Paul Langley, 2003, ArcPad and Field Data Collection at the City of Garland,
the Twenty-Third Annual ESRI User Conference, San Diego, California ,July 7-11,
2003.
7. O.Apaydin, M.T. Gonullu, 2006, Route Optimization for Solid Waste Collection:
Trabzon (Turkey) Case Study, Global NEST Journal.
8. Susan Kathleen Stuver, 2002, GIS database and web application feasibility study for the
city of San Antonio Environmental Services Department, M.S. Thesis, Department of
Environmental Sciences, University of Texas, San Antonio.
GIS Application in SWM, 2007
44
9. Karen Grassi, 2002, Miami-Dade County Routes Trucks with Greater Efficiency,
ArcUser Online, January 2002,
http://www.esri.com/news/arcnews/winter0102articles/miami-dade.html
10. Robert Houston, Sean Sinclair, and Jim Robertson, 2005, Where's the Trash?, ArcUser
Online, Julay 2005, http://www.esri.com/news/arcuser/0705/dumpsters1of2.html
11. Jinan Li, Steven Lane, Tom McMurtrie, 1996, the Sixteenth Annual ESRI User
Conference, Palm Springs, California, May 20-24, 1996.
12. Roozbeh Daneshvar, Leta Fernandes, Mostafa Warith, Bahram Daneshfar, 2003,
Customizing ArcMap Interface to Generate a User-Friendly Landfill Site Selection GIS
Tool, ISEIS, Environmental Informatics Archives, Volume 1, (2003), 428-437.
13. GeoVision advertising poster 2004.
14. Dr. Vohra notes for the course CE 647 Municipal Solid Waste Management.
15. CPHEEO (2000) Manual on Municipal Solid Waste management, pp.219-227. Central
Public Health and Environmental Engineering, New Delhi, India
16. E. Tinmaz & I. Demir, 2005. Research on solid waste management systems: To improve
existing situation in Corlu Town of Turkey. In: Science Direct, June 2005.
17. R. K. Garg., 2002. National Solid Waste Association of India (NSWAI) Newsletter, Vol.
6, pp. 1.
18. S. Upasna & M. S. Natwat. , 2003. Selection of potential waste disposing sites around
Ranchi Urban Complex using Remote Sensing and GIS techniques. In: Map India 2003.