Embed Size (px)
Citation preview

Giovanni Facilitates Investigations of Coastal Environmental Processes with NASA Remote-Sensing DataJames G. AckerNASA Goddard Earth Sciences Data and Information Services Center(GES DISC)
CoastalGeotools‘07

Giovanni -generated anomaly analysis of SeaWiFS normalized-water leaving radiance at 555 nm for September 1999
nLw(555) anomaly analysisis based on the SeaWiFS climatology compiled from September 1997 to August 2006

Giovanni -generated image of Tropical Rainfall Measuring Mission (TRMM)
accumulated rainfall from Hurricane Floyd,September 16-17, 1999
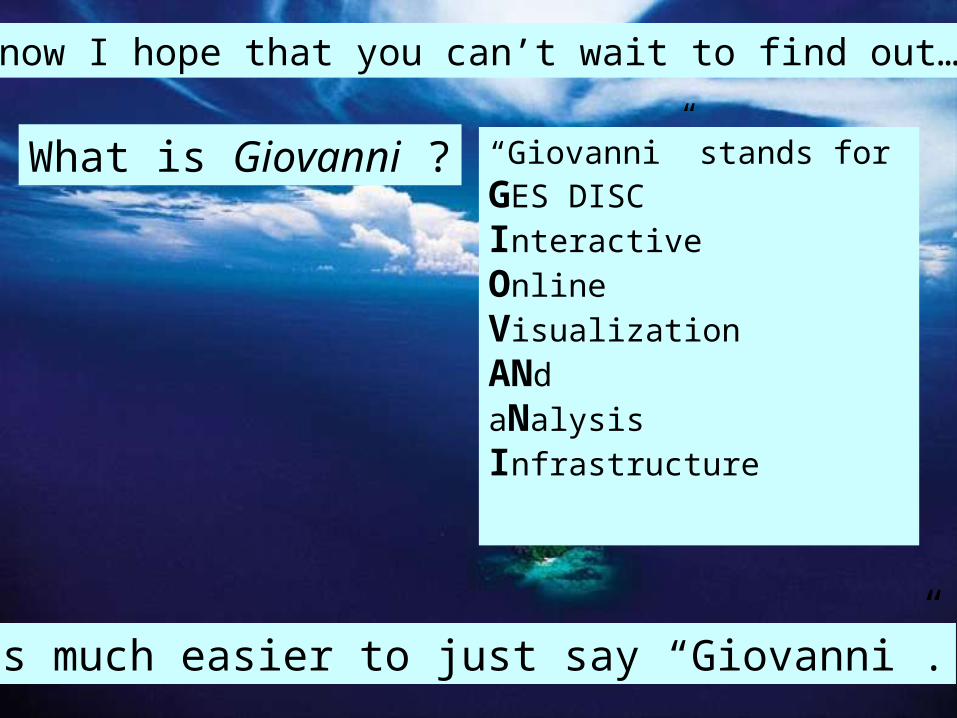
So now I hope that you can’t wait to find out…
What is Giovanni ? “Giovanni” stands for GES DISCInteractiveOnlineVisualization ANdaNalysisInfrastructure
It’s much easier to just say “Giovanni”.

What does Giovanni do?
Giovanni is a Web-based data exploration system that enables rapid data access, analysis, and visualization online – users do not have to download data files to their own system before initiating analysis and research.

The main components of the Giovanni interface are:
interactive map for region-of-interest selection; menu of available data products; calendar menu for time-period selection; menu of visualization options; visualization-specific options (color palette, axis values); menu of output options (plot, ASCII text data)

This presentation will discuss:
Precipitation data from TRMM;
MODIS atmospheric data
Atmospheric data from the Advanced Infrared
Sounder (AIRS)
Ocean color data from SeaWiFS and MODIS
+ sea surface temperature from MODIS
(my specialty)

Precipitation data from the Tropical RainfallMeasuring Mission (TRMM)
TRMM is still in operation;
Mission data record begins in January 1998 (other precipitation data sets in Giovanni begin in 1979 and 1950, respectively);
TRMM observational coverage is about 35˚ N to 35˚ S.

TRMM accumulated rainfall for Ivan, Katrina, and Rita
Ivan, 09/16/2004
Katrina, 08/24 – 09/03/2005 Rita, 09/20 – 09/27, 2005

TRMM data is not just for hurricanes:
Standard convective summer thunderstorm precipitation can also be analyzed.
Rainfall accumulationover Florida,August 25-31,2001

Atmospheric data from the Moderate Resolution Imaging Spectroradiometer(MODIS)
MODIS-Terra record begins March 2000;
MODIS-Aqua record begins July 2002.
Data include clouds, water vapor, and aerosols.
Global observational coverage

Winter vs. Summer Aerosol Optical Depth on the U.S. East Coast
February 2003
August 2003
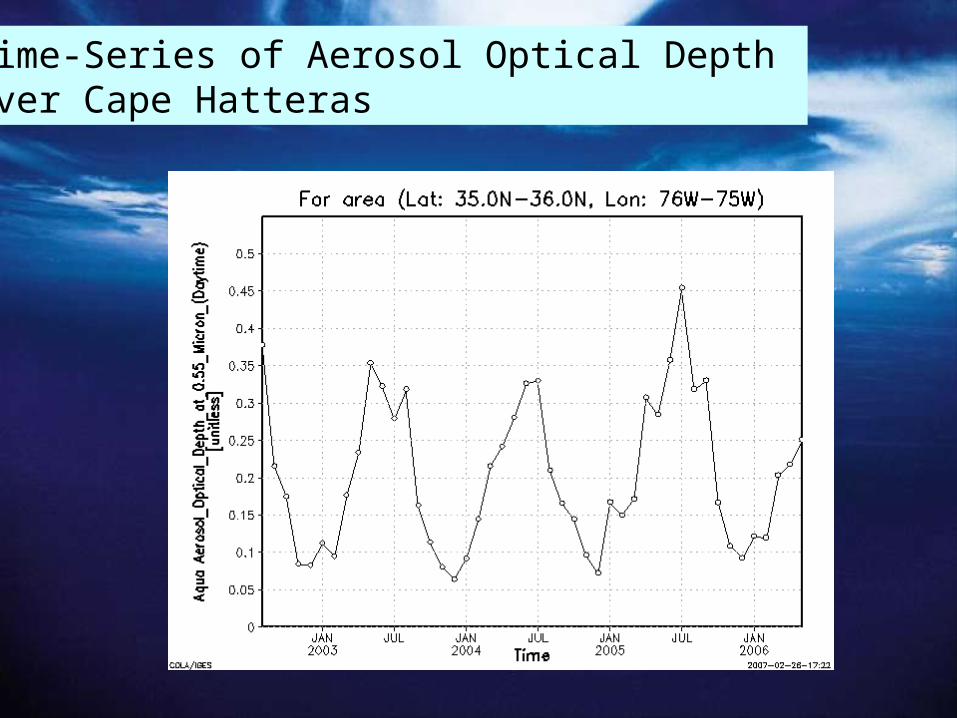
Time-Series of Aerosol Optical Depth over Cape Hatteras

Hovmöller time vs. longitude plot of Aerosol Optical Depth over North Carolina and Virginia, August 2003 – January 2006
For this region:

Advanced Infrared Sounder (AIRS)
provides relative humidity, water vapor, cloud, and temperature data; can be plotted as atmospheric profiles daily or monthly data is available
Relative humiditytime-seriesfor North Carolina –southern Virginiaregion shownin previous slide

“Online Analysis Enhances Use of NASA Earth Science Data” Eos, 88(2), January 9, 2007 *
features multiple views of Saharan dust storms:
* Reprints available on request at the end of the presentation
MODIS image, aerosol optical depth plot and Hovmöller diagram
Aerosol optical depthtime-series and AIRS relative humidityprofile
Dry dust stormair mass

Ocean Color (Radiometry*) data from SeaWiFSand MODIS-Aqua
SeaWiFS data available from September 1997 (8-day andmonthly data products)
MODIS-Aqua data available from June 2002 MODIS-Terra SST data soon-to-available from mid-2000
In addition to the basic Giovanni functions, Ocean ColorGiovanni includes:• SeaWiFS climatological anomaly analysis• NASA Ocean Biogeochemical Model (NOBM) output• Multi-dataset Intercomparison Interface – multiple data
display in map plots, time-series, and scatter plots
* as requested by the International Ocean Color Coordinating Group

Examples of coastal zone data analyses from Ocean Color Giovanni
Gulf of Mexico, January 2003: SeaWiFS Chlorophyll color mapMODIS-Aqua SST contour map

Animation: Southeastern United States coast,March 30 – April 30, 2003 (with customized color palette)
0.1 to 5.0 mg m-3
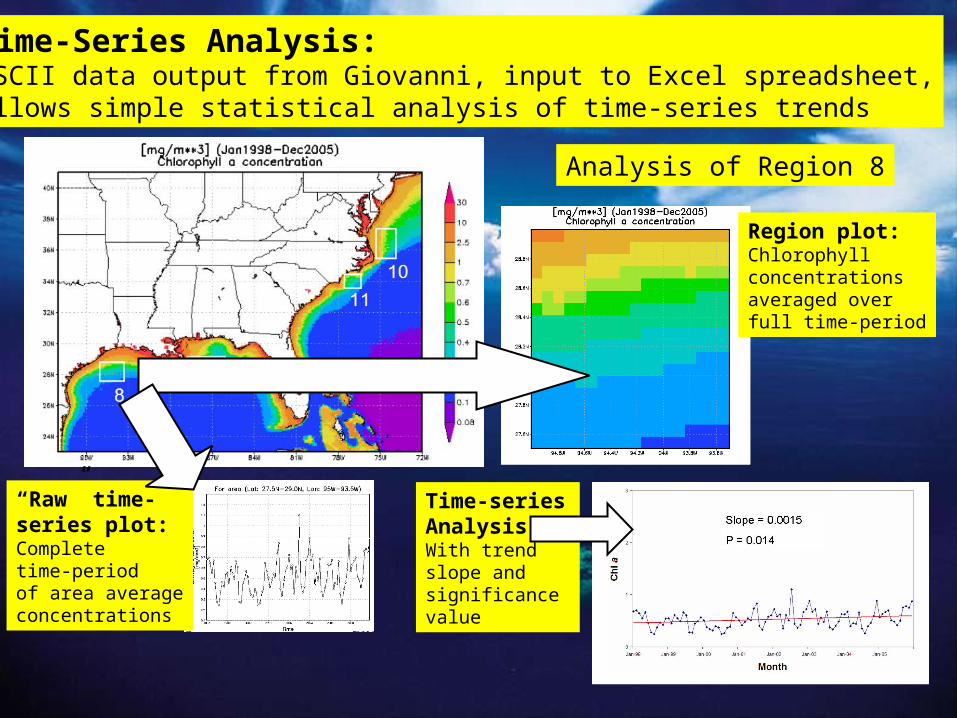
Time-Series Analysis: ASCII data output from Giovanni, input to Excel spreadsheet,allows simple statistical analysis of time-series trends
Analysis of Region 8
Region plot:Chlorophyllconcentrationsaveraged overfull time-period
“Raw” time-series plot:Completetime-periodof area averageconcentrations
Time-series Analysis:With trend slope and significance value

Scatter plots: Changes in chlorophyll-SST relationships at the mouth of Tampa Bayfor August-November periods with high (2004, 2005) and low (2002, 2003) hurricane influence
Aug-Sep
Oct
Nov
2002
Aug-Sep
Oct
Nov
2003
Oct
Nov
Aug
Sep
2004
Oct
Nov
Aug
Sep
2005
Area plots of chlorophyll concentrationsfor this regionand time periodin 2002 and 2005

SeaWiFS Chlorophyll Climatological Anomaly Analysis:
Using a September 1997 – August 2006 base period, Giovanniallows comparison of average chlorophyll concentrations forany time-period (up to one year) to the climatological average
October 2005 was the wettest October in history for the northern Mid-Atlanticand New Englandcoastal states

Time-series of chlorophyll concentration anomaly shows a remarkably large anomaly in November 2005
November 2005
Comparison of the chlorophyll concentrationanomalies in November2004 (left) and 2005 (right) shows the widearea distribution of thepositive anomalies

These examples of Giovanni analyses provide a cross-section ofGiovanni’s capabilities for coastal zone monitoring and researchutilizing several different remotely-sensed data products fromNASA.
Coastal zone issues to which these data may be applied include:
Water-quality monitoring Nutrient load impacts Hazardous algal blooms Flood and drought assessment Severe storm impact Influences on coastal habitats and protected areas Regional trend detection Air quality monitoring and event detection

Suspended sediments in Florida Bay caused by Hurricane Wilma
For ocean color Giovanni, we are currently working on the addition of a “colored dissolved and detrital matter” data product and a particulate backscatter data product.
We are hoping to add a euphotic depth data product (1% light level), which can be easily transformed to Secchi depth values. We believe this product will have broad applicability for coastal zone water quality monitoring.
The coastal zone is a fragile and delicate environment. Let us all work together to understand and protect it.
Thank you for your attention today.