Embed Size (px)
Citation preview

RUNNING HEAD: AFFILIATIONS, ENDORSEMENTS, AND IPO SUCCESS
GETTING OFF TO A GOOD START:
THE EFFECTS OF UPPER ECHELON AFFILIATIONS
ON INTERORGANIZATIONAL ENDORSEMENTS AND IPO SUCCESS ∗∗∗∗
MONICA C. HIGGINS Harvard Business School
Organizational Behavior Unit Soldiers Field Park Boston, MA 02163
Phone: (617) 495-6993 Fax: (617) 496-6568
e-mail: [email protected]
RANJAY GULATI Kellogg Graduate School of Management
Northwestern University Department of Organization Behavior
2001 Sheridan Road Evanston, IL 60208-2001 Phone: (847) 491-2685
Fax: (847) 491-8896 e-mail: [email protected]
∗ We thank Raphael Amit, Bharat Anand, Carliss Baldwin, Ben Esty, Morten Hansen, Michael Higgins, Linda Johanson, Rakesh Khurana, Josh Lerner, Jay Light, Jay Lorsch, Nitin Nohria, William Ocasio, Gary Pisano, Mikolaj Jan Piskorski, Woody Powell, Toby Stuart, Mike Tushman, and James Westphal for their helpful comments and discussions on the present research. We also thank Josh Lerner for the use of his equity index and Brian Bushee for the use of his institutional investor classification data. We are especially thankful to John Galvin for his research assistance and contributions to the present study, and we appreciate the research assistance of Suzanne Purdy and Paul Nguyen as well.

2
GETTING OFF TO A GOOD START:
THE EFFECTS OF UPPER ECHELON AFFILIATIONS ON
INTERORGANIZATIONAL ENDORSEMENTS AND IPO SUCCESS
ABSTRACT
This article examines the origins of interorganizational endorsements in the context of
firms undergoing an initial public offering (IPO). We propose that the affiliations associated
with the career histories of a firm’s upper echelon, including its managing officers and board
members, send important signals to external parties who are evaluating the quality of young
firms. Such signals are critical to the matching process between firms and endorsing
organizations, since young firms lack well-established networks and a favorable reputation at the
time they are being considered for endorsement. We introduce a three-way typology of upper
echelon affiliations and hypothesize that each of the three types of upper echelon affiliations with
prominent organizations enhances the perceived quality of the young firm in terms of the
personal and social resources that such ties afford. We test our assertions on a sample of public
and private biotechnology firms that were founded between 1961 and 1994 and that went public
between 1979 and 1996. Analyses of the five-year career histories of the over 3200 executives
and directors that make up the upper echelons of these firms show that the prestige of a firm’s
lead underwriter depends on the upper echelon as a whole having affiliations with prominent
downstream organizations (i.e., pharmaceutical and/or healthcare companies) and with
prominent horizontal organizations (i.e., biotechnology companies). Additionally, we find that
the success of a firm’s IPO depends on specific types and combinations of upper echelon
affiliations. Our analysis has implications for the study of organizational endorsements,
embeddedness, and entrepreneurship.

3
Research in organizational theory has long suggested that social structure affects the
outcomes of young firms (Stinchcombe 1965). Scholars have proposed an implicit hierarchy or
ranking among firms such that a firm’s socially-defined position in its marketplace (White 1981)
can affect market participants’ perceptions of the firm. In particular, a firm’s status-based
affiliations has been conceptualized as a means of enhancing a firm’s power over other
individuals (Weber 1968; Veblen 1953) or, as a signal of firm quality when other, more direct
indicators are unclear (Podolny 1993). As recent work has shown, a young firm’s ties to high-
status organizations, such as prestigious venture capital firms or investment banks, can affect the
extent to which a firm is endorsed by the investment community (Stuart, Hoang, and Hybels
1999). But while the role of interorganizational relations in facilitating the growth of firms has
received increasing attention (e.g., Zuckerman 1999; Rao 1994), scholars have paid less attention
to the origins of such ties, particularly in social networks research, since theory rests on the
notion of a pre-existing social structure of which a bounded and identified network is a necessary
precondition (Laumann, Galaskiewicz, and Marsden 1978).
In extending research on interorganizational relations to endorsements, there are some
unique elements to be considered. While all firms are subject to the demands of multiple
constituents (White 1981) and so, are subject to evaluation by groups in their environment
(Thompson 1967), receiving endorsement from an influential organization is a particular concern
for young firms, since they have not yet developed a favorable reputation (Rao 1994; Rao and
Drazin 2000). Additionally, endorsement is a particular concern for firms that face mediated
markets, such as the initial public offering (IPO), which are characterized by significant
ambiguity regarding firm valuation and depend on highly visible critics, such as investment
bankers, who wield tremendous influence over investor behavior (Zuckerman 1999). Although

4
scholars have begun to examine the consequences of organizational endorsement, the
antecedents to this important form of matching have not yet been studied.
We situate our study of interorganizational endorsement in the context of a young firm’s
IPO. In general, firms that go public do so with the endorsement of a lead investment bank that
underwrites the firm’s security offerings. In the present study, we focus our attention on the
extent to which the affiliations of a young firm’s upper echelon—that is, the firm’s top managers
and board members—serve as signals that affect a prestigious investment bank’s endorsement
decision. We propose that upper echelon affiliations that derive from members’ employment and
board memberships with prominent organizations can serve as signals of quality when other
indicators are weak, much as Spence (1974) argued that education can serve as a signal to
potential employers when the productivity of new hires is uncertain. In the IPO context, signals
associated with upper echelon members’ career backgrounds may be critical, since objective
measures of firm quality are difficult to come by. In industries such as biotechnology, the
context studied here, in which product development cycles are extremely long (seven to ten
years) and the needs for cash are in the hundreds of millions of dollars (Burrill and Lee 1993;
Dibner 1999), the upper echelon’s ability to signal the firm’s quality to the investment
community is paramount.
We examine the effects of upper echelon backgrounds on the prestige of a firm’s lead
investment bank during its IPO, and we examine the effects of upper echelon affiliations on IPO
success. Organizational scholars have shown considerable interest in the implications of
embeddedness for firm outcomes (e.g., Baum and Oliver 1992; Palmer, Zhou, Barber, and
Soysal 1995). We continue in this research tradition of examining the implications for firms of
their affiliations with other organizations. By examining both the antecedents and consequences

5
of organizational endorsements, we build on the work of Stuart, Hoang, and Hybels (1999),
which demonstrated the positive effect of ties to prominent others on firm outcomes; our
research highlights the social origins of some of those important relationships. We gauge IPO
success by the proceeds to the firm as a result of the offering and by the number and quality of
the institutional investors that choose to invest in the young firm. Looking beyond financial
indicators of IPO success to the types of investors that endorse a young firm can extend our
understanding beyond the origins of direct endorsements, such as those from prestigious
investment banks, to the origins of second-order endorsements, such as those from institutional
investors.
THEORY AND APPLICATION TO THE IPO
Recent organizational research has introduced a perspective on finance that is largely
premised on the idea that a firm’s outcomes are affected by its networks of relationships with
others (e.g., Uzzi 1999; Zuckerman 1999). Although this research has not directly refuted the
financial axiom that firms are stratified through market perceptions of a firm’s economic value, it
has suggested that social and structural relationships modify economic processes and behavior
(Granovetter 1985). As prior studies have shown, a firm’s exchange relations with high-status
others can affect a host of firm outcomes, including market share (Podolny, Stuart, and Hannan
1996), the spread between costs and price (Podolny 1993), and reactions of the financial
community (Stuart, Hoang, and Hybels 1999).
Yet despite this increased interest in the role of interorganizational relationships in the
financial performance of firms, there has been relatively little research on the antecedents of
powerful interorganizational relationships. Furthermore, prior research that has addressed this
question has focused on the formation of business partnerships, but not on the origins of

6
organizational endorsement. The process of endorsement has some distinct dynamics. One
distinct element is the generally limited history of interaction between a firm and its endorser.
Additionally, in mediated markets, the legitimacy of a firm largely depends on its relationship
with a powerful endorser. As recent research has found, firms that fail to gain reviews by critics
who specialize in the firm’s product can convey illegitimacy to the marketplace, affecting firm
outcomes (Zuckerman 1999). In the IPO context studied here, one important critic that can
affect the behavior of “consumers” or investors at the time of an IPO is a firm’s lead underwriter;
the more prestigious the lead underwriter, the greater the signals of quality that are conveyed,
affecting the firm’s reputation and ability to secure financial resources (Carter and Manaster
1990).
Convincing a prestigious investment bank to endorse a young firm is primarily the
responsibility of a firm’s top managers and board members, which we refer to here as the firm’s
upper echelon. Some have argued that the better the technological quality of the young firm, the
easier it is for the firm to attract the attention of a prestigious investment bank and to obtain a
sizable IPO (e.g., Deeds, DeCarolis, and Coombs 1997). But during the early stages of a young
firm’s lifetime, and particularly in industries in which the product’s underlying technology is
complex and uncertain, like the biotechnology industry studied here, providing direct evidence of
quality is problematic. Even seemingly obvious indicators, such as the number of patents held
by a firm, have received mixed reviews in recent studies of their effects on investors’ perceptions
(DeCarolis and Deeds 1999). Given such difficulties in directly evaluating the young firm’s core
technology, outsiders look for other indications that the organization and its product are viable.
One important signal of firm quality that the upper echelon can utilize in selling the
young firm is the backgrounds of the upper echelon members. Indeed, when a firm files its

7
official S-1 document with the Securities and Exchange Commission (SEC), which starts the
formal marketing process of the firm, it is required to report the five-year career histories of both
its managing officers and its board members. This company information is generally contained
in a section called “Management” and includes a listing of the firm’s directors’ and managing
officers’ prior employment and board memberships. This information, along with other portions
of the S-1 document, is reviewed carefully by potential investors who are deciding whether to
endorse a young firm (Bochner and Priest 1993). And, when the firm formally presents itself to
the investment community during the company’s “road show,” the backgrounds of the firm’s
board members and its managing officers are showcased as well. Our focus here on the
backgrounds of a firm’s entire upper echelon centers on the signaling value associated with this
information and is consistent with recent research perspectives on upper echelons (Jensen and
Zajac 2000; O’Reilly, Snyder, and Booth 1993).
Prior research has suggested that the quality of top executives’ prior jobs can indicate
high status (e.g., Davis 1991), generating advantages for the firm by creating perceptions of skill,
trustworthiness, and reputation that increase the firm’s attractiveness to potential suitors
(Eisenhardt and Schoonhoven 1996). Affiliations with specific organizations that upper echelon
members of young entrepreneurial firms worked for can be considered signals of firm-level
resources, much as other upper echelon characteristics that have been studied in the context of
well-established firms in the past (e.g., D’Aveni 1990; Hambrick and D’Aveni 1992). Such
affiliations can signal valuable information to third parties who are considering whether to
provide financial resources to a young firm. As recent research has suggested, signals regarding
the resources associated with the backgrounds of a firm’s employees can lend legitimacy to a
young firm (Rao and Drazin 2000)—legitimacy that can have an important effect on the

8
endorsement decisions of others.
We extend these ideas one step further now to consider how specific types of prominent
upper echelon affiliations can signal different aspects of firm quality in the biotechnology
industry.
A Typology of Upper Echelon Affiliations
Building upon prior research, we propose that upper echelon affiliations can be classified
into three types of firm ties—upstream, horizontal, and downstream affiliations (e.g., Baum,
Calabrese, and Silverman 2000; Cockburn and Henderson 1998) – representing different types of
relationships a firm can have with participants in its market (White 1988, 1993). Here, this
typology is used to classify the different types of organizational affiliations that derive from the
career histories of members of a firm’s upper echelon. Different types of upper echelon
affiliations can signal different aspects of firm quality. Upstream affiliations, or ties to
prominent research institutions, signal technological quality—that the firm’s product or
technology is viable or scientifically sound. Horizontal affiliations, or ties to prominent
organizations in the firm’s own industry, signal the firm’s organizational quality—its ability to
manage its own resources effectively, including its people, money, and assets. Downstream
affiliations, or ties to prominent institutions that specialize in marketing, distributing, and selling
end-stage products, signal the firm’s market-based quality—its ability to bring its products to
market, including testing, conducting trials, marketing, and selling products.
Upper echelon upstream affiliations. Upstream affiliations in the biotechnology
industry derive from upper echelon members’ employment affiliations with prominent
organizations such as research institutions, think tanks, and/or universities (e.g., to national
institutions such as the National Institutes of Health (NIH), major universities in biology and

9
chemistry, and institutions that receive substantial grants to pursue specialty areas). During the
acquaintanceship period, when a firm is seeking funding for an IPO, investment bankers are
likely to interact with several members of the firm’s upper echelon, including those who have
high-level research positions in the firm. In addition to calibrating the stage of the firm’s
products, having discussions with upper echelon members with experience from major research
institutions should bolster the analysts’ confidence in the firm’s ability to conduct high-quality
research and to manage the research process, because of the level and quality of resources
associated with such institutions. Industry contact with academia enables the diffusion of
technological knowledge that is extremely valuable to young biotechnology firms (e.g., Zucker,
Darby, and Brewer 1994); thus, a young firm’s association with elite sponsors such as
prestigious research universities should signal the potential for transfer of knowledge, affecting
future collaborations and learning (Koput, Powell, and Smith-Doerr 1997).
Moreover, upper echelon affiliations with prominent upstream institutions can signal to
others that the technological quality of the firm is sound, since one would expect top executives
with such ties to join only firms that show technological promise. To assume otherwise would
be to believe that individuals engage in relationships with firms that are other than reputation-
enhancing. An upper echelon with many ties to prominent upstream organizations, signaling
technological quality, is likely to attract a prestigious investment bank as its lead underwriter:
Hypothesis 1: The greater the number of upper echelon affiliations with prominent upstream organizations, the greater the prestige of a young company’s investment bank at the time of the IPO.
Upper echelon horizontal affiliations. An upper echelon’s horizontal affiliations in the
biotechnology industry derive from upper echelon members’ employment and board affiliations
with prominent organizations in the biotechnology industry. Through such affiliations, the firm

10
gains or has the potential to gain valuable resources in the form of information, contacts, and/or
funds that will enable it to compete effectively. Competing effectively requires industry-specific
understanding of how to secure important resources such as cash, scientists, equipment, and
laboratory space, as well as managerial knowledge of how to structure, design, and manage a
biotech organization to maximize innovation and learning (Powell, Koput, and Smith-Doerr
1996; Pisano and Mang 1993). As scholars have recently suggested, organizations can facilitate
the transfer of valuable resources such as intellectual capital and ideas by recruiting individuals
from well-established organizations in the firm’s same industry (Rao and Drazin 2000).
During the acquaintanceship period between a young firm and investment banks, it is
important for bankers to assess whether the company is worth its endorsement—by, for example,
examining the financial history provided by the company, the firm’s product development
schedule and research and development plans, and the strategic direction articulated by the firm’s
top executives. Entrepreneurs with business plans that match the expectations of the industry are
much more likely to be accepted by outsiders in the investment community (Aldrich 1999). IPO
members who have worked in the biotechnology industry are likely to have an appropriate sense
of the timing of research and financial milestones as well as human resource considerations,
including how to staff projects and structure the organization. Having upper echelon members
who worked for prominent biotechnology firms signals to outsiders that such estimates and
decisions are likely to be both appropriate and reliable, given the valuable skills and knowledge
they presumably acquired while working for such firms.
Furthermore, upper echelon members’ affiliations with prominent horizontal institutions
can positively influence outsiders’ expectations of the firm’s future organizational quality (cf.
Benjamin and Podolny 1999). Even if upper echelon members do not tap into their prior

11
employment-based ties during the IPO process, horizontal affiliations signal to outsiders that the
firm has the potential to access high-quality information that can assist the firm in managing its
resources effectively in the future. Thus,
Hypothesis 2: The greater the number of upper echelon affiliations with prominent horizontal organizations, the greater the prestige of a young company’s investment bank at the time of the IPO.
Upper echelon downstream affiliations. In biotechnology, an upper echelon’s
downstream affiliations derive from team members’ affiliations with prominent pharmaceutical
and/or healthcare companies – companies that have resources such as information, contacts, and
funds that can help the young firm bring its core technology, product, and/or service to market.
The wealth, status, and power associated with prominent pharmaceutical firms are likely to have
provided the upper echelon member with valuable knowledge when he or she worked for the
firm, including knowledge of product testing (e.g., clinical trials), of the Food and Drug
Administration (FDA) approval process, of product marketing, and of how to sell a product or
technology. Pharmaceutical companies, unlike small biotechnology firms, are well equipped and
have unique information in each of these areas (Powell, Koput, and Smith-Doerr 1996). Further,
since this information was derived from upper echelon members’ employment at prominent
pharmaceutical firms, the capabilities and connections afforded the young biotechnology firm are
likely to be substantial, attracting the attention of the investment community.
During the acquaintanceship period, analysts typically meet with the firm’s top
executives. Knowing that an individual whom they met had been employed by a major
pharmaceutical company is likely to increase their perception of firm quality, since such
affiliations suggest that the person leading the firm has gilt-edged qualifications and powerful
friends (Finkelstein 1992). Knowing that several key members of the young firm are affiliated

12
with major pharmaceutical companies should provide additional confidence in the firm’s
leadership and, in particular, the firm’s ability to bring its product to market. Such affiliations
are important resources for the firm since they indicate that valuable information, access, and
influence has been and/or can be, in the future, made available to the firm.
In addition, the upper echelon’s affiliations with prominent downstream organizations are
likely to be a healthy signal to outsiders of structural advantages for the firm in the future (cf.
Lin, Ensel, and Vaughn 1981). There is a risk associated with individuals who already have
prominent affiliations deciding to work for and/or sit on the board of a young firm, a decision
that is based on their own judgment of the firm’s potential. Hence, the upper echelon’s
affiliations with prominent downstream firms can positively influence outsiders’ expectations
about the firm’s ability to navigate through the many stages it takes to bring a product to market
in the future. In biotechnology, this positive regard is especially salient, since, at the time of
IPO, the firm has yet to engage in such downstream activities; thus, directly observing the firm’s
capability in this domain is impossible. Thus,
Hypothesis 3: The greater the number of upper echelon affiliations with prominent downstream organizations, the greater the prestige of a young company’s investment bank at the time of the IPO.
Although we have argued thus far that more of each of three types of upper echelon
affiliations are better, a young firm must convince outsiders that it has, concurrently,
technological, organization-based, and market-based quality when courting an investment bank.
Having prominent upper echelon affiliations across all three categories signals the potential for a
firm’s access to capabilities and connections with respect to all of the aforementioned aspects of
firm quality. Signals of such skills and connections complement one another; they are not
perfect substitutes since they tap into different dimensions of firm quality that are relevant to

13
external evaluations of the firm’s potential. Thus, a firm with an upper echelon with coverage
across all three types should have an advantage in securing interorganizational endorsements
over a firm with an upper echelon that does not have such range.
From a potential underwriter’s perspective, as an evaluator and decision-maker in the
highly uncertain context that characterizes IPOs in this industry, it is reasonable to expect that
simplified models of reality will be adopted (Simon 1955; March and Simon 1958). As Cyert
and March (1963) described, decision-makers who face uncertain environments are apt to
economize on their evaluation processes by looking for external referents that can allay specific
concerns governing their decision-making. Different types of upper echelon affiliations can
serve as such referents for endorsing organizations—collectively, presenting a simplified story or
social construction of the endorsement situation (Berger and Luckman 1966) that allays multiple
concerns regarding the endorsement decision. The greater the range of ties represented by a
firm’s upper echelon, the greater the confidence an endorsing organization should have in the
firm’s overall ability to attend to multiple aspects of quality, indicating its potential to succeed in
the marketplace. Such a diverse set of affiliations should signal to outsiders both the breadth and
depth of the upper echelon’s capabilities and connections—signaling that the firm both has and
could in the future obtain a variety of valuable resources from prominent firms. Therefore,
Hypothesis 4: The greater the range of prominent upstream, horizontal, and downstream affiliations of a young company’s upper echelon, the greater the prestige of the firm’s investment bank at the time of the IPO. Upper Echelon Affiliations and IPO Success
There is a growing body of organizational research on the factors affecting IPO success
(e.g., Welbourne and Andrews 1996; Mavrinac 1999; Stuart, Hoang, and Hybels 1999;
Welbourne and Cyr 1999). In biotechnology, recent estimates suggest that bringing a product to
14
the market can cost as much as $250 million (Dibner 1999). Moreover, at seven to ten years, the
time to market is very long in this industry (Hamilton 1994). Therefore, it is extremely difficult
for young biotechnology firms to generate internally the resources they need to survive (Aldrich
and Pfeffer 1976). The IPO therefore plays a crucial role in a biotechnology firm’s ability to
maintain itself.
Prior research on IPOs in the biotechnology industry has demonstrated that
interorganizational affiliations can affect IPO success. For instance, research on biotechnology
firms has shown that IPO success is influenced by the number of directors from top venture
capital firms (Finkle 1998), by the number of alliances and geographical position of the firm
(DeCarolis and Deeds 1999), and by the prominence of the firm’s equity investors, alliance
partners, and lead investment bank (Stuart, Hoang, and Hybels 1999). An underlying claim of
these studies is that prominent affiliations benefit firms because of a transfer of status through
which prominent associations provide endorsements of the young firm’s quality; thus, the
reputation of firm-level affiliations can have implications for a firm’s identity (Benjamin and
Podolny 1999). An upper echelon’s affiliations may therefore be significant not only for
investment bank choice but also for IPO success. Upper echelon affiliations should affect IPO
success not only through their effect on the firm’s ability to partner with a prestigious investment
bank but through their effect on perceptions of firm quality in the eyes of potential investors.
Throughout the IPO process, the primary role of the investment bankers, particularly the
lead bank in the syndicate of managing underwriters, is to broker the IPO deal. Firms do not sell
shares to the public directly; rather, firms sell stock to the banks at a negotiated discount, and the
banks, in turn, sell stock to dealers and to their institutional and retail investors. Thus, the capital
raised at the time of the IPO is a direct result of the investors’ interactions principally with the

15
managing underwriter. Furthermore, given the relative inexperience of investors compared to an
investment bank’s research analysts in evaluating young firms undertaking an IPO, investors are
apt to rely on the endorsement of the managing underwriter when deciding whether to buy stock
in the young firm (see Bochner and Priest 1993). The more prestigious the lead investment bank,
the more valuable the bank’s role as mediator, since prestigious banks are regarded as especially
adept at evaluating the quality of young firms (Carter and Manaster 1990).
Still, it is also the case that during the “road show,” when the firm is pitched to potential
investors, the backgrounds of the managing officers and directors are presented; thus, the quality
of the affiliations of a firm’s upper echelon may also have direct effects on investors’ decisions
to provide financial resources. Therefore, while we expect to find that the prestige of the
investment bank mediates the relationships between upper echelon affiliations and IPO success
due to the broker role that the lead underwriter plays in the IPO process, we do not expect this to
be a strong form of mediation. We expect that upper echelon affiliations will have a direct effect
on IPO success before considering the prestige of the lead underwriter and that, after considering
investment bank prestige, these effects should weaken, yielding the following predictions:
Hypothesis 5a: The greater the number of upper echelon affiliations with prominent downstream, horizontal, and upstream organizations, the more successful the firm’s IPO. Hypothesis 5b: The prestige of the firm’s investment bank will partially mediate the relationship between the number of upper echelon affiliations with prominent organizations and indicators of IPO success.
METHOD
Sample and Data Collection
Our sample frame includes U.S. biotechnology firms that were founded between 1961
and 1994. Of these 838 firms, 296 went public between 1979 and 1996. Approximately 86% of
the public firms specialized in the development of therapeutics and/or human diagnostics; the

16
majority of the remaining firms specialized in agriculture and/or other biological products,
generally with the explicit intention of engaging in therapeutic applications in the future. The
average time to IPO in our dataset was 4.87 years.
We compiled our data from both published and unpublished sources, striving to be as
thorough as possible, yet focused on true, dedicated biotechnology firms. Our primary list of
public biotechnology firms was obtained from the BioWorld Stock Report for Public
Biotechnology Companies in 1996 (n = 281). Unlike other sources (e.g., BioScan), this listing
does not include large corporations (e.g., General Electric) that participate tangentially in the
biotechnology industry; hence, ours is a narrower definition of biotechnology than that employed
by other researchers (e.g., Barley, Freeman, and Hybels 1992) and is in line with more recent
research on the industry (e.g., Powell, Koput, and Smith-Doerr 1996; Stuart, Hoang, and Hybels
1999). Further, to guard against sample selection bias associated with this listing, we collected
information on firms that went public in the same time frame as our sample but that did not
survive in their original form by 1996. To do this, we obtained information from organizations
that specialize in conducting research on the biotechnology industry, including BIO, the North
Carolina Center for Biotechnology Information, Recombinant Capital (ReCap), and the Institute
for Biotechnology Information. We also compared three editions of Biotechnology Guide USA
(Dibner 1988, 1991, 1995). From these sources, we identified an additional 15 dedicated U.S.
biotechnology firms that went public but were not in existence in their original form in 1996.
Such firms had experienced name changes, merged, or had been acquired. These firms were
founded in the same time period and all had gone public by the end of 1996.
We also collected information on biotechnology firms that were founded in the same time
period as our sample but that did not go public by 1996 (n = 542) from the 1998 edition of the

17
Institute for Biotechnology Information (IBI) database. We added to this list private
biotechnology companies that were listed as “dead,” merged, or acquired in the first three
editions of the Biotechnology Guide USA (Dibner 1988, 1991, 1995) and that had a founding
date in the same time period as our core sample. Combining these private firms with our sample
of firms that did go public yielded a final combined sample size of 838 firms.
Our main variables of interest were drawn from the career histories of the over 3200
managing officers and directors that comprise the upper echelons of the 296 firms in our core
sample. Information on these individuals and their firms was manually obtained from the firms’
final prospectuses. The upper echelon was defined as the directors and managing officers listed
in the final prospectus. In filing with the SEC, firms are required to list the last five years of
experience of the firm’s managing officers and board members; additional information (e.g.,
educational background) may be listed but is not required by the SEC. We consulted additional
sources such as Dun and Bradstreet for cross-verification.
Finally, we conducted field and ethnographic analysis at 14 biotechnology firms in the
U.S., two investment banks, one venture capital firm, and one of the Big 6 audit firms. The
individuals to whom we spoke at the service organizations were all intimately involved in
various IPO deals in the biotechnology industry during the period of our study and provided
extremely helpful information to us about the complexities involved in taking a firm public.
Among the biotechnology firms, we completed 12 formal interviews, ranging in length from 1.5
to 4.5 hours each. Five of those interviewed were in business-related positions (chief executive
officer, chief financial officer or chair of the board), while the other seven were in senior
research positions. We gathered career history information through semi-structured interviews
for all of the individuals in the biotechnology firms, as well as information on their roles in their

18
firms and in the IPO process. In addition, we solicited ongoing input from one expert informant
who has worked at two different biotechnology firms, one large and one small, and who was
centrally involved in two IPO deals.
Dependent Measures
Prestige of investment bank. Investment bank prestige was measured using an index
developed by Carter and Manaster (1990) and then updated by Carter, Dark, and Singh (1998).
The measures are based on analyses of investment banks’ positions in the tombstone
announcements for IPOs and have been cited widely in both finance and organizational research
(e.g., Bae, Klein, and Bowyer 1999; Podolny 1994; Rau 2000; Stuart, Hoang, and Hybels 1999);
this information was available for all but 25 of the underwriters in our dataset (accounting for 55
of our firms). Scores may assume a value ranging from 0, indicating lowest prestige, to 9,
indicating highest prestige. In our data set, the mean score was 7.63. Carter and Dark’s (1992)
analyses suggest that these measures provide a finer-grained evaluation than a simpler market
share alternative (e.g., Megginson and Weiss 1991). We obtained the name of the lead
investment bank from the front page of the final prospectuses.
IPO success measures. We used three indicators of IPO success, both financial and
nonfinancial indicators, to provide a comprehensive test of IPO success. The indicators we used
reflect the immediate or short-run success of the IPO; we did not consider longer-run measures.
(a) Net proceeds that a firm obtains as a result of the offering is one important indicator
of IPO success. This is the amount of cash the firm receives as a result of the offering, less costs
incurred during the IPO process. This information was on the first page of the prospectuses.
(b) Number of institutional investors captures the quantity and type of investors that the
firm attracts during the IPO process. Upper echelons with prominent organizational affiliations
19
should be more likely to obtain endorsements from key members of the investment community,
including not only prestigious investment banks but also quality investors. For firms,
institutional investors are preferable to retail investors, since, unlike high net-worth individuals,
they tend not to churn the stock of a young firm. Their goals also tend to be more aligned with
those of young firms, and thus are better positioned to help firms build long-term earning power
(Porter 1992). Therefore, the extent to which a firm is endorsed by institutional investors may
also be an indicator of IPO success.
We obtained information on the institutional investors who endorsed our firms from
CDA/Spectrum Institutional Ownership Database from Thomson Financial Publishing. The SEC
requires institutions to reveal all of their stock holdings by filing 13-F forms. The Spectrum
database “reverse”-compiles these on a quarterly basis, so that information may be obtained for
companies invested in, rather than the company doing the investing. For our study, we looked at
listings for our biotech companies for the first report after the IPO date. From Spectrum, we
were able to determine every institutional investor at that time and the percentage of available
shares that each of those investors held. Using these data, we first determined the number of
institutional investors that invested in the firm.
(c) Number of “dedicated” institutional investors was a third way we calibrated IPO
success. Research by Bushee and Noe (2000) has shown that institutional investors may be
classified into three different categories based on the rate at which they turn over their portfolios
and the extent to which the blocks of shares they purchase are diversified. The most savvy or
relationship-oriented investors, what Bushee (1998) termed “dedicated” investors, tend to have
low portfolio turnover and low diversification strategies. Compared with other more “transient”
institutional investors, dedicated institutional investors are most likely to be focused and
20
interested in the company’s longer-term growth prospects and so, most likely to have the young
firm’s interests at heart (cf. Porter 1992). We used Bushee’s coding scheme, which classified
institutional investors by year to categorize our institutional investors. We then calculated the
number of dedicated institutional investors that invested in each of our firms.
Independent Measures
Upper echelon affiliations. The affiliations of the upper echelon were assessed by
identifying and manually coding the last five years of their employment and board memberships,
as listed in the firms’ final prospectuses. We assessed the number of ties each individual had to
prominent upstream, horizontal, and downstream organizations. We created indices of
organizational prominence for each of our three categories, only looking at ties linking
individuals with prominent organizations. Since the number of ties covaries with the size of the
upper echelon, we divided upstream, horizontal, and downstream tie measures by upper echelon
size, consistent with recent research (Geletkanycz and Hambrick 1997).1
To gauge whether particular downstream and horizontal affiliations were with prominent
institutions or not, we used the amount of domain-specific firm revenues as a proxy for
prominence. To gauge whether upstream affiliations were with prominent organizations, we
employed external evaluations of the research institutions.2
For upper echelon upstream affiliations, we assessed the number of prominent research-
based affiliations of members of a firm’s upper echelon through board seats or employment (e.g.,
professorship). Seven editions of the Gourman Report (Gourman 1980, 1983, 1985, 1987, 1989,
1993, 1996) were used to compile the list of prominent research institutions. We coded any
academic institution that appeared on the top 10 in any of the following disciplines as prominent:
microbiology/bacteriology, biochemistry, biomedical engineering/bioengineering, molecular

21
biology, cellular biology, chemistry, and medicine. A total of 21 academic institutions were thus
coded as prominent. National government institutions such as the NIH were added to
this list, as were non-university research institutions that received a high ratio of grant money per
employee (e.g., the Salk Institute) (n = 9). The upper echelons in our sample generally had two
people with at least one tie to a prominent research institution. Amount of upper echelon
upstream affiliations was measured as the total number of upper echelon affiliations with
prominent research organizations, as defined above.
For upper echelon horizontal affiliations, we assessed the number of affiliations that
members of a firm’s upper echelon had to prominent biotechnology firms through employment
and/or board memberships. We generated the list of prominent biotechnology companies by
taking the list of worldwide revenues for the top 30 biotechnology companies in each of the
years 1990-1996, from POV Inc., “Biotechnology’s Top 50 in Pharmaceuticals and Diagnostics:
A Competitive Analysis” (1997). We coded a biotechnology company as prominent if it
appeared anywhere on this top-30 listing at any time from 1990 through 1996.3 A total of 38
companies were coded as prominent biotechnology firms; therefore, this was a relatively stable
list. The firms in our sample generally had one or two people with an affiliation to a prominent
biotechnology company. The amount of horizontal affiliations was measured as the total number
of upper echelon affiliations with prominent biotechnology organizations, as defined above.
For upper echelon downstream affiliations, we assessed the number of affiliations that
upper echelon members had to prominent pharmaceutical and/or healthcare institutions through
prior employment and/or board memberships. To determine which institutions were prominent,
we generated a list of the top pharmaceutical and healthcare organizations by sales since 1979,
using COMPUSTAT. International companies are only ranked by COMPUSTAT from 1988 on,

22
so our rankings are based on the top 30 U.S. organizations from 1979 to 1987 and from the top
30 U.S. and international organizations from 1988 to 1996. We coded any organization that
appeared on these lists at least once during the 1979-1996 period as prominent. We
supplemented our list with major pharmaceutical and healthcare companies that were private or
based in Europe or Japan that were not listed in COMPUSTAT but were listed in
PharmaBusiness and had comparable sales, since many young biotechnology firms rely on
international resources for support and talent. A total of 56 pharmaceutical/healthcare
companies were thus coded as prominent. The firms in our sample had between two and three
team members with at least one tie to a prominent pharmaceutical or healthcare institution. The
amount of upper echelon downstream affiliations was measured as the total number of
affiliations with prominent pharmaceutical and/or healthcare organizations, as defined above.
We measured range of upper echelon affiliations two ways. First, we used a variation of
the Herfindahl-Hirschman index,
3 H = 1 - ∑ pi
2 (1) i=1
in which H is the measure of heterogeneity or range and p is the percentage of individuals who
have ties to prominent institutions in each of our three categories. This variable was set to equal
zero when the upper echelon had no relevant affiliations. This measure is equivalent to Blau’s
(1977) index of heterogeneity. Second, we measured range as the count, 0 to 3, of the number of
affiliation categories covered. For example, a firm with an upper echelon with 10 members, two
of whom had ties to prominent pharmaceutical organizations, would receive a score of 1, while a
firm with the same-sized upper echelon that included one member who sat on the board of a
prominent biotechnology company’s board and another member who worked for a prominent
pharmaceutical company would receive a score of 2.

23
Control variables. We included several control variables in our analyses to ensure the
robustness of our claims. First, we controlled for uncertainty associated with the stock market
for biotechnology companies at the time our firms went public. We employed a financial index
developed by Lerner (1994) and cited extensively in research in the industry (e.g., Baum,
Calabrese, and Silverman 2000; Stuart, Hoang, and Hybels 1999; Zucker, Darby, and Brewer
1994), that gauges the receptivity of the equity markets to biotechnology offerings. Lerner’s
(1994) index was constructed based on an equal amount of dollar shares of 13 publicly traded,
dedicated biotechnology firms. The findings of Lerner’s study suggest that an industry-specific
index is the preferred method of capturing the favorability of the equity markets, as times of high
valuations vary across industries and not always in complete conjunction the general market.
We used the value of Lerner’s equity index at the end of the month prior to the IPO date for each
of our firms as our indicator of industry uncertainty at the time of the IPO.
In addition, we controlled for technological uncertainty associated with the product stage
of the firm’s lead product at the time of the IPO. We reviewed the company sections of the
prospectuses to determine how advanced the firm’s technology was (Pisano 1991; Pisano and
Mang 1993). We coded the product that was at the latest stage into one of the following nine
categories: discovery stage, research and development, pre-clinical indication, phases I through
III clinical trials, new drug approval (NDA) filing/FDA approval pending, final market approval,
and revenue-generating, relatively speaking. We also examined the use-of-proceeds section of
the prospectus to confirm that the lead product, as defined above, was also that which was
designated to receive the most significant funding. We then used this coding to create a nine-
point categorical variable for product stage, such that those with lower numbers (i.e., earlier
stages of development) were accorded higher uncertainty, while those that had higher numbers

24
(i.e., later stages of development) were accorded lower uncertainty.
We also included controls for firm size and firm age, consistent with prior research on
entrepreneurial firms and studies of IPOs. And, while not a direct indication of the size of the
firm, the amount of private financing the firm received prior to the IPO does provide a reliable
measure of the success the firm has had in the past in securing financial capital and so, is an
indicator of the firm’s potential for growth as well. Our measure of private financing was
calculated by adding up the rounds of financing listed in the final prospectuses. This measure
was adjusted to constant 1996 dollars and logged in our analyses.
We also coded our firms for their geographical location. Young firms located in areas
that are rich with industry-related activity will likely have greater access to resources, including
qualified personnel, suitable lab space, and technology, that can give them an advantage
(Saxenian 1994). Given the research and technology centers of the United States, locational
advantage is likely to accrue to firms that choose to operate in central areas like San Francisco
where the concentration of biotechnology firms is high (Deeds, DeCarolis, and Coombs 1997).
A dummy variable for location took a value of 1 if the main offices of a young biotechnology
company were located in one of the following areas that were consistently rated among the top
four biotechnology locations for the period of our study (Burrill and Lee 1990, 1993; Lee and
Burrill 1995): San Francisco, Boston, or San Diego. Location took a value of 0 otherwise.
In addition, we controlled for the total number of alliances a firm has with business
and/or research organizations at the time of the IPO, since prior research has demonstrated that
strategic alliances have important implications for organizational outcomes. And, given prior
research on the important role of venture capitalists during initial public offerings (e.g., Gompers
et al. 1998), we included a control for the prominence of venture capital firms at the time of the

25
IPO. Firms were coded as 1 if any of the biotechnology firm’s venture capital firms (with a
minimum of a 5% stake) were listed as among the top 20 venture capital firms in the period of
our study and 0 otherwise. Our list of prominent venture capital firms was based on information
compiled by Venture Economics, a company that has tracked the venture capital industry since
the 1960s; rankings are based on total dollars raised each year for the venture funds.
We also included four variables that account for characteristics assessed in upper
echelons research. First, we included a variable for the average prior position level that reflects
the caliber of the prior jobs the executives held. We created a 0 to 5 ranking, ranging from low
to high, beginning with nonmanagement positions and ending with CEO/president, similar to that
employed by Eisenhardt and Schoonhoven (1996) and then calculated the mean level of prior
position for each upper echelon in our dataset. Second, we controlled for the average age of the
executives and directors, which may be considered indicators of the amount and breadth of
experience of the upper echelon. Additionally, we assessed the amount of dispersion of upper
echelon members’ characteristics. We included a variable for the diversity of the tenure with the
firm among upper echelon members. Consistent with prior research, we used the coefficient of
variation for the demographic variable of tenure in the group (Bantel and Jackson 1989; Allison
1978). And, we included a variable for the functional heterogeneity of the upper echelon
members. We coded the previous functional positions of all of the top managers and directors in
our dataset, based on an extension of the coding scheme used by Hambrick, Cho, and Chen
(1996) that also included categories associated with younger research-based firms: chief
scientific officer, founder, researcher, lab manager, and professor. Consistent with prior
research, we used a variation of the Herfindal-Hirschman index,
22 H = 1 - ∑ pi
2 (2) i=1

26
in which H is the measure of heterogeneity or range and p is the percentage of individuals who
have held positions in each of 22 functional categories.
Finally, we included a variable that accounts for the type of business the biotechnology
company was in. Biotechnology is a fairly segmented industry. The applications of its products
range from tissue repair in humans to agricultural products. From the main company description
in the prospectuses, firms were coded as being in therapeutics, diagnostics, both diagnostics or
therapeutics, agriculture, chemical, or other. To verify the firm’s business, we referred to the IBI
database and BioScan. For the private companies, we had information on up to 30 such
categories. For this business type variable, we coded whether the company was in a core
biotechnology field, i.e., therapeutics or therapeutics and diagnostics, or not.
Analysis
There are four dependent variables for this study—prestige of investment bank and three
measures of IPO success. For each set of analyses, we used Heckman selection models to guard
against the possibility of sample selection bias (Heckman 1979). In general, sample selection
can arise when the criteria for selecting observations are not independent of the outcome
variables. As an example, studies of earnings and status achievement of women can run the risk
of sample selection bias if they do not account for factors that affect women’s participation in the
workforce. To correct for potential bias in such studies, sample selection models can be run that
account for women’s entry into the labor market and for the market rewards that they receive (for
a review, see Winship and Mare 1992). Here, since we are studying factors that influence the
prestige of the investment banks that underwrite the firms’ security offerings and IPO success,
both of which only occur when a firm goes public, we want to guard against the possibility that
there is some other factor, in addition to those we study, that accounts for the likelihood of firms

27
being able to go public in the first instance.
Heckman’s procedure generates consistent, asymptotically efficient estimates that can
enable us to generalize to the larger population of biotechnology firms (cf. Heckman 1979). In
essence, the Heckman model is a two-stage procedure that uses the larger risk set of public and
private firms, including firms that ceased to exist as of 1996 in both categories (n = 838). Probit
regression was used to estimate the likelihood of completing an IPO during the first stage, and
estimates of parameters from that model were then incorporated into a second-stage regression
model to predict prestige of investment bank and, in subsequent analyses, IPO success (Van de
Ven and van Praag 1981). For the first stage models, we used the information we had available
for our public and private firms—geographical location, year of founding, and type of
business—to predict likelihood of going public. In the second stage, though the sample includes
all 838 firms, the standard errors reported reflect the smaller sample of firms (n = 296).
To account for the fact that we had net proceeds information that spanned two decades,
we transformed our net proceeds estimates into constant 1996 dollars and logged the estimates
for our firms. And, in order to account for the time-varying market conditions firms faced when
trying to go public, we included the equity index variable described earlier in all of our analyses.
The numbers we used were calibrated not just by the year but also by the month preceding the
offering, which produces fairly fine-grained estimates.
Table 1 summarizes the main variables we test in our analyses and their predicted effects.
**** Insert Table 1 about here ****
RESULTS
Correlations between our main variables of interest are provided in Table 2. This table
shows that the relationships between our key variables of interest are in the directions predicted.

28
The tables that follow, Tables 3 and 4a-4c present our findings for the effects of upper echelon
affiliations with prominent upstream, horizontal, and downstream organizations on the prestige
of the firm’s lead investment bank (Table 3) and for IPO success (Tables 4a-4c). In each table,
the results are presented in a similar fashion: we begin with Heckman selection models that
include the firm and industry-level control variables, traditional upper echelon variables, and
then we include our core measures of upper echelon affiliations. In analyses predicting IPO
success, we test as well for the mediating effects of investment bank prestige (Baron and Kenny
1986). We begin with our analyses predicting investment bank prestige, as shown in Table 3.
**** Insert Tables 2 and 3 about here **** Model 1 in Table 3 includes the control variables associated with the firm and the
industry. As expected, the prominence of the firm’s venture capital firms and the amount of
private financing raised were positively and significantly related to the prestige of the young
company’s lead investment bank at the time of the IPO. Both of these factors remained
significant across all of the models predicting investment bank prestige. Model 2 includes upper
echelon variables that have been investigated in prior research. Here we find that the average
prior position level of the upper echelon members and firm size are positively related to
investment bank prestige.
Hypothesis 1 predicted that upper echelon affiliations with prominent upstream
organizations would be positively related to the prestige of the firm’s lead investment bank. As
shown in model 3, we did not find support for hypothesis 1. However, hypothesis 2, that upper
echelon affiliations with prominent horizontal organizations would be positively related to
investment bank prestige, was supported, as shown in models 4 and 5. Moreover, we found
support for hypothesis 3 with respect to downstream affiliations, as shown in model 5: the

29
greater the upper echelon members’ ties to prominent pharmaceutical and/or healthcare
organizations, the greater the prestige of the firm’s lead investment bank. We also found
substantial support for hypothesis 4, as shown in model 6 of Table 3: the range of upper echelon
affiliations had a significant and positive effect on investment bank prestige. Since range was
constructed from the three forms of upper echelon affiliations, it is informative to present the
results for range apart from the proportion of variance explained by our three types of upper
echelon affiliations. Our heterogeneity measure of range was correlated > .90 with our count
measure of range; the latter, count measure is reported in our tables. The final model does
include all upper echelon affiliation variables and shows a significant effect for both downstream
affiliations and range of affiliations on investment bank prestige. We expect that the loss of the
effect for horizontal affiliations in this final model is due to the significant correlation between
range and the other affiliation variables from which range was constructed.
**** Insert Tables 4a through 4c about here ****
Table 4a shows the effects of upper echelon affiliations and investment bank prestige on
the first of the three measures of IPO success, net proceeds to the firm. As expected, the
affiliations of the upper echelon were significantly related to the firm’s proceeds from the
offering. Models 3 and 4 of Table 4a support hypothesis 5a by demonstrating direct effects for
the upper echelon’s downstream affiliations and for the range of the upper echelon’s affiliations
on the firm’s net proceeds. These effects for upper echelon downstream affiliations and range of
affiliations remained significant even after we accounted for the prestige of the investment bank,
as shown in models 6 and 7. In addition, we note that upper echelon upstream affiliations was
significant in model 6. These results provide support for hypothesis 5a.
To test for partial mediation, we followed procedures outlined in Baron and Kenny

30
(1986) and Sobel (1982). The results, as presented in Table 4a, suggest evidence of mediation
since (a) downstream and range of upper echelon affiliations were positively associated with
investment bank prestige and with net proceeds, (b) investment bank prestige was positively
associated with net proceeds, and (c) when the investment bank prestige variable was entered
into the analyses along with downstream or range of affiliations, these effects on net proceeds
decreased both in magnitude and in significance level. Further, we tested the significance of the
indirect effects of the independent variables on the dependent variable via the mediator, as
outlined in Baron and Kenny (1986). Specifically, for each upper echelon affiliation variable,
we calculated the regression coefficient corresponding to the mediated path, which is the product
of the coefficient from the first stage regression (predicting investment bank prestige) and the
coefficient from the full second stage regression (predicting net proceeds, with all the other
variables in the model). The standard error for this combined coefficient is calculated using
Sobel’s (1982) formula. Both with respect to upper echelon downstream affiliations and range
of affiliations, we did find corresponding p-values < .05, (for range, p = .01; for downstream
affiliations, p < .01), suggesting that investment bank prestige did partially mediate the
relationships between upper echelon affiliations and IPO success, as hypothesis 5b predicted.
Table 4b shows the results for the effects of upper echelon affiliations on a nonfinancial
indicator of IPO success—the number of institutional investors that endorsed the young firm.
These results also support hypothesis 5a: upper echelon downstream affiliations had a
significant and positive effect on IPO success. We also found that the effect for downstream
affiliations weakened once we included the prestige of the firm’s lead investment bank,
suggesting that investment bank prestige may partially mediate the effects observed. To confirm
the finding of partial mediation, we used the same procedure as before; here, we tested the

31
significance of the indirect effect of IPO downstream affiliations on the dependent variable,
number of institutional investors, via investment bank prestige, the proposed mediator. Again,
we found evidence of partial mediation (p < .05), lending support to hypothesis 5b.
Table 4c presents our results with respect to the effects of upper echelon affiliations on
IPO success, gauged by investment in the firm by dedicated institutional investors. Once again,
we found that the greater the number of downstream (i.e., pharmaceutical/healthcare affiliations)
the upper echelon had, the greater the success of the IPO as indexed by the number of dedicated
institutional investors who invested in the firm. These results also support hypothesis 5a. We
found additional support for the effect of upper echelon range on the extent of endorsement by
dedicated institutional investors, but, as was the case in the prior series of analyses, we found no
effects for upstream and horizontal affiliations on IPO success. When we added investment bank
prestige to our models (models 6 and 7), the effect for downstream upper echelon affiliations on
the number of dedicated institutional investors disappeared but the significance level of the effect
for the range of upper echelon affiliations remained the same. Further analyses, using Sobel’s
(1982) formula to test for partial mediation, suggested that while the effect of upper echelon
downstream ties disappeared in model 6 of Table 4c, the drop in magnitude of the coefficient
was not sufficient enough to suggest full mediation. Rather, we found additional support for
hypothesis 5b – here, that investment bank prestige partially mediates the relationship between
upper echelon downstream affiliations and the number of dedicated institutional investors that
invested in the firm at the time IPO (p < .05).
Looking across Tables 4a through 4c, there are some interesting patterns with respect to
our control variables as well. First, in all of the analyses, the prominence of the firm’s venture
capital firms had a significant and positive impact on IPO success. Second, in all but three
32
models across all of our sets of analyses, the amount of private financing the firm received prior
to the offering had a significant and positive impact on IPO success. And in most instances, our
results suggest that larger firms tend to have more successful IPOs. We also found evidence to
suggest that older firms in this industry have more successful initial public offerings than
younger firms, consistent with prior research, although the prestige of the investment bank seems
to account for most of this variance.
Additional Analyses
We conducted two sets of additional analyses. First, since our claims centered on the
signaling value of upper echelon affiliations, we tested whether our effects were especially
strong during times of high uncertainty. In particular, we tested whether having ties to
prominent organizations was especially valuable to a firm when its lead product was in early
stages of development. Results revealed significant and negative interaction effects between
product stage and upper echelon horizontal and downstream affiliations suggesting that upper
echelon horizontal affiliations are particularly helpful to young firms in securing the backing of a
prestigious investment bank when the firm’s lead product is in early stages of development.
Further, upper echelon downstream affiliations have a particularly beneficial effect on IPO
success when the firm’s lead product is in early stages. The latter results held for two of our
three measures of IPO success (number of institutional investors and number of dedicated
institutional investors) and remained significant and in the direction expected, even after we
accounted for the prestige of the firm’s lead investment bank.
Second, we investigated the effects of the sum of downstream, horizontal, and upstream
affiliations for the entire upper echelon versus for just the core members of the upper echelon
who tend to be most engaged in the IPO process (the chief executive officer (CEO), head of

33
finance (e.g., chief financial officer), and the head of research (e.g., chief scientific officer or
equivalent)). We found that the sum of our three types of prominent affiliations across the entire
upper echelon was significantly and positively associated with the prestige of the firm’s lead
investment bank and with all of our measures of IPO success. With respect to the core team,
however, we found different results. Including a variable for the sum of core upper echelon
affiliations across our three categories did not have a significant effect on IPO success. Thus, we
found evidence to suggest that it is the affiliations of the entire team, rather than that of a few key
members of the upper echelon, that account for the effects of upper echelon affiliations on firm-
level outcomes.
DISCUSSION AND CONCLUSIONS
The present study shows that the proclivity of firms to enter partnerships with prestigious
intermediaries and to garner the support of investors is influenced by the amount and kind of
career-based affiliations associated with the firm’s upper echelon at the time of its IPO. An
upper echelon’s affiliations with prominent organizations differentially affect a young
company’s ability to secure the endorsement of prestigious others. In particular, the greater the
number of the upper echelon’s horizontal affiliations with prominent biotechnology
organizations and the greater the number of the upper echelon’s downstream affiliations with
prominent pharmaceutical and/or healthcare organizations, the greater the prestige of the firm’s
lead investment bank. In addition, the greater the range of upper echelon affiliations across these
three categories, the greater the prestige of the firm’s investment bank. These results suggest
that important intermediaries such as investment banks look beyond objective measures such as
firm size, age, or product stage, to the career histories of those leading the firm, for indicators of
firm quality when deciding whether to endorse them.

34
In most cases, we did not find evidence to suggest that upper echelon upstream
affiliations affect interorganizational endorsement or IPO success. One possible explanation is
that investment bankers look at alternative information to assess whether a firm’s science is
sound. Alternatively, a firm’s scientific-based affiliations may be underrepresented in the firm’s
final prospectus, limiting the extent to which we were able to capture signals of technological
quality associated with a firm’s affiliations with upstream organizations in the present study.
Our analyses predicting IPO success suggest that investors attend to multiple types of
affiliations—to upper echelon affiliations with prominent institutions and to the prestige of the
lead investment bank with which the firm is tied. As a contribution to the growing body of
organizational research on IPOs, we tested our hypotheses with a comprehensive set of indicators
of IPO success. We found significant and positive effects for downstream affiliations for all of
our measures and, in subsequent analyses, for the sum of downstream, horizontal, and upstream
affiliations of the upper echelon as well. Further, our additional analyses on the contingent value
of upper echelon affiliations demonstrates that under conditions of uncertainty, when the firm’s
lead product is in early stages of development, upper echelon affiliations are especially valuable
to a young firm’s ability to secure organizational endorsements and to have a successful IPO.
These analyses lend support to the signaling claims set forth in the present study.
When the prestige of the firm’s lead investment bank was accounted for in our main
analyses predicting IPO success, some interesting results emerged. We expected to find that
investment bank prestige partially mediates the relationships between upper echelon affiliations
and IPO success—for example, that the positive effects for upper echelon downstream
affiliations with prominent pharmaceutical and/or healthcare companies on IPO success would
weaken after we included investment bank prestige in our analyses. We found consistent

35
evidence that investment bank prestige does partially mediate the relationships between upper
echelon downstream affiliations and IPO success. Interestingly, however, this was not always
the case for the other types of upper echelon affiliations. We found that the range of upper
echelon affiliations remained significant throughout our analyses predicting number of dedicated
institutional investors, suggesting that the ultimate investors in a young firm attend directly to
signals of firm quality, particularly when such investors are focused and “dedicated” in their
decision-making. In such instances, the range of affiliations of a firm’s upper echelon may
project a simple story that signals the young firm’s potential, affecting valuable second-order
endorsements of a start-up firm.
The results for the other independent variables included in our analyses yielded additional
insights. Looking across the OLS regression and sample selection model results for prestige of
investment bank, we found consistent evidence that the prominence of venture capital
organizations was associated with the prestige of the firm’s investment bank and some
suggestive evidence for the number of strategic alliances a firm had as well. These results are
consistent with the view that external parties look to the involvement of other firms when
gauging whether to join up with a young firm. The present research supports the idea that the
firm’s affiliations with prior organizations affects subsequent alliance formation (Kogut, Shan,
and Walker 1992; Gulati and Gargiulo 1999; Powell, Koput, and Smith-Doerr 1996) and extends
prior research by considering the affiliations made available to firms through the preexisting ties
of its upper echelon members.
The present study contributes to research on interorganizational relationships in several
respects. First, it highlights the important role that intermediaries play in the life of a young
firm. In general, the role of third parties in helping a firm obtain much-needed resources from its

36
environment has been underexamined (for a recent exception, see Zuckerman 1999). More
specifically, the origins of organizational endorsements have been overlooked. Our results
suggest that the backgrounds of those who lead and manage a young firm send powerful signals
to external parties that affects the endorsement process. In mediated markets such as the IPO,
organizations have limited prior interaction patterns with one another. In such contexts, a wide
variety of indicators of firm quality—including those that derive from a firm’s connections
through its upper echelon members—can provide important cues that may facilitate
organizational endorsement.
Future research could examine more fully the array of factors that motivate an
intermediary’s decision to endorse a young firm. Comparative research may support our
contention that intermediaries have different motivations and interests than do those in other
types of arrangements such as strategic alliances. The joining up process with a prestigious
investment bank generally reflects a process of endorsement rather than a process of selection on
the part of the focal firm. Moreover, the investment bank assumes relatively little long-term
financial risk compared with, for example, an alliance partner in a joint venture. Finally,
intermediaries serve as brokers between investors and the firms they endorse; they are boundary
spanners that enable a firm to obtain resources. The triadic nature of the process by which firms
and their top executives secure resources in their environments is worthy of future research.
Second, our research adds to the significant stream of research on prominence (e.g.,
Benjamin and Podolny 1999; Podolny 1993; Stuart, Hoang, and Hybels 1999). Such research
builds directly from the principal of the Matthew effect, which refers to the tendency for credit or
benefits to accrue to those have already obtained success: as Merton (1973) argued in his study
of elite scientists, prestige tends to beget prestige. The typology we employ in the present study

37
introduces sharp distinctions between organizational affiliations, enabling a richer understanding
of the conditions under which transfers of status—here, from prominent upper echelon
affiliations to prestigious investment bank affiliations—are likely to occur. And by focusing on
one particular industry and on one critical resource allocation event in the life of a young firm,
the IPO, we are able to take an in-depth look at the specific aspects of firm quality that are likely
signaled by an upper echelon’s affiliations with prominent firms.
Additionally, the present study is distinctive in that the interfirm relationships we focused
on were assessed at the individual (career history) level, at the upper echelon level, and at the
firm level with regard to the firm’s affiliation with its investment bank and institutional
investors. Seldom has empirical research addressed either how individual-level affiliations can
affect the formation of firm-level affiliations or how group-level ties embedded in members’
employment and board memberships affect the formation of interorganizational ties. Our
findings have implications for research that links micro-level ties to more macro-level
interorganizational ties (Coleman 1990) and to the growth of young firms (Burton, Sørensen, and
Beckman 1998). Our additional analyses investigating the effects of the ties of those with
specific roles on the upper echelon enabled us to specify further the level of analyses that
accounted for the effects observed.
More broadly, the present research extends the embeddedness perspective proposed by
organizational scholars studying the consequences of interorganizational relationships (e.g., Uzzi
1999). Our findings show that a young firm is embedded in a variety of interorganizational
networks, including those that derive from business partnerships, such as strategic alliances, as
well as those that derive from upper echelon members’ employment and board relationships.
The present research shows that these different levels and types of affiliations complement one

38
another, affecting the perceived quality of a young firm in the eyes of the financial community.
Thus, we address the need for research on how social relationships affect which firms get capital
and at what cost (Arrow 1998; Granovetter 1985; Petersen and Rajan 1994).
Although we used the typology here to assess the effects of the upper echelon’s career
histories, it could be used to examine effects at the interfirm level, as indexed by the type and
number of strategic alliances the firm has at the time of the IPO. While firms clearly engage in
different types of alliances, very little empirical research has examined the multiplicity of such
partnerships. Future research could investigate the effects of upstream, horizontal, and
downstream alliances on the prestige of the firm’s lead investment bank and on IPO success. It
is possible that upstream alliance-based affiliations—that is, alliances with major research
institutions—could send a negative signal, since such affiliations could imply that the firm’s
products are in the basic research stage of development (cf. Baum, Calabrese, and Silverman
2000), but upper echelon upstream affiliations yielded no such negative effect. Additionally, one
could examine how preexisting ties resulting from the upper echelon’s career histories affect the
formation of different types of interfirm alliances in the first instance. It may be that individuals’
prior ties facilitate the formation of specific types of firm alliances which, in turn, affect the
endorsement of key external parties, such as venture capitalists.
Finally, it is worth noting that the qualitative and quantitative findings of this research
reached remarkable convergence. During the acquaintanceship stage between a young firm and
an investment bank, the firm faces uncertainty on a host of fronts. During such times, important
outsiders such as investment bankers and potential investors are likely to attend to signals of firm
quality other than purely objective indicators such as firm age, size, location, and product stage
when evaluating a young firm. Both our empirical work and our interviews revealed that the

39
backgrounds of a firm’s upper echelon are instrumental in convincing outsiders that a firm shows
promise and is thus worthy of endorsement. One VP of finance explained the importance of
having people with the right affiliations at different stages of the start-up process to create
perceptions of firm quality:
The external community has limited bases for assessment. It’s really about perceived quality; you don’t really know. There is no sure way to judge a young biotech[nology] firm. So, you judge the firm based upon the management team’s ability to bring in part of the puzzle. The idea was to get someone from a high-profile institution—an institution with some sort of intellectual property position to plan for development and then to go out and hire a small management team and raise some money! But finding the right people is tough. A lot of senior execs from major pharma[ceutical]s … help tell the story. I don’t know but I expect some showed up, helped the company go public but didn’t last long. It’s hard to go from managing a cast of thousands with a big salary to a small start-up—it’s a pretty good selection process, though. I guess it all goes to the mix of the team—finding the right balance.
Our findings do not suggest a specific formula for designing an upper echelon for a young firm.
They do, however, suggest that the type and amount of affiliations available to a young firm
during its IPO affect its ability to receive the endorsement of a prestigious third party and to
secure financial resources.

40
ENDNOTES
1 We also ran our analyses on board members and managing officers separately, but feel that
keeping the groups together makes the most conceptual sense in the context of signaling firm
quality to outsiders during the IPO (versus, for example, strategic decision-making). These
additional analyses revealed broadly consistent results with those reported here.
2 We investigated both the total number of ties each upper echelon had as well as the number of
individuals in an upper echelon who had ties to one or more prominent organizations in each of
our three categories. These measures were highly correlated (r > .90). Since the former provides
a better indication of the depth of an upper echelon’s affiliations with prominent organizations,
we used total number of upper echelon affiliations with prominent organizations in our analyses.
3 Similar rankings were not available for the biotechnology industry prior to 1990. In looking at
the employment affiliations in our data, we found that very few individuals had spent time at
more than one biotechnology company prior to 1990, due in large part to the youth of the
industry. Of those few individuals, the firms at which the overwhelming majority had spent time
were already classified as prominent by the rankings we used.

41
REFERENCES
Aldrich, H. E. 1999. Organizations Evolving. Sage, London.
Aldrich, H. E., J. Pfeffer. 1976. Environments of organizations. Annual Review of Sociology. 2
79-105.
Allison, P. D. 1978. Measures of inequality. American Sociological Review. 43 865-80.
Arrow, K. J. 1998. What has economics to say about racial discrimination. Journal of Economic
Perspectives. 12 91-100.
Bae, S.C., D. P. Klein, J. W. Bowyer. 1999. Determinants of underwriter participation in initial
public offerings of common stock: An empirical study. Journal of Business Finance and
Accounting. 26 595-618.
Bantel, K., S. E. Jackson. 1989. Top management and innovations in banking: Does the
composition of the top team make a difference? Strategic Management Journal. 10 107-
24.
Barley, S. R., J. F., R. C. Hybels. 1992. Strategic Alliances in Commercial Biotechnology. Pp.
311-47 in Networks and Organizations: Structure, Form and Action, edited by Nitin
Nohria and Robert G. Eccles. Harvard Business School Press, Boston, MA.
Baron, R. M., D. A. Kenny. 1986. The moderator-mediator variable distinction in social
psychological research: Conceptual, strategic, and statistical considerations. Journal of
Personality and Social Psychology. 51 1173-82.
Baum, J. A. C., T. Calabrese, B. S. Silverman. 2000. Don't go it alone: Alliance network
composition and startups' performance in Canadian biotechnology. Strategic
Management Journal. 21 267-94.
Baum, J. A. C., C. Oliver. 1992. Institutional embeddedness and the dynamics of organizational

42
populations. American Sociological Review. 57 540-559.
Benjamin, B.A., J. M. Podolny. 1999. Status, quality and social order in the California wine
industry. Administrative Science Quarterly. 44 563-89.
Berger, P. L., T. Luckman. 1966. The Social Construction of Reality. Doubleday, Garden City,
NY.
Blau, P. M. 1977. Inequality and Heterogeneity: A Primitive Theory of Social Structure. Free
Press, New York.
Bochner, S. E., G. M. Priest. 1993. Guide to the Initial Public Offering. 2nd ed. Merrill
Corporation, New York.
Burrill, G. S., K. Lee. 1990. Biotech 91: A Changing Environment. Ernst & Young, San
Francisco.
———. 1993. Biotech 94. Ernst & Young, San Francisco.
Burton, M. D., J. B. Sorenson, C. Beckman. 1998. Coming from good stock: Career histories and
new venture formation. Working paper, Harvard Business School, Cambridge, MA.
Bushee, B. J. 1998. The influence of institutional investors on myopic R&D investment
behavior. The Accounting Review.73 305-33.
Bushee, B. J., C. F. Noe. 2000. Corporate disclosure practices, institutional investors, and stock
return volatility. Journal of Accounting Research. 38 171-202.
Carter, R. B., F. H. Dark. 1992. An empirical examination of investment banking reputation
measures. The Financial Review. 27 355-74.
Carter, R. B., F. H. Dark, A. K. Singh. 1998. Underwriter reputation, initial returns and the long-
run performance of IPO stocks. The Journal of Finance. 53 285-311.
Carter, R. B., S. Manaster. 1990. Initial public offerings and underwriter reputation. The Journal

43
of Finance. 45 1045-67.
Cockburn, I. M., R. M. Henderson. 1998. Absorptive capacity, coauthoring behavior, and the
organization of research in a drug discovery. The Journal of Industrial Economics. 56
157-82.
Coleman, J. S. 1990. Foundations of Social Theory. Harvard University Press, Cambridge, MA.
Cyert, R. M., J. G. March. 1963. A Behavioral Theory of the Firm. Prentice-Hall, New York.
D'Aveni, R. 1990. Top managerial prestige and organizational bankruptcy. Organization
Science. 1 187-220.
Davis, G. 1991. Agents without principle? the spread of the poison pill through the
intercorporate network. Administrative Science Quarterly. 36 583-613.
DeCarolis, D. M., D. L. Deeds. 1999. The impact of stocks and flows of organizational
knowledge on firm performance: An empirical investigation of the biotechnology
industry. Strategic Management Journal. 20 953-68.
Deeds, D. L., D. DeCarolis, J. E. Coombs. 1997. The impact of firm-specific capabilities on the
amount of capital raised in an initial public offering: Evidence from the biotechnology
industry. Journal of Business Venturing. 12 31-46.
Dibner, M. D. 1988. Biotechnology Guide U.S.A. Stockton Press, New York.
———. 1991. Biotechnology Guide U.S.A. Stockton Press, New York.
———. 1995. Biotechnology Guide U.S.A. Stockton Press, New York.
———. 1999. Biotechnology Guide U.S.A. MacMillan, New York.
Eisenhardt, K. M., C. B. Schoonhoven. 1996. Resource-based view of strategic alliance
formation: Strategic and social effects in entrepreneurial firms. Organization Science. 7
136-50.

44
Finkelstein, S. 1992. Power in top management teams: Dimensions, measurement and validation.
Academy of Management Journal. 35 505-38.
Finkle, T. A. 1998. The relationship between boards of directors and initial public offerings in
the biotechnology industry. Entrepreneurship Theory and Practice. 22 5-29.
Geletkanycz, M. A., D. C. Hambrick. 1997. The external ties of top executives: Implications for
strategic choice and performance. Administrative Science Quarterly. 42 654-81.
Gompers, P. A., J. Lerner, M. M. Blair, T. Hellman. 1998. What drives venture capital
fundraising? Brookings Papers on Economic Activity. 149-204.
Gourman, J. 1980. The Gourman Report: A Rating of Graduate and Professional Programs in
American and International Universities. National Education Standards, Los Angeles.
———. 1983. The Gourman Report: A Rating of Graduate and Professional Programs in
American and International Universities. 2nd ed. National Education Standards, Los
Angeles.
———. 1985. The Gourman Report: A Rating of Graduate and Professional Programs in
American and International Universities. 3rd ed. National Education Standards, Los
Angeles.
———. 1987. The Gourman Report: A Rating of Graduate and Professional Programs in
American and International Universities. 4th ed. National Education Standards, Los
Angeles.
———. 1989. The Gourman Report: A Rating of Graduate and Professional Programs in
American and International Universities. 5th ed. National Education Standards, Los
Angeles.
———. 1993. The Gourman Report: A Rating of Graduate and Professional Programs in

45
American and International Universities. 6th ed. National Education Standards, Los
Angeles.
———. 1996. The Gourman Report: A Rating of Graduate and Professional Programs in
American and International Universities. 7th ed. National Education Standards, Los
Angeles.
Granovetter, M. 1985. Economic action and social structure: The problem of embeddedness.
American Journal of Sociology. 91 481-510.
Gulati, R., M. Gargiulo. 1999. Where do interorganizational networks come from? American
Journal of Sociology. 104 1439-93.
Hambrick, D. C., T. S. Cho, M. Chen. 1996. The influence of top management team
hetereogeneity on firms' competitive moves. Administrative Science Quarterly. 41 659-
84.
Hambrick, D. C., R. D'Aveni. 1992. Top team deterioration as part of the downward spiral of
large corporate failures. Management Science. 38 1445-66.
Hamilton, J. O. 1994. Biotech: An industry crowded with players faces an ugly reckoning.
Business Week (September 26) 84-92.
Heckman, J. J. 1979. Sample selection bias as a specification error. Econometrica. 45 153-61.
Jensen, M., E. J. Zajac. 2000. Corporate elites and corporate strategy: How demographic
preferences and structural position shape the scope of the firm. Working paper,
Northwestern University, Chicago, IL.
Kogut, B., W. Shan, G. Walker. 1992. The Make-or-Cooperate Decision in the Context of an
Industry Network. Pp. 348-65 in Networks and Organizations: Structure, Form and
Action, edited by Nitin Nohria and Robert G. Eccles. Harvard Business School Press,

46
Boston, MA.
Koput, K. W., W. W. Powell, L. Smith-Doerr. 1997.Interorganizational relations and elite
sponsorship: Mobilizing resources in biotechnology. Working paper, University of
Arizona, Tucson, AZ.
Laumann, E. O., J. Galaskiewicz, P. V. Marsden. 1978. Community structure as
interorganizational linkages. Annual Review of Sociology. 4 455-84.
Lee, K., G. S. Burrill. 1995. Biotech 96. Ernst and Young, Palo Alto, CA.
Lerner, J. 1994. Venture capitalists and the decision to go public. Journal of Financial
Economics. 35 293-316.
Lin, N., W. M. Ensel, J. C. Vaughn. 1981. Social resources and strength of ties: Structural factors
in occupational status attainment. American Sociological Review. 46 393-405.
March, J. G H. A. Simon. 1958. Organizations. Wiley, New York.
Mavrinac, S. 1999. Market development and the Matthew Effect: An analysis of reputation,
information collection and seasoning in IPO markets. Working paper, University of
Western Ontario, Windsor, Ontario.
Megginson, W. L., K. A. Weiss. 1991. Venture capitalist certification in initial public offerings.
Journal of Finance. 56 879-903.
Merton, R. K. 1973. The Sociology of Science. University of Chicago Press, Chicago, IL.
O'Reilly, C., R. Snyder, J. Boothe. 1993. Effects of executive team demography on
organizational change. Pp. 147-175 in Organizational Change and Redesign: Ideas and
Insights for Improving Performance, ed. by G. Huber and W Glick. Oxford University
Press, New York.
Palmer, D. A., X. Zhou, B. M. Barber, Y. Soysal. 1995. The friendly and predatory acquisition of

47
large U.S. corporations in the 1960's: The other contested terrain. American Sociological
Review. 60 469-99.
Petersen, M. A., R. G. Rajan. 1994. The benefits of lending relationships: Evidence from small
business data. The Journal of Finance. 49 3-37.
Pisano, G. P. 1991. The governance of innovation: Vertical integration and collaborative
arrangements in the biotechnology industry. Research Policy. 20 237-49.
Pisano, G. P., P. Y. Mang. 1993. Collaborative product development and the market for know-
how: Strategies and structures in the biotechnology industry. Research on Technological
Innovation, Management and Policy. 5 109-36.
Podolny, J. M. 1994. Market uncertainty and the social character of economic exchange.
Administrative Science Quarterly. 39 458-83.
———. 1993. A status-based model of market competition. American Journal of Sociology. 98
829-72.
Podolny, J. M., T. E. Stuart, M. T. Hannan. 1996. Networks, knowledge and niches. American
Journal of Sociology. 102 659-89.
Porter, M. E. 1992. Capital Choices: Changing the Way America Invests in Industry. Council on
Competitiveness/Harvard Business School, Boston, MA.
POV Inc. 1997. Biotechnology's Top 50 Pharmaceuticals and Diagnostics: A Competitive
Analysis.
Powell, W. W., K. W. Koput, L. Smith-Doerr. 1996. Interorganizational collaboration and the
locus of innovation: Networks of learning in biotechnology. Administrative Science
Quarterly. 41 116-45.
Rao, H. 1994. The social construction of reputation: Certification contests, legitimation, and the

48
survival of organizations in the American automobile industry: 1895-1912. Strategic
Management Journal. 15 29-44.
Rao, H., R. Drazin. 2000. An institutional ecology of recruitment in the mutual fund industry:
1986-1994. Working paper, Emory University, Atlanta, GA.
Rau, P. R. 2000. Investment bank market share, contingent fee payments, and the performance of
acquiring firms. Journal of Financial Economics. 56 293-324.
Saxenian, A. 1994. Regional Advantage: Culture and Competition in Silicon Valley and Route
128. Harvard University Press, Cambridge, MA.
Simon, H. A. 1955. A behavioral model of rational choice. Quarterly Journal of Economics. 69
99-118.
Sobel, M. E. 1982. Asymptotic confidence intervals for indirect effects in structural equations
models. Pp. 290-312 in Sociological Methodology, edited by S. Leinhard. Jossey-Bass,
San Francisco.
Spence, A. M. 1974. Market Signaling: Information Transfer in Hiring and Related Screening
Processes. Harvard University Press, Cambridge, MA.
Stinchcombe, A. 1965. Social structure and organizations. Pp. 142-93 in Handbook of
Organizations, editor James G. March. Rand McNally, Chicago.
Stuart, T. E., H. Hoang, R. C. Hybels. 1999. interorganizational endorsements and the
performance of entrepreneurial ventures. Administrative Science Quarterly. 44 315-49.
Thompson, J. D. 1967. Organizations in Action. McGraw-Hill, New York.
Uzzi, B. 1999. Embeddedness in the making of financial capital: How social relations and
networks benefit firms seeking financing. American Sociological Review. 64 481-505.
Van de Ven, W. P. M. M., B. M. S. van Praag. 1981. The demand for deductibles in private

49
health insurance. Journal of Econometrics. 17 229-52.
Veblen, T. 1953. The Theory of the Leisure Class. New American Library, New York.
Weber, M. 1968. Economy and Society. Bedminster, New York.
Welbourne, T. M., A. O. Andrews. 1996. Predicting the performance of initial public offerings:
Should human resource management be in the equation? Academy of Management
Journal. 39 891-919.
Welbourne, T. M., L. A. Cyr. 1999. The human resource executive effect in initial public
offering firms. Academy of Management Journal. 42 616-29.
White, H. C. 1993. Markets in Production Networks. Pp. 161-75 in Explorations in Economic
Sociology, edited by Richard Swedberg. Russell Sage, New York.
———. 1988. Varieties of Markets. Pp. 228-60 in Social Structures: A Network Approach,
edited by Barry Wellman and Steven D. Berkowitz. Cambridge University Press, New
York.
———. 1981. Where do markets come from? American Journal of Sociology. 87 517-47.
Winship, C., R. D. Mare. 1992. Models for sample selection bias. Annual Review of Sociology.
18 327-50.
Zucker, L. G., M. R. Darby, and M. B. Brewer. 1994. Intellectual capital and the birth of US
biotechnology enterprises. National Bureau of Economic Research, Cambridge, MA.
Zuckerman, E. W. 1999. The categorical imperative: Securities analysts and the illegitimacy
discount. American Journal of Sociology. 104 1398-438.

50
TABLE 1
Definitions and Predicted Signs of Variables
Variable Definition Predicted Sign
Equity Index Lerner’s (1994) biotechnology equity index. +
Firm Age Years between founding date and IPO. +
Firm Size Number of employees at time of offering. +
Location Set to 1 if company is in central location + (Boston, San Diego, or San Francisco; default: non-central (anywhere else), set to 0).
No. Alliances Number of corporate or institutional alliances. +
VC Prominence Set to 1 if company has at least one top 20 venture + capital firm as >5% owner (default: no top 20 VC owner, set to 0).
Private Financing Amount of private financing company received + as reported on final prospectus.
Product Stage Ranges from 1 to 9 according to the stage of the + company’s lead product (1=discovery (i.e., earliest stage); 9=revenue-generating (i.e., latest stage)).
Avg. Prior Position Level Average hierarchical level of upper echelon + members’ prior positions listed (range: 0 to 5).
Size of Upper Echelon Number of managers and directors reported on prospectus. +
Age of Executive/Director Average age of upper echelon members. +
Tenure with Firm Coefficient of variation of organizational tenure of upper echelon + members.
Functional Heterogeneity Heterogeneity of upper echelon’s functional background, + calculated using Herfindahl-Hirschman index across 22 possible categories (range: 0 to 1).
Upstream Number of previous employment affiliations with prominent + Affiliations research institutions or universities represented upper echelon.
Horizontal Number of previous employment affiliations with prominent + Affiliations biotech companies represented by upper echelon.
Downstream Number of previous employment affiliations with prominent + Affiliations pharmaceutical companies represented by upper echelon.
Range of Heterogeneity of upper echelon affiliations; + Affiliations calculated using Herfindahl-Hirschman index across three types of affiliations (range: 0 to 1), and as simple count of how many of the 3 categories are represented.

51
Variable Mean S.D. 1 2 3 4 5 6 7 9 10 11 12 13
1. Equity Index 3.79 .96
2. Firm Age 4.90 2.89 .09
3. Firm Size 83.72 118.83 .04 .08
4. Geographical Location .49 .50 .16 ** .07 .03
5. No. Alliances 1.65 1.90 .05 .07 -.02 -.03
6. VC Prominence .46 .50 .20 ** .02 .12 * .31 *** .08
7. Private financing a 6.91 .77 .19 ** .10 † .29 *** .19 ** .23 *** .31 ***
8. Product Stage 4.66 2.83 .03 .24 *** .27 *** .08 -.12 * .18 ** .12 *
9. Avg Prior Position Level 2.72 .67 -.01 -.08 -.07 .01 -.01 .06 .06 .11 †
10. Age of Executives 47.62 4.56 -.10 † .11 † -.01 -.16 ** -.03 -.32 *** -.08 -.05 .18 **
11. Tenure with Firm .65 .33 .05 .09 -.02 -.04 .05 -.06 .06 -.09 -.02 .00
12. Functional Heterogeneity .79 .10 .00 .12 * .16 ** .11 † .04 .08 .27 *** .13 * -.40 *** -.01 .10 †
13. Upstream Affiliations .18 .19 .01 .00 -.04 .09 .01 -.04 -.02 -.19 ** -.11 † -.08 -.04 .02
14. Horizontal Affiliations .15 .19 .03 -.08 .02 .27 *** .08 .19 *** .26 *** -.14 * .04 -.05 .03 .11 † .10 †
15. Downstream Affiliations .32 .23 .02 .06 -.02 -.02 .04 .04 .19 ** .01 .21 *** .08 .02 -.06 -.07 .08
16. Range of Affiliations 2.18 .87 .10 † -.01 .11 † .28 *** .13 * .18 ** .41 *** -.04 .09 -.07 .09 .24 *** .35 *** .54 *** .28 ***
17. Underwriter Prestige b 7.62 1.96 .14 * .13 * .22 *** .12 † .19 ** .31 *** .41 *** .17 ** .13 * -.03 .05 .12 † -.11 † .25 *** .25 *** .33 ***
18. Firm Net Proceeds a 7.24 .34 .36 *** .17 ** .28 *** .29 *** .16 ** .36 *** .55 *** .17 ** .06 -.10 † .02 .22 *** .06 .21 *** .25 *** .41 *** .53 ***
19. No. Institutional Investors 10.53 8.69 .26 *** .21 *** .32 *** .19 ** .04 .34 *** .41 *** .25 *** .04 -.09 -.04 .13 * -.02 .10 † .20 ** .23 *** .42 *** .73 ***
20. No. Dedicated Institutional Investors .73 1.66 .17 ** .19 ** .22 *** .18 ** .03 .34 *** .31 *** .23 *** .08 -.05 -.06 .10 † -.01 .15 * .16 ** .23 *** .35 *** .54 *** .77 ***
*** p < .001 a Adjusted to constant 1996 dollars, and logged.** p < .01 b n = 241
* p < .05† p < .10
TABLE 2Means, Standard Deviations, and Correlations
(n = 296)
19181716158 14

52
I II III IV V VI VIIControl VariablesEquity Index .04 (.12) .05 (.12) .05 (.12) .06 (.12) .06 (.12) .04 (.12) .05 (.11)Firm Age .07 (.04) .08 † (.04) .08 † (.04) .08 * (.04) .07 † (.04) .08 † (.04) .08 * (.04)Firm Size .00 (.00) .00 * (.00) .00 * (.00) .00 * (.00) .00 * (.00) .00 * (.00) .00 * (.00)Location .04 (.26) -.01 (.26) -.01 (.26) -.18 (.26) -.11 (.26) -.15 (.26) -.18 (.26)No. Alliances .12 † (.06) .11 † (.06) .11 † (.06) .11 † (.06) .11 † (.06) .11 † (.06) .10 † (.06)VC Prominence .76 ** (.24) .77 ** (.25) .76 ** (.25) .66 ** (.24) .65 ** (.24) .76 ** (.24) .67 ** (.24)Private Financing(b) .72 *** (.17) .62 ** (.17) .61 *** (.17) .53 ** (.17) .43 * (.17) .46 ** (.17) .36 * (.17)Product Stage .07 (.04) .06 (.04) .05 (.05) .08 † (.05) .07 (.04) .08 † (.04) .07 (.04)
Upper Echelon Variables:Avg. Prior Position Level .52 * (.21) .50 * (.21) .48 * (.21) .44 * (.20) .43 * (.21) .38 † (.20)Age of Executives -.00 (.03) -.01 (.03) -.01 (.03) -.01 (.03) -.01 (.03) -.01 (.03)Tenure with Firm .36 (.34) .34 (.34) .32 (.33) .29 (.32) .28 (.33) .22 (.32)Functional Heterogeneity 1.89 (1.45) 1.87 (1.45) 1.61 (1.42) 2.00 (1.40) 1.09 (1.44) 1.37 (1.42)
Upper Echelon AffiliationsUpstream -.60 (.58) -.66 (.57) -.47 (.56) -1.00 † (.61)Horizontal 1.80 ** (.60) 1.74 ** (.59) 1.11 † (.66)Downstream 1.45 ** (.48) 1.13 * (.50)Range .47 ** (.14) .37 * (.18)
Constant 1.01 (1.20) -.97 (1.88) -.60 (1.91) .07 (1.89) .28 (1.86) -.03 (1.87) 1.05 (1.88)
Wald chi-square 106.80 *** 117.48 *** 118.99 *** 131.32 *** 144.56 *** 131.97 *** 151.04 ***
Rho -.02 -.12 -.16 -.17 -.13 -.08 -.13N 241 241 241 241 241 241 241*** p < .001 (two-tailed tests)** p < .01 (a) Unstandardized regression coefficients reported; standard errors in parentheses.* p < .05 (b) Adjusted to 1996 dollars and logged.† p < .10
TABLE 3Heckman Selection Models of Investment Bank Prestige at Time of IPO (a)
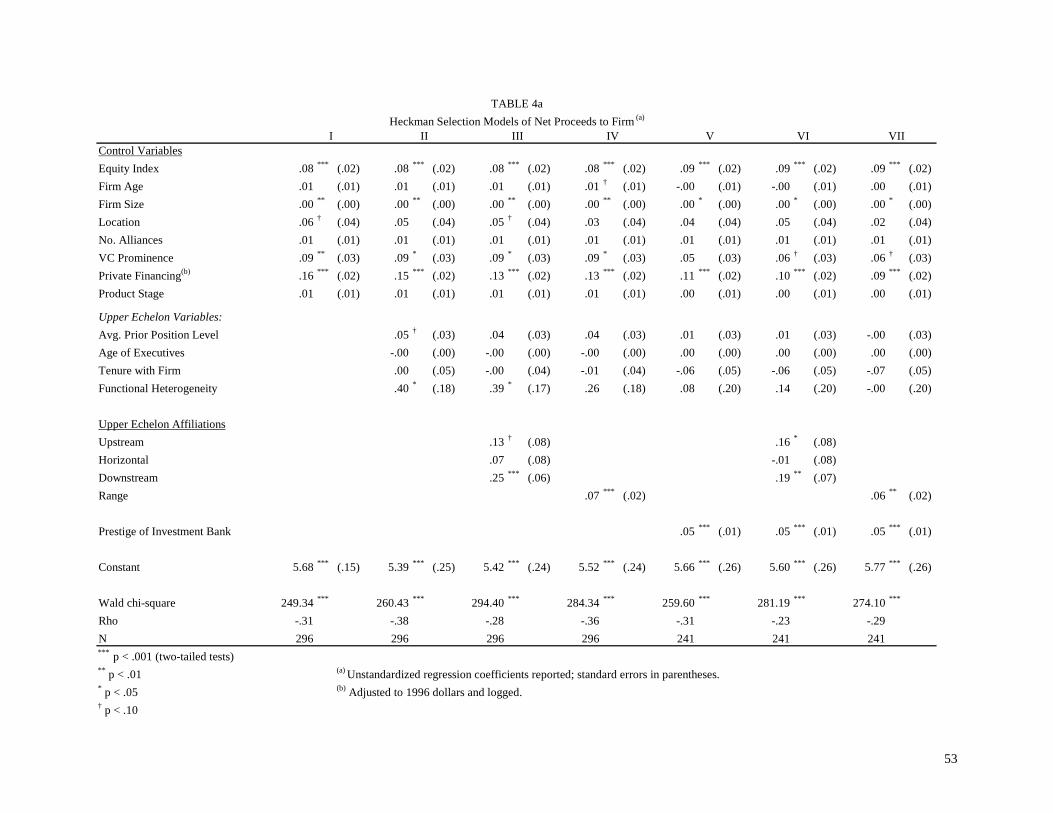
53
I II III IV V VI VIIControl VariablesEquity Index .08 *** (.02) .08 *** (.02) .08 *** (.02) .08 *** (.02) .09 *** (.02) .09 *** (.02) .09 *** (.02)Firm Age .01 (.01) .01 (.01) .01 (.01) .01 † (.01) -.00 (.01) -.00 (.01) .00 (.01)Firm Size .00 ** (.00) .00 ** (.00) .00 ** (.00) .00 ** (.00) .00 * (.00) .00 * (.00) .00 * (.00)Location .06 † (.04) .05 (.04) .05 † (.04) .03 (.04) .04 (.04) .05 (.04) .02 (.04)No. Alliances .01 (.01) .01 (.01) .01 (.01) .01 (.01) .01 (.01) .01 (.01) .01 (.01)VC Prominence .09 ** (.03) .09 * (.03) .09 * (.03) .09 * (.03) .05 (.03) .06 † (.03) .06 † (.03)Private Financing(b) .16 *** (.02) .15 *** (.02) .13 *** (.02) .13 *** (.02) .11 *** (.02) .10 *** (.02) .09 *** (.02)Product Stage .01 (.01) .01 (.01) .01 (.01) .01 (.01) .00 (.01) .00 (.01) .00 (.01)
Upper Echelon Variables:Avg. Prior Position Level .05 † (.03) .04 (.03) .04 (.03) .01 (.03) .01 (.03) -.00 (.03)Age of Executives -.00 (.00) -.00 (.00) -.00 (.00) .00 (.00) .00 (.00) .00 (.00)Tenure with Firm .00 (.05) -.00 (.04) -.01 (.04) -.06 (.05) -.06 (.05) -.07 (.05)Functional Heterogeneity .40 * (.18) .39 * (.17) .26 (.18) .08 (.20) .14 (.20) -.00 (.20)
Upper Echelon AffiliationsUpstream .13 † (.08) .16 * (.08)Horizontal .07 (.08) -.01 (.08)Downstream .25 *** (.06) .19 ** (.07)Range .07 *** (.02) .06 ** (.02)
Prestige of Investment Bank .05 *** (.01) .05 *** (.01) .05 *** (.01)
Constant 5.68 *** (.15) 5.39 *** (.25) 5.42 *** (.24) 5.52 *** (.24) 5.66 *** (.26) 5.60 *** (.26) 5.77 *** (.26)
Wald chi-square 249.34 *** 260.43 *** 294.40 *** 284.34 *** 259.60 *** 281.19 *** 274.10 ***
Rho -.31 -.38 -.28 -.36 -.31 -.23 -.29N 296 296 296 296 241 241 241*** p < .001 (two-tailed tests)** p < .01 (a) Unstandardized regression coefficients reported; standard errors in parentheses.* p < .05 (b) Adjusted to 1996 dollars and logged.† p < .10
TABLE 4aHeckman Selection Models of Net Proceeds to Firm (a)

54
I II III IV V VI VIIControl VariablesEquity Index 1.36 ** (.46) 1.39 ** (.46) 1.39 ** (.45) 1.38 ** (.46) 1.39 ** (.51) 1.40 ** (.51) 1.37 ** (.51)Firm Age .39 ** (.15) .42 ** (.16) .39 * (.13) .43 ** (.15) .26 (.18) .23 (.18) .27 (.18)Firm Size .01 *** (.00) .01 ** (.00) .01 *** (.00) .01 *** (.00) .01 * (.00) .01 * (.00) .01 * (.00)Location .59 (.10) .56 (1.00) .83 (1.02) .30 (1.02) .71 (1.11) 1.00 (1.13) .42 (1.13)No. Alliances -.13 (.23) -.13 (.23) -.11 (.23) -.14 (.23) -.13 (.25) -.11 (.25) -.13 (.25)VC Prominence 3.13 ** (.93) 3.04 ** (.97) 3.05 ** (.96) 3.04 ** (.97) 2.25 * (1.08) 2.38 * (1.07) 2.30 * (1.07)Private Financing(b) 2.74 *** (.62) 2.72 *** (.65) 2.40 *** (.66) 2.46 *** (.67) 2.38 ** (.75) 2.15 ** (.76) 2.13 ** (.77)Product Stage .31 † (.17) .27 (.17) .28 (.17) .30 (.17) .19 (.19) .21 (.20) .24 (.19)
Upper Echelon Variables:Avg. Prior Position Level .47 (.73) .09 (.73) .27 (.74) -.35 (.91) -.35 (.90) -.48 (.91)Age of Executives -.01 (.10) -.02 (.10) -.00 (.10) .01 (.11) -.00 (.11) .00 (.11)Tenure with Firm -1.28 (1.30) -1.32 (1.28) -1.41 (1.30) -2.70 † (1.45) -2.68 † (1.43) -2.83 † (1.44)Functional Heterogeneity 1.18 (5.13) 1.29 (5.06) -.46 (5.23) -4.24 (6.23) -2.78 (6.21) -5.68 (6.29)
Upper Echelon AffiliationsUpstream 1.13 (2.28) 3.11 (2.46)Horizontal 1.06 (2.38) -.77 (2.65)Downstream 5.65 ** (1.87) 4.46 * (2.14)Range .82 (.56) .93 (.64)
Prestige of Investment Bank 1.06 *** (.28) .98 ** (.28) .97 ** (.28)
Constant -19.45 *** (4.38) -20.13 ** (7.06) -19.07 ** (7.12) -18.61 ** (7.11) -18.14 * (8.07) -19.36 * (8.18) -16.33 * (8.13)
Wald chi-square 163.24 *** 165.23 *** 178.82 *** 168.40 *** 147.87 *** 156.10 *** 151.03 ***
Rho -.02 -.01 .06 .00 .19 .25 .20N 296 296 296 296 241 241 241*** p < .001 (two-tailed tests)** p < .01 (a) Unstandardized regression coefficients reported; standard errors in parentheses.* p < .05 (b) Adjusted to 1996 dollars and logged.† p < .10
TABLE 4bHeckman Selection Models of Number of Institutional Investors (a)

55
I II III IV V VI VIIControl VariablesEquity Index .14 (.13) .15 (.13) .16 (.12) .15 (.12) .15 (.14) .15 (.14) .14 (.14)Firm Age .11 * (.04) .11 ** (.04) .11 ** (.04) .12 ** (.04) .08 (.05) .08 (.05) .08 † (.05)Firm Size .00 † (.00) .00 † (.00) .00 † (.00) .00 † (.00) .00 (.00) .00 (.00) .00 (.00)Location .33 (.28) .33 (.28) .32 (.28) .22 (.28) .39 (.32) .37 (.32) .26 (.32)No. Alliances -.02 (.06) -.02 (.06) -.02 (.06) -.03 (.06) -.04 (.07) -.03 (.07) -.04 (.07)VC Prominence 1.01 *** (.26) 1.03 *** (.27) 1.01 *** (.27) 1.03 *** (.26) .84 ** (.30) .83 ** (.30) .86 ** (.30)Private Financing(b) .51 ** (.17) .50 ** (.18) .39 * (.18) .39 * (.18) .41 † (.21) .33 (.21) .29 (.21)Product Stage .63 (.05) .05 (.05) .06 (.05) .06 (.05) .02 (.05) .04 (.05) .04 (.05
Upper Echelon Variables:Avg. Prior Position Level .20 (.20) .12 (.20) .12 (.20) .05 (.25) .05 (.25) -.01 (.25)Age of Executives .02 (.03) .01 (.03) .02 (.03) .02 (.03) .02 (.03) .02 (.03)Tenure with Firm -.45 (.36) -.46 (.35) -.51 (.35) -.90 * (.40) -.89 * (.40) -.96 * (.40)Functional Heterogeneity .35 (1.41) .24 (1.39) -.34 (1.43) -1.06 (1.74) -.85 (1.73) -1.71 (1.74)
Upper Echelon AffiliationsUpstream .50 (.63) .85 (.69)Horizontal .82 (.66) .73 (.74)Downstream 1.20 * (.52) .94 (.59)Range .35 * (.15) .42 * (.18)
Prestige of Investment Bank .25 ** (.08) .22 ** (.08) .22 ** (.08)
Constant -3.81 ** (1.21) -5.08 ** (1.94) -4.71 * (1.96) -4.44 * (1.94) -4.67 * (2.25) -4.74 * (2.28) -3.85 † (2.25)
Wald chi-square 108.95 *** 113.44 *** 123.51 *** 120.16 *** 101.55 *** 107.39 *** 108.78 ***
Rho .19 .20 .26 .22 .44 .49 .47N 296 296 296 296 241 241 241*** p < .001 (two-tailed tests)** p < .01 (a) Unstandardized regression coefficients reported; standard errors in parentheses.* p < .05 (b) Adjusted to 1996 dollars and logged.† p < .10
TABLE 4cHeckman Selection Models of Number of Dedicated Institutional Investors (a)