Embed Size (px)
Citation preview

1 © 2014 American Funds Distributors, Inc..
Investments are not FDIC-insured, nor are they deposits of or guaranteed by a bank or any other entity, so they may lose value. Figures are past results and
are not predictive of results
in future periods.
9638s45612 (Non CE)
RPGEPO-074-1014
Get More From the Core Investments in Your DC Plan Lineups.

What Matters Most: Participant Outcomes*
© American Funds Distributors, Inc.
* Assumes a hypothetical 40-year accumulation at 10% of pay and an 8% annual return. Source: Your Money Ratios, CBS Moneywatch contributor Charlie Farrell, 2010.
30% Contributions
70% Investment returns
2

Agenda
• Can some active managers beat the indexes
and other active managers?
• If so, how can you find and, more important,
keep successful active managers in a plan lineup?
• How can you help sponsors and participants
achieve better outcomes from plan core investments?
• What matters most?
© American Funds Distributors, Inc. 3

“The Average Active Manager Can’t Beat the Index”
This is true, but it isn’t the whole story.
Data from Morningstar. Based on calendar-year returns of actively managed funds, excluding the American Funds, whose relevant benchmark is the S&P 500 Index.
This universe excludes funds that fell in the Morningstar Moderate and World Allocation categories. Funds with incomplete data were removed from the analysis. For
more information on filtering methodology, see General Methodology at the end of this presentation.
Percentage of time led index Percentage of time lagged index
‘94 ‘95 ‘96 ‘97 ‘98 ‘99 ‘00 ‘01 ‘02 ‘03 ‘04 ‘05 ‘06 ‘07 ‘08 ‘09 ‘10 ‘11 ‘12 ‘13
42% of the time, U.S. equity active managers outpaced the
S&P 500 during the 20 calendar years ended 12/31/13
58% of the time, U.S. equity active managers trailed the
S&P 500 during the 20 calendar years ended 12/31/13
0
20
40
60
80
100% Percentage of funds
–20
–40
–60
–80
–100
© American Funds Distributors, Inc.

© American Funds Distributors, Inc.
How Do You Find and Keep the Right Active Managers?
5

© American Funds Distributors, Inc.
Time Frames Matter
• DiMeo Schneider methodology:
− Persistency of top quartile
mutual funds*
− 17 different categories
− 10-year period ended 12/2011
− Includes 2008–2009 bear market
“For even the best performing
investments over the long
term, underperforming during
a three- or five-year period is
an eventual near-certainty.
Falling prey to natural human
behavioral tendencies
generally leads to failure.”
© American Funds Distributors, Inc.
* Distinct portfolio share classes (only) from Morningstar mutual fund database. Not corrected for survivorship bias.
Short-term Vision Can Penalize Participants
“The Next Chapter in the Active versus Passive Debate” (2012
update)
Source: DiMeo Schneider, “The Next Chapter in
the Active versus Passive Debate,” 2012 update.
6
© American Funds Distributors, Inc. 7
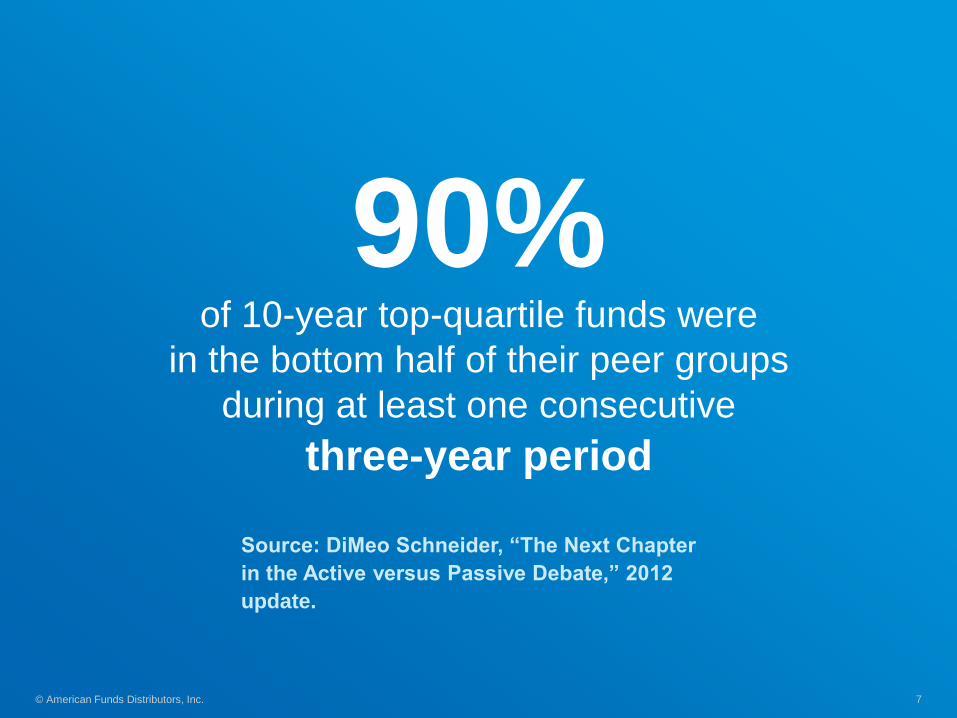
of 10-year top-quartile funds were
in the bottom half of their peer groups
during at least one consecutive
three-year period
90%
Source: DiMeo Schneider, “The Next Chapter
in the Active versus Passive Debate,” 2012
update.

© American Funds Distributors, Inc. 8
of 10-year top-quartile funds were
in the bottom half of their peer groups for
at least one consecutive
five-year period
63%
Source: DiMeo Schneider, “The Next Chapter
in the Active versus Passive Debate,” 2012
update.

© American Funds Distributors, Inc. © American Funds Distributors, Inc.
“[The score] is not intended, nor should it be
used, as the sole source of information for
reaching an investment decision.” fi360
“While the RPAG Score is based on five years of
data, our process extends the review to six and
sometimes even seven years. We encourage
advisors to extend it further where applicable.
A 10-year perspective can add tremendous
value if the underlying management team was
responsible over that same time period.”
Jeff Elvander, CFA,
Chief Investment Officer
Retirement Plan Advisory Group
9

© American Funds Distributors, Inc.
Qualitative Screens Make a Difference.
10

© American Funds Distributors, Inc.
Morningstar’s “Fantastic 48”
10 American Funds are on the list
Each “fantastic” fund must have:
• Beaten the fund’s benchmark since the start
date of the longest-tenured manager
• An expense ratio in the cheapest quintile
of the category
• A manager with at least five years of experience
• A Bronze or better Morningstar Analyst Rating
• A positive Parent rating
• At least one manager with at least $500,000 or
more invested in the fund
• Overall Morningstar Risk that is not “High”
• Not been limited to institutional investors
“You want great managers,
low costs, good
stewardship,
and managers who eat their
own cooking.”
Morningstar, June 2014
11

Characteristics of Core Managers That Add Value
Two criteria have made a meaningful difference
“Firms with high levels of manager tenure, manager retention and ownership of
mutual fund shares also have delivered better outcomes for investors. The same
is true of firms that offer funds with lower expense ratios.”
2014 Morningstar U.S. Mutual Fund Industry Stewardship Survey Emphasis added.
© American Funds Distributors, Inc. 12

2,466 U. S. large-cap funds
Least expensive
quartile (≤89.1 bps)
Highest manager
ownership quartile
571 International large-cap funds
Funds
in both
Two Screens Can Improve Fund Selection
Rolling 1-, 3-, 5- and 10-year periods for the 20 years 1994-2013
Least expensive
quartile (≤104.0 bps)
122 funds
109 funds
Highest manager
ownership quartile
Funds
in both
20 funds
509 funds
447 funds
85 funds
Domestic Foreign
© American Funds Distributors, Inc.
Source: Capital Group based on Morningstar data. Domestic funds are those in the Morningstar Large Cap Value, Large Cap Blend and Large Cap Growth
categories. U.S. index is the S&P 500. International funds are those in the Morningstar Foreign Large Value, Foreign Large Blend and Foreign Large Growth.
International index is MSCI ACWI ex USA. Data as of May 19, 2014. The indexes are unmanaged and, therefore, have no expenses. Investors cannot invest directly
in an index.
13
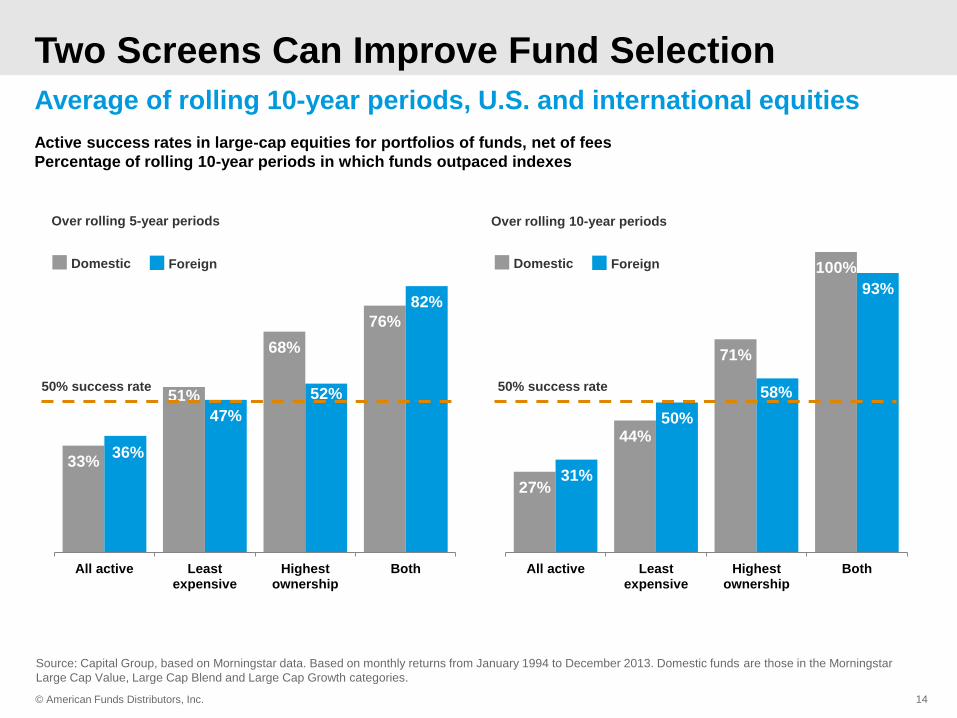
33%
51%
68%
76%
36%
47%
52%
82%
All active Leastexpensive
Highestownership
Both
27%
44%
71%
100%
31%
50%
58%
93%
All active Leastexpensive
Highestownership
Both
Two Screens Can Improve Fund Selection
Average of rolling 10-year periods, U.S. and international equities
Source: Capital Group, based on Morningstar data. Based on monthly returns from January 1994 to December 2013. Domestic funds are those in the Morningstar
Large Cap Value, Large Cap Blend and Large Cap Growth categories.
© American Funds Distributors, Inc.
50% success rate
Domestic Foreign
Active success rates in large-cap equities for portfolios of funds, net of fees
Percentage of rolling 10-year periods in which funds outpaced indexes
Over rolling 5-year periods Over rolling 10-year periods
50% success rate
Domestic Foreign
14

15 © American Funds Distributors, Inc.
Active Core Funds Have Outpaced Indexes
Data from published sources were calculated internally. Hypothetical results are based on average monthly returns for rolling five-year periods of monthly returns
from January 1994 to December 2013. Past results are not predictive of results in future periods. Porfolios were rebalanced annually. Please note: These sample
portfolios exclude fixed-income allocations typical of core portfolio holdings. The components of each allocation can be found at the end of this presentation.
The potential for excess return and low cost in the core Figures shown are past results for American Funds Class A shares and are not predictive of results in future
periods. Current and future results may be lower or higher than those shown here. Returns shown at net asset value
(NAV) have all distributions reinvested. If a sales charge had been deducted, the results would have been lower.
Share prices and returns will vary, so investors may lose money. Investing for short periods makes losses more
likely. For current information and month-end results, visit americanfunds.com.

American Funds Core Alpha =
2.21% over rolling 5-year periods
© American Funds Distributors, Inc. 16

The American Funds Core Screening Results
© American Funds Distributors, Inc. 17
Low expense ratios and high firm manager ownership
American Funds Core
Pensions & Investments’
“most used equity funds
in DC plans”
Domestic equities
• The Growth Fund of America® #2
• Fundamental Investors® #9
• Washington Mutual Investors FundSM #10
• The Investment Company of America® #23
• AMCAP Fund® #29
• American Mutual Fund® #35
• The New Economy Fund® –
International/Global equities
• EuroPacific Growth Fund® #1
• International Growth and Income FundSM #4

© American Funds Distributors, Inc.
What Matters Most? Participant Outcomes.
18

19 © American Funds Distributors, Inc.
What Matters Most
Participant case study: accumulation phase
Past results are not predictive of results in future periods. Portfolio details can be found in the Methodology section at the end of this presentation.
* Represents the account value from a prior employer’s plan, based on average account balance from the ages of 40 to 50, according to EBRI 2012
Hypothetical 45-year-old employee rolls over $85,000,*
then invests $500 each month for next 20 years (through 12/31/13).
Figures shown on this and the following
slides are past results for the American
Funds Class A shares and are not predictive
of results in future periods. Current and
future results may be lower or higher than
those shown. Returns shown at net asset
value (NAV) have all distributions
reinvested. If a sales charge had been
deducted, the results would have been
lower. Share prices and returns will vary, so
investors may lose money. Investing for
short periods makes losses more likely. For
current information and month-end results,
visit americanfunds.com/retirement.

20 © American Funds Distributors, Inc.
Participant case study: distribution phase
What Matters Most
Hypothetical 65-year-old employee withdraws 5% in 1994 and increases that dollar amount
by 3% each year (cost of living) in each of the subsequent 19 years (through 12/31/13).
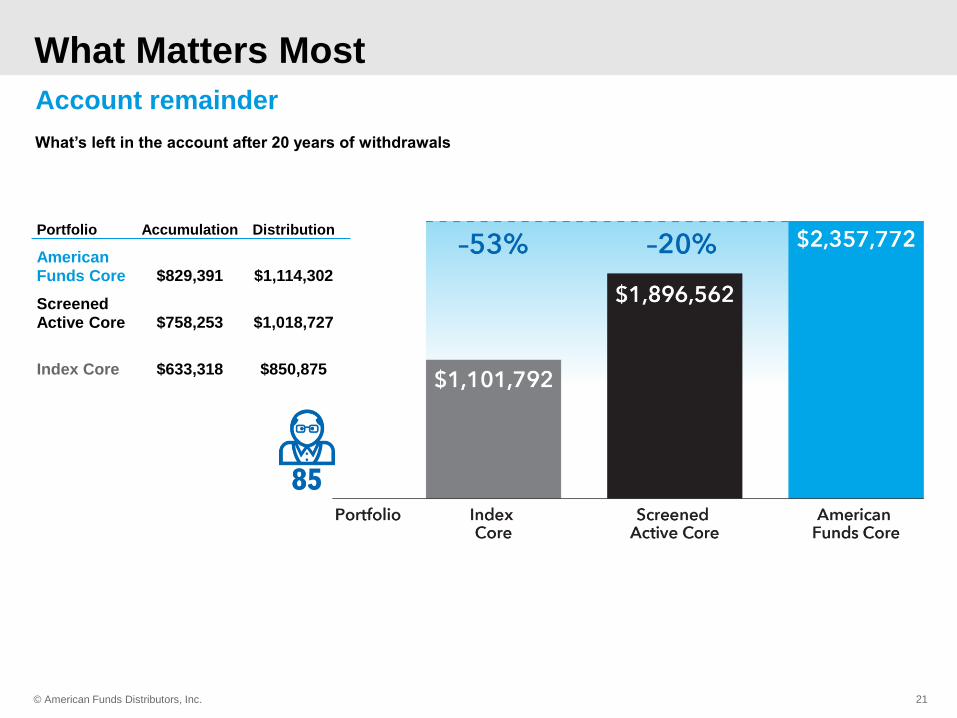
What Matters Most
Account remainder
© American Funds Distributors, Inc.
What’s left in the account after 20 years of withdrawals
21
Portfolio Accumulation Distribution
American Funds Core $829,391 $1,114,302
Screened Active Core $758,253 $1,018,727
Index Core $633,318 $850,875

Not All Managers Are Average
© American Funds Distributors, Inc.
“[American Funds] very visibly accomplishes
what index-fund proponents claim cannot be
done: outperform year after year, decade
after decade.”
Morningstar,
January 2014
22

Strong funds that have consistently outpaced their peer indexes
American Funds Target Date Series
© American Funds Distributors, Inc.
* Based on Class R-6 share results for rolling periods through December 31, 2013. Periods covered are the shorter of the fund’s lifetime or since the comparable
Lipper inception date.
23
93% did
outpace
peers
7% did not
outpace
peers
95%
“Few other target-date series
have as many highly
regarded
underlying holdings.”
— Morningstar Target-Date Fund
Series Report, December 31, 2013.
The underlying funds have outpaced their respective Lipper peer indexes in 93% of rolling 10-year periods*

AMCAP Fund® RAFGX
Committed to established growth companies
© American Funds Distributors, Inc.
Active success rate is the percentage of time a fund (or a group of funds) has outpaced its relevant index (or peer group) over rolling periods. The active success rate and average
relative returns are based on Class R-6 shares over rolling monthly 10-year periods from the first month-end following the fund’s inception on May 1, 1967, through December 31, 2013.
Class R-6 shares were first offered on May 1, 2009. Class R-6 share results prior to the date of first sale are hypothetical based on Class A share results without a sales charge,
adjusted for typical estimated expenses. Please see americanfunds.com for more information on specific expense adjustments and the actual dates of first sale. For the fund’s
comparable index (or index blend), see slides at end of presentation. Market indexes are unmanaged and, therefore, have no expenses. Investors cannot invest directly in an index.
There have been periods when the fund has lagged the index. The fund’s expense ratio is based on Class R-6 shares as of its prospectus available at the time of publication, as of
December 31, 2013. The source for the industry average expense ratio is Morningstar, excluding funds of funds, is as of December 31, 2013. The expense ratios do not reflect sales
charges or fees charged by financial intermediaries. The relevant category used for the expense ratio comparison for AMCAP Fund is Morningstar’s Large Cap Retirement, Large. Past
results are not predictive of results in future periods.
24
0.67%
0.37%
Percentage of time fund
led/lagged index
Average relative return when fund
led/lagged index (average of when
fund’s returns in excess of the index
were positive/negative)
Active success rate
Fund led index Fund lagged index
Expense ratio
Fund Industry average
71%
3.74%
-1.33%
Class R-6 shares vs. Morningstar Large
Cap Retirement, Large category
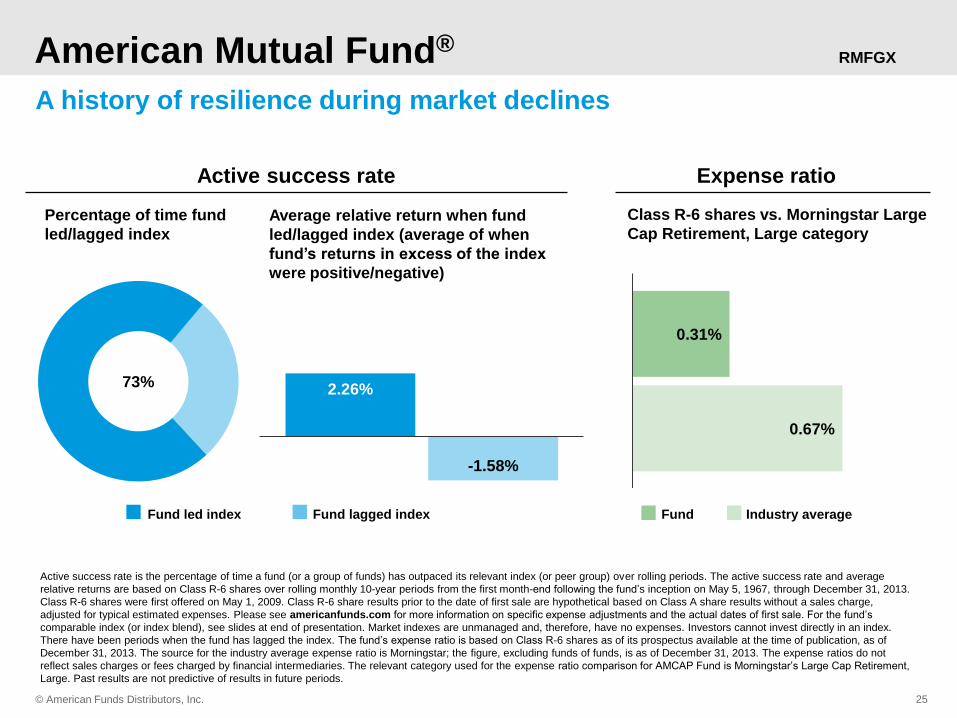
American Mutual Fund® RMFGX
A history of resilience during market declines
© American Funds Distributors, Inc.
Active success rate is the percentage of time a fund (or a group of funds) has outpaced its relevant index (or peer group) over rolling periods. The active success rate and average
relative returns are based on Class R-6 shares over rolling monthly 10-year periods from the first month-end following the fund’s inception on May 5, 1967, through December 31, 2013.
Class R-6 shares were first offered on May 1, 2009. Class R-6 share results prior to the date of first sale are hypothetical based on Class A share results without a sales charge,
adjusted for typical estimated expenses. Please see americanfunds.com for more information on specific expense adjustments and the actual dates of first sale. For the fund’s
comparable index (or index blend), see slides at end of presentation. Market indexes are unmanaged and, therefore, have no expenses. Investors cannot invest directly in an index.
There have been periods when the fund has lagged the index. The fund’s expense ratio is based on Class R-6 shares as of its prospectus available at the time of publication, as of
December 31, 2013. The source for the industry average expense ratio is Morningstar; the figure, excluding funds of funds, is as of December 31, 2013. The expense ratios do not
reflect sales charges or fees charged by financial intermediaries. The relevant category used for the expense ratio comparison for AMCAP Fund is Morningstar’s Large Cap Retirement,
Large. Past results are not predictive of results in future periods.
25
0.67%
0.31%
Active success rate
Fund led index Fund lagged index
Expense ratio
Fund Industry average
73% 2.26%
-1.58%
Percentage of time fund
led/lagged index
Average relative return when fund
led/lagged index (average of when
fund’s returns in excess of the index
were positive/negative)
Class R-6 shares vs. Morningstar Large
Cap Retirement, Large category

Fundamental Investors® RFNGX
Our most flexible growth-and-income fund
© American Funds Distributors, Inc.
Active success rate is the percentage of time a fund (or a group of funds) has outpaced its relevant index (or peer group) over rolling periods. The active success rate and average
relative returns are based on Class R-6 shares over rolling monthly 10-year periods from the first month-end following the fund’s inception on May 5, 1967, through December 31, 2013.
Class R-6 shares were first offered on May 1, 2009. Class R-6 share results prior to the date of first sale are hypothetical based on Class A share results without a sales charge,
adjusted for typical estimated expenses. Please see americanfunds.com for more information on specific expense adjustments and the actual dates of first sale. For the fund’s
comparable index (or index blend), see slides at end of presentation. Market indexes are unmanaged and, therefore, have no expenses. Investors cannot invest directly in an index.
There have been periods when the fund has lagged the index. The fund’s expense ratio is based on Class R-6 shares as of its prospectus available at the time of publication, as of
December 31, 2013. The source for the industry average expense ratio is Morningstar; the figure, excluding funds of funds, is as of December 31, 2013. The expense ratios do not
reflect sales charges or fees charged by financial intermediaries. The relevant category used for the expense ratio comparison for AMCAP Fund is Morningstar’s Large Cap Retirement,
Large. Past results are not predictive of results in future periods.
26
0.67%
0.31%
Active success rate
Fund led index Fund lagged index
Expense ratio
Fund Industry average
86% 1.97%
-0.72%
Percentage of time fund
led/lagged index
Average relative return when fund
led/lagged index (average of when
fund’s returns in excess of the index
were positive/negative)
Class R-6 shares vs. Morningstar Large
Cap Retirement, Large category

The Growth Fund of America® RGAGX
Paints with a broad brush
© American Funds Distributors, Inc.
Active success rate is the percentage of time a fund (or a group of funds) has outpaced its relevant index (or peer group) over rolling periods. The active success rate and average
relative returns are based on Class R-6 shares over rolling monthly 10-year periods from the first month-end following the fund’s inception on May 5, 1967, through December 31, 2013.
Class R-6 shares were first offered on May 1, 2009. Class R-6 share results prior to the date of first sale are hypothetical based on Class A share results without a sales charge,
adjusted for typical estimated expenses. Please see americanfunds.com for more information on specific expense adjustments and the actual dates of first sale. For the fund’s
comparable index (or index blend), see slides at end of presentation. Market indexes are unmanaged and, therefore, have no expenses. Investors cannot invest directly in an index.
There have been periods when the fund has lagged the index. The fund’s expense ratio is based on Class R-6 shares as of its prospectus available at the time of publication, as of
December 31, 2013. The source for the industry average expense ratio is Morningstar; the figure, excluding funds of funds, is as of December 31, 2013. The expense ratios do not
reflect sales charges or fees charged by financial intermediaries. The relevant category used for the expense ratio comparison for AMCAP Fund is Morningstar’s Large Cap Retirement,
Large. Past results are not predictive of results in future periods.
27
0.67%
0.34%
Active success rate
Fund led index Fund lagged index
Expense ratio
Fund Industry average
79%
3.61%
-0.74%
Percentage of time fund
led/lagged index
Average relative return when fund
led/lagged index (average of when
fund’s returns in excess of the index
were positive/negative)
Class R-6 shares vs. Morningstar Large
Cap Retirement, Large category

The Investment Company of America® RICGX
Seven decades of consistency
© American Funds Distributors, Inc.
Active success rate is the percentage of time a fund (or a group of funds) has outpaced its relevant index (or peer group) over rolling periods. The active success rate and average
relative returns are based on Class R-6 shares over rolling monthly 10-year periods from the first month-end following the fund’s inception on May 5, 1967, through December 31, 2013.
Class R-6 shares were first offered on May 1, 2009. Class R-6 share results prior to the date of first sale are hypothetical based on Class A share results without a sales charge,
adjusted for typical estimated expenses. Please see americanfunds.com for more information on specific expense adjustments and the actual dates of first sale. For the fund’s
comparable index (or index blend), see slides at end of presentation. Market indexes are unmanaged and, therefore, have no expenses. Investors cannot invest directly in an index.
There have been periods when the fund has lagged the index. The fund’s expense ratio is based on Class R-6 shares as of its prospectus available at the time of publication, as of
December 31, 2013. The source for the industry average expense ratio is Morningstar; the figure, excluding funds of funds, is as of December 31, 2013. The expense ratios do not
reflect sales charges or fees charged by financial intermediaries. The relevant category used for the expense ratio comparison for AMCAP Fund is Morningstar’s Large Cap Retirement,
Large. Past results are not predictive of results in future periods.
28
0.67%
0.30%
Active success rate
Fund led index Fund lagged index
Expense ratio
Fund Industry average
76% 2.13%
-1.73%
Percentage of time fund
led/lagged index
Average relative return when fund
led/lagged index (average of when
fund’s returns in excess of the index
were positive/negative)
Class R-6 shares vs. Morningstar Large
Cap Retirement, Large category

The New Economy Fund® RNGGX
Growth and innovation
© American Funds Distributors, Inc.
Active success rate is the percentage of time a fund (or a group of funds) has outpaced its relevant index (or peer group) over rolling periods. The active success rate and average
relative returns are based on Class R-6 shares over rolling monthly 10-year periods from the first month-end following the fund’s inception on May 5, 1967, through December 31, 2013.
Class R-6 shares were first offered on May 1, 2009. Class R-6 share results prior to the date of first sale are hypothetical based on Class A share results without a sales charge,
adjusted for typical estimated expenses. Please see americanfunds.com for more information on specific expense adjustments and the actual dates of first sale. For the fund’s
comparable index (or index blend), see slides at end of presentation. Market indexes are unmanaged and, therefore, have no expenses. Investors cannot invest directly in an index.
There have been periods when the fund has lagged the index. The fund’s expense ratio is based on Class R-6 shares as of its prospectus available at the time of publication, as of
December 31, 2013. The source for the industry average expense ratio is Morningstar; the figure, excluding funds of funds, is as of December 31, 2013. The expense ratios do not
reflect sales charges or fees charged by financial intermediaries. The relevant category used for the expense ratio comparison for AMCAP Fund is Morningstar’s Large Cap Retirement,
Large. Past results are not predictive of results in future periods.
29
0.67%
0.48%
Active success rate
Fund led index Fund lagged index
Expense ratio
Fund Industry average
59% 1.63%
-1.05%
Percentage of time fund
led/lagged index
Average relative return when fund
led/lagged index (average of when
fund’s returns in excess of the index
were positive/negative)
Class R-6 shares vs. Morningstar Large
Cap Retirement, Large category

Washington Mutual Investors FundSM RWMGX
The bluest of the blue chips
© American Funds Distributors, Inc.
Active success rate is the percentage of time a fund (or a group of funds) has outpaced its relevant index (or peer group) over rolling periods. The active success rate and average
relative returns are based on Class R-6 shares over rolling monthly 10-year periods from the first month-end following the fund’s inception on May 5, 1967, through December 31, 2013.
Class R-6 shares were first offered on May 1, 2009. Class R-6 share results prior to the date of first sale are hypothetical based on Class A share results without a sales charge,
adjusted for typical estimated expenses. Please see americanfunds.com for more information on specific expense adjustments and the actual dates of first sale. For the fund’s
comparable index (or index blend), see slides at end of presentation. Market indexes are unmanaged and, therefore, have no expenses. Investors cannot invest directly in an index.
There have been periods when the fund has lagged the index. The fund’s expense ratio is based on Class R-6 shares as of its prospectus available at the time of publication, as of
December 31, 2013. The source for the industry average expense ratio is Morningstar; the figure, excluding funds of funds, is as of December 31, 2013. The expense ratios do not
reflect sales charges or fees charged by financial intermediaries. The relevant category used for the expense ratio comparison for AMCAP Fund is Morningstar’s Large Cap Retirement,
Large. Past results are not predictive of results in future periods.
30
0.67%
0.30%
Active success rate
Fund led index Fund lagged index
Expense ratio
Fund Industry average
87% 2.12%
-0.86%
Percentage of time fund
led/lagged index
Average relative return when fund
led/lagged index (average of when
fund’s returns in excess of the index
were positive/negative)
Class R-6 shares vs. Morningstar Large
Cap Retirement, Large category

EuroPacific Growth Fund® RERGX
Purely international
© American Funds Distributors, Inc.
Active success rate is the percentage of time a fund (or a group of funds) has outpaced its relevant index (or peer group) over rolling periods. The active success rate and average
relative returns are based on Class R-6 shares over rolling monthly 10-year periods from the first month-end following the fund’s inception on May 5, 1967, through December 31, 2013.
Class R-6 shares were first offered on May 1, 2009. Class R-6 share results prior to the date of first sale are hypothetical based on Class A share results without a sales charge,
adjusted for typical estimated expenses. Please see americanfunds.com for more information on specific expense adjustments and the actual dates of first sale. For the fund’s
comparable index (or index blend), see slides at end of presentation. Market indexes are unmanaged and, therefore, have no expenses. Investors cannot invest directly in an index.
There have been periods when the fund has lagged the index. The fund’s expense ratio is based on Class R-6 shares as of its prospectus available at the time of publication, as of
December 31, 2013. The source for the industry average expense ratio is Morningstar; the figure, excluding funds of funds, is as of December 31, 2013. The expense ratios do not
reflect sales charges or fees charged by financial intermediaries. The relevant category used for the expense ratio comparison for AMCAP Fund is Morningstar’s Large Cap Retirement,
Large. Past results are not predictive of results in future periods.
31
0.88%
0.49%
Active success rate
Fund led index Fund lagged index
Expense ratio
Fund Industry average
96% 3.95%
-0.59%
Percentage of time fund
led/lagged index
Average relative return when fund
led/lagged index (average of when
fund’s returns in excess of the index
were positive/negative)
Class R-6 shares vs. Morningstar Large
Cap Retirement, Large category

International Growth and Income FundSM RIGGX
International growth with a dividend focus
© American Funds Distributors, Inc.
Active success rate is the percentage of time a fund (or a group of funds) has outpaced its relevant index (or peer group) over rolling periods. The active success rate and average
relative returns are based on Class R-6 shares over rolling monthly 10-year periods from the first month-end following the fund’s inception on May 5, 1967, through December 31, 2013.
Class R-6 shares were first offered on May 1, 2009. Class R-6 share results prior to the date of first sale are hypothetical based on Class A share results without a sales charge,
adjusted for typical estimated expenses. Please see americanfunds.com for more information on specific expense adjustments and the actual dates of first sale. For the fund’s
comparable index (or index blend), see slides at end of presentation. Market indexes are unmanaged and, therefore, have no expenses. Investors cannot invest directly in an index.
There have been periods when the fund has lagged the index. The fund’s expense ratio is based on Class R-6 shares as of its prospectus available at the time of publication, as of
December 31, 2013. The source for the industry average expense ratio is Morningstar; the figure, excluding funds of funds, is as of December 31, 2013. The expense ratios do not
reflect sales charges or fees charged by financial intermediaries. The relevant category used for the expense ratio comparison for AMCAP Fund is Morningstar’s Large Cap Retirement,
Large. Past results are not predictive of results in future periods.
32
0.88%
0.51%
Active success rate
Fund led index Fund lagged index
Expense ratio
Fund Industry average
100%
1.41%
N/A
Percentage of time fund
led/lagged index
Average relative return when fund
led/lagged index (average of when
fund’s returns in excess of the index
were positive/negative)
Class R-6 shares vs. Morningstar Large
Cap Retirement, Large category
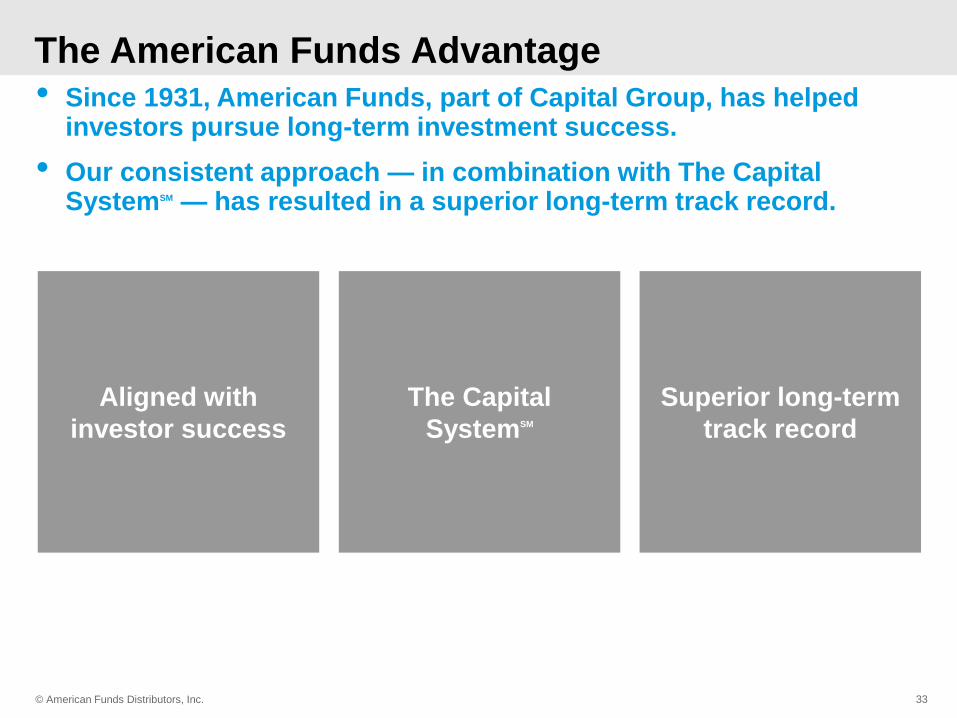
The American Funds Advantage
Aligned with
investor success
The Capital
SystemSM
Superior long-term
track record
© American Funds Distributors, Inc.
• Since 1931, American Funds, part of Capital Group, has helped investors pursue long-term investment success.
• Our consistent approach — in combination with The Capital SystemSM — has resulted in a superior long-term track record.
33

• A compelling body of evidence
• Use non-results-oriented (qualitative) screens
• Consider implementing these concepts in your plan
© American Funds Distributors, Inc.
Summary
34

© American Funds Distributors, Inc.
Robert Shiller,
Nobel Prize-winning economist
“People make better decisions
with financial advisors.”
35

© American Funds Distributors, Inc. 36
Investors should carefully consider investment objectives, risks, charges and
expenses. This and other important information is contained in the fund prospectuses
and summary prospectuses, which can be obtained from a financial professional and
should be read carefully before investing.

37
Methodology
Compiling the fund universe
The database built to represent the universe of both large-cap domestic and large-cap foreign funds drew from
Morningstar’s U.S. Open-End Large Value, Large Blend and Large Growth U.S. and Foreign categories, with live and dead
funds combined to eliminate survivorship bias. For live funds, only the oldest share class was used. For dead funds with
multiple share classes, the median monthly returns were used. For fee-related illustrations that include dead funds with
multiple share classes, the median expense ratios were used. This screening resulted in seven qualifying domestic
American Funds (AMCAP Fund, The Growth Fund of America, The New Economy Fund, American Mutual Fund,
Fundamental Investors, The Investment Company of America and Washington Mutual Investors Fund) and two qualifying
foreign American Funds (EuroPacific Growth Fund and International Growth and Income Fund). Funds are identified as
domestic or foreign based on Morningstar categories. A number of the U.S.-focused American Funds can invest some
assets in non-U.S. securities; likewise, the two foreign-focused American Funds can invest some assets in U.S.-issued
securities.
Tracking the least expensive quartile and the highest manager ownership quartile
In conducting our research, we searched Morningstar’s database for large-cap actively managed funds that were in both
the lowest quartile ranked by expense ratio and the highest quartile ranked by manager ownership at the firm level. For
this analysis we relied on Morningstar Direct data analysis software. Least expensive quartile was calculated using annual
report Net Expense Ratio (NER) for all observed Morningstar categories for the 20-year period indicated. For funds with
missing expense ratios, gaps between two available data points were filled in using linear interpolation. Highest manager
ownership quartile was calculated using weighted averages of Morningstar screens of manager holdings at the firm level.
Each fund was assigned the weighted average of its firm manager holding. Funds without values were excluded from the
quartile rankings. The combination of least expensive NER and highest manager ownership quartiles (the screened active
core) was the result of a cross-section of the two screens. Only those funds with both the lowest expense ratios and the
highest manager ownership were included. Investors who wish to identify funds that ranked in the least expensive quartile
by NER can rely on the following rule of thumb: The least expensive quartile of funds ranked by net expense ratio for
Class A shares roughly corresponded with those reporting expenses below 0.99% for large-cap domestic funds and below
1.10% for large-cap foreign funds. Expense ratios for institutional and advisory share classes would be approximately 25
basis points lower, or below 0.74% for large-cap domestic funds and below 0.85% for large-cap foreign funds.
© American Funds Distributors, Inc.

38
Methodology (cont.)
Investors who wish to identify funds that ranked in the top quartile by manager ownership can rely on the following rule of
thumb:
• The least expensive quartile of funds ranked by net expense ratio roughly corresponded with those reporting expenses
below 0.99% for large-cap domestic funds and below 1.10% for large-cap foreign funds. Expense ratios for institutional
and advisory share classes would be approximately 25 basis points lower, or below 0.74% for large-cap domestic funds
and below 0.85% for large-cap foreign funds.
Investors who wish to identify funds that ranked in the top quartile by manager ownership can rely on the following rule of
thumb:
• The top quartile of funds ranked by manager ownership roughly corresponded with firms that had 55% or more assets in
the fund family complex in which at least one fund manager had invested a minimum of $1 million.
The Securities and Exchange Commission requires that mutual funds disclose all fees and expenses in a standardized table
published in the front portion of the fund prospectus. The SEC also requires that a fund disclose in its statements of
additional information (SAI) certain information about its portfolio managers, including ownership of securities in the fund.
Ownership disclosure is made using the following seven ranges: none; $1 to $10,000; $10,001 to $50,000; $50,001 to
$100,000; $100,001 to $500,000; $500,001 to $1,000,000; and over $1,000,000.
Morningstar tracks manager ownership as a percentage of assets at the firm level. This information can be found using
Morningstar Direct software, which can be downloaded by visiting global.morningstar.com/direct and clicking on
“Download Morningstar Direct.” Advisors seeking to incorporate manager ownership as part of their fund screening
criteria can take the following steps using Morningstar Direct. Start by creating a new open-end fund advanced search and
defining a universe. For example, for the broad large-cap domestic fund universe, select U.S., then Large Value, Large
Blend and Large Growth; to avoid duplication, screen for the oldest share class available. With the universe selected, the
snapshot page will show a set of default screens, including “Annual Report Net Expense Ratio.” It is necessary to manually
add a field for manager ownership. Under Available Data Points, select “Firm % Assets Manager Investment Over $1
million.” This selection will allow you to sort the chosen fund universe by both the expense ratio and manager ownership
fields. Due to the dynamic nature of the Morningstar database, results for the Morningstar Large U.S. and Foreign universes
may change.
© American Funds Distributors, Inc.

39
Methodology (cont.)
Working with indexes
Market indexes referenced in this brochure are defined as follows:
• MSCI All Country World ex USA Index is a free float-adjusted market capitalization-weighted index that
is designed to measure results of more than 40 developed and emerging equity markets, excluding the
United States. Results reflect dividends gross of withholding taxes through December 31, 2000, and
dividends net of withholding taxes thereafter.
• Standard & Poor’s 500 Composite Index is a market capitalization-weighted index based on the average
weighted results of 500 widely held common stocks.
The market indexes are unmanaged and, therefore, have no expenses. Investors cannot invest directly in
an index. There have been periods when the funds have lagged the index. Past results are not predictive
of results in future periods.
Investment disclosure
Investing outside the United States involves risks, such as currency fluctuations, periods of illiquidity and
price volatility, as more fully described in the prospectus. These risks may be heightened in connection
with investments in developing countries. The return of principal for bond funds and for funds with
significant underlying bond holdings is not guaranteed. Fund shares are subject to the same interest rate,
inflation and credit risks associated with the underlying bond holdings. Investments in mortgage-related
securities involve additional risks, such as prepayment risk, as more fully described in the prospectus.
Higher yielding, higher risk bonds can fluctuate in price more than investment-grade bonds, so investors
should maintain a long-term perspective.
© American Funds Distributors, Inc.

American Funds Investment Results Results as of September 30, 2014
Figures shown are past results for Class A shares and are not predictive of results in future periods. Current and
future results may be lower or higher than those shown. Results shown below reflect deduction of the maximum
sales charge of 5.75%. Share prices and returns will vary, so investors may lose money. Investing for short periods
makes losses more likely. For current information and month-end results, visit americanfunds.com.
AMCAP Fund® 5/1/67 12.17% 14.50% 8.07% 11.51% 0.70%
EuroPacific Growth Fund® 4/16/84 0.49 5.51 7.63 11.13 0.84
The Growth Fund of America® 12/1/73 9.71 12.82 8.11 13.58 0.70
The New Economy Fund® 12/1/83 7.88 13.73 9.58 11.18 0.83
Growth-and-income funds
American Mutual Fund® 2/21/50 9.12 12.73 7.21 11.64 0.61
Fundamental Investors® 8/1/78 9.67 12.77 8.66 12.43 0.63
International Growth and Income FundSM 10/1/08 0.49 6.73 — 8.85 0.91
The Investment Company of America® 1/1/34 13.72 12.85 7.25 12.17 0.61
Washington Mutual Investors FundSM 7/31/52 11.30 14.43 6.98 11.87 0.60
Average annual total returns (%)
Growth funds Inception date 1 year 5 years 10 years Lifetime Expense ratio
40

© American Funds Distributors, Inc. 41
This material must be preceded or accompanied by a summary prospectus or prospectus for AMCAP
Fund, American Mutual Fund, EuroPacific Growth Fund, Fundamental Investors, The Growth Fund of
America, International Growth and Income Fund, The Investment Company of America, The New Economy
Fund and Washington Mutual Investors Fund.
Investment results assume all distributions are reinvested and reflect applicable fees and expenses.
Expense ratios are as of each fund's prospectus available at the time of publication. When applicable,
investment results reflect fee waivers and/or expense reimbursements, without which the results would
have been lower. Please see americanfunds.com for more information.
If used after December 31, 2014, this presentation must be accompanied by a current American Funds
quarterly statistical update.
Glossary
• Active success rate is the percentage of time a fund (or a group of funds) has outpaced its
relevant index (or peer group) over rolling periods.
• Alpha is a measure of the difference between a portfolio’s actual returns and its expected results,
given its level of risk as measured by beta. A positive alpha figure indicates the portfolio has performed
better than its beta would predict. In contrast, a negative alpha indicates the portfolio has
underperformed, given the expectations established by beta.
• Capture ratio reflects the annualized product of fund versus index returns for all months in
which the index had a positive return (upside capture) or negative return (downside capture).
• Standard deviation (annualized, based on monthly returns) is a common measure of absolute
volatility that tells how returns over time have varied from the mean. A lower number signifies
lower volatility.

42 © 2014 American Funds Distributors, Inc..
9638s45612 (Non CE version)
RPGEPO-074-1014
Get More From the Core Investments in Your DC Plan Lineups.


![MADE IN JAPAN DC Micro Motors - toamec.co.jp製品一覧 List of products Lineups ラ g y ¾] º µ»Ú w v a ¼ a Òå³èµÞ Ó» ¯ èµÞ Ó» . Þ Ó» «½ ÿ¤ Ó» 種 類](https://img.dokumen.tips/doc/110x75/60c83ed771c82a77527a5ba7/made-in-japan-dc-micro-motors-ee-list-of-products-lineups-f-g-y-.jpg)