Embed Size (px)
Citation preview

63
Geotechnical Investigation for Evaluating Coal Mining Design of Pit A ... Agus Nugroho
Received : 22 November 2013, first revision : 20 January 2014, second revision : 11 June 2014, accepted : June 2014
IndonesIan MInIng Journal Vol. 17, No. 2, June 2014 : 63 - 74
geotechnical investigation for evaluating coal mining design of pit a at
kutai kertanegara, east kalimantan
penyelidikan geoteknik untuk mengevaluasi disain penambangan batubara pit a di kabupaten kutai
kartanegara, provinsi kalimantan timur
agus nugrohoR&D Centre for Mineral and Coal Technology
Jalan Jenderal Sudirman 623 Bandung, 40211, IndonesiaPhone. +62.22.6030483, Fax. +62.22.6003373
e-mail: [email protected]
ABSTRACT
Due to the occurrence of slope failure at Pit A, on both side-wall and low-wall geotechnical study had been con-ducted to evaluate the slope stability whether the mining can be continued through the end of mine life or not. Slope stability modeling using Limit Equilibrium method shows that coal mining is feasible to reach the depth of ± 50m as stated in a previous plan. The previous design for sidewall has the overall slope of 400. This is not a stable condition with Safety Factor (SF) =1.050. As a result, evaluation of slope design must be conducted. The simulation shows that the slope must be changed to 300 in terms of reaching stable condition with SF=1.539. Previous design of the low wall that has the overall slope of 300 is stable with the SF=1.359 however, as the area is near settlements and Mahakam River, the pit slope must be reduced to 250 with SF=1,523. Slope stabil-ity simulation at the high-wall shows that the previous design with the overall slope 450 is stable for SF=2.418. It is not necessary to change previous design. However, to guaranty safety condition along mining area, it is recommended to make safety-berm to prevent the rocks enter the area.
Keyword: coal mining, slope stability
Sari
Sehubungan dengan kelongsoran yang terjadi di sisi selatan side-wall Pit A dan juga kelongsoran di sisi barat low-wall, telah dilakukan penyelidikan geoteknik untuk menilai apakah penambangan masih memungkinkan untuk dilanjutkan sampai tahap akhir. Simulasi kemantapan lereng menggunakan metode Kesetimbangan Batas menunjukkan bahwa penambangan masih dapat dilakukan sampai kedalaman ± 50m. Untuk sisi sela-tan side-wall, disimpulkan bahwa disain awal yang semula 400 tidak stabil dengan FK=1,050, sehingga perlu dilakukan modifikasi dengan melandaikan lereng menjadi 300 yang stabil dengan FK=1,539. Untuk sisi barat low-wall, disimpulkan bahwa disain awal yang semula 300 stabil dengan FK=1,359, namun karena lereng di sisi ini mempunyai risiko yang cukup tinggi karena dekat dengan rumah penduduk dan sungai Mahakam, maka direkomendasikan lereng dilandaikan menjadi 250 dengan FK=1,523. Untuk high-wall sisi timur, disimpulkan bahwa disain awal yang semula 450 stabil dengan FK=2,418, sehingga tidak perlu dilakukan modifikasi lereng. Namun untuk pertimbangan keamanan sebaiknya dibuat safety-berm untuk menahan jatuhan (rockfall) mate-rial batupasir.
Kata kunci: penambangan batubara, kemantapan lereng

64
IndonesIan MInIng Journal Vol. 17, No. 2, June 2014 : 63 - 74
introduction
Slope is defined as a surface of which one end or side is at a higher level than another (Sunggono, 1984). The slope includes confined and uncon-fined ones. The former relates to soil condition at a certain depth that lies on the bed rocks and retains similar dip with the bed rocks while the later refers to a soil pile that rests on the oblique, original soil (Christady, 2010). Force changing on the slope occurs when mining activity starts operating. This will result in a landslide.
The landslide related to mining activity also took place at southern and western parts of sidewall Pit A. Pit A is one of coal mining areas at Kutai Kartanegara coal mines (Figure 1). As a result the overall pit slope in such a mine needs to be re-evaluated. Field observation shows that the landslide results from water concentration behind the slope crest. Such a concentration causes the weakness of soil material - the slope component. The substance changes into mud material and goes down to the pit. As a result, mining activity within that area is temporarily closed down until a recommendation that based on study result is provided. The landslide at western part of the sidewall is similar to that of the southern one. Such a landslide occurs due to the water seepage from Mahakam River.
methodologY
Method used in this research includes:- collecting secondary data from related techni-
cal reports;
- field observations regarding geotechnical aspects of slope surface for each outcrop;
- conducting 3-point geotechnical drilling, namely GT-01, GT- 02 and GT-03 to get core logs description including geotechnical sam-pling;
- testing geotechnical samples including com-pressive strength (σc ), tensile strength (µ , E), direct shear strength ( cr, Φr ) etc.;
- processing geotechnical data including physics-mechanics properties of the rocks as well as characterizing the rock mass as slope component. The data will be used for model simulation and slope stability analysis;
- modeling and analyzing slope stability using limit equilibrium method (Anonym, 2006) for three representative cross sections. SF>1.25 is the indicator for evaluating the slope stabil-ity and several simulations regarding slope stability and model are conducted to get the results close to the real condition in the field
results and discussion
In a surface mine, mining slope design is one of the important factors for the persistence of mine activity. Geotechnical analysis and slope stability are two factors used for designing mining slope. Theoretically, slope stability is the potential of soil covered slopes to withstand and undergo movement. Pangular (1985) stated that stability is determined by the balance of shear stress and shear strength through calculation of the slope safety factor. Several data are required for that purpose. Those are properties of soil physics, soil mechanics as well as slope geometry. Figure 2
(a) (b)
Figure 1. Landslide occurred at southern part of side wall Pit A (a) and the western part (b)

65
Geotechnical Investigation for Evaluating Coal Mining Design of Pit A ... Agus Nugroho
where W Sin α = shear stressSr = (W Cos α) Tan α = shear strength.
Figure 2. Scheme for safety factor calculation
shows a chart calculation for slope stability cal-culation using safety factor (SF)
Soil mechanics theory states that shear failure of soil or soft rocks occurs due to the relative mo-tion of soil particles. Its shear strength depends primarily on interactions between particles and occurs when the stresses between the particles are such that they slide or roll past each other. Soil derives its shear strength from two sources:- cohesion between particles (stress indepen-
dent component): cementation between sand grains and electrostatic attraction between clay particles
- frictional resistance between particles (stress dependent component)
Cohesion (c) is a measure of the forces that ce-ment particles of soils while frictional resistance is measured by internal friction angle (φ). Formula for calculating shear strength is as follows:
t = c + (σ – u) tan θ
wheret = shear strength, c = cohesion, σ = normal stress, u = pore water pressure, θ = angle of friction
Slope stability is affected by the following fac-tors: strength of soil and rock, type of soil and stratification, discontinuities and planes of weak-ness, groundwater table and seepage through the slope, external loading and geometry of the slope. Following are different causes of slope failure: erosion, rainfall, earthquakes, geological factors, external loading, construction activities
such as excavation of slopes and filling of slopes, rapid drawdown or a lowering of water level, in-crement of pore water pressure and the change in topography (Hirnawan, 1994; Terzaghi, 1996). Groundwater within slope rock mass affects slope stability directly and indirectly. Direct effect relates to lessening the shear strength due to the effective normal stress decreases as a result of pore water pressure or crack water pressure. Slope burden also diminishes the shear strength. Increasing wet rock mass density on the slope results in escalat-ing the slope burden. Accordingly, the slope starts gliding. Indirect effect of groundwater is reduction of rock strength. This phenomenon normally oc-curs at open pit mining including coal mine that keeps the water in it.
Stability modeling for slope in this study employs analysis approaches. The approaches include: - dynamic load. Normally the used load refers
to seismic vibration. Yet, due to Kalimantan is not earthquake area, this approached is not applied in this study;
- material characteristics. The data are derived from laboratory testing and adjusted to meet the study requirement;
- ground water table; The model employs ground water table as representation of water effect on the slope. The existence of water within the rock mass increases specific grav-ity of the rocks and results in improving the slope burden. Brunsden dan Ibsen (1997) states that the increase of moisture content weakens both physical and mechanical properties of the rocks as well as decreases the safety factor (SF). Pore pressure due to the existence of water within the rock mass

66
IndonesIan MInIng Journal Vol. 17, No. 2, June 2014 : 63 - 74
will reduce rock mass strength. The water table may vary due to seasonal changes in precipitation, evapo-transpiration, topography and structural geology. Hoek and Bray (1981) describes ground water table for various slope conditions as depicted in Figure 3. Each slope retains different water table. At study area, the table for high wall area refers to the 16-day water level measurement at Hole GT-02. The
average water table in this area is 11 m below surface topography. The fact that low wall area is close to Mahakam River (only 188 m) results in modeling the water table is based on saturation condition. Model of ground wa-ter table for southern part of sidewall utilizes Hoek and Bray chart number 3, 4 and 5 as the water will be controlled in terms of preventing the slope from multiple landslide;
Figure 3. Ground water table conditions (Hoek and Bray, 1981)

67
Geotechnical Investigation for Evaluating Coal Mining Design of Pit A ... Agus Nugroho
- stability criteria. Referring to Bowles study as stated in Table 1, the used SF for stability criteria is >1.25. The SF will be monitored on two types of slope namely the overall slope and slope that characterized from mud materi-als;
Table 1. Relationship between slope safety factor and landslide intensity (Bowles, 1989)
Safety Factor for Slope Landslide Intensity
< 1.07 Frequently (unstable slope)1.07 - 1.25 Once (critical slope)
> 1.25 Rarely (stable slope)
condition to be used as a model. The fact that mud material serves as stability control results in applying section X-A as the model. The thickness mud material and lowest mine floor elevation are two reasons using section A as the model;
- modeling concept. The modeling includes three sages, namely back analyzing on the sliding slope, analyzing the planned slope and revising the plan. If the slope is stable, mining operation can be persisted. On the contrary, it requires re-design if the analyzed slope is labile.
Geotechnical parameters including physical and mechanical characters of the rocks for modeling the slope are based on laboratory tests. Table 2 through 4 are the parameters employed for each section model that include g = unit weight, θ = angle of friction, dan C= cohesion.
Modeling and back analyses are aimed to deter-mine and verify the representative geotechnical parameters of the slope in an open pit mining area by exploiting a landslide occurrence as a case study at such an area. When the slope starts glid-ing, the SF is principally equal to 1.0. Reconstruct-ing the after-gliding slope is based on the data
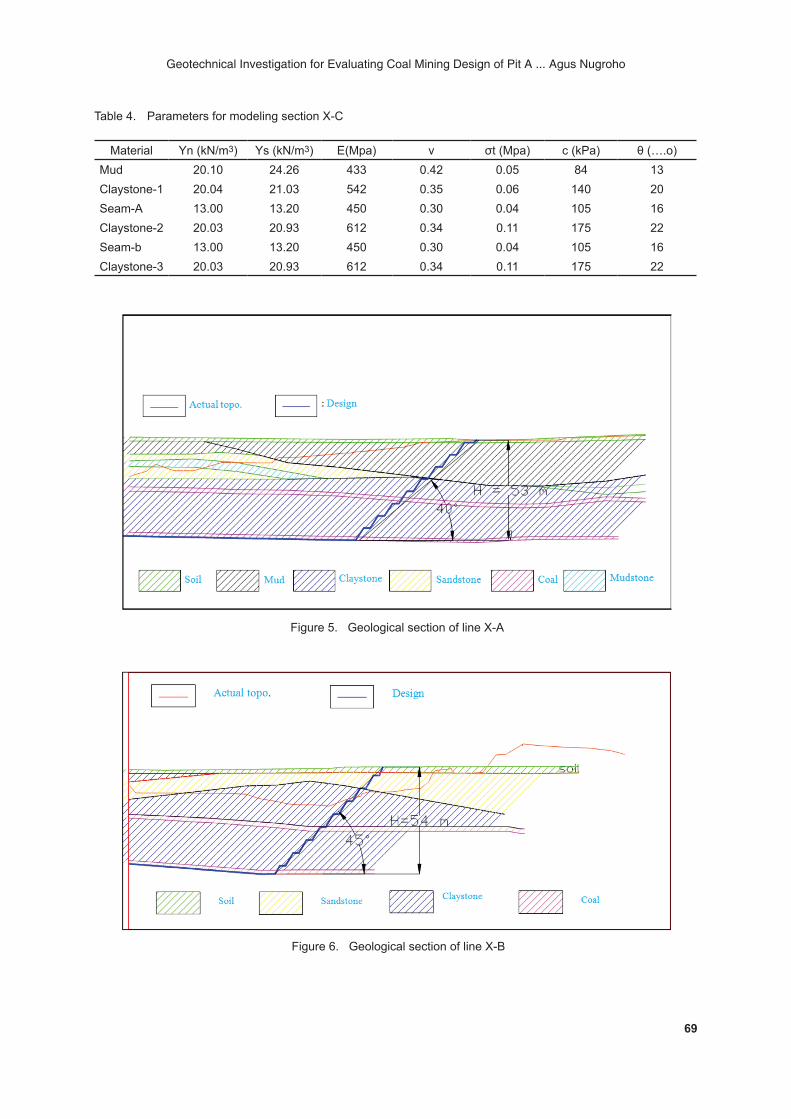
- location. Each of slope segments is represent-ed by one model section close to geotechnical bore hole. Section X-A corresponds to the southern part of sidewall while section X-B epitomizes the high wall. The southern part of low wall is embodied by section X-C. Figure 4 through 7 illustrate position and lithology of each section. Actually, each part of sidewall at the southern part shows varied geological
Table 2. Parameters for modeling section X-A
Material Yn (kN/m3) Ys (kN/m3) E(Mpa) v σt (Mpa) c (kPa) θ (….o)Mud 20.10 24.26 433 0.42 0.05 84 13Claystone-1 20.04 21.03 542 0.35 0.06 140 20Seam-A 13.00 13.20 450 0.30 0.04 105 16Claystone-2 20.09 22.14 612 0.34 0.11 175 22Seam-B 13.00 13.20 450 0.30 0.04 105 16Claystone-3 20.09 22.14 612 0.34 0.11 175 22
Table 3. Parameters for modeling section X-B
Material Yn (kN/m3) Ys (kN/m3) E(Mpa) v σt (Mpa) c (kPa) θ (….o)Dump material 16.47 17.73 300 0.42 0.05 84 13Sandstone 22.59 23.54 1057 0.30 0.11 273 33Claystone-1 20.06 21.19 904 0.35 0.08 200 25Seam-A 13.00 13.20 750 0.30 0.05 150 20Claystone-2 20.09 22.14 1020 0.34 0.14 250 28Seam-B 13.00 13.20 750 0.30 0.05 150 20Claystone-3 20.09 22.14 1020 0.34 0.14 250 28

68
IndonesIan MInIng Journal Vol. 17, No. 2, June 2014 : 63 - 74
Figu
re 4
. G
eote
chni
cal p
rofil
e of
stu
dy a
rea
mah
akam
riv
er
settle
ment
padd
Y fi
eld
LEG
EN
D:
Con
tour
Set
tlem
ent
PIT
DE
SIG
N O
F LO
A TU
I RE
V3
(150
310)
SC
ALE
1 :
3800
n
Min
ing
Lice
nse
Bor
der
Pad
dy F
ield
Roa
dTr
ench
Mah
akam
Riv
erP
g D
esig
n
69
Geotechnical Investigation for Evaluating Coal Mining Design of Pit A ... Agus Nugroho
Table 4. Parameters for modeling section X-C
Material Yn (kN/m3) Ys (kN/m3) E(Mpa) v σt (Mpa) c (kPa) θ (….o)Mud 20.10 24.26 433 0.42 0.05 84 13Claystone-1 20.04 21.03 542 0.35 0.06 140 20Seam-A 13.00 13.20 450 0.30 0.04 105 16Claystone-2 20.03 20.93 612 0.34 0.11 175 22Seam-b 13.00 13.20 450 0.30 0.04 105 16Claystone-3 20.03 20.93 612 0.34 0.11 175 22
Figure 5. Geological section of line X-A
Figure 6. Geological section of line X-B

70
IndonesIan MInIng Journal Vol. 17, No. 2, June 2014 : 63 - 74
Figure 7. Geological section of line X-C
prior to sliding. The model is then simulated by inputting representative geotechnical parameters from laboratory tests. Simulation is conducted several times by varying the parameters until the derived SF is closed to or equal 1.0.
The landslide at Pit A of Kutai Kertanegara coal mining occurred when mining activity reached depth of 20 m. The designed slope for such the pit was 40°. Landslide material was dominated by mud. Referring to such information, back analysis is conducted to mud material on the site perform-ing saturated ground water table. Laboratory test shows that the mud has cohesion (c) of 84 kPa and slope angle (q) of 13°. Figure 8 illustrates mud material with SF of 0.996 and designed slope with SF of 1.050; when finished, next simulation uses the SF >1.25 for every designed slope.
Simulation which is based on back analysis shows that the designed slope at south sidewall is unstable. The SF is 1.050. Therefore, it requires advance simulation to seek the stable designed slope by modeling various designed slope at various ground water table. The overall slope is modeled using angle of 40, 35, 30 and 25° and the ground water table condition refers to stability chart number 3, 4 and 5 by Hoek and Bray (1981). The chart provides information as follows:- chart number 3 means that the rice field and
part of waste dump should be in dry condition. No inundated water occurs as the infiltrated water will fill rock cavity and weaken such a
material. Yet the trench is needed to catch surface runoff;
- chart number 4 refers to dry condition for the rice field and wet state for waste dump area;
- chart 5 suggests inundated water for both rice field and waste dump area. This condi-tion results in water infiltration, slope burden addition and slope material weakness.
Execution the models using computer program provides a series of slope stability as shown in Table 5 and the models as illustrated in Figure 9. Table 5 affirms that:- it is clear that that for similar ground water
table, the more slightly the slope the more in-creasing the SF. However, such an anomalous occurs for g.w.t. no. 3 when the SF decreases from 1.912 to 1.613 and the slope turns into more slightly. Slope stability is controlled by the slip plane that is developed by ground water table;
- g.w.t. no. 4 performs slope angle of 30 and 20o. At this condition the water table is as high as slope surface even sometimes it is higher than the surface. Referring to such condition, the g.w.t. no. 4 is not convincing to be modeled for slope stability;
- it needs to design slope using SF>1.25 for either overall or mud slopes. Using such a factor, it can be considered that:s no ideal slope for g.w.t. no. 5;s slope for g.w.t. no. 4 can be applied if us-

71
Geotechnical Investigation for Evaluating Coal Mining Design of Pit A ... Agus Nugroho
ing slope angle of 35°. The overall slope retains SF=1.271;
s all alternatives slope design can be ap-plied for g.w.t. no.3. However, to avoid lost of control due to water condition or landslide as a result of extreme rain, it is recommended to use slope angle of 30°.
Similar to Section X-A, pit-plan for Section X-B is also simulated. Section X-B represents eastern part of high wall. Program execution by computer results a model as stated in Figure 10. Simulation
Tabel 5. Slope stability for section X-A
Angel (….o)SF for various ground water
g.w.t. no. 5 g.w.t. no. 5 g.w.t. no. 5Overall slope Mud slope Overall slope Mud slope Overall slope Mud slope
40 1.050 0.996 1.236 1.392 1.446 1.39235 1.112 1.141 1.271 1.592 1.473 1.70330 1.216 1.247 - - 1.539 1.91225 1.441 1.250 - - 1.567 1.613
of Section X-B shows that slope design with SF = 2.418 is stable. Such a condition is higher than that of determined criterion. This means that the mining company can still operate through Seam B. The fact that within such an area is characterized by hard sandstone is an advantage as the slope can sufficiently be supported by such a mate-rial. Though slope design is modeled for stable condition; the company is suggested to build a safety-berm for minimizing rate of rockfall hence miner safety is guaranteed. Based on calculation, the recommended high wall is 45°.
Figure 8. Back analysis and stability of designed slope

72
IndonesIan MInIng Journal Vol. 17, No. 2, June 2014 : 63 - 74
(a) α = 350ground water table type 5
(b) α = 400ground water table type 4
(c) α = 350ground water table type 5
Figure 9. Model for Section X-A
Figure 10. Designed high wall stability for Section X-B
The company designs the west side of low wall using slope angle of 30°. The design slope is then modeled to Section X-C and the result shows that the slope is stable performing SF of 1.359 (Figure 11a). However, the fact that its position is close to Mahakam River and settlements needs to re-evaluate such the angle to avoid the risk of land slide occurrence. It is recommended to minimizing slope angle to 25° as shown in Figure 11b.
Local landslide within this area take place as a result of the emergence of water from Mahakam River to the surface. The water then erodes slope materials to perform big cavity and causes col-lapse. Landslide prevention can be conducted by drilling water seepage and installing the PVC pipe to channel the water. Prior to installing the PVC, the pipe needs to be punched at several spots hence it serves as a filter. Palm fiber is then

73
Geotechnical Investigation for Evaluating Coal Mining Design of Pit A ... Agus Nugroho
inserted to the pipe to prevent slope materials carried by current water. In terms of preventing lost material due to water current, such a handling needs to be conducted immediately.
conclusions
Section X-A that represents the southern part of sidewall retains slope of 40o and SF =1.050. Such a figure refers to unstable slope and needs to be revised by flatting the slope to 30o and SF to 1.539. However, systematic water control in rice cultivation and waste dump is required to get the area dry.
A former design for the eastern part of high wall (section X-B) which performs slope of 45o slope and SF=2.418 is considered stable. No need to modify the slope, nevertheless, a safety berm is needed to support the rockfall.
A slope design for the western part of low wall (section X-C) using slope of 30o and SF =1.359 is relative stable. Yet, the slope has a high risk as it is near settlements and Mahakam River. It is recommended to flat it to 25o with SF=1.523.
acknoWledgemets
The author would like to thank C.V. Jasa Andika for providing the opportunity to conduct such a research within its concession. Thanks also to several colleagues from Application Group of
Mineral and Coal Mining for their valuable insight and criticism which improved the quality of this paper.
references
Anonim, 2006. Limit Equilibrium Slope Stability for Soil and Rock Slopes, Rocscience Inc, 356 p.
Bowles, J.E.1989. Sifat-sifat Fisik dan Geoteknis Ta-nah, Edisi Pertama, Penerbit Erlangga, Jakarta, 562 p.
Brunsden, D., Schortt, L., and Ibsen, M.L., 1997. Landslide Recognition, Identification Movement and Causes, John Wiley & Sons, England, p. 137 – 148
Christady, H. 2010. Mekanika Tanah 2, Gadjah Mada University Press, Yogyakarta, 497 p.
Hirnawan, R. F., 1994. Peran Faktor-faktor Penentu Zona Berpotensi Longsor di Dalam Mandala Geologi dan Lingkungan Fisiknya Jawa Barat, Majalah Ilmiah Universitas Padjadjaran, No. 2, Vol. 12, p. 32-42
Hoek, E., and Bray, J.W., 1981. Rock Slope Engineer-ing, 3rd Edition, IMM, London, 548 p.
Pangular, D., 1985. Petunjuk Penyelidikan dan Penang-gulangan Gerakan Tanah, Pusat Penelitian dan Pengembangan Pengairan, Balitbang Departemen Pekerjaan Umum, 233 p.
Sunggono, K.H., 1984. Mekanika Tanah, Nova, Band-ung, 273 p.
(a) (b)
Figure 11. Designed low-wall stability for Section X-C using dip slope of 30° (a) and recommended low-wall to avoid landslide using dip slope of 25° (b)

74
IndonesIan MInIng Journal Vol. 17, No. 2, June 2014 : 63 - 74
Terzaghi, P. and Mesri, 1996. Soil Mechanics in Engi-neering Practise, John Wiley and Sons, Inc., New York, 592 p.
Verhoef, P.N.W., 1994, Geologi untuk Teknik Sipil, translated by E. Diraatmadja, Erlangga, Jakarta, 322 p.