Embed Size (px)
Citation preview

Journal of Energy and Natural Resources 2014; 3(6): 85-100 Published online December 18, 2014 (http://www.sciencepublishinggroup.com/j/jenr) doi: 10.11648/j.jenr.20140306.12 ISSN: 2330-7366 (Print); ISSN: 2330-7404 (Online)
Correlation among vitrinite reflectance Ro%, pyrolysis parameters, and atomic H/C ratio: Implications for evaluating petroleum potential of coal and carbonaceous materials
Hsien-Tsung Lee*, Li-Chung Sun
Department of Electrical and Information Technology, Nan Kai University of Technology, Nan Tou County, Taiwan
Email address: [email protected] (Hsien-Tsung Lee), [email protected] (Li-Chung Sun)
To cite this article: Hsien-Tsung Lee, Li-Chung Sun. Correlation among Vitrinite Reflectance Ro%, Pyrolysis Parameters, and Atomic H/C Ratio: Implications for Evaluating Petroleum Potential of Coal and Carbonaceous Materials. Journal of Energy and Natural Resources. Vol. 3, No. 6, 2014, pp. 85-100. doi: 10.11648/j.jenr.20140306.12
Abstract: In this study, 26 samples from northwest Taiwan, 12 from Mainland China, 13 from Australia and 39 from literature were jointly examined to explore relationships among pyrolysis parameters, Vitrinite Reflectance Ro%, and Atomic H/C ratio. Samples of mixed high and low maturity coal were combined in proportions determined by the total quantity in the furnace prior to the Rock-Eval analysis and used to explore the correlation between the pyrolysis parameter, Tmax, and the vitrinite reflectance. These average values were then plotted against the corresponding Tmax results. The experimental results revealed that:(1) For low maturity coal samples that were mixed with different proportions of high maturity coal samples, the Tmax values fell within a range of low maturities. Alternativly, for samples containing the reworked sedimentary materials in the rock formation, the Tmax values were similar to the maturity of young material. (2) For sampling or Rock-Eval analysis of the high maturity materials, contamination with low maturity material should be avoided, even in very small amounts. (3) Afterproportional mixing, there was no evidence of a general linear relationship between the average of vitrinite reflectance, Ro%, and the corresponding Tmax value recorded. The atomic H/C ratio, as well as the BI, HI, QI, S1, and S2, generally decreases while the maturity (Tmax (oC); vitrinite reflectance Ro%) increases. The atomic H/C ratio decreases slightly from 1.1 to 0.7 while maturity increased from Ro 0.55% to 0.85%. Samples with atomic H/C ratio within this range show significant change in certain other geochemical parameters (eg. BI, HI, QI, PI, S1, S2, S1+S2, Tmax). Organic matter in the samples studied is of type II/III kerogen based on the relationship between HI and Tmax. The hydrocarbon potential per unit organic carbon (S1+S2/TOC) of the organic matter in this study to be approximately 100~380, similar to the potential of humic coal used in general gas and oil production. This shows that organic matter in an oil window of Ro%=0.55 and atomic H/C=1.1 have reached a certain maturity and hydrocarbon potential. Overall, when the atomic H/C ratio increases, the BI, HI, QI, S1, and S2 also show an increasing trend; therefore, these parameters and atomic H/C ratio show a certain correlation.
Keywords: Atomic H/C Ratio, Vitrinite Reflectance Ro%, Kerogen, Rock-Eval Pyrolysis Tmax, Maceral Analysis, Reworked
1. Introduction
Despite the variety of forms in which organic matter evolves, the most important key in hydrocarbon production is maturity. The process of involves physical and chemical factors such as temperature, pressure, and time, but among them temperature plays the leading role. Bostick (1971, 1974) pointed out that organic matter in sedimentary strata can be used as the thermal index for contact or burial metamorphism,
where the organic matter are heated (burial or tectonic movement) decomposed and then recombined. This process is irreversible and not affected by retrograde metamorphism; it can therefore record the most intensive thermal event in burial history (Tsai, 1988; Lee et al., 2010). Under the heating process, organic matter undergo two opposite reactions at the same time, i.e. condensation of molecular structure and partial bond breakage and degradation. Through time, the side chains and miscellaneous atomic groups in the kerogens

86 Hsien-Tsung Lee and Li-Chung Sun: Correlation among Vitrinite Reflectance Ro%, Pyrolysis Parameters, and Atomic H/C Ratio: Implications for Evaluating Petroleum Potential of Coal and Carbonaceous Materials
break off, while the aromaticity increases due to condensation of aromatic entities and formation of polycyclic aromatic hydrocarbons and the orientation increases, leading to optical changes. In addition, the atomic H/C ratio and the maturity of organic matter changes, thus affecting hydrocarbon potential. In the evaluation of oil and gas potential, organic maturity is one of the most important criteria, and the assessment of organic maturity requires various techniques including fluorescence spectroscopy, HI, Tmax, Ro% and atomic H/C ratio. High atomic H/C ratio is observed since kerogens contain silicate minerals that cannot be removed in the kerogen separation procedure (Baskin, 1997). With regard to this problem, we referred to Dahl et al. (2004) in which TOC is graphed against S2 to calculate the Y-intercept and thus find the point where non-activated carbon content produces no pyrolyzed hydrocarbons; the H% (Y-axis) and C% (X-axis) obtained from the elemental analysis are graphed to find the Y-intercept (representing the hydrogen content when the organic carbon content is zero) to correct the H% value.
Sun et al (2001) used the Gini coefficient to calculate the distribution of the irvitrinite reflectance (Ro%) measurements. This allowed them to obtain quantified values of frequency distribution in order to illustrate the average vitrinite reflectance value of the measured samples and provide quantitative judgments on the deviation of the entire data set. Although this method transforms the vitrinite reflectance measurement into a frequency distribution histogram via numerical conversion, thus highlighting the gap between the average states, a number of problems may still occur. For instance, the method can cause overly broad vitrinite reflectance frequency distribution due to problems that may be caused by the individual who performs the measurement, or by poor functioning of the instrument itself. Additionally, the composition of the sample itself may cause problems, particularly if the sample has a range of different maturities, or if the sample itself is mixed with material of different maturities, such as reworked sedimentary material. The vitrinite reflectance measurement was also used by Kuo (1997) to explore oil and gas potential in western Taiwan. This study suggested a vitrinite reflectance Ro% frequency distribution of many samples that is larger at the two end points can indicate that the research sample is reworked sedimentary material, or that the sample has reworking environment significance. Additional problems with vitrinite reflectance (Ro%) measurements may also been countered when examining reworked sedimentary material using organic maturity indicators. In this situation it is easy to produce a bandwidth phenomenon. These situations raise the questions of; would using the good correlation between vitrinite reflectance and pyrolysis parameter Tmax (Tissot and Welte, 1984; Espitalié et al,1985) be able to deal with the bandwidth phenomenon? And what would the pyrolysis parameter Tmax be in the case of reworked sedimentary material samples?
A vitrinite reflectance (Ro %) value within some effective range is often regarded as a good index to evaluate organic maturity (Tissot, 1984; Hunt, 1996). Similarly, the pyrolysis
parameter, Tmax, is another commonly used index for evaluation (Tissot,1984; Wu Liyan, 1986). Technically, both indices obtain the value of the sample maturity differently. Vitrinite reflectance is obtained by using physical optics measurements; it is mainly restricted to the identification of the material morphology by the observer. Although using the vitrinite reflectance frequency histogram can make up for some of the restrictions of the technique; when the vitrinite reflectance frequency distribution is overly broad, this problem persists and may incorrectly indicate that the sample itself is mixed with different maturity material. For instance, a past study used vitrinite reflectance values to explore the oil and gas potential of Western Taiwan. The study suggested that samples could be identified as reworked sedimentary material, or material with reworking environmental significance, if the frequency distribution of the vitrinite reflectance Ro% values was large at the two end points (Kuo Chenglung, 1997). On the other hand, the Rock-eval pyrolysis parameter, Tmax, is obtained using chemical heating analysis. It is an evaluation method developed by the French Institute of Petroleum (IFP), (Wu Liyan 1986). The biggest advantage of this technique is that it provides rapid data analysis; however the method can sometimes be restricted by the sensitivity of the analysis instrument.
Reworked sedimentary material refers to substances that are formed from sediment, fossil, rock fragments or other substances (Bates and Jackson, 1987). It is formed when materials of old strata deposit on younger strata. Vitrinite reflectance Ro% values tend to increase with increasing strata depth (Stach et al., 1982), thus making it a good index for the assessment of organic maturity (Tissot, 1984). Generally, for reworked sedimentary material, it is believed that when the Ro% value enters the oil window, which ranges from 0.65 to 1.35 (Hunt, 1996), the derived average of vitrinite reflectance Ro% does not accurately reflect the true state of organic maturity. Alternatively, the pyrolysis parameter, Tmax, is the recorded temperature of the S2peak value during the pyrolysis of hydrocarbons in the Rock-Eval instrument occurs (Kuo Chenglung, 1997; Walples, 1985). The hydrocarbon pyrolysis (S2) of reworked sedimentary material should reflect feature with at least two peaks, at this point, how will the pyrolysis parameters Tmax evolve variations? Past studies have shown that the vitrinite reflectance Ro% and the pyrolysis parameter, Tmax, of type-III kerogen have a very strong linear correlation (TeichmÜller and Durand, 1983; Lang Dongsheng, 1999; Hou Dujie and Zhang Linye, 2003); however, the nature of this correlation is unknown for reworked sedimentary materials. This makes it difficult to conduct Rock-Eval analysis on affirmed reworked sedimentary material. This study aimed to clarify this relationship by adopting a simulation experiment. We used coal samples(which are enriched in organic matter) as a base sample, proportionally mixing coal samples with larger high-value and low-value differences in Ro%. We then subjected the mixed sample to Rock-Eval pyrolysis analysis in order to compare the differences with the original samples.

Journal of Energy and Natural Resources 2014; 3(6): 85-100 87
Obtaining geochemical data by heating a small amount of rock powder through pyrolysis process is an important geochemical tool in oil exploration. Nevertheless, the rock itself contains inorganic mineral matrices and the oil pollutants generated in the sampling process will reduce the hydrogen index (HI) value (Udo et al., 1986; Dahl et al., 2004) and affect the assessment for kerogen type and quality (Akinlua et al., 2005; Lee, 2010; Lee, 2011). As a result, when assessing the hydrocarbon potential of kerogens, one should not rely solely on the Rock-Eval pyrolysis parameters from pyrolysis analysis but also graph the atomic H/C ratio, TOC, and Ro% against one another to confirm and double check the results for accurate assessment. In terms of oil and gas potential, vitrinites are gas-prone, exinites are oil-prone, while inertinites have no oil and gas potential (Tissot&Welte, 1984). Stach et al. (1982) believed that vitrinite reflectance increases with the degree of heating because molecules move closer to each other when heated causing a higher reflectance. Rock-Eval pyrolysis is a fast, inexpensive analytical technique that provides useful data but requires only a small number of samples. This advantage allows the technology to be widely used in the analysis of organic matter samples. The pyrolysis results of Li et al. (2003) from the Dongying Depression in Bohai Bay Basin showed that with increased depth, Tmax and PI also exhibited an increase, while TOC and HI showed a decrease. Here, we focused mainly on lithofacies analyses (maceral analysis and measurement of vitrinite reflectance) and geochemical analyses (elemental analysis and Rock-Eval pyrolysis) for organic matter to understand their thermal maturity and assess their hydrocarbon potential. Subsequently, through exploring the relations between the relevant parameters (S1+S2, TOC, HI, atomic H/C ratio, Ro%, Tmax), we tried to shed light on their connections to hydrocarbon potential.
2. Samples and Methods The coal samples for investigation included 26 from
northwestern Taiwan, i.e. coal and carbonaceous shale samples from Nanchuang Formation, Shiti Formation, and Mushan Formation. The coal samples were mainly from beds formed through three sedimentary cycles in the Miocene, while the sedimentary environment for intercalated coal seams is of the regression type (Mao et al., 1988). On the other hand, 13 rock samples were collected from Australia, 12 from Mainland China, including samples from the Paleozoic, Mesozoic and Tertiary Cenozoic eras (Ge et al., 1993), and some from the Uinta and Permian Basins of the United States. According to the field study of Taylor &Ritts (2004) at the Green River Formation of Uinta Basin, Utah, the Green River Formation covers Flagstaff, comprising a continuous lake sediment. Lastly, by taking 39 sample data from literature, we studied how the variations of atomic H/C ratio of kerogens and pyrolysis parameters can be used to elucidate the impact of changes in atomic H/C ratio on the hydrocarbon potential of organic matter.
The material study starts from the collection of coal samples with maturity close to the early oil window, various
maceral groups were then prepared by using density centrifuge-separation. Coal briquettes were prepared according to the standard production procedure set forth in ASTM (1975). The coal samples were first crushed and filtered through a No.20 sieve, then mixed with glue and placed in a round steel mold to dry and harden. The hardened and dried briquettes were then polished (Ting, 1978; Sun, 2000). In accordance with the work of Su (2001), Sun (2000), and Dormans et al. (1957); zinc chloride was used as a density liquid for centrifuge-separations. Density of less than 1.25 denotes a concentrate of exinite, and density of 1.25–1.35 denotes a concentrate of vitrinite .Maceral analysis and vitrinite reflectance measurements were performed on polished pellets using a Leitz MPV Compact Microscope (light source 12 V, 100 W; wavelength 546 nm; refractive index of soak oil, Ne = 1.5180). Optical microscope was used to identify three main maceral groups (exinite, vitrinite, andinertinite), as well as inorganic minerals (pyrite and clay minerals) through point counting. According to ASTM standard (1980) and Bustin (1991), each sample was made into two pellets, and each pellet requires 200 point counts; a mean value should also be calculated. In addition, 100 random points (Rstd%) were measured in each pellet, and the mean value of the 100 points was calculated. Therefore, two mean values of the same sample were averaged to obtain the vitrinite reflectance (Ro%) value.
Geochemical analysis using elemental analysis (Elemental analyzer of Germany Heraeus Vario EL model, Accuracy ± 0.1%, Precision ±0.2%) to determine C, H, N, and S contents. The mineral of carbonate and silica-gel can be identified microscopically and removed by additional hydrochloric and hydrofluoric acid treatments. Samples were first transformed into the irgaseous forms (N2, H2O, CO2, and SO2), and then the segases (H2O, CO2, and SO2) were adsorbed/desorbed through individual adsorption and desorption tubes. Finally, the weight percentage of C, H, N, and S wasobtained through a detection system. Rock-Eval pyrolysisis a standard pyrolysis method for assessing source rocks (Espitalie et al. 1977). In this study, Rock-Eval II was used for the pyrolysis analysis, and FID (flame ionization detector, Calibration sample IFP 55000, S2 = 8.62 mgHC/g rock, S3 = 1.00 mg CO2/g rock, TOC = 2.86%,Tmax = 419oC) was used in the process to detect volatilized hydrocarbons (S1) and organic matters from pyrolyzed hydrocarbons (S2), as shown in Table 1.Organic matter have the same maturity but different hydrocarbon potentials, the maceral compositions were compared with the results of their pyrolysis and elemental analysis, so as to study the mechanism of hydrocarbon generation.
The content percentage of the three macerals (exinite, vitrinite and inertinite) from the maceral analysis was then used to estimate the atomic H/C ratios of the collected samples (Jones and Edison, 1978). The hydrogen and carbon content obtained from the elemental analysis could also be used to calculate the atomic H/C ratios. Furthermore, the hydrocarbon potential (S1+S2) and TOC values from the pyrolysis analysis could be used to calculate the hydrocarbon potential per unit

88 Hsien-Tsung Lee and Li-Chung Sun: Correlation among Vitrinite Reflectance Ro%, Pyrolysis Parameters, and Atomic H/C Ratio: Implications for Evaluating Petroleum Potential of Coal and Carbonaceous Materials
organic carbon (S1+S2/TOC). By graphing H% (Y-axis) against C% (X-axis) from the elemental analysis, the obtained Y-intercept (representing the hydrogen content when the organic carbon content is zero) could be used to correct the H% value, as shown in Table 2. Next, by using the atomic H/C ratio, the pyrolysis parameters HI, S1, S2, S1+S2,S1/(S1+S2), S1/TOC, (S1+S2)/TOC, and Tmax were graphed against TOC And Ro% to explore the relations between atomic H/C ratios and the various pyrolysis parameters.
The mixed samples were prepared according to the weight ratio using coal sample swith high and low maturities from Mainland China (Jiao-Zuo Coal: Ro% of 3.34 ~3.77;Fu-Xin Coal: Ro% of 0.58 ~ 0.65). These samples were then subjected to Rock-Eval pyrolysis analysis. The analysis of the samples was performed by the Exploration & Development Research Institute of the CPC Corporation, Taiwan. 10mg of each mixed sample was inserted into the furnace. The mixed proportions of the samples were based on the sample number and proportion, as shown in Table 3.
This study used simulation experimentation. We used coal samples, which are organic matter enriched material, as the
basis of the sample. The two types of coal samples used as simulation materials were Jiao-Zuo Coal (Ro% average value = 3.43)and Fu-Xin coal (Ro% average value = 0.61), both sourced from Mainland China. In accordance with the mixing proportion, the mixed samples were subjected to Rock-Eval pyrolysis analysis and compared with the original samples. At the same time, the vitrinite reflectance data points of these two coals with the same mixing proportion and random sampling were averaged (50 points each) after blending; for each mixed sample, average readings were taken as representative after 1,000 times measurements and the results were plotted against the corresponding Tmax results.The conductance of the Rock-Eval analysis and vitrinite reflectance measurements of the samples were entrusted to the Research Institute of Petroleum Exploration and Development (RIPED), CNPC. The sample numbers are as follows: 1. (H = Jiao-Zuo Coal original sample); 2. (H95: L5 mixed samples); 3. (H90: L10 mixed samples); 4.(H80: L20 mixed samples); 5 (H70: L30 mixed samples); 6. (L = Fu-Xin Coal original sample).
Table 1. The parameters when atomic H/C ratio=0.7~1.11
Parameter5 All2 Taiwan3 Mainland China3 Australia3 Others4 Ro% 0.72~0.26 0.95~0.35 0.8~0.5 1.4(1 sample) 0.72~0.4 HI (mg/g) 25~445 75~340 52~165 50(1 sample) 25~445 S1+S2 (mg/g) 20~235 45~235 60~145 ----- 20~220 BI (mg/g) 0.01~14 2~5 1~3 ----- 0.01~14 QI (mg/g) 35~415 70~375 70~170 80(1 sample) 35~415 PI (mg/g) 0.005~0.072 0.03~0.06 0.01~0.035 0.36(1 sample) 0.005~0.072 Tmax (oC) 395~510 414~480 418~435 418(1 sample) 395~510 TOC (%) 0.26~80 45~80 62~73 0.36(1 sample) 0.26~76 S2 (mg/g) 0.12~242 50~230 20~150 0.12(1 sample) 0.15~220 S1 (mg/g) 0.01~15 2~4 1~2.4 0.01(1 sample) 0.03~15
Note 1.Considering all samples and graphing H/C ratio against each parameter, the result shows that each parameter exhibits significant variations when H/C=0.7~1.1. 2.”All” includes all samples from Taiwan, Mainland China, Australia and other reference sample data. 3.”Taiwan” denotes the sample data from Taiwan; “Mainland China” denotes that from Mainland China; “Australia” denotes that from Australia. 4.”Other” refers to the use of sample data from other references (Wang, 1998; Xiao et al., 1996; Xiao, 1997). 5. HI: S2 / TOC; QI: (S1+S2) / TOC; BI: S1 / TOC; PI: S1 / S1+S2
Table 2. The Ro, H/C ratio, HI, QI, TOC,V, E, and (S1+S2) values of samples analyzed in this study
Sample S1+S2 TOC QI HI V E H/C(1) H/C(2)
Tmax Ro No. (mg/g) (wt%) (mg/g) (mg/g) (%) (%) (oC) (%) A0 1.2 0.7 159.2 118.1 1.0 0.0 0.25 0.18 437 1.63 A1 0.3 0.4 67.6 40.2 1.0 0.0 0.26 0.25 407 1.61 A2 0.3 0.4 70.2 45.4 0.4 0.2 0.70 0.63 416 1.40 A3 3.2 1.7 184.1 168.3 2.4 0.2 2.54 2.15 434 1.14 A4 5.1 4.2 377.1 285.2 20.8 0.4 1.85 1.63 426 1.23 A5 4.1 1.9 213.3 199.1 1.8 1.8 2.11 1.82 433 1.02 A6 3.2 1.7 182.5 167.2 1.6 0.6 1.52 1.46 434 0.77 A7 3.6 3.8 282.2 220.5 18.8 0.4 1.48 1.34 426 0.86 A8 2.8 18.3 16.3 14.4 61.4 0.6 1.94 1.67 433 1.08 A9 1.2 2.0 59.6 50.6 4.6 1.0 1.75 1.72 432 0.84 01 112.6 75.2 149.8 148.1 60.6 5.0 0.78 0.73 434 0.74 02 84.2 62.6 134.5 133.4 95.0 1.0 1.04 0.83 431 0.53 03 140.3 67.7 207.2 205.3 68.8 2.4 0.89 0.62 429 0.58 14 81.1 44.3 183.2 177.1 53.2 1.2 1.18 0.47 430 0.39 15 37.7 18.6 202.9 196.4 30.2 1.4 1.36 0.28 425 0.52 16 68.3 43.2 158.0 155.2 66.2 0.6 1.08 0.57 427 0.52 17 1.6 2.2 73.7 70.5 3.8 0.0 1.86 0.03 433 0.36 18 177.6 79.2 224.2 221.2 93.2 1.2 0.90 0.81 437 0.74
Journal of Energy and Natural Resources 2014; 3(6): 85-100 89
Sample S1+S2 TOC QI HI V E H/C(1) H/C(2)
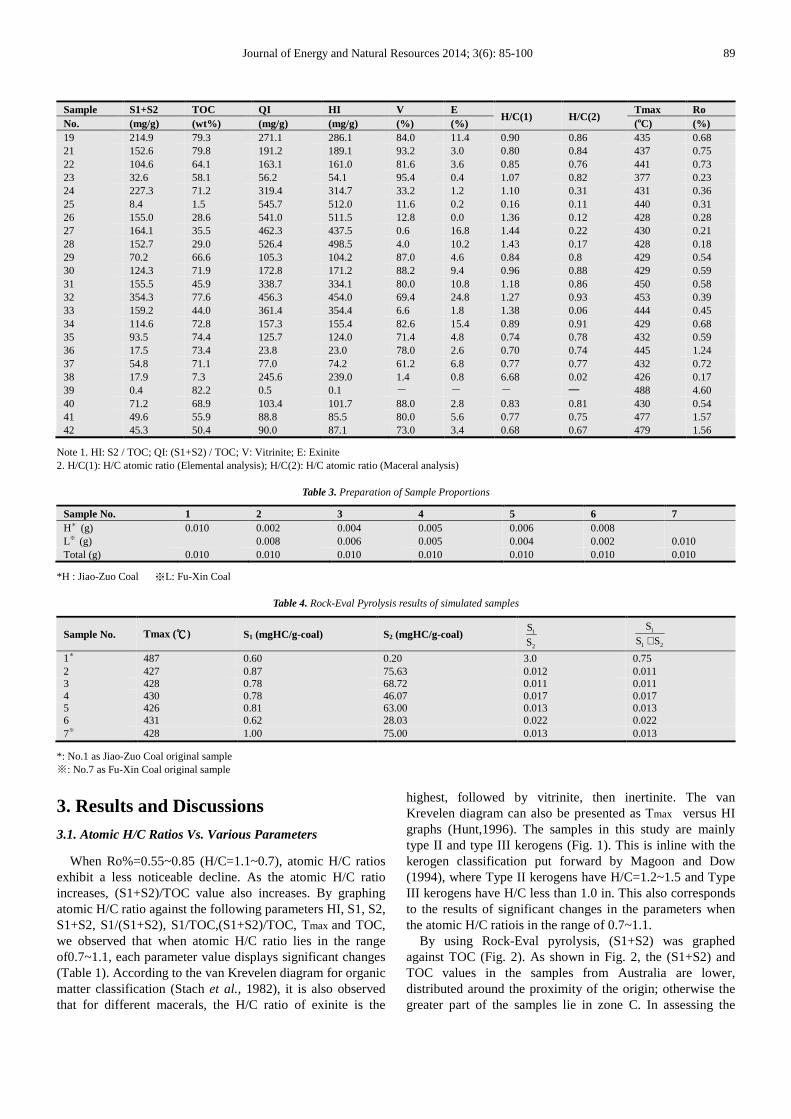
Tmax Ro No. (mg/g) (wt%) (mg/g) (mg/g) (%) (%) (oC) (%) 19 214.9 79.3 271.1 286.1 84.0 11.4 0.90 0.86 435 0.68 21 152.6 79.8 191.2 189.1 93.2 3.0 0.80 0.84 437 0.75 22 104.6 64.1 163.1 161.0 81.6 3.6 0.85 0.76 441 0.73 23 32.6 58.1 56.2 54.1 95.4 0.4 1.07 0.82 377 0.23 24 227.3 71.2 319.4 314.7 33.2 1.2 1.10 0.31 431 0.36 25 8.4 1.5 545.7 512.0 11.6 0.2 0.16 0.11 440 0.31 26 155.0 28.6 541.0 511.5 12.8 0.0 1.36 0.12 428 0.28 27 164.1 35.5 462.3 437.5 0.6 16.8 1.44 0.22 430 0.21 28 152.7 29.0 526.4 498.5 4.0 10.2 1.43 0.17 428 0.18 29 70.2 66.6 105.3 104.2 87.0 4.6 0.84 0.8 429 0.54 30 124.3 71.9 172.8 171.2 88.2 9.4 0.96 0.88 429 0.59 31 155.5 45.9 338.7 334.1 80.0 10.8 1.18 0.86 450 0.58 32 354.3 77.6 456.3 454.0 69.4 24.8 1.27 0.93 453 0.39 33 159.2 44.0 361.4 354.4 6.6 1.8 1.38 0.06 444 0.45 34 114.6 72.8 157.3 155.4 82.6 15.4 0.89 0.91 429 0.68 35 93.5 74.4 125.7 124.0 71.4 4.8 0.74 0.78 432 0.59 36 17.5 73.4 23.8 23.0 78.0 2.6 0.70 0.74 445 1.24 37 54.8 71.1 77.0 74.2 61.2 6.8 0.77 0.77 432 0.72 38 17.9 7.3 245.6 239.0 1.4 0.8 6.68 0.02 426 0.17 39 0.4 82.2 0.5 0.1 - - - ─ 488 4.60 40 71.2 68.9 103.4 101.7 88.0 2.8 0.83 0.81 430 0.54 41 49.6 55.9 88.8 85.5 80.0 5.6 0.77 0.75 477 1.57 42 45.3 50.4 90.0 87.1 73.0 3.4 0.68 0.67 479 1.56
Note 1. HI: S2 / TOC; QI: (S1+S2) / TOC; V: Vitrinite; E: Exinite 2. H/C(1): H/C atomic ratio (Elemental analysis); H/C(2): H/C atomic ratio (Maceral analysis)
Table 3. Preparation of Sample Proportions
Sample No. 1 2 3 4 5 6 7 H* (g) 0.010 0.002 0.004 0.005 0.006 0.008 L※ (g) 0.008 0.006 0.005 0.004 0.002 0.010 Total (g) 0.010 0.010 0.010 0.010 0.010 0.010 0.010
*H : Jiao-Zuo Coal ※L: Fu-Xin Coal
Table 4. Rock-Eval Pyrolysis results of simulated samples
Sample No. Tmax (℃℃℃℃) S1 (mgHC/g-coal) S2 (mgHC/g-coal) 1
2
S
S 1
1 2
S
S S+
1* 487 0.60 0.20 3.0 0.75 2 427 0.87 75.63 0.012 0.011 3 428 0.78 68.72 0.011 0.011 4 430 0.78 46.07 0.017 0.017 5 426 0.81 63.00 0.013 0.013 6 431 0.62 28.03 0.022 0.022 7※ 428 1.00 75.00 0.013 0.013
*: No.1 as Jiao-Zuo Coal original sample ※: No.7 as Fu-Xin Coal original sample
3. Results and Discussions 3.1. Atomic H/C Ratios Vs. Various Parameters
When Ro%=0.55~0.85 (H/C=1.1~0.7), atomic H/C ratios exhibit a less noticeable decline. As the atomic H/C ratio increases, (S1+S2)/TOC value also increases. By graphing atomic H/C ratio against the following parameters HI, S1, S2, S1+S2, S1/(S1+S2), S1/TOC,(S1+S2)/TOC, Tmax and TOC, we observed that when atomic H/C ratio lies in the range of0.7~1.1, each parameter value displays significant changes (Table 1). According to the van Krevelen diagram for organic matter classification (Stach et al., 1982), it is also observed that for different macerals, the H/C ratio of exinite is the
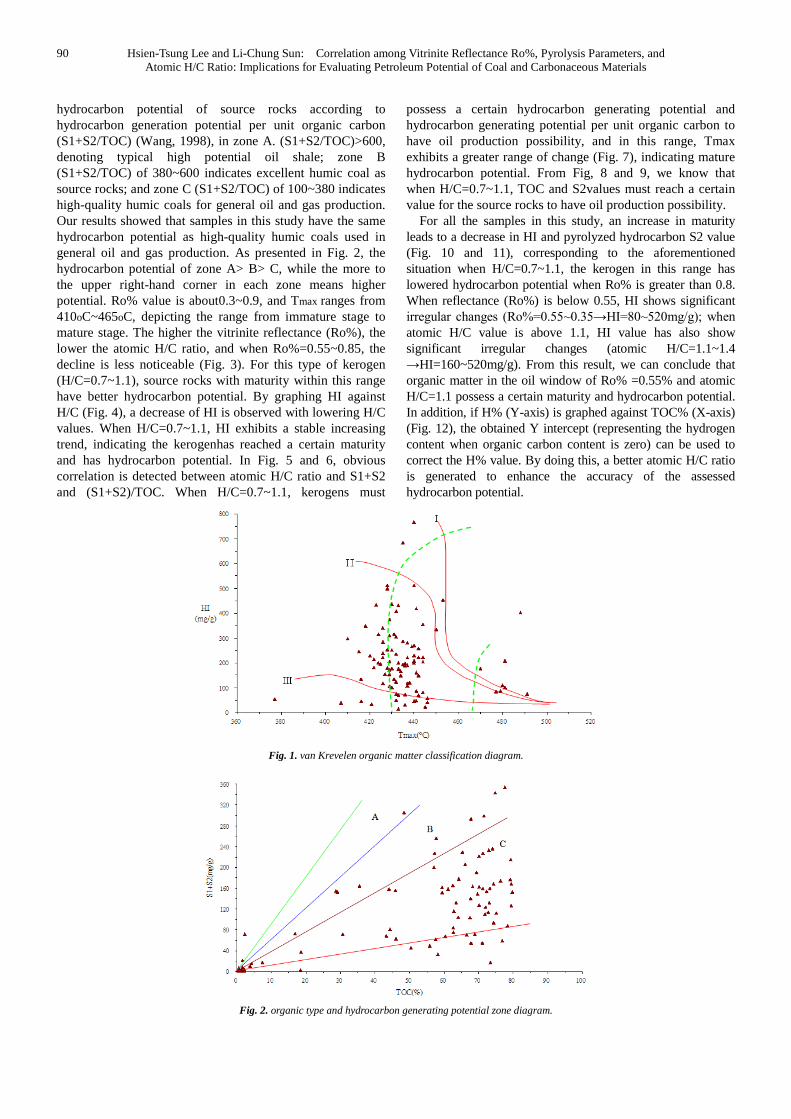
highest, followed by vitrinite, then inertinite. The van Krevelen diagram can also be presented as Tmax versus HI graphs (Hunt,1996). The samples in this study are mainly type II and type III kerogens (Fig. 1). This is inline with the kerogen classification put forward by Magoon and Dow (1994), where Type II kerogens have H/C=1.2~1.5 and Type III kerogens have H/C less than 1.0 in. This also corresponds to the results of significant changes in the parameters when the atomic H/C ratiois in the range of 0.7~1.1.
By using Rock-Eval pyrolysis, (S1+S2) was graphed against TOC (Fig. 2). As shown in Fig. 2, the (S1+S2) and TOC values in the samples from Australia are lower, distributed around the proximity of the origin; otherwise the greater part of the samples lie in zone C. In assessing the
90 Hsien-Tsung Lee and Li-Chung Sun: Correlation among Vitrinite Reflectance Ro%, Pyrolysis Parameters, and Atomic H/C Ratio: Implications for Evaluating Petroleum Potential of Coal and Carbonaceous Materials
hydrocarbon potential of source rocks according to hydrocarbon generation potential per unit organic carbon (S1+S2/TOC) (Wang, 1998), in zone A. (S1+S2/TOC)>600, denoting typical high potential oil shale; zone B (S1+S2/TOC) of 380~600 indicates excellent humic coal as source rocks; and zone C (S1+S2/TOC) of 100~380 indicates high-quality humic coals for general oil and gas production. Our results showed that samples in this study have the same hydrocarbon potential as high-quality humic coals used in general oil and gas production. As presented in Fig. 2, the hydrocarbon potential of zone A> B> C, while the more to the upper right-hand corner in each zone means higher potential. Ro% value is about0.3~0.9, and Tmax ranges from 410oC~465oC, depicting the range from immature stage to mature stage. The higher the vitrinite reflectance (Ro%), the lower the atomic H/C ratio, and when Ro%=0.55~0.85, the decline is less noticeable (Fig. 3). For this type of kerogen (H/C=0.7~1.1), source rocks with maturity within this range have better hydrocarbon potential. By graphing HI against H/C (Fig. 4), a decrease of HI is observed with lowering H/C values. When H/C=0.7~1.1, HI exhibits a stable increasing trend, indicating the kerogenhas reached a certain maturity and has hydrocarbon potential. In Fig. 5 and 6, obvious correlation is detected between atomic H/C ratio and S1+S2 and (S1+S2)/TOC. When H/C=0.7~1.1, kerogens must
possess a certain hydrocarbon generating potential and hydrocarbon generating potential per unit organic carbon to have oil production possibility, and in this range, Tmax exhibits a greater range of change (Fig. 7), indicating mature hydrocarbon potential. From Fig, 8 and 9, we know that when H/C=0.7~1.1, TOC and S2values must reach a certain value for the source rocks to have oil production possibility.
For all the samples in this study, an increase in maturity leads to a decrease in HI and pyrolyzed hydrocarbon S2 value (Fig. 10 and 11), corresponding to the aforementioned situation when H/C=0.7~1.1, the kerogen in this range has lowered hydrocarbon potential when Ro% is greater than 0.8. When reflectance (Ro%) is below 0.55, HI shows significant irregular changes (Ro%=0.55~0.35→HI=80~520mg/g); when atomic H/C value is above 1.1, HI value has also show significant irregular changes (atomic H/C=1.1~1.4 →HI=160~520mg/g). From this result, we can conclude that organic matter in the oil window of Ro% =0.55% and atomic H/C=1.1 possess a certain maturity and hydrocarbon potential. In addition, if H% (Y-axis) is graphed against TOC% (X-axis) (Fig. 12), the obtained Y intercept (representing the hydrogen content when organic carbon content is zero) can be used to correct the H% value. By doing this, a better atomic H/C ratio is generated to enhance the accuracy of the assessed hydrocarbon potential.
Fig. 1. van Krevelen organic matter classification diagram.
Fig. 2. organic type and hydrocarbon generating potential zone diagram.

Journal of Energy and Natural Resources 2014; 3(6): 85-100 91
Fig. 3.hydrocarbon atomic ratio (H/C) vs. vitrinite reflectance (%Ro).
Fig. 4. hydrogen index (HI) vs. hydrocarbon atomic ratio (H/C).
Fig. 5. hydrocarbon generating potential (S1+S3)vs. hydrocarbon atomic ratio (H/C).

92 Hsien-Tsung Lee and Li-Chung Sun: Correlation among Vitrinite Reflectance Ro%, Pyrolysis Parameters, and Atomic H/C Ratio: Implications for Evaluating Petroleum Potential of Coal and Carbonaceous Materials
Fig. 6. hydrocarbon generating potential per unit organic carbon vs. .hydrocarbon atomic ratio (H/C).
Fig. 7. Tmax (oC) vs. hydrocarbon atomic ratio (H/C).
Fig. 8. total organic carbon (TOC%) vs. hydrocarbon atomic ratio (H/C).

Journal of Energy and Natural Resources 2014; 3(6): 85-100 93
Fig. 9. pyrolyzed hydrocarbons (S2) vs. hydrocarbon atomic ratio (H/C).
Fig. 10. hydrogen index (HI) vs. vitrinite relflectance (%Ro).
Fig. 11. pyrolyzed hydrocarbons (S2) vs. vitrinite relflectance (%Ro).

94 Hsien-Tsung Lee and Li-Chung Sun: Correlation among Vitrinite Reflectance Ro%, Pyrolysis Parameters, and Atomic H/C Ratio: Implications for Evaluating Petroleum Potential of Coal and Carbonaceous Materials
Fig. 12. hydrogen content (H%(wt%)) against total organic carbon (TOC%).
3.2. Hydrocarbon Potential Evaluation of Organic Materials
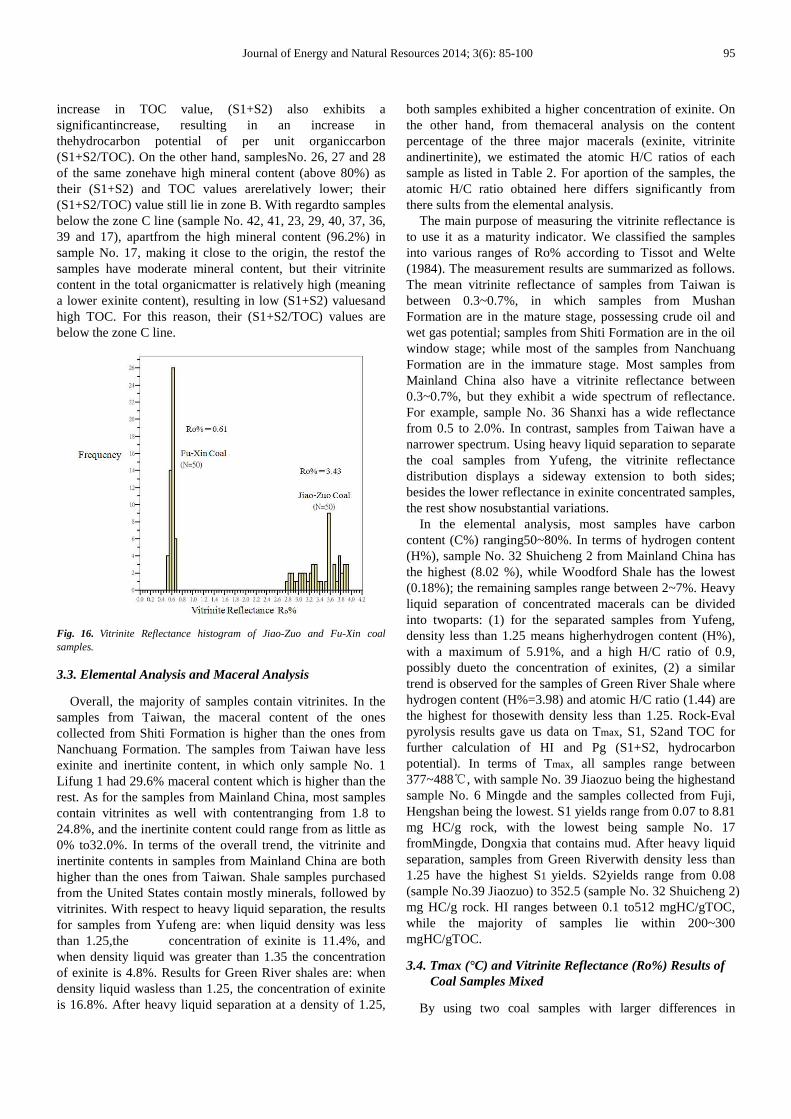
By graphing hydrogen index (HI) against atomic H/C ratio, we showed that when the atomic H/C ratio is greater than 0.4, the HI and the atomic H/C ratio exhibit a certain correlation (Fig. 13 and Fig. 14). However, when atomic H/C ratio less than 0.4 (sample No.17, 38, 33, 25, 26, 27, 28, 24 and 15), the H/C ratio versus HI graphs mapped from the results of maceral analysis and elemental analysis display significant differences. This can be attributed to the high mineral content and low maceral content in the samples (Fig. 15). When the sample has high mineral content, hydrous silicate would release hydrogen in the combustion process, resulting in abnormally high atomic H/C ratio (Table 2) in the elemental analysis (Fig. 16). In contrast, low maceral content gives rise to a lower atomic H/C ratio in the maceral analysis. In addition, all of the samples can only produce a certain amount of S2,therefore, when the total organic carbon (TOC) in the sample is low, it may produce a high HI value. This condition of low atomic H/C ratio and high HI is depicted in Fig. 13. For this reason, we should be more cautious when using HI and atomic H/C ratio, the so-called“hydrocarbon generating potential”, to assess hydrocarbon potential of organic matter.
Fig. 13. hydrogen index and microscopic analysis of maceral H/C atomic ratio.
Fig. 14. hydrogen index and elemental analysis of H/C atomic ratio.
Fig.15. Rock-Eval Pyrolysis Parameter Tmax distribution of coal mixed samples.
Fig. 2 shows the hydrocarbon potential of zone A>B>C where the upperright-handcorner means higher potential. From our results, sample No. 32 Shuicheng2 in zone B has thehighest hydrocarbon potential, with low mineral content and high organic matter content(exinite and vitrinite), particularly in exinite (or H) content; therefore, besides an
Journal of Energy and Natural Resources 2014; 3(6): 85-100 95
increase in TOC value, (S1+S2) also exhibits a significantincrease, resulting in an increase in thehydrocarbon potential of per unit organiccarbon (S1+S2/TOC). On the other hand, samplesNo. 26, 27 and 28 of the same zonehave high mineral content (above 80%) as their (S1+S2) and TOC values arerelatively lower; their (S1+S2/TOC) value still lie in zone B. With regardto samples below the zone C line (sample No. 42, 41, 23, 29, 40, 37, 36, 39 and 17), apartfrom the high mineral content (96.2%) in sample No. 17, making it close to the origin, the restof the samples have moderate mineral content, but their vitrinite content in the total organicmatter is relatively high (meaning a lower exinite content), resulting in low (S1+S2) valuesand high TOC. For this reason, their (S1+S2/TOC) values are below the zone C line.
Fig. 16. Vitrinite Reflectance histogram of Jiao-Zuo and Fu-Xin coal samples.
3.3. Elemental Analysis and Maceral Analysis
Overall, the majority of samples contain vitrinites. In the samples from Taiwan, the maceral content of the ones collected from Shiti Formation is higher than the ones from Nanchuang Formation. The samples from Taiwan have less exinite and inertinite content, in which only sample No. 1 Lifung 1 had 29.6% maceral content which is higher than the rest. As for the samples from Mainland China, most samples contain vitrinites as well with contentranging from 1.8 to 24.8%, and the inertinite content could range from as little as 0% to32.0%. In terms of the overall trend, the vitrinite and inertinite contents in samples from Mainland China are both higher than the ones from Taiwan. Shale samples purchased from the United States contain mostly minerals, followed by vitrinites. With respect to heavy liquid separation, the results for samples from Yufeng are: when liquid density was less than 1.25,the concentration of exinite is 11.4%, and when density liquid was greater than 1.35 the concentration of exinite is 4.8%. Results for Green River shales are: when density liquid wasless than 1.25, the concentration of exinite is 16.8%. After heavy liquid separation at a density of 1.25,
both samples exhibited a higher concentration of exinite. On the other hand, from themaceral analysis on the content percentage of the three major macerals (exinite, vitrinite andinertinite), we estimated the atomic H/C ratios of each sample as listed in Table 2. For aportion of the samples, the atomic H/C ratio obtained here differs significantly from there sults from the elemental analysis.
The main purpose of measuring the vitrinite reflectance is to use it as a maturity indicator. We classified the samples into various ranges of Ro% according to Tissot and Welte (1984). The measurement results are summarized as follows. The mean vitrinite reflectance of samples from Taiwan is between 0.3~0.7%, in which samples from Mushan Formation are in the mature stage, possessing crude oil and wet gas potential; samples from Shiti Formation are in the oil window stage; while most of the samples from Nanchuang Formation are in the immature stage. Most samples from Mainland China also have a vitrinite reflectance between 0.3~0.7%, but they exhibit a wide spectrum of reflectance. For example, sample No. 36 Shanxi has a wide reflectance from 0.5 to 2.0%. In contrast, samples from Taiwan have a narrower spectrum. Using heavy liquid separation to separate the coal samples from Yufeng, the vitrinite reflectance distribution displays a sideway extension to both sides; besides the lower reflectance in exinite concentrated samples, the rest show nosubstantial variations.
In the elemental analysis, most samples have carbon content (C%) ranging50~80%. In terms of hydrogen content (H%), sample No. 32 Shuicheng 2 from Mainland China has the highest (8.02 %), while Woodford Shale has the lowest (0.18%); the remaining samples range between 2~7%. Heavy liquid separation of concentrated macerals can be divided into twoparts: (1) for the separated samples from Yufeng, density less than 1.25 means higherhydrogen content (H%), with a maximum of 5.91%, and a high H/C ratio of 0.9, possibly dueto the concentration of exinites, (2) a similar trend is observed for the samples of Green River Shale where hydrogen content (H%=3.98) and atomic H/C ratio (1.44) are the highest for thosewith density less than 1.25. Rock-Eval pyrolysis results gave us data on Tmax, S1, S2and TOC for further calculation of HI and Pg (S1+S2, hydrocarbon potential). In terms of Tmax, all samples range between 377~488℃, with sample No. 39 Jiaozuo being the highestand sample No. 6 Mingde and the samples collected from Fuji, Hengshan being the lowest. S1 yields range from 0.07 to 8.81 mg HC/g rock, with the lowest being sample No. 17 fromMingde, Dongxia that contains mud. After heavy liquid separation, samples from Green Riverwith density less than 1.25 have the highest S1 yields. S2yields range from 0.08 (sample No.39 Jiaozuo) to 352.5 (sample No. 32 Shuicheng 2) mg HC/g rock. HI ranges between 0.1 to512 mgHC/gTOC, while the majority of samples lie within 200~300 mgHC/gTOC.
3.4. Tmax (°C) and Vitrinite Reflectance (Ro%) Results of Coal Samples Mixed
By using two coal samples with larger differences in

96 Hsien-Tsung Lee and Li-Chung Sun: Correlation among Vitrinite Reflectance Ro%, Pyrolysis Parameters, and Atomic H/C Ratio: Implications for Evaluating Petroleum Potential of Coal and Carbonaceous Materials
maturity, mixed samples wereprepared in calculated proportions and then subjected to Rock-Eval pyrolysis analysisin order to explore the change and impact on Tmax. The experimental results (Table 4): The Tmax values of the original samples with high and low maturities were490 °C and 428 °C, respectively; the average Tmax value of the other five mixedsamples was 428.4 °C. This demonstrated that all of the mixed samplespresented Tmax values similar to the original sample with low maturity. The resultsalso indicated that regardless of the mixing proportion of low maturity sample to highmaturity sample, all of the mixed samples presented Tmax characteristics of lowmaturity samples.
The pyrolysis parameter, Tmax, is determined mainly by the S2 peak position(hydrocarbons derived from kerogen pyrolysis) (Espitalié et al., 1977; 1985). In the experimental results, when the high maturity original sample was mixed proportionally with low maturity sample, the S2 values of the former sample did not significantly affect the S2 value of the original low maturity sample (Table 4). Thisnon-significant change of the peak value temperature was due to the low S2
of thehigh maturity sample. After mixing, despite the increase in the proportion of high maturity sample(Table 3), the overall S2 value exhibited a downward trend (Table 4). However, the temperature of S2 peak was still determined by the low maturity sample, such that, when the Rock-Eval pyrolysis instrument was producing curves it took the S2 of low maturity material as the main contribution and merged with it the S2 of high mature material (low volume), giving smooth results.
This study also used the proportional mixing of two different kinds of maturity coal samples to simulate the changes in the Tmax and vitrinite reflectance of reworked sedimentary material. After mixing and being subjected to Rock-Eval pyrolysis analysis, the vitrinite reflectance measurement was performed on the original coal samples. The experimental results are outlined in Table 5 and discussed below:
(1) Rock-Eval pyrolysis analysis: In the results of this pyrolysis analysis, Jiao-ZuoCoal is the main body of the mixing proportion of the two coals as Jiao-Zuo coal is a high maturity coal sample. The amount of pyrolyzed hydrocarbon S2 waslower, whereas the Tmax value should be higher. However, the Tmax values are determined by the peak of S2(Bates, 1987; Teichmüller and Durand, 1983).Therefore, by using the low-maturity Fu-Xin coal sample, wich has a higheramount of pyrolysis hydrocarbon S2, as the main component of the mixed sample the Tmax value of high maturity Jiao-Zuo coal cannot be easily observed.
TheRock-Eval pyrolysis results obtained after proportional mixing of the two coal samples showed (Fig. 15): 1. The high maturity Jiao-Zuo Coal (H) had a Tmax value of 552 °C and the low maturity Fu-Xin coal sample (L) had a Tmax value of439 °C. When the mixing proportion was H: L = 95:05 (Tmax = 512 °C), abimodal phenomenon appeared and the result was closer to the Tmax of Jiao-Zuo coal (high maturity). 2. When the mixing proportion was H: L = 90:10 (Tmax =440 ° C) bimodal phenomenon also appeared, however is the result was closer to the Tmax of Fu-Xin coal (low maturity). When the mixing proportion of H was less than 90%, all of the Tmax values recorded were similar to the low maturity Fu-Xin coal.
(2) Vitrinite reflectance: 1. 50 points of measurement were assessed to obtain the vitrinite reflectance measurement of the Jiao-Zuo coal sample and the Fu-Xin coal sample and the average Ro% values were respectively 3.43 and 0.61 (Fig. 16). 2. According to the original mixing proportion, as determined by the pyrolysis analysis and using random sampling, 50 measured points respectively that complied with the proportion were taken and then averaged. Each sample with mixing proportion was taken in this manner for 1000 times and then the average was calculated as the vitrinite reflectance results after proportional mixing. The results for mixed samples are as follows (Fig. 17): Sample no. 2 (mixed sample)had an Ro% of 3.32; sample no. 3 (mixed sample) had an Ro% of 3.15; sample no.4 (mixed sample) had an Ro% of 2.87; sample no. 5 (mixed sample) had an Ro% of 2.59. Besides, each Ro% value of randomly mixed proportion was stable. As the vitrinite reflectance measured point of low maturity increased, the vitrinite reflectance results of mixed samples showed a linear decline. Not quite unexpectedly one obtains a approximate "mixing line" for the Vitrinite Reflectance values: Ro% (xH)= xH*3.5 + (1-xH)*0.6in the figure 17 (xH: the mixing proportion of high maturity Jiao-Zuo original coal sample). Nevertheless, several mixed samples continued to show high maturity characteristics. 3. The vitrinite reflectance results of the original samples and mixed samples, as well as the corresponding Tmax values, were placed on a plot of good correlation (Lang Dongsheng et al, 1999). The results display that in more extreme cases (mixed samples comprising of substrates with highly different maturities), the relationship of mixed samples deviates from the general linear trajectory (Fig. 18). This suggests that when extracting strata samples that contain reworked sedimentary materials, the Tmax measurement of the sample is likely to reflect the maturity of the younger materials present.
Table 5. Rock-Eval Pyrolysis and Vitrinite Reflectance results obtained from mixed coal samples
Sample No. Tmax ((((℃℃℃℃)))) S1(mg/g) S2(mg/g) Ro% No.1 (Jiao-Zuo Original Coal Sample, H ) 552 0.41 2.40 3.43 No.2 H95:L5 Mixed Sample 512 0.34 6.19 3.32**** No.3 H90:L10 Mixed Sample 440 0.32 9.45 3.15 No.4 H80:L20 Mixed Sample 440 0.50 17.99 2.87 No.5 H70:L30 Mixed Sample 441 0.70 26.53 2.59 No.6 (Fu-Xin Original Coal Sample, L ) 439 1.84 86.12 0.61
*:Ro% of Sample No.2 is derived from the results of H96:L4.

Journal of Energy and Natural Resources 2014; 3(6): 85-100 97
Fig. 17. Vitrinite reflectance Ro% of simulation different proportion of coal mixed samples. Show the approximate "mixing line" for the Vitrinite Reflectance values: Ro%(xH)= xH*3.5 + (1-xH)*0.6(xH: the mixing proportion of high maturity Jiao-Zuo original coal sample).
Fig.18.Correlation between Tmax temperature and vitrinite reflectance for type-III kerogen (Adapted from TeichmÜller and Durand, 1983).
3.5. Vitrinite Reflectance (Ro%) Versus Tmax (°C)
For samples separated with heavy liquid, those with density less than1.25 have more exinite than the original sample, thus giving them lower Tmax and Ro% values; those with density greater than 1.35 have more inertinite than the original, and since inertinites are macerals that are heated and oxidized before burial, they result in higher Tmax and Ro%. Generally speaking, the washing process leads to the loss of free hydrocarbon, thus a decreasein S1. The value of S2
shows the pyrolyzed hydrocarbon content, and since hydrogen index(HI) is the ratio of S2 and TOC, the value of S2 also serves as reference hydrogen content. In view of the above, macerals with density less than 1.25 contain more exinite (i.e. higher hydrogen content) and will produce a higher volume of hydrocarbons; therefore, the higher the S2
value, the higher the peak value, meaning a better maceral composition for higher hydrocarbon potential. Macerals with density is greater than 1.35 indicates less hydrogen content. The van Krevelen diagram for organic matter classification (Stach et al., 1982) can also be used to represent the different macerals, where exinite has the highest H/C ratio, followed by vitrinite, then inertinite. The van Krevelen diagram can also be presented as Tmax versus HI graph (Hunt, 1996). The samples in this study are mostly type Ⅱ and type Ⅲkerogens. From immature to mature stage, Ro% value ranges from 0.3 to 0.7, while Tmax ranges from 420oC~465oC. The atomic H/C ratio decreases with the increase of vitrinite reflectance (Ro%), but when Ro%=0.55~0.85, the decline is less obvious, as shown in Fig. 3.
Thermal maturation is the most important process in hydrocarbon production. In the evaluation of oil and gas

98 Hsien-Tsung Lee and Li-Chung Sun: Correlation among Vitrinite Reflectance Ro%, Pyrolysis Parameters, and Atomic H/C Ratio: Implications for Evaluating Petroleum Potential of Coal and Carbonaceous Materials
potential, organic maturity is one of the most important parameters to be considered. This is the reason why “hydrocarbon potential” and “maturity” are the two major topics in oil and gas potential assessment studies. According to the evaluation parameters for source rocks set by Peters and Cassa (1994); when Wt.% TOC values is greater than 2.0 and Rock-Eval S2 value greaterthan10.0, the source rocks are rich in organic matter; when the atomic H/C ratio is greater than 1.0 and hydrogen index (HI, mgHC/gTOC) value is more than 200, the organic matter has oil-producing potential; and when Ro% is greater than 0.6 and Tmax (oC) value is more than 430, the organic matter are at the beginning of the mature stage for hydrocarbon production.
In this study, most samples are abundant in organic matter content, while the majority has gas producing potential ranging from immature stage to mature stage when hydrocarbon production begins to happen. Drawing from the obtained parameters of both lithofacies and geochemical analyses, the organic matter from Lifung have gas producing potential (less oil)and have reached the maturity when hydrocarbons begin to form; while the organic matter from Shuichengbian have oil-producing potential and have reached the maturity when hydrocarbons are about to form.
In the assessment of thermal maturity, vitrinite reflectance (Ro%) and Tmaxare the most frequently used indicators. Both of them increase as the maturity increases. As shown in Fig.19 where Tmax is graphed against the average vitrinite reflectance (Ro%), we found these two factors display a positive correlation. The sample with the highest exinite content, No. 32Shuicheng 2, has a S2 value as high as 352.5 mg HC/g rock. From the results of the analysis, it is also known that with the increase of vitrinite reflectance (Ro%), S2 generally shows a declining trend, which is similar to the findings of Rimmer et al. (1993). After Rock-Eval pyrolysis, the samples in this study display little correlation between the S2 value and Ro% and Tmax, thus we were unable to discuss the reflectance suppression, maximum pyrolysis temperature suppression, and reworked sediments. However, if Ro% is graphed against Tmax,the more similar the sedimentary environment and sedimentary time, the better the correlation between Tmax and Ro% (all samples, r2=0.51; samples from Taiwan,r2=0.78; samples from Mainland China, r2=0.73; all meet the significant level α=0.01) (Table 6); it may be possible to use these results to examine suppression and reworked sediments.
Table 6. The correlation coefficient (r) of Tmax versus Ro%
Number of Samples r-value r2-value
90(All Samples) 0.810 0.656
26(Samples from Taiwan) 0.885 0.782
12(Samples from Mainland China) 0.852 0.726
(All meet the significant level á=0.01)
Fig. 19. linear regression of Tmax (oC) vs. vitrinite reflectance (Ro%).
4. Conclusions Hydrogen index (HI) and atomic H/C ratio generally show
a certain correlation. When themineral content of the sample is high and total organic carbon (TOC)content is low, ahigh HI and low atomic H/C ratio may result. Therefore, when using HI and atomic H/C ratio to assess hydrocarbon potential of organic matter, a morecautious approach should be adopted. In addition, when H% is graphed against C%, using the obtained Y-intercept to correct the H% will give
better results for the samples from the same region or in the same sample group. Vitrinite reflectance (Ro%) increases as the organic material becomes more mature; at the same time, the atomic H/C ratio declines, but the decline becomes less noticeable when Ro%=0.5~0.7. When organic matter have atomic H/C ratio>1.0 and HI (mgHC/gTOC)>200, they possess oil-producing potential, whereas Tmax (oC)>430 indicates that the organic matter has reached the mature stage that hydrocarbon production is about to take place.
The results of proportionally mixing two coal samples with different maturities, and then subjecting them to Rock-Eval

Journal of Energy and Natural Resources 2014; 3(6): 85-100 99
pyrolysis analysis, vitrinite reflectance measurements and mixing treatment showed that in low maturity materials (i.e.younger rock formations), regardless of the proportion of mixed high maturity material (i.e. reworked sediments of old rock formations), the Tmax value remained similar to that of low maturity samples (i.e. younger strata maturity). This implies that when a strata sample contains reworked sedimentary material, the Tmax may reflect the maturity of young material. Therefore, during the sampling or pyrolysis analysis on relatively high maturity material, low-maturity material contamination should be avoided whenever possible, even in very small amounts; otherwise the Tmax value is likely to be biased towards that of the low maturity contaminant. Our results also indicate that after mixing, there is a distinctively non-linear relationship between the average value of vitrinite reflectance Ro% and the corresponding Tmax values measured. When Tmax is graphed against Ro%, the more similar the sedimentary environment and sedimentary time, the better the correlation between Tmax and Ro% (all samples,r2=0.51;samples from Taiwan, r2=0.78; samples from Mainland China, r2=0.73).
As thermal maturity indicator (vitrinite reflectance, Ro%) increases, HI, S1, S2, and H/C values decrease; when the atomic H/C ratio has a Ro%=0.55~0.85 (H/C=1.1~0.7), the decline is less noticeable. When the atomic H/C ratio increases, (S1+S2)/TOC value also increases. It was observed that when atomic H/C ratio is in the range of 0.7~1.1, each parameter value displays large-scale changes. When the vitrinite reflectance (Ro%) is below 0.55, the value of the corresponding HI showsirre gular substantial changes (Ro% =0.55~0.35→HI=80~520mg/g). However, the decline is less noticeable in the range of Ro%=0.55~0.85. Whereas atomic H/C ratio lies in the range of 0.7~1.1 and HI (mgHC/gTOC)>200, organic matter are expected to possess oil-producing potential. On the other hand, when the atomic H/C value is in the range of 0.7~1.1, the value of the corresponding HI shows a stable increasing trend (atomic H/C=0.7~1.1→HI=120~520mg /g). This shows that organic matter inan oil window of Ro%=0.55 and atomic H/C=1.1 have reached a certain maturity and hydrocarbon potential. Tmax (oC)>430 also indicates that the organic matter has reached the stage of hydrocarbon generation starting to take place. When the atomic H/C ratio=0.7~1.1, HI, S1, S2, S1+S2, S1/(S1+S2), S1/TOC, (S1+S2)/TOC, Tmax and TOC exhibit significant large-scale variations, demonstrating the existence of correlations between them.
Acknowledgements We sincerely thank Prof. Jin KuiLi from the Graduate
School of China University ofMining and Technology (CUMT) (Beijing) for providing the coal samples used in thisexperiment. At the same time, we would also like to thank the Research Institute ofPetroleum Exploration and Development, CNPC, for providing adequate assistancewith the Rock-Eval pyrolysis analysis and vitrinite reflectance measurements. Notably,we are grateful toMr. Hsieh MF from
the Exploration &Development Research Institute of CPC Corporation, Taiwan (Maio-Li) for theassistance on pyrolysis experiments. Also appreciate the financial support from theNational Science Council for the research projects of NSC-95-2116-M-252-001, NSC-99-2116-M-252-001 and NSC-101-2116-M-252-001.
References [1] Akinlua A, Ajay TR, Jarvie DM, Adeleke BB (2005) A
re-appraisal of the application of Rock-Eval pyrolysis to source rock studies in the Niger Delta. Journal of Petroleum Geology 28(1):39-48
[2] ASTM (1975) Standard D-2797, ASTM Standard manual Part, vol 26, ASTM. Philadelphia,pp350-354
[3] ASTM (1980) Standard D-2797, Microscopical determination of volume percent of physical components in a polished specimen of coal. ASTM,Philadelphia
[4] Baskin DK (1997) Atomic H/C ratio of kerogen as an estimate of thermal maturity and organic matter conversion, AAPG Bulletin 81(9):1437-1450
[5] BatesRL,JacksonJA (1987) Glossary of Geology [M], American Geological Institute, Alexandria, Virginia, 565~565
[6] BostickNH (1971) Thermal alteration of clastic organic particles as a indicator of contact and burical metamorphism in sedimentary rocks. Geoscience and Man3:83-93
[7] BostickNH (1974)Phytoclasts as Indicator of thermal metamorphism, Franciscan Assemblage and Great Vally Sequence (upper Mosozoic),California. Spec. Pap. Geol. Soc. Amer153:1-17
[8] Dahl B, Bojesen-Koefoed J, Holm A, Justwan H, Rasmussen E, Thomsen E (2004) A new approach to interpreting Rock-Eval S2 and TOC data for kerogen quality assessment. Organic Geochemistry 35:1461-1477
[9] DormansHNM, Huntjens FJ, van Krevelen DW (1957) Chemical structure and properties of coal XX-composition of the individual macerals (vitrinites, fusinite, micrinites and exinites). Fuel36:321-339
[10] Espitalie J, La Porte JL, MadecM, Marquis F, Le Plat P, Paulet J, Boutefeu A (1977)Methoderapide de caracterisation des roches meres de leur potential petrolier et de leurdegred’evolution. Revue l’Inst Francais du Petrole32(1):23–42
[11] Espitalie’J, Deroo G, Marquis F (1985) La pyrolyse Rock-Eval et ses applications. Revue Institut Franc- ais du Pe’ trole Part I40:563–578, Part II40:755–784
[12] Ge T-S, Chen Y-X, Yu T-X, Wang G-S, Niu Z-R, Shen S-W, Li Y-L, Song S-Y, Wu T-S, Zhao Q-B, Xiong C-Y (1993)Liaohe Oil Field:Petroleum geology of China3: 4 74-494
[13] Hou D-J, ZhangL-Y (2003) Practical geochemistry illustrated handbook, [M]. Petroleum Industry Press,pp63
[14] HuntMJ(1996) Petroleum Geochemistry and Geology(2rd ed.), W. H. Freeman and Company, New York, pp1~743
100 Hsien-Tsung Lee and Li-Chung Sun: Correlation among Vitrinite Reflectance Ro%, Pyrolysis Parameters, and Atomic H/C Ratio: Implications for Evaluating Petroleum Potential of Coal and Carbonaceous Materials
[15] Hutton AC, Cook AC (1980) Inffluence of alginite on the reflectance of vitrinite from Joadja, NSW, and some other coals and oil shales containing alginiate. Fule 59, p711-714.
[16] Jones RW, Edison TA (1978) Microscopic observations of kerogen related to geochemical parameters with emphasis on thermal maturation, in D.F. Oltz, ed., Low temperature metamorphism of kerogen and clay minerals: SEPM Pacific Section, Los Angeles, October, p.1-12.
[17] Kuo C-L (1997) Application of vitrinite reflectance on oil and gas exploration in Western Taiwan [D]: [dissertation]. Taipei: Department of Geosciences, National TaiwanUniversity, Doctoral Dissertation PP 1-302
[18] LangD-S, Jin C-Z, Guo G-Y (1999) The evaluation technique of pyrolysis andgas chromatography of reservoir fluids, [M] Petroleum Industry Press, Pg117.Cited from: HouDujie, Zhang Linye, Practical geochemistry illustrated handbook [M].Petroleum Industry Press, 2003, pp63
[19] Lee, H-T (2011) Analysis and characterization of samples from sedimentary strata with correlations to indicate the potential for hydrocarbons, Environmental Earth Sciences (formerly Environmental Geology)64(7):1713-1728
[20] Lee, H-T, TsaiLY, Sun L-C (2010) Relationships among Geochemical Indices of Coal and Carbonaceous Materials and Implication for Hydrocarbon Potential Evaluation. Environmental Earth Sciences60(3):559-572
[21] Lee, H-T (2010) Statistical analysis of relations between petrographic and geochemical indices of oil generation potential in organic matter, Carbonates and Evaporites 25(4):303-323
[22] LiS,Pang X, Li M, Jin Z (2003) Geochemistry of petroleum systems in the Niuzhuang South Slope of Bohai Bay Basin—part 1: source rock characterization. Organic Geochemistry34:389–412
[23] Mao EW, Zhou J-N, Wang J-G, Zhang S-J (1988) Depositional environment of the Nanchuang Formation in the Miaoliand Hsinchu area, Taiwan. Petroleum Geology of Taiwan24:37-50
[24] Pang X, Li M, Li S, Jin Z (2003) Geochemistry of petroleum systems in the Niuzhuang South Slope of Bohai Bay Basin,Part 2: evidence for significant contribution of mature source rocks to “immature oils” in the Bamianhe field. Organic Geochemistry34:931-950
[25] Peters KE, Cassa MR (1994) Applied source-rock geochemistry, In: Magoon, L.B., Dow, W.G. (Eds.), The Petroleum System—From Source to Trap. American Association of Petroleum Geologists Memoir 60:93–120
[26] Rimmer SM, Cantrell DJ, Gooding PJ (1993) Rock-Eval
pyrolysis and vitrinite reflectance trends in the Cleveland Shale member of the Ohio Shale, eastern Kentucky. Organic Geochemistry20(6):735-745
[27] Stach E, Mackowsky M-Th, Teichmüller M, Taylor GH, Chandra D, Teichmüller R (1982)Stach’s Textbbok of Coal Petrology(3rd ed.)[M].Berlin, Gebruder Borntraeger, pp 1~535
[28] Su PJ(2001) The influence of maceral composition on Rock-Eval Pyrolysis, Masters Dissertation, Graduate Institute of Applied Geology at National Central University, p 73
[29] SunL Z (2000) Measurement of vitrinite reflectance suppression- coal sample separation from Yufeng, Taiwan as an example, Ph.D. Dissertation of Institute of Geophysics at National Central University, p 81
[30] Taylor AW, Ritts BD (2004)Mesoscale heterogeneity of fluval-lacustrine reservoir analogues: examples from the Eocene Green River and Colton Formations, Uinta Basin, Utah, U.S.A. Journal of Petroleum Geology27:3-26
[31] TeichmÜller M, Durand B (1983) Fluorescence microscopical rank studies on liptinites and vitrinite in peat and coals, and comparison with the results of the Rock-Eval pyrolysis[J]. Int. J. Coal Geol 2:197~230
[32] Teichmüller M (1974) Generation of petroleum-like substance in coal seams as seen under the microscope. In: Tissot B, Bieener F (eds) (1973) Advances in organic geochemistry. Rueil-Malmaison, France, pp 379- 407
[33] Ting FTC (1978) Petrographic techniques in coal analysis, In: Karr, C., Jr. (ed.):Analytical Methods for Coal and Coal Products. Academic Press, Inc., New York, pp3-26
[34] Tissot BP, Welte DH (1984) Petroleum formation and occurrence;a new approach to oil gas exploration, Springer- Verlag, Berlin, Heidelberg, New York, p 699
[35] Tsai LY(1988)Paragenetic implications of vitrinite in Chilung-Taipei coal fields,Ti-Chih8(1-2):63-70
[36] Udo OT, Ekweozor CM, Okogun JI (1986) Organic petrographic and programmed pyrolysis studies of sediments from Northwestern Niger delta, Nigeria, Journal Min. Geol 24:85-96
[37] Walples DW (1985) Geochemistry in petroleum exploration [M]. D. Reidel Publishing Co. Dordrecht BostonL ancasterpp 1~232
[38] Wang CJ(1998) “Folded-fan” evaluation of coal’s hydrocarbon potential,Geochemistry27(5):483-492
[39] Wu L-Y, Gu X-Z, Sheng Z-W, Fan C-L, Tong Z-Y, Cheng K-M (1986) Quick evaluation quantitatively on the pyrogenation of source rocks [M]Beijing: Science Press,pp1 ~ 198