Embed Size (px)
Citation preview

20162052.001A/SRO15R27870_R1 Page i of iv October 7, 2015 © 2015 Kleinfelder Revised December 11, 2015
GEOTECHNICAL INVESTIGATION REPORT
FIFTH STREET EAST RECYCLED WATER PIPELINE
PROPOSED NATHANSON CREEK CROSSING
SONOMA, CALIFORNIA
KLEINFELDER PROJECT NO.: 20162052.001A
DECEMBER 11, 2015
Copyright 2015 Kleinfelder
All Rights Reserved
ONLY THE CLIENT OR ITS DESIGNATED REPRESENTATIVES MAY USE THIS DOCUMENT AND ONLY FOR
THE SPECIFIC PROJECT FOR WHICH THIS REPORT WAS PREPARED.

20162052.001A/SRO15R27870_R1 Page ii of iv October 7, 2015 © 2015 Kleinfelder Revised December 11, 2015
A Report Prepared for: Mr. Mike West Water Agency Engineer III Sonoma County Water Agency 404 Aviation Blvd Santa Rosa, CA 95403
GEOTECHNICAL INVESTIGATION REPORT
FIFTH STREET EAST RECYCLED WATER PIPELINE
PROPOSED NATHANSON CREEK CROSSING
SONOMA, CALIFORNIA Prepared by:
Martin J. Pucci, PE 78133 Project Engineer
Kenneth G. Sorensen, PE, GE 2520 Principal Geotechnical Engineer Reviewed by: William V. McCormick, CEG 1673 Sr. Principal Engineering Geologist
KLEINFELDER 2240 Northpoint Parkway Santa Rosa, CA 95407-5009 Phone: 707.571.1883 Fax: 707.571.7813 Date: December 11, 2015 Kleinfelder Project No.: 20162052.001A

20162052.001A/SRO15R27870_R1 Page iii of iv October 7, 2015 © 2015 Kleinfelder Revised December 11, 2015
TABLE OF CONTENTS
Section Page
1 INTRODUCTION ............................................................................................................. 1 1.1 GENERAL............................................................................................................ 1 1.2 PROJECT DESCRIPTION ................................................................................... 1 1.3 SCOPE OF SERVICES ....................................................................................... 2
2 FIELD INVESTIGATION AND LABORATORY TESTING ............................................... 4 2.1 SITE DESCRIPTION ........................................................................................... 4 2.2 FIELD EXPLORATION ........................................................................................ 4 2.3 SAMPLING PROCEDURES ................................................................................ 5 2.4 GEOTECHNICAL LABORATORY TESTING ....................................................... 6
3 SITE CONDITIONS ......................................................................................................... 7 3.1 REGIONAL GEOLOGY ....................................................................................... 7 3.2 PROJECT GEOLOGY ......................................................................................... 7 3.3 SEISMICITY AND FAULTING ............................................................................. 8 3.4 SUBSURFACE CONDITIONS ............................................................................. 9
3.4.1 Boring KB-1 (East Side of Nathanson Creek) ........................................... 9 3.4.2 Boring KB-2 (West Side of Nathanson Creek) ........................................ 10
3.5 GRAVEL PROPERTIES .................................................................................... 10 3.6 GROUNDWATER CONDITIONS....................................................................... 10 3.7 SOIL CORROSIVITY TESTING......................................................................... 11
4 CONCLUSIONS AND DESIGN CONSIDERATIONS .................................................... 13 4.1 GENERAL CONCLUSIONS ............................................................................... 13 4.2 LIQUEFACTION ................................................................................................ 14 4.3 ANTICIPATED DRILLING CONDITIONS .......................................................... 14 4.4 STEERING ........................................................................................................ 15 4.5 HDD BOREHOLE INSTABILITY ........................................................................ 15 4.6 INADVERTENT RETURNS OF DRILLING FLUID ............................................. 16
4.6.1 General .................................................................................................. 16 4.6.2 Loss of Drilling Fluid Returns .................................................................. 17
4.7 DRILLING FLUID PROGRAM ............................................................................ 17 4.7.1 General .................................................................................................. 17 4.7.2 Borehole Slurry Density .......................................................................... 18 4.7.3 Soil Conditions ....................................................................................... 18 4.7.4 Drilling Fluid Selection ............................................................................ 18 4.7.5 Drill Bit and Reamer Selection ................................................................ 18 4.7.6 Solids Separation Plant .......................................................................... 19 4.7.7 Soil and Fluid Volume............................................................................. 19
4.8 FLUIDIC DRAG COEFFICIENT ......................................................................... 19 4.9 BOREHOLE FRICTION FACTOR AND ABRASION .......................................... 20 4.10 DRILL PAD SUPPORT ...................................................................................... 21 4.11 UTILITIES AND WELL CLEARANCE ................................................................ 21 4.12 CONTRACTOR SELECTION ............................................................................ 21

20162052.001A/SRO15R27870_R1 Page iv of iv October 7, 2015 © 2015 Kleinfelder Revised December 11, 2015
5 ADDITIONAL SERVICES .............................................................................................. 23 5.1 PROJECT BID DOCUMENTS ........................................................................... 23 5.2 EXCECUTION PLAN AND PERMIT ASSISTANCE ........................................... 23 5.3 CONSTRUCTION OBSERVATION AND TESTING........................................... 23
6 LIMITATIONS ............................................................................................................... 24
7 REFERENCES .............................................................................................................. 25
TABLES Table 1 Significant Faults ................................................................................................. 8 Table 2 Summary of Corrosion Test Results .................................................................. 11 Table 3 Drilling Fluid Demand ......................................................................................... 19 Table 4 Ultimate Friction Factors .................................................................................... 21
PLATES 1 Site Location Map 2 Site Plan 3 Proposed HDD Cross Section 4 Site Geology
APPENDICES A Log of Borings B Laboratory Test Results C Corrosion Testing Results D Important Information about this Geotechnical Engineering Report
20162052.001A/SRO15R27870_R1 Page 1 of 26 October 7, 2015 © 2015 Kleinfelder Revised December 11, 2015
GEOTECHNICAL INVESTIGATION REPORT
FIFTH STREET EAST RECYCLED WATER PIPELINE
PROPOSED NATHANSON CREEK CROSSING
SONOMA, CALIFORNIA
1 INTRODUCTION
_____________________________________________________________________
1.1 GENERAL
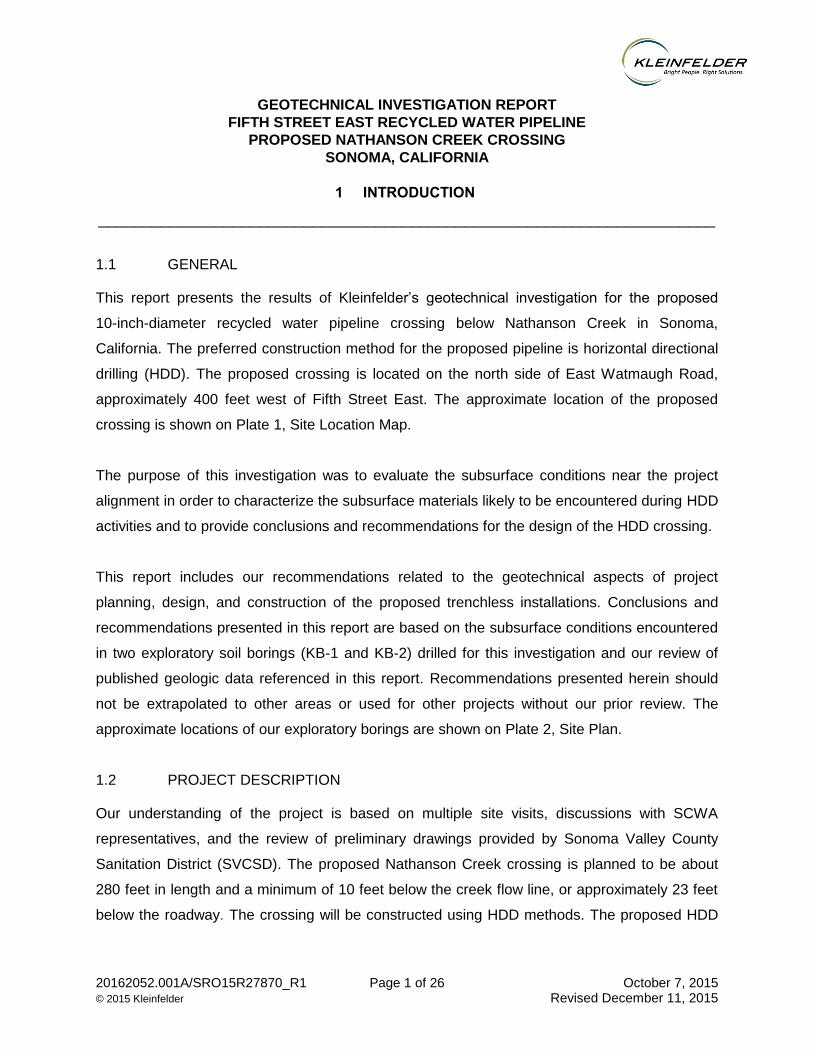
This report presents the results of Kleinfelder’s geotechnical investigation for the proposed
10-inch-diameter recycled water pipeline crossing below Nathanson Creek in Sonoma,
California. The preferred construction method for the proposed pipeline is horizontal directional
drilling (HDD). The proposed crossing is located on the north side of East Watmaugh Road,
approximately 400 feet west of Fifth Street East. The approximate location of the proposed
crossing is shown on Plate 1, Site Location Map.
The purpose of this investigation was to evaluate the subsurface conditions near the project
alignment in order to characterize the subsurface materials likely to be encountered during HDD
activities and to provide conclusions and recommendations for the design of the HDD crossing.
This report includes our recommendations related to the geotechnical aspects of project
planning, design, and construction of the proposed trenchless installations. Conclusions and
recommendations presented in this report are based on the subsurface conditions encountered
in two exploratory soil borings (KB-1 and KB-2) drilled for this investigation and our review of
published geologic data referenced in this report. Recommendations presented herein should
not be extrapolated to other areas or used for other projects without our prior review. The
approximate locations of our exploratory borings are shown on Plate 2, Site Plan.
1.2 PROJECT DESCRIPTION
Our understanding of the project is based on multiple site visits, discussions with SCWA
representatives, and the review of preliminary drawings provided by Sonoma Valley County
Sanitation District (SVCSD). The proposed Nathanson Creek crossing is planned to be about
280 feet in length and a minimum of 10 feet below the creek flow line, or approximately 23 feet
below the roadway. The crossing will be constructed using HDD methods. The proposed HDD

20162052.001A/SRO15R27870_R1 Page 2 of 26 October 7, 2015 © 2015 Kleinfelder Revised December 11, 2015
entry and exit points are located approximately 290 feet and 570 feet west of Fifth Street East
on East Watmaugh Road. The alignment trends in an east-west direction.
1.3 SCOPE OF SERVICES
As authorized by SCWA, and as outlined in our proposal dated September 8, 2015, our scope
of services included the following items:
A description of the proposed project including a site vicinity map and a site plan
showing the project alignment, the locations of subsurface explorations, and the
proposed HDD entry and exit points.
A description of the site geologic setting and potentially adverse geologic hazards that
could impact the project such as soil liquefaction, ground shaking and ground rupture
due to earthquake activity.
A site geology map along the proposed HDD crossing alignment depicting the
anticipated geologic conditions.
A summary of the subsurface investigative procedures, methods and a description of
the surficial and subsurface site conditions encountered during our field investigation.
Results of geotechnical laboratory testing.
A brief discussion of the corrosion potential of the subsurface soils encountered during
our field exploration based on laboratory corrosivity tests performed by others. This
scope of work does not include corrosion engineering.
Analysis of the potential for hydraulic fracturing and inadvertent fluid releases from the
HDD bore.
Recommendations related to the geotechnical aspects of HDD including:
o Anticipated drilling conditions
o Soil characteristics with regard to drill tooling selection and separation plant
considerations
o Drilling fluid considerations
o Solids and fluid volume guidelines
o Borehole and fluidic drag coefficients for pipe pullback load estimating

20162052.001A/SRO15R27870_R1 Page 3 of 26 October 7, 2015 © 2015 Kleinfelder Revised December 11, 2015
o Recommendations for control of inadvertent fluid releases and related
contingency planning
o Equipment support
Recommendations for Contractor selection and pre-bid services.
Appendices including logs of borings and laboratory test results.

20162052.001A/SRO15R27870_R1 Page 4 of 26 October 7, 2015 © 2015 Kleinfelder Revised December 11, 2015
2 FIELD INVESTIGATION AND LABORATORY TESTING
___________________________________________________________________________________
2.1 SITE DESCRIPTION
The proposed HDD bore will cross beneath Nathanson Creek, just north of East Watmaugh
Road in Sonoma, California. It is currently unknown which side of Nathanson Creek the bore
will begin and end. However, the total distance between the proposed entry and exit points is
approximately 280 feet.
The surrounding area of the site is relatively level. The elevation of the west end of the HDD
bore is approximately 2-3 feet higher than the east end. A cross section of the topography
along the proposed crossing is presented on Plate 3, Proposed HDD Cross Section.
2.2 FIELD EXPLORATION
Prior to drilling, the boring locations were marked in the field and Underground Service Alert of
Northern California (USA-North) was contacted to inform local utilities of planned drilling
operations. After the site was marked by local utilities, the exact boring locations were selected.
A single drilling permit was obtained from the Sonoma County Permit and Resource
Management Department (PRMD) for the boring locations.
The subsurface conditions at the site were explored on September 9, 2015 by drilling two (2)
borings (KB-1 and KB-2) to depths of approximately 61½ and 60½ feet respectively below the
existing ground surface. The borings were drilled using a CME-55 track-mounted drill rig
equipped with mud rotary drilling capabilities. Borings KB-1 and KB-2 were drilled on the east
and west sides of Nathanson Creek, respectively. The locations of borings performed for this
investigation are shown on Plate 2, Site Plan.
The borings were located in the field by visual sighting and/or pacing from existing site features.
Therefore, the locations of the borings shown on Plate 2 should be considered approximate and
may vary slightly from those indicated.
A Kleinfelder geologist maintained logs of the borings, and visually classified pertinent
engineering properties of soils encountered according to applicable portions of the Unified Soil
Classification System (American Society for Testing and Materials International [ASTM] D2488

20162052.001A/SRO15R27870_R1 Page 5 of 26 October 7, 2015 © 2015 Kleinfelder Revised December 11, 2015
visual-manual procedure). Both disturbed and relatively undisturbed samples of the subsurface
materials were obtained in order to visually classify the soils. Sample classifications, blow
counts recorded during sampling, and other related information were recorded on the boring
logs and are presented in Appendix A. The Unified Soil Classification System and a key to the
symbols used on the boring logs are both described on Plate A-1, and a Soil Description Key is
presented on Plate A-2. Boring logs are presented on Plates A-3 and A-4.
2.3 SAMPLING PROCEDURES
Relatively undisturbed samples were obtained from the borings at selected depths by driving a
2.5-inch inside diameter (I.D.), split-barrel, California sampler containing stainless steel liners
into undisturbed soil with a 140-pound automatic hammer free-falling a distance of 30 inches.
The California sampler is in general conformance with ASTM D3550. Soil sampled using this
method likely experienced some minor disturbance due to hammer impact, retrieval, and
handling.
Disturbed samples were also obtained at selected depths by driving a 1.4-inch I.D. Standard
Penetration Test (SPT) sampler into undisturbed soil with a 140-pound automatic hammer free-
falling a distance of 30 inches. The SPT sampler was used in gravelly soils. The SPT sampler is
in general conformance with ASTM D1586.
Blow counts were recorded at 6-inch intervals, or fraction thereof, for each driven sample
attempt and are reported on the boring logs. Blow counts shown on the boring logs have not
been corrected for the effects of overburden pressure, rod length, sampler size, or hammer
efficiency. Sampler size correction factors were applied to estimate the material apparent
density noted on the boring logs. The consistency terminology used in soil descriptions for
cohesive soils is based on field observations (see Plate A-2). Soil samples obtained from the
borings were packaged and sealed in the field to reduce moisture loss and disturbance, and
returned to our laboratory for further testing.
After the borings were completed, they were backfilled with cement grout per Sonoma County
Permit and Resource Management Department requirements.
20162052.001A/SRO15R27870_R1 Page 6 of 26 October 7, 2015 © 2015 Kleinfelder Revised December 11, 2015
2.4 GEOTECHNICAL LABORATORY TESTING
Laboratory tests were performed on selected samples recovered from the borings to evaluate
physical and engineering properties. The laboratory testing included the following tests:
Unit Weight (ASTM D2937)
Moisture Content (ASTM D2216)
Material Finer Than No. 200 Sieve (ASTM D1140)
Atterberg Limits (ASTM D4318)
Particle Size Analysis (ASTM D422)
Unconsolidated Undrained Triaxial Compression, TXUU (ASTM D2850)
Unit weight, moisture content, percent passing the No. 200 sieve, Atterberg Limits, and
unconsolidated undrained triaxial shear (TXUU) test results are summarized on the boring logs
presented in Appendix A. The Summary of Laboratory Tests is presented on Plate B-1 in
Appendix B. The results of other laboratory tests are included in Appendix B.

20162052.001A/SRO15R27870_R1 Page 7 of 26 October 7, 2015 © 2015 Kleinfelder Revised December 11, 2015
3 SITE CONDITIONS
___________________________________________________________________________________
3.1 REGIONAL GEOLOGY
The site is located in the central Sonoma Valley, within the Coast Range Geomorphic Province
of Northern California. This province is generally characterized by northwest-trending mountain
ranges and intervening valleys, which are a reflection of the dominant northwest structural trend
of the bedrock in the region. The basement rock in the northern portion of this province consists
of the Great Valley Sequence, a Jurassic (200 to 145 million years old) volcanic ophiolite
sequence with associated Jurassic to Cretaceous (200 to 65 million years old) sedimentary
rocks, and the Franciscan Complex, a subduction complex of diverse groups of igneous,
sedimentary, and metamorphic rocks of late Jurassic to early Tertiary age (160 to 34 million
years old). The Great Valley Sequence was tectonically juxtaposed with The Franciscan
Complex most likely during subduction accretion of the Franciscan, and these ancient fault
boundaries are truncated by a modern right-lateral fault system that includes the San Andreas,
Hayward-Rodgers Creek, and Maacama faults. The San Andreas Fault defines the
westernmost boundary of the local bedrock, approximately 24.0 miles southwest of the site. In
the site vicinity, the Great Valley Sequence and Franciscan Complex are unconformably
overlain by Tertiary age (65 to 1.8 million years old) continental and marine sedimentary and
volcanic rocks. These Tertiary age rocks are locally overlain by younger Quaternary age (1.8
million years old to present) alluvial and colluvial deposits.
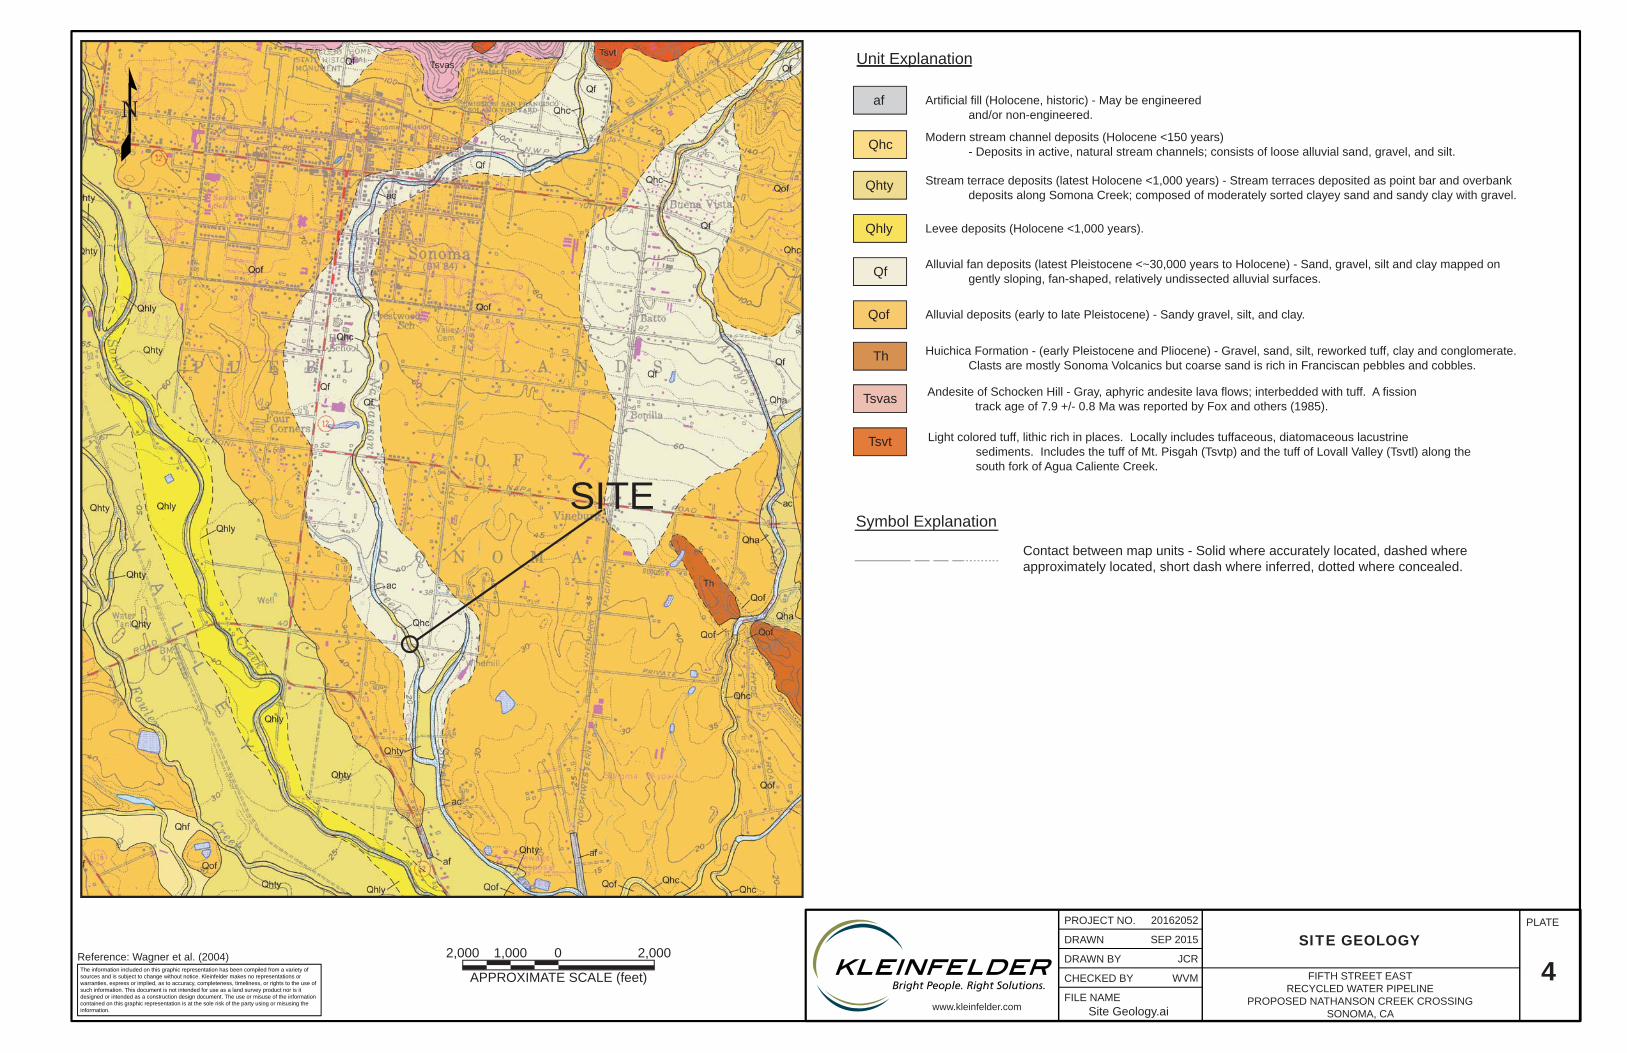
3.2 PROJECT GEOLOGY
The geology of the site and vicinity has been mapped by Huffman and Armstrong (1980) and
Wagner et al. (2004). Huffman and Armstrong (1980) indicate the bore alignment is underlain
by Quaternary alluvial fan deposits consisting dominantly of deeply weathered, poorly sorted
coarse sand and gravel. Wagner et al. (2004) shows the east and west segments of the bore to
be underlain by latest Pleistocene to Holocene age (less than 30,000 years old) alluvial fan
deposits comprised of gravel, sand, silt, and clay. Wagner et al. (2004) indicates the channel of
Nathanson Creek is underlain by modern (less than 150 years old) stream channel deposits
comprised of loose alluvial gravel, sand and silt. The portion of the geologic map by Wagner et
al. (2004) that incorporates the site is presented on Plate 4, Site Geology.

20162052.001A/SRO15R27870_R1 Page 8 of 26 October 7, 2015 © 2015 Kleinfelder Revised December 11, 2015
The site has also been mapped by Witter et al. (2006). This reference indicates the east and
west bore segments are underlain by latest Pleistocene to Holocene age alluvial fan deposits,
and the Nathanson Creek channel by modern stream channel deposits. According to Witter et
al. (2006) the alluvial fan deposits are considered moderately susceptible to liquefaction, and
the channel deposits very highly susceptible to liquefaction.
3.3 SEISMICITY AND FAULTING
The entire Fifth Street East Recycled Water Pipeline project is not located within an Earthquake
Fault Zone, as defined by the California Geological Survey (CGS, 2010) in accordance with the
Alquist-Priolo Earthquake Fault Zone Act of 1972. The nearest zoned, active fault is the
Hayward-Rodgers Creek fault, which is capable of producing a maximum earthquake
magnitude of M7.3. Moderate to major earthquakes generated on the Hayward-Rodgers Creek
fault, San Andreas fault and other nearby faults can be expected to cause strong ground
shaking at the site.
The proximities and seismic parameters of significant faults in the vicinity of the site are listed in
Table 1. For faults with multiple segmentation scenarios, we have only listed parameters for the
scenario rupturing the most segments (i.e., the most severe scenario). The locations of the
faults and associated parameters presented on Table 1 are based on Petersen et al. (2008).
The maximum earthquake magnitudes presented in this table are based on the moment
magnitude scale developed by Kanamori (1977). Felzer (2008) details calculations of California
seismicity rates including correction for magnitude rounding and error, Gutenberg-Richter b
value and seismicity rates.
TABLE 1
SIGNIFICANT FAULTS
Fault Name
Closest
Distance to
Site*
(mi)
Magnitude of
Characteristic
Earthquake**
Slip Rate
(millimeters/year)
Hayward-Rodgers Creek-HS+HN+RC 3.6 7.3 9
West Napa (unzoned) 6.4 6.7 1
San Andreas-SAS+SAP+SAN+SAO 24.0 8.1 17-24
Maacama-Garberville 26.0 7.3 9
* Closest distance to the potential rupture.
** Moment magnitude: An estimate of an earthquake’s magnitude based on the seismic moment (measure of an
earthquake’s size utilizing rock rigidity, amount of slip, and area of rupture).

20162052.001A/SRO15R27870_R1 Page 9 of 26 October 7, 2015 © 2015 Kleinfelder Revised December 11, 2015
According to Petersen et al. (2008), characterizations of the Hayward-Rodgers Creek, San
Andreas, and Maacama-Garberville faults are based on the following fault rupture segments
and fault rupture scenarios.
The Hayward-Rodgers Creek fault has been characterized by three segments and
six rupture scenarios plus a floating earthquake. The three segments are the
Rodgers Creek fault (RC), the Hayward North (HN), and the Hayward South (HS).
The San Andreas fault has been characterized by four segments and nine rupture
scenarios, plus a floating earthquake. The four segments are Santa Cruz Mountains
(SAS), North Coast (SAN), Peninsula (SAP), and Offshore (SAO).
3.4 SUBSURFACE CONDITIONS
The following descriptions provide a general summary of the subsurface conditions
encountered during the field exploration program. For more detailed descriptions of the actual
conditions encountered at specific boring locations, refer to the boring logs presented in
Appendix A.
3.4.1 Boring KB-1 (East Side of Nathanson Creek)
Boring KB-1 was drilled on the shoulder located along the north edge of East Watmaugh road,
west of Nathanson Creek. Approximately 1½ feet of fill associated with roadway construction,
was encountered near the ground surface. The fill consisted of lean clay with sand and gravel.
The fill was underlain by alluvium comprised of hard silt with sand and medium dense silty sand
to a depth of about 14 feet below the ground surface. Alluvial deposits between depths of about
14 feet and 41 feet below the ground surface consisted of medium dense to very dense
interbedded sand layers with varied silt clay and gravel content. Hard, lean to fat clay was
encountered between depths of about 41 and 49 feet below the ground surface. The clay
deposits were underlain by a relatively massive, very dense gravel unit containing subrounded
gravel up to about 1.4 inches in diameter. The gravel deposit was encountered to the maximum
depth explored in KB-1 (about 61½ feet below the ground surface).

20162052.001A/SRO15R27870_R1 Page 10 of 26 October 7, 2015 © 2015 Kleinfelder Revised December 11, 2015
3.4.2 Boring KB-2 (West Side of Nathanson Creek)
Boring KB-2 was drilled on the shoulder located along the north edge of East Watmaugh Road,
east of Nathanson Creek. Approximately 1½ feet of fill associated with roadway construction
was encountered at the ground surface. The fill consisted of lean clay with sand and gravel.
The fill was underlain by alluvium comprised of very dense sand with clay to a depth of about
5½ feet below the ground surface. A very dense alluvial gravel unit was encountered between
depths of about 5½ feet and 14½ feet below the ground surface, and contained subrounded
gravel up to about ¾ inches in diameter. A hard, lean to fat clay layer was encountered from
about 14½ feet to about 24 feet below the ground surface. The alluvial deposits between
depths of about 24 and 41 feet below the ground surface consisted of medium dense to very
dense sand with varied silt and gravel content. The sand deposits were underlain by a relatively
massive, very dense gravel unit containing subrounded gravel up to 2 inches in diameter. Firm
to hard, lean to fat clay interlayers were encountered between depths of about 41 and 44½ feet
below the ground surface, and about 54½ to 58 feet below the ground surface. The gravel
deposit was encountered to the maximum depth explored in KB-2 (about 60½ feet below the
ground surface).
3.5 GRAVEL PROPERTIES
In Boring KB-2, the gravel layer encountered between 5½ and 14½ feet contained dominantly
highly weathered, weak clasts up to ¾ inch in diameter, supported in a sand matrix. A second
gravel unit was encountered in Borings KB-1 and KB-2 below a depth of about 44½ to 49 feet.
The unit is clast-supported with a minor clayey sand matrix. Gravel within this deposit was
composed of basalt and rhyolite, which was slightly weathered and strong. The deposit
contained gravel greater than 2.5 inches in diameter (California sampler inside diameter),
indicating clasts of cobbles and possibly boulders (over 12 inches) could be present. If the HDD
drill path encounters basalt or rhyolite gravel, cobbles or boulders, difficult drilling conditions
can be expected. Coarse gravel units containing cobbles and boulders should be avoided along
the bore path.
3.6 GROUNDWATER CONDITIONS
Groundwater level was measured during our field investigation by means of using solid flight
auger drilling techniques until groundwater was encountered, then switching to rotary wash

20162052.001A/SRO15R27870_R1 Page 11 of 26 October 7, 2015 © 2015 Kleinfelder Revised December 11, 2015
methods. Groundwater was encountered at a depth of approximately 15 feet below the ground
surface in Boring KB-1.
Groundwater and soil moisture conditions within the area will vary heavily depending on rainfall,
Nathanson Creek stream stages, irrigation practices, well pumping, and other factors that may
not have been apparent during drilling of the borings. Recent groundwater data1 provided by the
California Department of Water Resources of a nearby well indicate groundwater depths that
seasonally fluctuate between about 5 to 30 feet below the ground surface.
3.7 SOIL CORROSIVITY TESTING
A sample of the near-surface soil from each boring was subjected to chemical analysis for the
purpose of corrosion assessment. The sample was tested for pH, resistivity, soluble chlorides
and soluble sulfates, by Sunland Analytical of Rancho Cordova, California. This sample was
tested in general accordance with Caltrans Test Methods 643 Mod., 422, and 417 for pH,
resistivity, soluble chlorides, and soluble sulfates, respectively. The test results are tabulated in
Table 2, and are presented in Appendix C
TABLE 2
SUMMARY OF CORROSION TEST RESULTS
Boring No. Sample
Depth (feet)
Resistivity
(Ohm-Cm) pH
Water Soluble
Chlorides (ppm)
Water Soluble
Sulfates (ppm)
KB-1 5.5-6.5 600 7.38 299.3 51.8
KB-2 10.5-11.0 3,220 7.79 27.6 6.6
Based on the Caltrans Corrosion Guidelines (2012 version 2.0), a site is considered corrosive if
one or more of the following conditions exist for the representative soil and/or water samples
taken at the site: Chloride concentration is 500 ppm or greater, sulfate concentration is 2000
ppm or greater, or the pH is 5.5 or less. A minimum resistivity value for soil and/or water less
than 1000 ohm-cm indicates the presence of high quantities of soluble salts and a higher
propensity for corrosion.
Based on the above results and the Caltrans Corrosion Guidelines, the tested sample
from Boring KB-1 is considered corrosive to steel based on resistivity.

20162052.001A/SRO15R27870_R1 Page 12 of 26 October 7, 2015 © 2015 Kleinfelder Revised December 11, 2015
According to ACI 318 Section 4.3, Table 4.3.1, a sulfate concentration below 0.10 percent by
weight (1,000 ppm) is negligible (no restrictions on concrete type). A water-soluble chloride
content of less than 500 ppm is generally considered non-corrosive to reinforced concrete.
Based on these guidelines and the above test results, the sample tested is considered
non-corrosive to concrete.
Kleinfelder had laboratory testing performed to provide data regarding corrosivity of on-site
soils. The above corrosivity results are preliminary and are an indicator of potential soil
corrosivity for the samples tested. Other soils found on the site may be more, less, or of a
similar corrosive nature. Our scope of services does not include corrosion engineering, and
therefore, a detailed analysis of the corrosion test results is not included in this report. A
qualified corrosion engineer should be retained to review the test results and design protective
systems that may be required. Kleinfelder may be able to provide those services if requested.
1 http://www.water.ca.gov/waterdatalibrary/groundwater/hydrographs/brr_hydro.cfm?CFGRIDKEY=7477

20162052.001A/SRO15R27870_R1 Page 13 of 26 October 7, 2015 © 2015 Kleinfelder Revised December 11, 2015
4 CONCLUSIONS AND DESIGN CONSIDERATIONS
___________________________________________________________________________________
4.1 GENERAL CONCLUSIONS
Based on the results of our field investigation, laboratory testing, and review of surface
topography, it is our professional opinion that a proposed HDD crossing is technically feasible.
However, after reviewing the project drawings (90% submittal, dated 11/19/14) Kleinfelder
recommends altering the design approach to increase the likelihood of a successful HDD
installation. Kleinfelder can assist in the design of the HDD bore path, if requested.
Alternatively, a performance specification could be drafted for the HDD installation. The
performance specification would rely upon the HDD contractor to determine the optimum
geometry and profile of the HDD alignment. Kleinfelder can assist with the development of this
specification or review the contractor’s design submittal, if requested. In general, compound
curves (horizontal and vertical at the same time) are difficult to achieve and can result in
steering misalignment issues. Additionally, due to the potential for cobble and gravel along the
bore path, a mud motor bit may be necessary to complete the HDD installation. If a mud motor
bit is necessary the minimum bend radius will need to be about 1,000 to 1,200 feet. These
issues will affect the alignment as well as the length of the bore and pipe laydown area. In
addition to the above issues, there are a number of conditions that could affect pipeline design
and/or cause difficulties or delays for HDD construction. These include:
Difficult drilling and reaming in gravel with cobbles and boulders
The presence of reactive/swelling clay soils that are difficult to remove from drilling fluids
and may cause restrictions in the HDD bore hole
Difficult jetting in dense soil or gravel. A mud motor may be required
Borehole instability in gravel layers
Difficult steering due to horizontal layering and variation in soil density/consistency
Ground settlement due to soil liquefaction from an earthquake
Conclusions and recommendations regarding HDD design and construction are further
discussed below. It is recommended that the proposed HDD crossing be designed and
constructed in general accordance with the third edition of the “Horizontal Directional Drilling
Good Practices Guidelines” by the HDD Consortium (Bennett, 2008).
20162052.001A/SRO15R27870_R1 Page 14 of 26 October 7, 2015 © 2015 Kleinfelder Revised December 11, 2015
4.2 LIQUEFACTION
Liquefaction describes a condition in which saturated soil loses shear strength and deforms as
a result of increased pore water pressure induced by strong ground shaking during an
earthquake. Dissipation of the excess pore water pressures will produce volume changes within
the liquefied soil layer, which causes settlement. Factors known to influence liquefaction include
soil type, structure, grain size, relative density, confining pressure, depth to groundwater and
the intensity and duration of ground shaking. Soils most susceptible to liquefaction are
saturated, loose sandy soils, and low plasticity clays and silts. If liquefaction occurs, pipelines
above the liquefiable layers may undergo settlement. Within liquefiable soils, a pipeline can
become buoyant, or loose support and settle if it is not buoyant. The degree of buoyancy or
settlement will be affected by the fines content of the soil. More fines generally result in less
susceptibility to buoyancy and settlement due to the residual soil strength that may be present.
Liquefaction susceptibility of the soils encountered within Borings KB-1 and KB-2 were
evaluated using methodologies proposed by Youd et al. (2001), Seed et al (2003), Idriss &
Boulanger (2008), and Cetin et al. (2009). Within Boring KB-2, the granular soil encountered
was adequately dense and the fine-grained soil encountered was plastic and stiff enough to
consider the liquefaction potential low within the soils encountered.
Within Boring KB-1 a few isolated soil deposits were encountered below the design
groundwater depth of 10 feet and above 20 feet that exhibited potentially liquefiable
characteristics. Depended on the methodology, the estimated ground surface settlement
estimated using the Boring KB-1 profile is approximately ½ inch to 1¼ inches.
Based on observed conditions at the site, potentially liquefiable layers that may be present at
this site appear to be discontinuous and sporadic. The settlement estimates are relatively small.
However, the pipeline crossing should be designed to tolerate differential settlement of about 1
inch in 100 feet.
4.3 ANTICIPATED DRILLING CONDITIONS
The density and consistency of soils encountered in our exploratory borings were highly
variable. In general, the near-surface soil conditions encountered in our borings consisted of
medium dense to very dense sands with varying amounts of gravels and fines, underlined by

20162052.001A/SRO15R27870_R1 Page 15 of 26 October 7, 2015 © 2015 Kleinfelder Revised December 11, 2015
hard lean clays, and fat clays interbedded with medium dense to very dense clayey, well-
graded and, poorly-graded gravels extending to the maximum depths explored in Borings KB-1
and KB-2.
Depending upon drill rig and mud pump capacity the harder clayey soils and dense sands and
gravels may be difficult to excavate by jetting and a mud motor may be required. In addition, the
fine clay soils may be reactive and prone to swelling in the bore hole.
The contractor should carefully evaluate the ground conditions identified in this report before
selecting drilling equipment and tooling.
4.4 STEERING
As stated above, the density and consistency of soils encountered in the exploratory borings
were variable. The soil units within the proposed bore path appear to consist of interlayered firm
to very hard clays, and medium dense to very dense, well-graded and poorly-graded sands and
gravels.
The proposed bore path is anticipated to penetrate medium to very dense sands and gravels,
and hard clays. These variations in density/consistency may cause some difficulty steering
along the bore path at these transitions. Where a mud motor is used, the minimum radius of the
bends in the HDD bore path should be about 1,000 to 1,200 feet or greater, since the mud
motor drill cannot steer on a tighter radius. This would change the proposed bore path profile
that was provided to us and shown on Plate 3.
4.5 HDD BOREHOLE INSTABILITY
Layers of well-graded gravel with sand and silt or clay, and clayey gravel were encountered at
depths of about 14 to 41 feet in Boring KB-1 and from the ground surface to depths of about
14½ feet, 29 to 41½ feet and in Boring KB-2 extending to the maximum depths explored. The
well-graded gravels between depths of about 18 and 27½ feet in Boring KB-1 and 29½ to 38½
feet and 58 to 61 feet in Boring KB-2 may be prone to instability in the HDD borehole. The
clayey gravels should be more stable but gravel or cobble clasts dislodged from the borehole
walls could be an issue during drilling and removal of cuttings. Proper drilling fluid makeup or
20162052.001A/SRO15R27870_R1 Page 16 of 26 October 7, 2015 © 2015 Kleinfelder Revised December 11, 2015
use of conductor casings can reduce the potential for borehole caving and stuck pipe during
pullback.
4.6 INADVERTENT RETURNS OF DRILLING FLUID
4.6.1 General
Hydraulic fracturing occurs when borehole pressure causes plastic deformation of the soil
surrounding the borehole, initiating and propagating fractures in the soil mass. The resistance
to plastic deformation and fracturing is a function of soil strength, overburden pressure, and
pore water pressure. Hydraulic fracturing can result in drilling fluid inadvertently returning to the
ground surface or running horizontally away from the borehole. Allowable borehole pressure
was evaluated using the Delft Geotechnics equation as published in “Recommended Guidelines
for Installation of Pipelines Beneath Levees Using Horizontal Directional Drilling, Appendix B,
CPAR-GL-98-1,” published by the Pipeline Research Council International (PRCI) and the U.S.
Army Corps of Engineers, dated April 1998. The estimated allowable borehole pressure was
compared to predicted borehole pressure in our analyses.
For hydraulic fracturing analysis, we assumed a pilot-hole diameter of 6 inches, a drill rod
diameter of 3.25 inches, and a mud pump output of up to 220 gallons per minute. Target up-
hole fluid velocities in the analyses range from about 200 to 225 feet per minute. The drilling
fluid density was estimated to be about 10 to 12 pounds per gallon. Since the proposed bore
path provided to us is not buildable with HDD, we have reviewed similar bore analyses we have
performed previously to make preliminary recommendations for the bore depth and contingency
planning near the exit point. Changes in the bore path, drilling fluid properties and drilling
equipment affect the analysis results.
Borehole instability issues and/or the contactor not maintaining a clean borehole can result in
poor drilling returns and partial or complete plugging of the borehole. This will result in higher
fluid pressures within the bore and can lead to hydraulic fracturing and inadvertent fluid returns
to the ground surface. Depending on the contractor’s means and methods, a minimum cover
depth of 25 feet below the creek bottom should be maintained to minimize the risk of hydraulic
fracturing where a relatively clean borehole is maintained with good drilling returns. A deeper
bore path, 25 feet or greater below the bottom of the creek, should be considered if the
contractor determines that borehole plugging and/or poor drilling returns are likely.
20162052.001A/SRO15R27870_R1 Page 17 of 26 October 7, 2015 © 2015 Kleinfelder Revised December 11, 2015
At depths less than about 10 feet near the exit point, hydraulic fracturing is likely and is
expected to occur as the drill bit approaches the ground surface. Provisions should be in place
to mitigate the effects of hydraulic fracturing and inadvertent fluid returns near the exit point. A
contingency plan to mitigate these effects of hydraulic fracturing near the bore path exit point
can include countermeasures such as, plastic sheeting, earthen berms, straw bales or waddles,
etc., which are commonly used to provide containment for inadvertent drilling fluid releases to
the surface.
4.6.2 Loss of Drilling Fluid Returns
Loss of drilling fluid returns typically occurs when the drill bit encounters fractures in large
interstitial pore spaces in coarse materials (i.e., coarse sands and gravels). Loss of returns is
recognized by a decrease of drilling fluid returns, or a drop in drilling fluid pressure.
If fractures or interstitial pore spaces are small or discontinuous, they may fill with solids
contained in the drilling fluid returns as drilling progresses beyond them. Once the fractures or
pore spaces are filled, fluid will return up the bore hole again and fluid pressure will increase
until another fracture is encountered. If fractures are continuous to the surface, drilling fluid may
inadvertently return to the surface.
Based on the soil conditions encountered in the borings, drilling fluid losses are not anticipated.
No fluid losses were observed during the geotechnical explorations.
4.7 DRILLING FLUID PROGRAM
4.7.1 General
The drilling contractor should develop a Drilling Fluid Program (DFP) as part of the HDD Bore
Plan. A properly designed drilling fluid program can substantially reduce losses due to hydraulic
fracturing out, stuck product pipe, or loss of tooling. The drilling fluid program should take into
account anticipated soil conditions, fluid selection, drill bit and reamer selection, and volume
calculations.

20162052.001A/SRO15R27870_R1 Page 18 of 26 October 7, 2015 © 2015 Kleinfelder Revised December 11, 2015
4.7.2 Borehole Slurry Density
The density of the slurry in the borehole directly affects the buoyancy force and therefore the
normal force between the pipe and the wall of the borehole. The density of drilling returns is a
function of ground conditions, penetration rate, mud flow rate, drilling fluid composition, and
efficiency of the mud cleaning system. In general, drilling return density assuming good HDD
practices is expected to be about 10 to 12 pounds per gallon for the soil units encountered at
the site.
4.7.3 Soil Conditions
For the purpose of drilling fluid design, earth materials are generally divided into two categories:
Inert, including sands; and reactive, including clays. Information regarding subsurface
conditions likely to be encountered at the site is provided in the Subsurface Conditions section
of this report as well as in the boring logs contained in Appendix A.
4.7.4 Drilling Fluid Selection
The base drilling fluid should be designed for site specific soil conditions. The base fluid may
consist of either a bentonite or polymer and water, with additives to achieve specific fluid
properties.
In reactive clay soils the use of PHPA polymers to inhibit swelling and wetting agents to reduce
stickiness may prove beneficial. Salt (chloride) and calcium are detrimental to base fluid
performance and should not be present in make-up water.
The drilling contractor should submit a base fluid design with a list of additives and loss of
circulation materials that may be used on the project and MSDS sheets for approval at least two
weeks prior to mobilization. Assistance with drilling fluid selection can be obtained from
reputable drilling fluid suppliers.
4.7.5 Drill Bit and Reamer Selection
Drill bits and reamers should be selected based on anticipated subsurface conditions and past
experience. The drilling contractor should be prepared with a variety of bits and reamers that
have worked well in similar soil conditions. The use of mud motors should be considered in hard

20162052.001A/SRO15R27870_R1 Page 19 of 26 October 7, 2015 © 2015 Kleinfelder Revised December 11, 2015
clay or dense gravel with Standard Penetration Test blow counts exceeding about 50 blows per
foot and California sampler blow counts exceeding about 75 blows per foot.
4.7.6 Solids Separation Plant
Clays are generally the most difficult to remove from drilling fluids. Depending on their extent,
the presence of these soils along the proposed bore paths may require use of
desilters/centrifuge equipment in order to remove the fine soils from the drilling fluids.
4.7.7 Soil and Fluid Volume
The volume of soil or rock to be removed can be estimated as follows:
(Hole Diameter in Inches)2 = Volume in Gallons per Foot
25
Sufficient fluid should be pumped during drilling and reaming operations to maintain flow.
Drilling rates and drilling fluid flow rates may be adjusted in the field to match varying site
conditions. However, an estimate of drilling fluid demand is useful when sizing drilling
equipment, mud pumps, and solids removal systems, and can be particularly helpful in
determining realistic drilling rates. Drilling fluid demand can be estimated based on the borehole
volume and the ratios presented in Table 3 below.
TABLE 3
DRILLING FLUID DEMAND
Soil or Rock Type
Ratio of Fluid Volume to
Soil Volume
Sand, Gravel 1:1
Sand and Gravel mixed with Clay 2:1
Clay or Reactive Shale 3-5:1
Drilling rates can be estimated based on the drilling fluid demand and the pump output at the
design base fluid viscosity.
4.8 FLUIDIC DRAG COEFFICIENT
A fluidic drag coefficient of 0.050 psi (345 Pa) was recommended in the original Pipeline
Research Council International (PRCI) design guidelines and is still routinely used by pipeline

20162052.001A/SRO15R27870_R1 Page 20 of 26 October 7, 2015 © 2015 Kleinfelder Revised December 11, 2015
designers. Recently it has been suggested that the coefficient could be decreased to 0.025 psi
(172 Pa) for a stable borehole with good solids removal (Puckett 2003). The higher value (0.050
psi) is recommended for routine calculations. The lower value (0.025 psi) may be appropriate
for long bores in stable formations where significant cost savings could be realized by using a
lower grade of steel or thinner pipe wall.
The potential for borehole instability exists in the well-graded gravel layers mentioned
previously in this report. Although not apparently encountered in Borings KB-1 and KB-2, it is
likely that there are poorly-graded sand and poorly-graded gravel layers that will be
encountered along the proposed bore path. If caving sand or gravel occurs during installation,
there is the likelihood of increased pullback loads. Good drilling and fluid management practices
can reduce risk of increased pullback loads. If the pipe becomes stuck, the maximum capacity
of the drill rig may be exerted on the pipe. Accordingly, the pipe should be designed to
withstand the maximum anticipated rig capacity, or a maximum pullback load should be
specified.
4.9 BOREHOLE FRICTION FACTOR AND ABRASION
A large portion of the pullback load is generated from friction between the pipe and the wall of
the borehole. The pipe rubs against the borehole as it goes around bends and is pushed
against the top of the borehole by buoyancy and capstan forces. The friction factor is an
expression of the ratio of the normal force between the pipe and the borehole wall, and the axial
force needed to drag the pipe along the wall. The PRCI Guidelines recommend friction factors
of 0.2 to 0.3 for steel pipe. ASTM Standard F1962-99 recommends a friction factor of 0.3. Sand
and gravel was encountered within the proposed bore path, therefore an abrasion-resistant
coating is recommended for steel pipes. Recommended friction factors for abrasion-resistant
polymer concrete coating were not found in the above literature. The coating material is similar
in texture to smooth, formed concrete. NAVFAC DM 7.22, Chapter 3, Table 1 reports friction
factors for formed concrete against various soils types as presented in Table 4 below. The
friction factors reported below do not account for the presence of a drilling fluid filter cake.
2 Design Manual 7.2, Naval Facilities Engineering Command, May 1982

20162052.001A/SRO15R27870_R1 Page 21 of 26 October 7, 2015 © 2015 Kleinfelder Revised December 11, 2015
TABLE 4
ULTIMATE FRICTION FACTORS
Interface Material Friction Factor
(tanδ)
Friction angle δ
(deg.)
Clean gravel, sandy gravel, coarse sand 0.55 to 0.60 29 to 31
Clean fine-to-medium sand, silty medium-to-coarse sand, silty or
clayey gravel 0.45 to 0.55 24 to 29
Clean fine sand, silty or clayey fine-to-medium sand 0.35 to 0.45 19 to 24
Fine sandy silt, non-plastic silt 0.30 to 0.35 17 to 19
Very stiff and hard residual or pre-consolidated clay 0.40 to 0.50 22 to 26
Medium stiff and stiff clay, and silty clay 0.30 to 0.35 17 to 19
4.10 DRILL PAD SUPPORT
Surface soils in the vicinity of our exploratory borings consist of hard clay and silt and dense
sand and are likely to provide adequate support for HDD drilling equipment. However, when
these soils become wet they may be unstable if saturated. Soil stabilization may be required to
provide a stable platform for the HDD drill rig and surrounding area depending on the time of
year the installation occurs. A potential stabilization option can be use of a gravel surface
course underlain by a geotextile where heavy truck and equipment traffic is planned. The
contractor should perform a pre-bid site visit to evaluate support conditions for their equipment.
4.11 UTILITIES AND WELL CLEARANCE
The location of existing utilities and water wells is beyond the scope of this report. Nearby
underground utilities and wells may exist and must be located and protected to prevent being
impacted by underground construction. The HDD bore profile should be designed to allow
sufficient clearance from underground utilities and wells. In general, we recommend wells be
located at least 100 feet from the HDD bore path for this type of HDD installation.
4.12 CONTRACTOR SELECTION
The success of the project will be substantially dependent on the experience and performance
of the specialty contractor retained to perform the work. We recommend the use of a specialty
contractor with a minimum of 3 years construction experience in the field of horizontal
directional drilling in similar drilling conditions on projects of similar scope (i.e., diameter, length,
and depth). The contractor should be familiar with the use of drilling mud and additives,

20162052.001A/SRO15R27870_R1 Page 22 of 26 October 7, 2015 © 2015 Kleinfelder Revised December 11, 2015
washover and conductor casings and should provide examples of projects they have
successfully completed installing similar utilities in similar conditions.
20162052.001A/SRO15R27870_R1 Page 23 of 26 October 7, 2015 © 2015 Kleinfelder Revised December 11, 2015
5 ADDITIONAL SERVICES
___________________________________________________________________________________
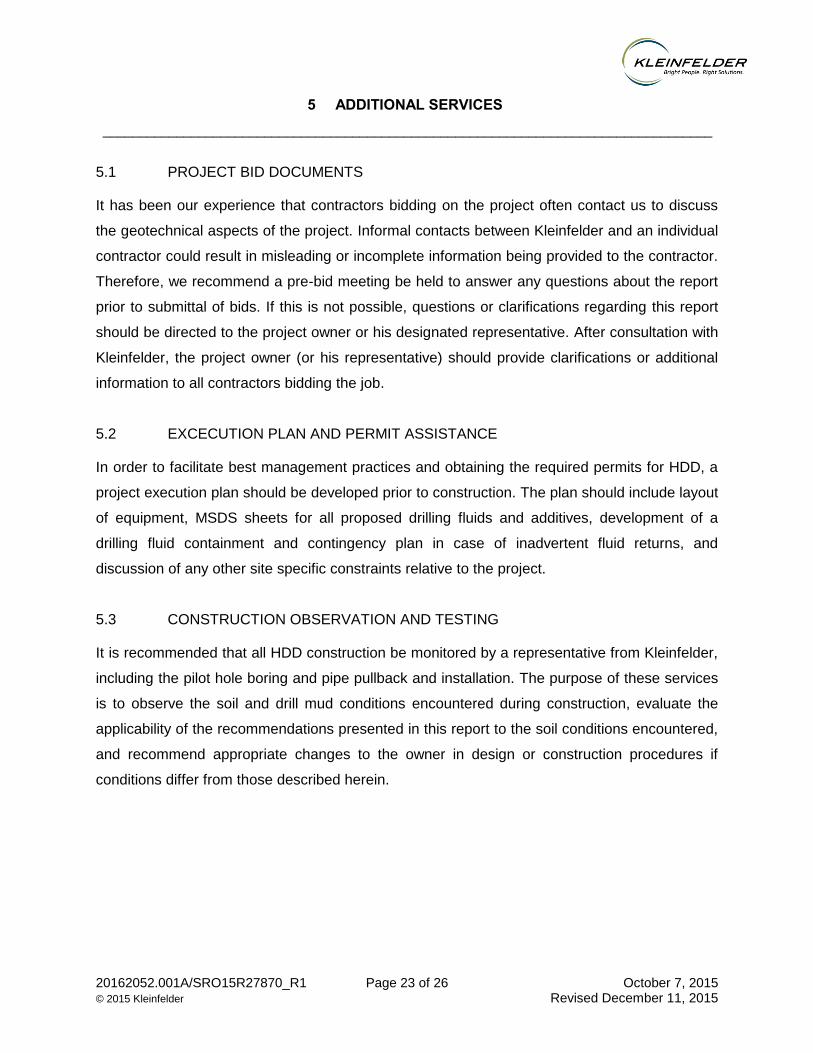
5.1 PROJECT BID DOCUMENTS
It has been our experience that contractors bidding on the project often contact us to discuss
the geotechnical aspects of the project. Informal contacts between Kleinfelder and an individual
contractor could result in misleading or incomplete information being provided to the contractor.
Therefore, we recommend a pre-bid meeting be held to answer any questions about the report
prior to submittal of bids. If this is not possible, questions or clarifications regarding this report
should be directed to the project owner or his designated representative. After consultation with
Kleinfelder, the project owner (or his representative) should provide clarifications or additional
information to all contractors bidding the job.
5.2 EXCECUTION PLAN AND PERMIT ASSISTANCE
In order to facilitate best management practices and obtaining the required permits for HDD, a
project execution plan should be developed prior to construction. The plan should include layout
of equipment, MSDS sheets for all proposed drilling fluids and additives, development of a
drilling fluid containment and contingency plan in case of inadvertent fluid returns, and
discussion of any other site specific constraints relative to the project.
5.3 CONSTRUCTION OBSERVATION AND TESTING
It is recommended that all HDD construction be monitored by a representative from Kleinfelder,
including the pilot hole boring and pipe pullback and installation. The purpose of these services
is to observe the soil and drill mud conditions encountered during construction, evaluate the
applicability of the recommendations presented in this report to the soil conditions encountered,
and recommend appropriate changes to the owner in design or construction procedures if
conditions differ from those described herein.

20162052.001A/SRO15R27870_R1 Page 24 of 26 October 7, 2015 © 2015 Kleinfelder Revised December 11, 2015
6 LIMITATIONS
___________________________________________________________________________________
This report presents information for planning, permitting, design, and construction of a
horizontal directional drill (HDD) crossing for the Fifth Street East Recycled Water Pipeline in
Sonoma, California. It is expected that information contained in this report will be used to help
other design professionals select the ultimate location, length, and depth of the proposed
boring. However, this report should not be used to define site conditions for contractual
purposes and Kleinfelder will accept no liability for changed conditions claims based on this
report.
Recommendations contained in this report are based on materials encountered in Borings KB-1
and KB-2, evaluation of existing geotechnical data, geologic interpretation based on published
articles and geotechnical data, and our present knowledge of the proposed construction.
It is possible that soil conditions could vary between or beyond the points explored, especially if
the originally planned HDD entry and exit points need to be moved during design. If the scope
of the proposed construction, including the proposed alignment location, changes from that
described in this report, we should be notified immediately in order that a review may be made
and any supplemental evaluation and/or recommendations can be provided.
We have prepared this report in accordance with the generally accepted geotechnical
engineering practice as it exists in the site area at the time of our study. No warranty is
expressed or implied.
This report may be used only by the Sonoma Valley County Sanitation District (SVCSD) and
only for the purposes stated, and within 2 years of its issuance. Land use, site conditions (both
on site and off site) or other factors may change over time, and additional work may be required
with the passage of time. Any party other than the client who wishes to use this report shall
notify Kleinfelder of such intended use. Based on the intended use of the report, Kleinfelder
may require that additional work be performed and that an updated report be issued. Non-
compliance with any of these requirements by the client or anyone else will release Kleinfelder
from any liability resulting from the use of this report by any unauthorized party.

20162052.001A/SRO15R27870_R1 Page 25 of 26 October 7, 2015 © 2015 Kleinfelder Revised December 11, 2015
7 REFERENCES
___________________________________________________________________________________
Bennett, D., Ariaratnam, S., et al. (2008), “Horizontal Directional Drilling Good Practices
Guidelines,” Third Edition, HDD Consortium, North American Society for Trenchless
Technologies.
Bennett, D., Ariaratnam, S., et al. (2008), “Horizontal Directional Drilling Good Practices
Guidelines,” Third Edition, HDD Consortium, North American Society for Trenchless
Technologies.
California Geological Survey (2010), Digital Images of Official Maps of Alquist-Priolo
Earthquake Fault Zones of California; CD 2000-003; updated through December 2010
at: http://www.quake.ca.gov/gmaps/ap/ap_maps.htm.
Cetin et al. (2009), Probabilistic model for assessment of cyclically induced reconsolidation
(volumetric strains), ASCE journal of Geotechnical and Geoenvironmental Engineering,
Vol 135, No. 3, pp 387-398
Felzer, K. (2008), “Appendix I: Calculating California Seismicity Rates,” USGS Open File Report
2007-1437I, CGS Special Report 203I, SCEC Contribution #1138I, Version 1.0.
Huffman and Armstrong, C.F. (1980), Geology for Planning in Sonoma County, California
Division of Mines and Geology, Special Report 120.
Idriss, I. M. and Boulanger, R.W. (2008), “Soil Liquefaction During Earthquakes,” Monograph
MNO-12, Earthquake Engineering Research Institute, Oakland, California.
Kanamori, H. (1977), The Energy Release in Great Earthquakes: Journal of Geophysical
Research, Vol. 82, pp. 2981-2987.
Petersen, Mark D., Frankel, Arthur D., Harmsen, Stephen C., Mueller, Charles S., Haller,
Kathleen M., Wheeler, Russell L., Wesson, Robert L., Zeng, Yuehua, Boyd, Oliver S.,
Perkins, David M., Luco, Nicolas, Field, Edward H., Wills, Chris J., and Rukstales,
Kenneth S. (2008), “Documentation for the 2008 Update of the United States National
Seismic Hazard Maps,” U.S. Geological Survey Open-File Report 2008–1128, 61 p.

20162052.001A/SRO15R27870_R1 Page 26 of 26 October 7, 2015 © 2015 Kleinfelder Revised December 11, 2015
PRCI (1998), “Installation of Pipelines Beneath Levees Using Horizontal Directional Drilling”,
Contract CPAR-GL-98-1, Pipeline Research Council International, Inc., April 1998.
Puckett, J.S. (2003), “Analysis of Theoretical versus Actual HDD Pulling Loads,” ASCE
International Conference on Pipeline Engineering and Construction, Baltimore, MD.
Seed, R.B, Cetin, K.O., Moss, R.E.S., Kammerer, A.M., Wu, J., Pestana, J.M., Riemer, M.F.,
Sancio, R.B., Bray, J.D., Kayen, R.E., and Faris, A. (2003), “Recent Advances in Soil
Liquefaction Engineering: A Unified and Consistent Framework,” 26th Annual ASCE Los
Angeles Geotechnical Spring Seminar, Long Beach, California, April 30, 2003.
United States Geological Survey web site: http//geohazards.usgs.gov/deaggint/2008/.
Wagner, D.L., Clahan, K.B., Randolph-Loar C.E., and Sowers, J.M. (2004), Geologic Map of
the Sonoma 7.5’ Quadrangle, Sonoma and Napa Counties, California; A Digital
Database; California Geological Survey.
Witter, R.C., Knudsen, K.L., Sowers, J.M., Wentworth, C.M., Koehler, R.D., Randolph, C.E.
(2006), Maps of the Quaternary Deposits and Liquefaction Susceptibility in the San
Francisco Bay Region, California; U.S. Geological Survey Open File Report 2006-1037.
Youd, T.L., et al., (2001). "Liquefaction Resistance of Soils: Summary Report from the 1996
NCEER and 1998 NCEER/NSF Workshops on Evaluation of Liquefaction Resistance of
Soils.” Journal of Geotechnical and Geoenvironmental Engineering, 127(10), 817-833.

Pla
tes

APPROXIMATE SCALE (feet)
3000 1500 0 3000
SITE LOCATION MAP
1
PLATEPROJECT NO.
DRAWN
DRAWN BY
CHECKED BY
FILE NAME
20162052
SEP 2015
JCR
WVM
SITE
N
Reference: National Geographic Holdings, 2000
www.kleinfelder.com
The information included on this graphic representation has been compiled from a variety of sources and is subject to change without notice. Kleinfelder makes no representations or warranties, express or implied, as to accuracy, completeness, timeliness, or rights to the use of such information. This document is not intended for use as a land survey product nor is it designed or intended as a construction design document. The use or misuse of the information contained on this graphic representation is at the sole risk of the party using or misusing the information.
Site Location.ai
FIFTH STREET EAST RECYCLED WATER PIPELINE
PROPOSED NATHANSON CREEK CROSSINGSONOMA, CAS
anta
Ros
a:

NATHANSON CREEK
Reference: SVCSD, Dated: 11/19/14
N
APPROXIMATE SCALE (feet)
30 15 0 30
Approximate Boring Location(Kleinfelder, 2015)
SYMBOLS
KB-2
PROJECT NO.
DRAWN
DRAWN BY
CHECKED BY
FILE NAME
PLATE
www.kleinfelder.com
The information included on this graphic representation has been compiled from a variety of sources and is subject to change without notice. Kleinfelder makes no representations or warranties, express or implied, as to accuracy, completeness, timeliness, or rights to the use of such information. This document is not intended for use as a land survey product nor is it designed or intended as a construction design document. The use or misuse of the information contained on this graphic representation is at the sole risk of the party using or misusing the information.
SITE PLAN
2
20162052
SEP 2015
JCR
MJP FIFTH STREET EAST RECYCLED WATER PIPELINE
PROPOSED NATHANSON CREEK CROSSINGSONOMA, CASite Plan.ai
KB-2KB-1

Boring KB-1
Boring KB-2
~ ~Boring KB-2 was drilled to a depth of 61.5 feet below grade;
approximately 38 feet below the proposed bore path.Boring KB-1 was drilled to a depth of 61 feet below grade;
approximately 40 feet below the proposed bore path.
Reference: SVCSD, Dated: 11/19/14APPROXIMATE HORIZONTAL SCALE: 1”=30’
30 15 0 30
APPROXIMATE VERTICAL SCALE: 1”=7.5’
PLATEPROJECT NO.
DRAWN
DRAWN BY
CHECKED BY
FILE NAMEwww.kleinfelder.com
The information included on this graphic representation has been compiled from a variety of sources and is subject to change without notice. Kleinfelder makes no representations or warranties, express or implied, as to accuracy, completeness, timeliness, or rights to the use of such information. This document is not intended for use as a land survey product nor is it designed or intended as a construction design document. The use or misuse of the information contained on this graphic representation is at the sole risk of the party using or misusing the information.
PROPOSED HDD CROSS SECTION
3
20162052
SEP 2015
JCR
MJP FIFTH STREET EAST RECYCLED WATER PIPELINE
PROPOSED NATHANSON CREEK CROSSINGSONOMA, CACross Section.ai
Reference: Wagner et al. (2004)
Huichica Formation - (early Pleistocene and Pliocene) - Gravel, sand, silt, reworked tuff, clay and conglomerate. Clasts are mostly Sonoma Volcanics but coarse sand is rich in Franciscan pebbles and cobbles.
Th
Qof Alluvial deposits (early to late Pleistocene) - Sandy gravel, silt, and clay.
Qhty Stream terrace deposits (latest Holocene <1,000 years) - Stream terraces deposited as point bar and overbank deposits along Somona Creek; composed of moderately sorted clayey sand and sandy clay with gravel.
Qhly Levee deposits (Holocene <1,000 years).
Qhc Modern stream channel deposits (Holocene <150 years) - Deposits in active, natural stream channels; consists of loose alluvial sand, gravel, and silt.
af Artificial fill (Holocene, historic) - May be engineered and/or non-engineered.
Qf Alluvial fan deposits (latest Pleistocene <~30,000 years to Holocene) - Sand, gravel, silt and clay mapped on gently sloping, fan-shaped, relatively undissected alluvial surfaces.
Unit Explanation
Tsvas
Tsvt
Andesite of Schocken Hill - Gray, aphyric andesite lava flows; interbedded with tuff. A fission track age of 7.9 +/- 0.8 Ma was reported by Fox and others (1985).
Light colored tuff, lithic rich in places. Locally includes tuffaceous, diatomaceous lacustrine sediments. Includes the tuff of Mt. Pisgah (Tsvtp) and the tuff of Lovall Valley (Tsvtl) along the south fork of Agua Caliente Creek.
Symbol Explanation
Contact between map units - Solid where accurately located, dashed whereapproximately located, short dash where inferred, dotted where concealed.
SITE
N
APPROXIMATE SCALE (feet)
2,000 1,000 0 2,000
TsvasTTTsvtTT
PLATEPROJECT NO.
DRAWN
DRAWN BY
CHECKED BY
FILE NAME www.kleinfelder.com
The information included on this graphic representation has been compiled from a variety of sources and is subject to change without notice. Kleinfelder makes no representations or warranties, express or implied, as to accuracy, completeness, timeliness, or rights to the use of such information. This document is not intended for use as a land survey product nor is it designed or intended as a construction design document. The use or misuse of the information contained on this graphic representation is at the sole risk of the party using or misusing the information.
SITE GEOLOGY
4
20162052
SEP 2015
JCR
WVM FIFTH STREET EAST RECYCLED WATER PIPELINE
PROPOSED NATHANSON CREEK CROSSINGSONOMA, CASite Geology.ai

Ap
pen
dix
A

PLATE
A-1FIFTH STREET EAST RECYCLEDWATER PIPELINE
PROPOSED NATHANSON CREEK CROSSINGSONOMA, CALIFORNIA
The report and graphics key are an integral part of these logs. Alldata and interpretations in this log are subject to the explanations andlimitations stated in the report.
Lines separating strata on the logs represent approximateboundaries only. Actual transitions may be gradual or differ fromthose shown.
No warranty is provided as to the continuity of soil or rockconditions between individual sample locations.
Logs represent general soil or rock conditions observed at thepoint of exploration on the date indicated.
In general, Unified Soil Classification System designationspresented on the logs were based on visual classification in the fieldand were modified where appropriate based on gradation and indexproperty testing.
Fine grained soils that plot within the hatched area on thePlasticity Chart, and coarse grained soils with between 5% and 12%passing the No. 200 sieve require dual USCS symbols, ie., GW-GM,GP-GM, GW-GC, GP-GC, GC-GM, SW-SM, SP-SM, SW-SC, SP-SC,SC-SM.
If sampler is not able to be driven at least 6 inches then 50/Xindicates number of blows required to drive the identified sampler Xinches with a 140 pound hammer falling 30 inches.
_
SILTY SANDS, SAND-GRAVEL-SILTMIXTURES
CLAYEY SANDS, SAND-GRAVEL-CLAYMIXTURES
SW-SM
CLAYEY SANDS, SAND-SILT-CLAYMIXTURES
CL
CL-ML
>
<
<
SANDSWITH5% TO12%
FINES
SANDSWITH >
12%FINES
SA
ND
S (
Mor
e th
an h
alf o
f coa
rse
frac
tion
is s
mal
ler
than
the
#4 s
ieve
)
WELL-GRADED SANDS, SAND-GRAVELMIXTURES WITH LITTLE FINES
Cu 4 and/or 1 Cc 3>
CLEANGRAVEL
WITH<5%
FINES
GRAVELSWITH5% TO12%
FINES
OL
CH
CLAYEY GRAVELS,GRAVEL-SAND-CLAY MIXTURES
GRAVELSWITH >
12%FINES
>
Cu 4 and1 Cc 3
>_
_
CALIFORNIA SAMPLER(3 in. (76.2 mm.) outer diameter)
STANDARD PENETRATION SPLIT SPOON SAMPLER(2 in. (50.8 mm.) outer diameter and 1-3/8 in. (34.9 mm.) innerdiameter)
_
GM
GC
GW
GP
GW-GM
GW-GC
_ _
_
INORGANIC CLAYS OF LOW TO MEDIUM PLASTICITY, GRAVELLYCLAYS, SANDY CLAYS, SILTY CLAYS, LEAN CLAYS
GRAPHICS KEY
<
SAMPLE/SAMPLER TYPE GRAPHICS
>
<
<
>
CLEANSANDSWITH<5%
FINES
GR
AV
EL
S (
Mor
e th
an h
alf o
f coa
rse
frac
tion
is la
rger
than
the
#4 s
ieve
)
Cu 6 and/or 1 Cc 3
Cu 6 and/or 1 Cc 3
>
Cu 6 and1 Cc 3
SC-SM
Cu 4 and1 Cc 3
< _
ORGANIC SILTS & ORGANIC SILTY CLAYSOF LOW PLASTICITY
SILTS AND CLAYS(Liquid Limitless than 50)
SILTS AND CLAYS(Liquid Limit
greater than 50)
WELL-GRADED SANDS, SAND-GRAVELMIXTURES WITH LITTLE OR NO FINES
POORLY GRADED SANDS,SAND-GRAVEL MIXTURES WITHLITTLE OR NO FINES
MH
OH
ML
GC-GM
CO
AR
SE
GR
AIN
ED
SO
ILS
(M
ore
than
hal
f of m
ater
ial i
s la
rger
than
the
#200
sie
ve)
UNIFIED SOIL CLASSIFICATION SYSTEM (ASTM D 2487)
<
Cu 6 and1 Cc 3
GP-GM
GP-GC
_
_ _<
>
<
<
>
SP
SP-SM
SP-SC
SM
SC
< _<
>
WELL-GRADED GRAVELS,GRAVEL-SAND MIXTURES WITHLITTLE OR NO FINES
POORLY GRADED GRAVELS,GRAVEL-SAND MIXTURES WITHLITTLE OR NO FINES
WELL-GRADED GRAVELS,GRAVEL-SAND MIXTURES WITHLITTLE FINES
WELL-GRADED GRAVELS,GRAVEL-SAND MIXTURES WITHLITTLE CLAY FINES
POORLY GRADED GRAVELS,GRAVEL-SAND MIXTURES WITHLITTLE FINES
POORLY GRADED GRAVELS,GRAVEL-SAND MIXTURES WITHLITTLE CLAY FINES
SILTY GRAVELS, GRAVEL-SILT-SANDMIXTURES
CLAYEY GRAVELS,GRAVEL-SAND-CLAY-SILT MIXTURES
WELL-GRADED SANDS, SAND-GRAVELMIXTURES WITH LITTLE CLAY FINES
POORLY GRADED SANDS,SAND-GRAVEL MIXTURES WITHLITTLE CLAY FINES
SW
SW-SC
POORLY GRADED SANDS,SAND-GRAVEL MIXTURES WITHLITTLE FINES
Cu 4 and/or 1 Cc 3>
>
FIN
E G
RA
INE
D S
OIL
S(M
ore
than
hal
f of m
ater
ial
is s
mal
ler
than
the
#200
sie
ve)
INORGANIC SILTS AND VERY FINE SANDS, SILTY ORCLAYEY FINE SANDS, SILTS WITH SLIGHT PLASTICITY
ORGANIC CLAYS & ORGANIC SILTS OFMEDIUM-TO-HIGH PLASTICITY
INORGANIC CLAYS OF HIGH PLASTICITY,FAT CLAYS
INORGANIC SILTS, MICACEOUS ORDIATOMACEOUS FINE SAND OR SILT
INORGANIC CLAYS-SILTS OF LOW PLASTICITY, GRAVELLYCLAYS, SANDY CLAYS, SILTY CLAYS, LEAN CLAYS
GROUND WATER GRAPHICS
OBSERVED SEEPAGE
WATER LEVEL (level after exploration completion)
WATER LEVEL (level where first observed)
WATER LEVEL (additional levels after exploration)
NOTES
DRAWN BY:
CHECKED BY:
DATE:
REVISED: -
PLO
TT
ED
: 09
/25/
201
5 0
9:1
5 A
M B
Y:
AM
ay
PROJECT NO.: 20162052
gIN
T F
ILE
: P
RO
JEC
TW
ISE
: Nat
hans
on C
reek
Cro
ssin
g.gp
j
gIN
T T
EM
PLA
TE
: P
RO
JEC
TW
ISE
: KLF
_S
TA
ND
AR
D_G
INT
_LIB
RA
RY
_201
5.G
LB
[GE
O-L
EG
EN
D 1
(G
RA
PH
ICS
KE
Y)
WIT
H U
SC
S]

(# blows/ft) (# blows/ft)
PLATE
(# blows/ft)
A-2FIFTH STREET EAST RECYCLEDWATER PIPELINE
PROPOSED NATHANSON CREEK CROSSINGSONOMA, CALIFORNIA
SubangularRounded Angular
CRITERIA
Very Soft
Soft
Subrounded
Gravel
Sand
Fines
Thumb will penetrate soil more than 1 in. (25 mm.)
Wet
medium
Loose
Very Loose
DENSITY
1000 - 2000
Homogeneous
DESCRIPTION
Dry
Moist
is required to reach the plastic limit.The thread cannot be rerolled after reaching
>6035 - 60
CALIFORNIA
4 - 10
NAME
YR
BPBP
RP
#40 - #10
#200 - #10
Passing #200
3 - 12 in. (76.2 - 304.8 mm.)
3/4 -3 in. (19 - 76.2 mm.)
#4 - 3/4 in. (#4 - 19 mm.)
The thread is easy to roll and not much time
5 - 12
A 1/8-in. (3 mm.) thread cannot be rolled at
5 - 15
15 - 4040 - 70
35 - 65
15 - 35
>70
Damp but no visible water
Visible free water, usually soil is below water table
Cohesive soil that can be broken down into small angular
DENSITY
0 - 15
crumbling when drier than the plastic limit
lumps which resist further breakdown
Fracture planes appear polished or glossy, sometimes striated
Breaks along definite planes of fracture with little resistance
APPARENT
10 - 3030 - 50
>50
less than 1/4-in. thick, note thickness
> 8000
Firm
Hard
Very Hard
Non-plastic
Low (L)
Medium (M)
High (H)
NOTE: AFTER TERZAGHI AND PECK, 1948
<4
65 - 85
Boulders
Green YellowGreen
Blue GreenBlue
Purple BluePurple
Red Purple
4000 - 8000
Weakly
Moderately
Strongly
FIELD TESTDESCRIPTION
It takes considerable time rolling and kneading
coarse
ABBR
R
YGYG
BG
RedYellow Red
Yellow
<5(%)
SAMPLER
or thread cannot be formed when drier than the
any water content.
The thread can barely be rolled and the lump
when drier than the plastic limit
FIELD TEST
Absence of moisture, dusty, dry to the touch
fine
coarse
fine
#10 - #4
GRAINSIZE
>12 in. (304.8 mm.)
3/4 -3 in. (19 - 76.2 mm.)
0.19 - 0.75 in. (4.8 - 19 mm.)
< 1000
SOIL DESCRIPTION KEY
FIELD TESTDESCRIPTION
plastic limit.
the plastic limit. The lump or thread crumbles
limit. The lump or thread can be formed without
Same color and appearance throughout
DESCRIPTION
Inclusion of small pockets of different soils, such as small lenses
CRITERIA
Alternating layers of varying material or color with the layer
0.0029 - 0.017 in. (0.07 - 0.43 mm.)
0.017 - 0.079 in. (0.43 - 2 mm.)
to reach the plastic limit. The thread can be
Lensed
Blocky
Slickensided
Fissured
Laminated
Stratified
DESCRIPTION
None
Strong
Rounded
DESCRIPTION
Cobbles
Thumbnail will not indent soil
Thumb will penetrate soil about 1 in. (25 mm.)
CRITERIA
No visible reaction
Some reaction, with bubbles forming slowly
Violent reaction, with bubbles forming immediately
Weak
0.079 - 0.19 in. (2 - 4.9 mm.)
SPT-N60
Thumb will not indent soil but readily indented with thumbnail
Very DenseDense
Medium Dense
FIELD TEST
NP
< 30
> 50
<0.0029 in. (<0.07 mm.)
rerolled several times after reaching the plastic
SubroundedParticles have smoothly curved sides and no edges
Particles have nearly plane sides but havewell-rounded corners and edges
Particles are similar to angular description but have
of sand scattered through a mass of clay; note thickness
Thumb will indent soil about 1/4-in. (6 mm.)
to fracturing
Alternating layers of varying material or color with layers
Angular
Subangular
LL
30 - 50
Particles have sharp edges and relatively planesides with unpolished surfaces
rounded edges
at least 1/4-in. thick, note thickness
CONSISTENCY
SIEVESIZE
>12 in. (304.8 mm.)
3 - 12 in. (76.2 - 304.8 mm.)
Pea-sized to thumb-sized
Thumb-sized to fist-sized
Larger than basketball-sized
Fist-sized to basketball-sized
Flour-sized and smaller
Rock salt-sized to pea-sized
Sugar-sized to rock salt-sized
Flour-sized to sugar-sized
SIZEAPPROXIMATE
RELATIVE
85 - 100
<4
MODIFIED CASAMPLER
DESCRIPTION
12 - 35
Crumbles or breaks with handling or slight
Crumbles or breaks with considerable
Will not crumble or break with finger pressure
finger pressure
finger pressure
Black N
2000 - 4000
UNCONFINEDCOMPRESSIVE
STRENGTH (qu)(psf)
Amount
fewtrace
littlesomeand
mostly
<55-1015-2530-45
5050-100
Percentage
PLASTICITY
REACTION WITH HYDROCHLORIC ACID
STRUCTURE
CONSISTENCY - FINE-GRAINED SOIL
MOISTURE CONTENT
APPARENT / RELATIVE DENSITY - COARSE-GRAINED SOIL
CEMENTATION
Munsell ColorGRAIN SIZE
ANGULARITY
Particles Present
DRAWN BY:
CHECKED BY:
DATE:
REVISED: -
PLO
TT
ED
: 09
/25/
201
5 0
9:1
6 A
M B
Y:
AM
ay
PROJECT NO.: 20162052
gIN
T F
ILE
: P
RO
JEC
TW
ISE
: Nat
hans
on C
reek
Cro
ssin
g.gp
j
gIN
T T
EM
PLA
TE
: P
RO
JEC
TW
ISE
: KLF
_S
TA
ND
AR
D_G
INT
_LIB
RA
RY
_201
5.G
LB
[GE
O-L
EG
EN
D 2
(S
OIL
DE
SC
RIP
TIO
N K
EY
)]

Surface: Lean CLAY with Sand and Gravel dry (RoadShoulder)
SILT with Sand (ML): low plasticity, light brownishgray, dry to moist, hard, medium to fine grained sand,subrounded gravel to 0.75"
Silty SAND (SM): non-plastic to low plasticity, darkbrown to dark reddish brown, moist, medium dense,coarse to fine grained sand, subrounded to roundedgravel to 0.50", (decreasing fines content with depth)
Poorly-graded SAND with Silt and Gravel (SP-SM):non-plastic, brown, wet, dense, coarse to fine grainedsand, subangular to subrounded gravel to 1.0"
brown to dark brown, subangular to subrounded gravelto 0.75"
No Recovery, subangular to subrounded gravel incuttings to 0.75"
Clayey SAND with Gravel (SC): non-plastic to lowplasticity, grayish brown with occasional reddish brown,wet, very dense, medium to fine grained sand,occasional gravel fragments
Well-graded SAND with Silt and Gravel (SW-SM):grayish brown, wet, very dense, coarse to fine grainedsand, subrounded to rounded gravel to 0.75"
Switch to mud rotary at 18'
89%
83%
94%
78%
NR
NR
67%
SM
SP-SM
SW-SM
24.0 101.3 100
99
59
55
78
14
8.7
26
5.7
BC=112329
BC=5918
BC=71521
BC=101423
BC=131410
BC=152950/6"
BC=213950/6"
LABORATORY RESULTS
Lithologic Description
PAGE:
FIELD EXPLORATION
1 of 2
BORING LOG KB-1
BORING LOG KB-1 PLATE
A-3
Surface Condition: Road Shoulder
Logged By:
Date Begin - End:
Hor.-Vert. Datum:
Weather:
Drill Crew:
Hammer Type - Drop:Not Available CME-55
Andy
Taber Drilling
140 lb. Auto - 30 in.
-90 degreesPlunge:
Drilling Company:
Drilling Method:
Drilling Equipment:
9/09/2015
4.5 in. O.D.Hot Exploration Diameter:
C. Ewing
Mud Rotary
Add
ition
al T
ests
/R
emar
ks
Dep
th (
feet
)
5
10
15
20
25
30
Gra
phi
cal L
og
Rec
over
y(N
R=
No
Rec
over
y)
US
CS
Sym
bol
Wat
erC
onte
nt (
%)
Dry
Uni
t Wt.
(pcf
)
Pas
sing
#4
(%)
Pas
sing
#20
0 (%
)
Liqu
id L
imit
Pla
stic
ity In
dex
(NP
=N
onP
last
ic)
FIFTH STREET EAST RECYCLEDWATER PIPELINE
PROPOSED NATHANSON CREEK CROSSINGSONOMA, CALIFORNIA
Blo
w C
ount
s(B
C)=
Unc
orr.
Blo
ws/
6 in
.
Poc
ket P
en(P
P)=
tsf
CHECKED BY: JCR
DATE: 9/17/2015
DRAWN BY: CSE
REVISED: -
gIN
T F
ILE
: P
RO
JEC
TW
ISE
: Nat
hans
on C
reek
Cro
ssin
g.gp
j
gIN
T T
EM
PLA
TE
: P
RO
JEC
TW
ISE
: KLF
_S
TA
ND
AR
D_G
INT
_LIB
RA
RY
_201
5.G
LB
[KLF
_BO
RIN
G/T
ES
T P
IT S
OIL
LO
G]
PLO
TT
ED
: 09
/25/
201
5 1
0:4
6 A
M B
Y:
Mpu
cci
PROJECT NO.: 20162052
Sam
ple
Typ
e

Well-graded SAND with Silt and Gravel (SW-SM): (continued) grayish brown, wet, very dense, coarse to fine grained sand, subrounded to rounded gravel to 0.75"
Lean/Fat CLAY (CL-CH): medium to high plasticity,olive yellow, moist, hard, coarse to fine grained sand,subrounded gravel to 0.5"
Lean CLAY (CL): mottled olive yellowish andbrownish gray, moist, hard, coarse to fine grained sand
Poorly graded GRAVEL with Clay and Sand (GP-GC):medium plasticity, grayish brown, moist to wet, verydense, coarse to fine grained sand, subrounded gravelto 1.0"
becomes wet, subrounded gravel to 1.4", increase infines content
The boring was terminated at approximately 61.5 ft.below ground surface. The exploration was backfilledwith Neat Cement Grout on September 09, 2015.
55%
67%
2.75%
61%
53%
78%
GROUNDWATER LEVEL INFORMATION: Groundwater was observed at approximately 15 ft. below ground
surface during drilling.GENERAL NOTES:
BC=1950/5"
BC=91118
BC=10812
BC=223250/6"
BC=244250/3"
BC=312223
LABORATORY RESULTS
Lithologic Description
PAGE:
FIELD EXPLORATION
2 of 2
BORING LOG KB-1
BORING LOG KB-1 PLATE
A-3
Surface Condition: Road Shoulder
Logged By:
Date Begin - End:
Hor.-Vert. Datum:
Weather:
Drill Crew:
Hammer Type - Drop:Not Available CME-55
Andy
Taber Drilling
140 lb. Auto - 30 in.
-90 degreesPlunge:
Drilling Company:
Drilling Method:
Drilling Equipment:
9/09/2015
4.5 in. O.D.Hot Exploration Diameter:
C. Ewing
Mud Rotary
Add
ition
al T
ests
/R
emar
ks
Dep
th (
feet
)
40
45
50
55
60
65
Gra
phi
cal L
og
Rec
over
y(N
R=
No
Rec
over
y)
US
CS
Sym
bol
Wat
erC
onte
nt (
%)
Dry
Uni
t Wt.
(pcf
)
Pas
sing
#4
(%)
Pas
sing
#20
0 (%
)
Liqu
id L
imit
Pla
stic
ity In
dex
(NP
=N
onP
last
ic)
FIFTH STREET EAST RECYCLEDWATER PIPELINE
PROPOSED NATHANSON CREEK CROSSINGSONOMA, CALIFORNIA
Blo
w C
ount
s(B
C)=
Unc
orr.
Blo
ws/
6 in
.
Poc
ket P
en(P
P)=
tsf
CHECKED BY: JCR
DATE: 9/17/2015
DRAWN BY: CSE
REVISED: -
gIN
T F
ILE
: P
RO
JEC
TW
ISE
: Nat
hans
on C
reek
Cro
ssin
g.gp
j
gIN
T T
EM
PLA
TE
: P
RO
JEC
TW
ISE
: KLF
_S
TA
ND
AR
D_G
INT
_LIB
RA
RY
_201
5.G
LB
[KLF
_BO
RIN
G/T
ES
T P
IT S
OIL
LO
G]
PLO
TT
ED
: 09
/25/
201
5 1
0:4
6 A
M B
Y:
Mpu
cci
PROJECT NO.: 20162052
Sam
ple
Typ
e

Surface: Lean CLAY with Sand and Gravel dry (RoadShoulder)
Poorly graded SAND with Clay (SP-SC): low plasticity,light grayish brown, dry, very dense, medium to finegrained sand
Poorly graded GRAVEL with Sand (GP): brown tograyish brown, dry, very dense, coarse to fine grainedsand, subangular to subrounded gravel to 0.75"
Poorly graded GRAVEL with Clay and Sand (GP-GC):mottled dark brown and light grayish brown, dry tomoist, dry to moist, dense
Lean/Fat CLAY (CL-CH): medium to high plasticity,brown to grayish brown, moist, hard, fine grained sand
becomes dark brown, trace coarse to fine sand,rootlets
Clayey SAND (SC): non-plastic to low plasticity,grayish brown, moist, dense, coarse to fine grainedsand, (increasing sand content/coarseness with depth)
Poorly graded SAND with Gravel (SP): brownish gray,wet, very dense, coarse to fine grained sand,subangular to subrounded gravel to 0.5"
Switch to mud rotary at 10'
TXUU = 3.4 ksf
83%
89%
83%
100%
78%
83%SP
28.7
26.4
23.5
87.4
97.5
104.2
85
25
3.6
BC=273344
BC=162428
BC=81623
PP=4.5+
BC=71014
PP=4.5+
BC=61726
BC=303250/6"
LABORATORY RESULTS
Lithologic Description
PAGE:
FIELD EXPLORATION
1 of 2
BORING LOG KB-2
BORING LOG KB-2 PLATE
A-4
Surface Condition: Road Shoulder
Logged By:
Date Begin - End:
Hor.-Vert. Datum:
Weather:
Drill Crew:
Hammer Type - Drop:Not Available CME-55
Andy
Taber Drilling
140 lb. Auto - 30 in.
-90 degreesPlunge:
Drilling Company:
Drilling Method:
Drilling Equipment:
9/09/2015
4.5 in. O.D.Hot Exploration Diameter:
C. Ewing
Mud Rotary
Add
ition
al T
ests
/R
emar
ks
Dep
th (
feet
)
5
10
15
20
25
30
Gra
phi
cal L
og
Rec
over
y(N
R=
No
Rec
over
y)
US
CS
Sym
bol
Wat
erC
onte
nt (
%)
Dry
Uni
t Wt.
(pcf
)
Pas
sing
#4
(%)
Pas
sing
#20
0 (%
)
Liqu
id L
imit
Pla
stic
ity In
dex
(NP
=N
onP
last
ic)
FIFTH STREET EAST RECYCLEDWATER PIPELINE
PROPOSED NATHANSON CREEK CROSSINGSONOMA, CALIFORNIA
Blo
w C
ount
s(B
C)=
Unc
orr.
Blo
ws/
6 in
.
Poc
ket P
en(P
P)=
tsf
CHECKED BY: JCR
DATE: 9/17/2015
DRAWN BY: CSE
REVISED: -
gIN
T F
ILE
: P
RO
JEC
TW
ISE
: Nat
hans
on C
reek
Cro
ssin
g.gp
j
gIN
T T
EM
PLA
TE
: P
RO
JEC
TW
ISE
: KLF
_S
TA
ND
AR
D_G
INT
_LIB
RA
RY
_201
5.G
LB
[KLF
_BO
RIN
G/T
ES
T P
IT S
OIL
LO
G]
PLO
TT
ED
: 09
/25/
201
5 1
0:4
6 A
M B
Y:
Mpu
cci
PROJECT NO.: 20162052
Sam
ple
Typ
e

Well-graded SAND with Silt and Gravel (SW-SM):grayish brown to olive yellow, wet, very dense, coarseto fine grained sand, subangular to subrounded gravelto 0.75", (increasing gravel content/coarseness withdepth)
subangular to subrounded gravel to 2.0"
Fat CLAY (CH): high plasticity, gray to bluish gray,moist, firm
Poorly graded GRAVEL with Clay and Sand (GP-GC):low plasticity, olive yellow to grayish brown, moist, verydense, coarse to fine grained sand, subrounded torounded gravel to 2.0"
Lean CLAY (CL): low plasticity, brown to olive yellow,moist, hard, coarse to fine grained sand
Poorly graded GRAVEL with Clay and Sand (GP-GC):non-plastic, light brown to olive yellow, moist, verydense, coarse to fine grained sand, subrounded torounded gravel to 0.5"
The boring was terminated at approximately 61 ft.below ground surface. The exploration was backfilledwith Neat Cement Grout on September 09, 2015.
83%
28%
67%
27%
17%
56%
SW-SM 62 5.3
GROUNDWATER LEVEL INFORMATION: Groundwater was not encountered during drilling or aftercompletion.GENERAL NOTES:
BC=314148
BC=261910
PP=1.5
BC=394732
BC=2150/5"
BC=91519
BC=2750/3"
LABORATORY RESULTS
Lithologic Description
PAGE:
FIELD EXPLORATION
2 of 2
BORING LOG KB-2
BORING LOG KB-2 PLATE
A-4
Surface Condition: Road Shoulder
Logged By:
Date Begin - End:
Hor.-Vert. Datum:
Weather:
Drill Crew:
Hammer Type - Drop:Not Available CME-55
Andy
Taber Drilling
140 lb. Auto - 30 in.
-90 degreesPlunge:
Drilling Company:
Drilling Method:
Drilling Equipment:
9/09/2015
4.5 in. O.D.Hot Exploration Diameter:
C. Ewing
Mud Rotary
Add
ition
al T
ests
/R
emar
ks
Dep
th (
feet
)
40
45
50
55
60
65
Gra
phi
cal L
og
Rec
over
y(N
R=
No
Rec
over
y)
US
CS
Sym
bol
Wat
erC
onte
nt (
%)
Dry
Uni
t Wt.
(pcf
)
Pas
sing
#4
(%)
Pas
sing
#20
0 (%
)
Liqu
id L
imit
Pla
stic
ity In
dex
(NP
=N
onP
last
ic)
FIFTH STREET EAST RECYCLEDWATER PIPELINE
PROPOSED NATHANSON CREEK CROSSINGSONOMA, CALIFORNIA
Blo
w C
ount
s(B
C)=
Unc
orr.
Blo
ws/
6 in
.
Poc
ket P
en(P
P)=
tsf
CHECKED BY: JCR
DATE: 9/17/2015
DRAWN BY: CSE
REVISED: -
gIN
T F
ILE
: P
RO
JEC
TW
ISE
: Nat
hans
on C
reek
Cro
ssin
g.gp
j
gIN
T T
EM
PLA
TE
: P
RO
JEC
TW
ISE
: KLF
_S
TA
ND
AR
D_G
INT
_LIB
RA
RY
_201
5.G
LB
[KLF
_BO
RIN
G/T
ES
T P
IT S
OIL
LO
G]
PLO
TT
ED
: 09
/25/
201
5 1
0:4
6 A
M B
Y:
Mpu
cci
PROJECT NO.: 20162052
Sam
ple
Typ
e

Ap
pen
dix
B

KB-1 5.5 - 6.5 SILT WITH SAND (ML) 24.0 101.3 100 78
KB-1 11.0 SILTY SAND (SM) 99 14
KB-1 16.0 - 18.0 POORLY GRADED SAND WITH SILT AND GRAVEL (SP-SM) 89 59 8.7
KB-1 25.5 CLAYEY SAND WITH GRAVEL (SC) 26
KB-1 30.5 - 31.5 WELL GRADED SAND WITH SILT AND GRAVEL (SW-SM) 90 55 5.7
KB-2 15.5 LEAN/FAT CLAY (CL-CH) 28.7 87.4
KB-2 21.0 LEAN/FAT CLAY (CL-CH) 26.4 97.5
KB-2 26.0 CLAYEY SAND (SC) 23.5 104.2 25
KB-2 30.5 - 31.5 POORLY GRADED SAND WITH GRAVEL (SP) 100 85 3.6
KB-2 35.5 - 36.5 WELL GRADED SAND WITH SILT AND GRAVEL (SW-SM) 94 62 5.3
Pas
sin
g 3
/4"
Sieve Analysis (%)
Pas
sin
g #
4
Pas
sin
g #
200
Atterberg Limits
Liq
uid
Lim
it
Sample Description
Pla
stic
Lim
it
Wat
er C
on
ten
t (%
)
Dry
Un
it W
t. (
pcf
)
ExplorationID Additional Tests
Refer to the Geotechnical Evaluation Report or thesupplemental plates for the method used for the testingperformed above.NP = NonPlastic
TABLELABORATORY TESTRESULT SUMMARY
B-1
Pla
stic
ity
Ind
ex
Depth(ft.)
FIFTH STREET EAST RECYCLEDWATER PIPELINE
PROPOSED NATHANSON CREEK CROSSINGSONOMA, CALIFORNIA
gINT FILE: PROJECTWISE: Nathanson Creek Crossing.gpj
gINT TEMPLATE: PROJECTWISE: KLF_STANDARD_GINT_LIBRARY_2015.GLB [LAB SUMMARY TABLE - SOIL] PLOTTED: 09/25/2015 10:47 AM BY: Mpucci
CHECKED BY:
DRAWN BY:
REVISED: -
DATE:
PROJECT NO.: 20162052
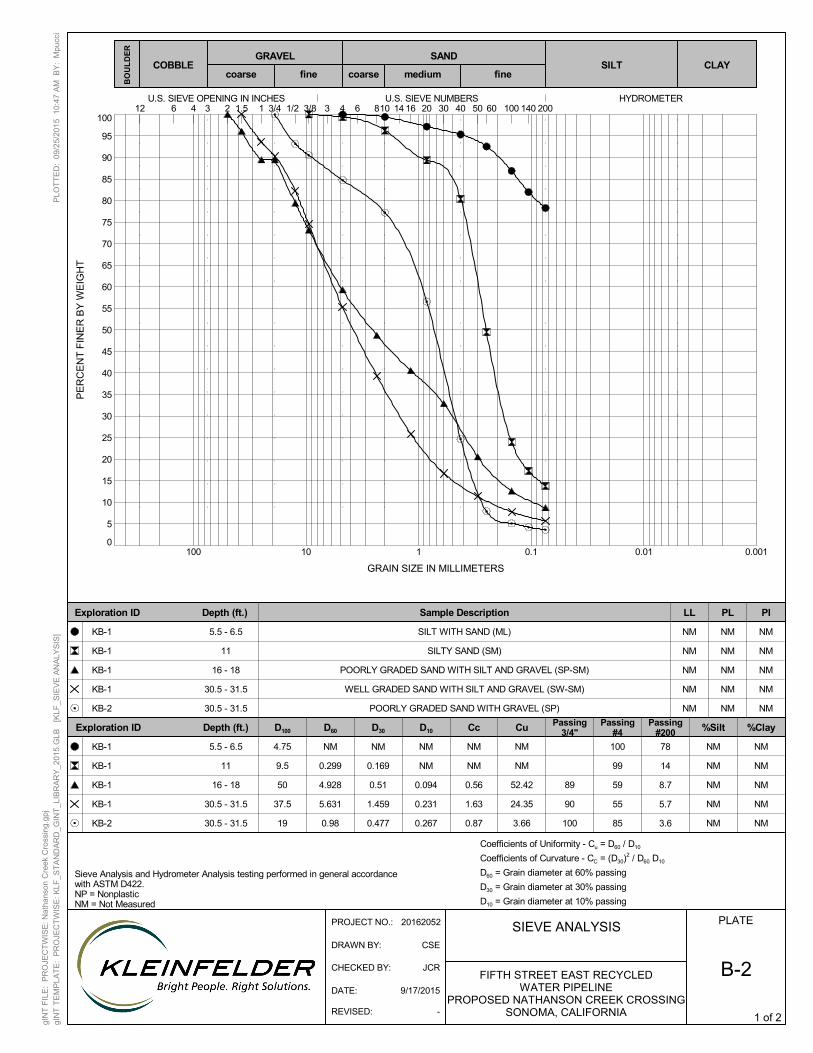
0
5
10
15
20
25
30
35
40
45
50
55
60
65
70
75
80
85
90
95
100
0.0010.010.1110100
Sample Description LL PL PI
%SiltCu %ClayCcExploration ID Depth (ft.)
PLATE
B-2
SIEVE ANALYSIS
50HYDROMETERU.S. SIEVE OPENING IN INCHES U.S. SIEVE NUMBERS
1403 4 20 40
BO
ULD
ER
6 601.5 8 143/4 1/212 3/8 3 10024 16 301 2006 10
Sieve Analysis and Hydrometer Analysis testing performed in general accordancewith ASTM D422.NP = NonplasticNM = Not Measured
D60 D30 D10D100Passing
3/4"Passing
#4Passing
#200
NM
NM
NM
NM
NM
NM
NM
NM
NM
NM
NM
NM
NM
NM
NM
NM
0.169
0.51
1.459
0.477
NM
NM
0.094
0.231
0.267
5.5 - 6.5
11
16 - 18
30.5 - 31.5
30.5 - 31.5
100
99
59
55
85
89
90
100
4.75
9.5
50
37.5
19
NM
NM
NM
NM
NM
NM
NM
NM
NM
NM
Exploration ID Depth (ft.)
PE
RC
EN
T FI
NE
R B
Y W
EIG
HT
GRAIN SIZE IN MILLIMETERS
medium fine
GRAVEL SANDCOBBLE
coarse coarseCLAYSILT
fine
Coefficients of Uniformity - Cu = D60 / D10
Coefficients of Curvature - CC = (D30)2 / D60 D10
D60 = Grain diameter at 60% passingD30 = Grain diameter at 30% passingD10 = Grain diameter at 10% passing
78
14
8.7
5.7
3.6
5.5 - 6.5
11
16 - 18
30.5 - 31.5
30.5 - 31.5
KB-1
KB-1
KB-1
KB-1
KB-2
KB-1
KB-1
KB-1
KB-1
KB-2
NM
0.299
4.928
5.631
0.98
SILT WITH SAND (ML)
SILTY SAND (SM)
POORLY GRADED SAND WITH SILT AND GRAVEL (SP-SM)
WELL GRADED SAND WITH SILT AND GRAVEL (SW-SM)
POORLY GRADED SAND WITH GRAVEL (SP)
NM
NM
0.56
1.63
0.87
NM
NM
52.42
24.35
3.66
FIFTH STREET EAST RECYCLEDWATER PIPELINE
PROPOSED NATHANSON CREEK CROSSINGSONOMA, CALIFORNIA
CHECKED BY: JCR
DATE: 9/17/2015
DRAWN BY: CSE
REVISED: -
gIN
T FI
LE:
PR
OJE
CTW
ISE:
Nat
hans
on C
reek
Cro
ssin
g.gp
jgI
NT
TEM
PLA
TE:
PRO
JEC
TWIS
E: K
LF_S
TAN
DAR
D_G
INT_
LIB
RAR
Y_20
15.G
LB
[KLF
_SIE
VE A
NAL
YSI
S]
PLO
TTE
D:
09/2
5/20
15 1
0:47
AM
BY
: M
pucc
i
PROJECT NO.: 20162052
1 of 2

0
5
10
15
20
25
30
35
40
45
50
55
60
65
70
75
80
85
90
95
100
0.0010.010.1110100
Sample Description LL PL PI
%SiltCu %ClayCcExploration ID Depth (ft.)
PLATE
B-2
SIEVE ANALYSIS
50HYDROMETERU.S. SIEVE OPENING IN INCHES U.S. SIEVE NUMBERS
1403 4 20 40
BO
ULD
ER
6 601.5 8 143/4 1/212 3/8 3 10024 16 301 2006 10
Sieve Analysis and Hydrometer Analysis testing performed in general accordancewith ASTM D422.NP = NonplasticNM = Not Measured
D60 D30 D10D100Passing
3/4"Passing
#4Passing
#200
NMNM NM
1.261 0.28135.5 - 36.5 629425 NMNM
Exploration ID Depth (ft.)
PE
RC
EN
T FI
NE
R B
Y W
EIG
HT
GRAIN SIZE IN MILLIMETERS
medium fine
GRAVEL SANDCOBBLE
coarse coarseCLAYSILT
fine
Coefficients of Uniformity - Cu = D60 / D10
Coefficients of Curvature - CC = (D30)2 / D60 D10
D60 = Grain diameter at 60% passingD30 = Grain diameter at 30% passingD10 = Grain diameter at 10% passing
5.3
35.5 - 36.5KB-2
KB-2 4.392
WELL GRADED SAND WITH SILT AND GRAVEL (SW-SM)
1.29 15.62
FIFTH STREET EAST RECYCLEDWATER PIPELINE
PROPOSED NATHANSON CREEK CROSSINGSONOMA, CALIFORNIA
CHECKED BY: JCR
DATE: 9/17/2015
DRAWN BY: CSE
REVISED: -
gIN
T FI
LE:
PR
OJE
CTW
ISE:
Nat
hans
on C
reek
Cro
ssin
g.gp
jgI
NT
TEM
PLA
TE:
PRO
JEC
TWIS
E: K
LF_S
TAN
DAR
D_G
INT_
LIB
RAR
Y_20
15.G
LB
[KLF
_SIE
VE A
NAL
YSI
S]
PLO
TTE
D:
09/2
5/20
15 1
0:47
AM
BY
: M
pucc
i
PROJECT NO.: 20162052
2 of 2

PLATE
B-3
UNCONSOLIDATED UNDRAINEDTRIAXIAL COMPRESSION TEST
(TXUU)FIFTH STREET EAST RECYCLED
WATER PIPELINEPROPOSED NATHANSON CREEK CROSSING
SONOMA, CALIFORNIA
CHECKED BY: JCR
DATE: 9/17/2015
DRAWN BY: CSE
REVISED: -
PROJECT NO.: 20162052
c = ksf Specimen Shear Picture
1
Diameter, in DO 2.40
Height, in HO 5.81
Water Content, % ω O 26.4
Dry Density, lbs/ft 3 γdo 97.5
Saturation, % S O 101
Void Ratio eO 0.696
Minor Principal Stress, ksf σ3 2.00
27.6fsk ,ssertS rotaiveD mumixaM
Time to ( σ1-σ3)max tnim , f 11.60
6.62
anfsk ,ssertS rotaiveD etamitlU
Rate of strain, %/min 'ε 1.00
Axial Strain at Failure, % εf 11.60
Description of Specimen: Lean/Fat Clay (CL-CH)
Amount of Material Finer than the No. 200, %: mn
LL: nm PL: nm PI: nm G S : 2.65 Assumed Undisturbed Test Method: ASTM D2850
Membrane correction applied
Remarks: nm= not measured, na = not applicable
Deviator Stress @ 15% Axial Strain, ksf (σ 1−σ3)15%
(σ 1−σ3)ult
Total
3.36
4C
21.0
9/15/15
Initi
al
(σ1−σ3) max
Specimen No.
Normal Stress, σ , ksf
Shea
r Str
ess,
T,
ksf
Axial Strain, ε, %
Dev
iato
r Str
ess,
σ1
-σ3,
ksf
Specimen Type:
Boring:
Sample:
Depth, ft:
Test Date:
KB-2
0.00
1.00
2.00
3.00
4.00
5.00
6.00
7.00
8.00
0.0 5.0 10.0 15.0 20.0
Specimen 1
0.00
1.00
2.00
3.00
4.00
5.00
6.00
7.00
8.00
9.00
10.00
0.00 2.00 4.00 6.00 8.00 10.00 12.00 14.00 16.00 18.00 20.00
Total

Ap
pen
dix
C
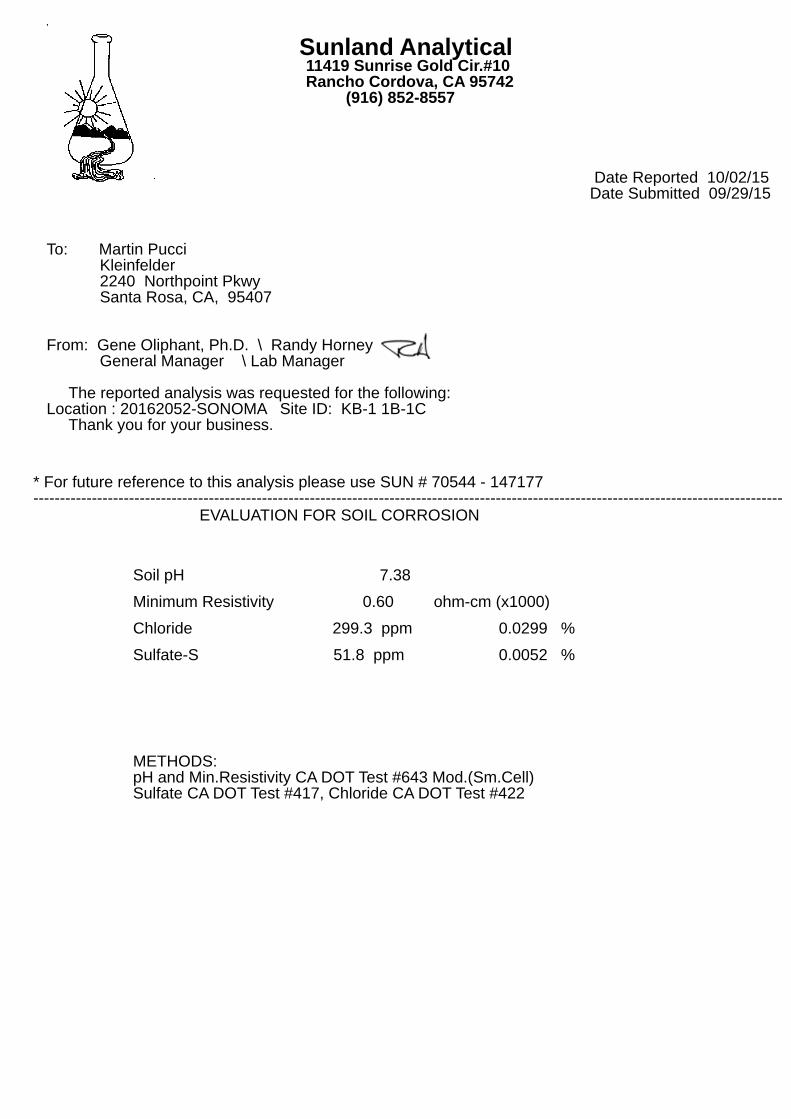
Sunland Analytical 11419 Sunrise Gold Cir.#10 Rancho Cordova, CA 95742 (916) 852-8557
Date Reported 10/02/15 Date Submitted 09/29/15
To: Martin Pucci Kleinfelder 2240 Northpoint Pkwy Santa Rosa, CA, 95407
From: Gene Oliphant, Ph.D. \ Randy Horney General Manager \ Lab Manager
The reported analysis was requested for the following:Location : 20162052-SONOMA Site ID: KB-1 1B-1C Thank you for your business.
* For future reference to this analysis please use SUN # 70544 - 147177 ---------------------------------------------------------------------------------------------------------------------------------------------
EVALUATION FOR SOIL CORROSION
Soil pH 7.38Minimum Resistivity 0.60 ohm-cm (x1000)Chloride 299.3 ppm 0.0299 %Sulfate-S 51.8 ppm 0.0052 %
METHODS:pH and Min.Resistivity CA DOT Test #643 Mod.(Sm.Cell)Sulfate CA DOT Test #417, Chloride CA DOT Test #422

Sunland Analytical 11419 Sunrise Gold Cir.#10 Rancho Cordova, CA 95742 (916) 852-8557
Date Reported 09/30/15 Date Submitted 09/25/15
To: Martin Pucci Kleinfelder 2240 Northpoint Pkwy Santa Rosa, CA, 95407
From: Gene Oliphant, Ph.D. \ Randy Horney General Manager \ Lab Manager
The reported analysis was requested for the following:Location : 20162052-NATHANSON Site ID: KB-2-2B Thank you for your business.
* For future reference to this analysis please use SUN # 70523 - 147101 ---------------------------------------------------------------------------------------------------------------------------------------------
EVALUATION FOR SOIL CORROSION
Soil pH 7.79Minimum Resistivity 3.22 ohm-cm (x1000)Chloride 27.6 ppm 0.0028 %Sulfate-S 6.6 ppm 0.0007 %
METHODS:pH and Min.Resistivity CA DOT Test #643 Mod.(Sm.Cell)Sulfate CA DOT Test #417, Chloride CA DOT Test #422

Ap
pen
dix
D
Geotechnical-Engineering Report
Geotechnical Services Are Performed for Specific Purposes, Persons, and ProjectsGeotechnical engineers structure their services to meet the specific needs of their clients. A geotechnical-engineering study conducted for a civil engineer may not fulfill the needs of a constructor — a construction contractor — or even another civil engineer. Because each geotechnical- engineering study is unique, each geotechnical-engineering report is unique, prepared solely for the client. No one except you should rely on this geotechnical-engineering report without first conferring with the geotechnical engineer who prepared it. And no one — not even you — should apply this report for any purpose or project except the one originally contemplated.
Read the Full ReportSerious problems have occurred because those relying on a geotechnical-engineering report did not read it all. Do not rely on an executive summary. Do not read selected elements only.
Geotechnical Engineers Base Each Report on a Unique Set of Project-Specific FactorsGeotechnical engineers consider many unique, project-specific factors when establishing the scope of a study. Typical factors include: the client’s goals, objectives, and risk-management preferences; the general nature of the structure involved, its size, and configuration; the location of the structure on the site; and other planned or existing site improvements, such as access roads, parking lots, and underground utilities. Unless the geotechnical engineer who conducted the study specifically indicates otherwise, do not rely on a geotechnical-engineering report that was:• not prepared for you;• not prepared for your project;• not prepared for the specific site explored; or• completed before important project changes were made.
Typical changes that can erode the reliability of an existing geotechnical-engineering report include those that affect: • the function of the proposed structure, as when it’s changed
from a parking garage to an office building, or from a light-industrial plant to a refrigerated warehouse;
• the elevation, configuration, location, orientation, or weight of the proposed structure;
• the composition of the design team; or• project ownership.
As a general rule, always inform your geotechnical engineer of project changes—even minor ones—and request an
assessment of their impact. Geotechnical engineers cannot accept responsibility or liability for problems that occur because their reports do not consider developments of which they were not informed.
Subsurface Conditions Can ChangeA geotechnical-engineering report is based on conditions that existed at the time the geotechnical engineer performed the study. Do not rely on a geotechnical-engineering report whose adequacy may have been affected by: the passage of time; man-made events, such as construction on or adjacent to the site; or natural events, such as floods, droughts, earthquakes, or groundwater fluctuations. Contact the geotechnical engineer before applying this report to determine if it is still reliable. A minor amount of additional testing or analysis could prevent major problems.
Most Geotechnical Findings Are Professional OpinionsSite exploration identifies subsurface conditions only at those points where subsurface tests are conducted or samples are taken. Geotechnical engineers review field and laboratory data and then apply their professional judgment to render an opinion about subsurface conditions throughout the site. Actual subsurface conditions may differ — sometimes significantly — from those indicated in your report. Retaining the geotechnical engineer who developed your report to provide geotechnical-construction observation is the most effective method of managing the risks associated with unanticipated conditions.
A Report’s Recommendations Are Not FinalDo not overrely on the confirmation-dependent recommendations included in your report. Confirmation-dependent recommendations are not final, because geotechnical engineers develop them principally from judgment and opinion. Geotechnical engineers can finalize their recommendations only by observing actual subsurface conditions revealed during construction. The geotechnical engineer who developed your report cannot assume responsibility or liability for the report’s confirmation-dependent recommendations if that engineer does not perform the geotechnical-construction observation required to confirm the recommendations’ applicability.
A Geotechnical-Engineering Report Is Subject to MisinterpretationOther design-team members’ misinterpretation of geotechnical-engineering reports has resulted in costly
Important Information about This
Subsurface problems are a principal cause of construction delays, cost overruns, claims, and disputes.
While you cannot eliminate all such risks, you can manage them. The following information is provided to help.

problems. Confront that risk by having your geo technical engineer confer with appropriate members of the design team after submitting the report. Also retain your geotechnical engineer to review pertinent elements of the design team’s plans and specifications. Constructors can also misinterpret a geotechnical-engineering report. Confront that risk by having your geotechnical engineer participate in prebid and preconstruction conferences, and by providing geotechnical construction observation.
Do Not Redraw the Engineer’s LogsGeotechnical engineers prepare final boring and testing logs based upon their interpretation of field logs and laboratory data. To prevent errors or omissions, the logs included in a geotechnical-engineering report should never be redrawn for inclusion in architectural or other design drawings. Only photographic or electronic reproduction is acceptable, but recognize that separating logs from the report can elevate risk.
Give Constructors a Complete Report and GuidanceSome owners and design professionals mistakenly believe they can make constructors liable for unanticipated subsurface conditions by limiting what they provide for bid preparation. To help prevent costly problems, give constructors the complete geotechnical-engineering report, but preface it with a clearly written letter of transmittal. In that letter, advise constructors that the report was not prepared for purposes of bid development and that the report’s accuracy is limited; encourage them to confer with the geotechnical engineer who prepared the report (a modest fee may be required) and/or to conduct additional study to obtain the specific types of information they need or prefer. A prebid conference can also be valuable. Be sure constructors have sufficient time to perform additional study. Only then might you be in a position to give constructors the best information available to you, while requiring them to at least share some of the financial responsibilities stemming from unanticipated conditions.
Read Responsibility Provisions CloselySome clients, design professionals, and constructors fail to recognize that geotechnical engineering is far less exact than other engineering disciplines. This lack of understanding has created unrealistic expectations that have led to disappointments, claims, and disputes. To help reduce the risk of such outcomes, geotechnical engineers commonly include a variety of explanatory provisions in their reports. Sometimes labeled “limitations,” many of these provisions indicate where geotechnical engineers’ responsibilities begin and end, to help
others recognize their own responsibilities and risks. Read these provisions closely. Ask questions. Your geotechnical engineer should respond fully and frankly.
Environmental Concerns Are Not Covered The equipment, techniques, and personnel used to perform an environmental study differ significantly from those used to perform a geotechnical study. For that reason, a geotechnical-engineering report does not usually relate any environmental findings, conclusions, or recommendations; e.g., about the likelihood of encountering underground storage tanks or regulated contaminants. Unanticipated environmental problems have led to numerous project failures. If you have not yet obtained your own environmental information, ask your geotechnical consultant for risk-management guidance. Do not rely on an environmental report prepared for someone else.
Obtain Professional Assistance To Deal with MoldDiverse strategies can be applied during building design, construction, operation, and maintenance to prevent significant amounts of mold from growing on indoor surfaces. To be effective, all such strategies should be devised for the express purpose of mold prevention, integrated into a comprehensive plan, and executed with diligent oversight by a professional mold-prevention consultant. Because just a small amount of water or moisture can lead to the development of severe mold infestations, many mold- prevention strategies focus on keeping building surfaces dry. While groundwater, water infiltration, and similar issues may have been addressed as part of the geotechnical- engineering study whose findings are conveyed in this report, the geotechnical engineer in charge of this project is not a mold prevention consultant; none of the services performed in connection with the geotechnical engineer’s study were designed or conducted for the purpose of mold prevention. Proper implementation of the recommendations conveyed in this report will not of itself be sufficient to prevent mold from growing in or on the structure involved.
Rely, on Your GBC-Member Geotechnical Engineer for Additional AssistanceMembership in the Geotechnical Business Council of the Geoprofessional Business Association exposes geotechnical engineers to a wide array of risk-confrontation techniques that can be of genuine benefit for everyone involved with a construction project. Confer with you GBC-Member geotechnical engineer for more information.
8811 Colesville Road/Suite G106, Silver Spring, MD 20910Telephone: 301/565-2733 Facsimile: 301/589-2017
e-mail: [email protected] www.geoprofessional.org
Copyright 2015 by Geoprofessional Business Association (GBA). Duplication, reproduction, or copying of this document, or its contents, in whole or in part, by any means whatsoever, is strictly prohibited, except with GBA’s specific written permission. Excerpting, quoting, or otherwise extracting wording from this document
is permitted only with the express written permission of GBA, and only for purposes of scholarly research or book review. Only members of GBA may use this document as a complement to or as an element of a geotechnical-engineering report. Any other firm, individual, or other entity that so uses this document without
being a GBA member could be commiting negligent or intentional (fraudulent) misrepresentation.