Embed Size (px)
Citation preview

Journal of Multidisciplinary Engineering Science and Technology (JMEST)
ISSN: 3159-0040
Vol. 2 Issue 1, January - 2015
www.jmest.org
JMESTN42350104 6
Geospatial Information System for Crime Analysis and Crime Zone Identification-Case
Study of Katsina, Nigeria Bala, A
1., Bawa, S
2., Lugga, M. S
3., Ajayi, O. G
4.
1,3Department of Geomatics, Ahmadu Bello University Zaria, Nigeria
2, Department of Surveying and Geoinformatics, University of Lagos, Nigeria
4Department of Surveying and Geoinformatics, Federal University of Technology, Minna, Nigeria
[email protected], [email protected]
4
Abstract— Growing interest in the use of
Geographical Information Systems (GIS) has led to its application as a tool in numerous research fields of interest one of which is crime analysis and management. But the situation in Nigeria is at its infancy as the Law Enforcement Agents saddled with the responsibility of combating crime in Nigeria have little or no education on the use of Geospatial Information System and the maintenance of Geo-database in analysing and predicting crime occurrences, patterns and routes to crime spots. Hence, bogus investments by the Federal Government in National Security have not yielded commensurate rewards. Attempt has been made by this research to use GIS as a spatial tool to classify crime zones in Katsina Metropolis, Katsina state of Nigeria, with a view to create crime database of the study area. An analogue map of the study area of scale 1:15,000 and crime records of six years (January, 2004 to December, 2009) were used in the geospatial classification of the types of crime with respect to the spots of occurrences. Areas of high and low frequency of crime occurrence were also highlighted. The study revealed that there is a marked variation in the distribution of crime between and within the zones. Theft and stealing cases accounted for about 45.17% of the total crime cases between 2004 and 2009. Assault accounted for 8.85%, while armed robbery accounted for 8.71% and rape for 6.57%. Murder had 6.57% while House Breaking and Criminal force had 5.90% and 5.09% respectively. Other crime categories contributed less than 5% each.
Keywords—Geospatial Tool, Crime mapping, Crime management, Security, geographic profiling
I INTRODUCTION
Before the advent of the digital world, Hardcopy or analogue maps are the major tools depended on by law enforcement agencies and other allied organizations for monitoring and managing criminal activities. This is not only rigid and laborious; it is also highly time consuming as much as it consumes more resources with trivial results [6].
This classical method of identifying and mapping crime neither provide accurate, reliable and elaborate
data nor does it help in trend prediction and decision support [4]. The way forward is the adoption of sophisticated approaches (Information Technology).
One of such promising technologies employed in the management of crime in developed world is the use of Geospatial information System (GIS) [6].With the help of GIS, since each crime spot has a geographic location, maps well digitized and geo-referenced showing crime spots are generated. These maps help police force and other law enforcement agencies to effectively plan for emergency service delivery, thereby providing mitigation for such issues like theft, and other related crimes. This in a way, aid in intelligence mapping [6].
Nigerian being a developing country is faced with security issues like BOKO HARAM (a popular nomenclature associated to an Islamic sect responsible for terrorism in the North-Eastern part of the country) is yet to fully embrace of GIS in crime mapping viz a viz terrorism.
This research attempts using such technology with a view to map crime zones and their spatial distribution and produce crime database of the study area, so as to get a clue on how such technology could be applied to crime mapping and analysis. Considering the associated benefits in crime analysis using GIS tool, this study has shown the benefit of GIS in crime analysis and management. This study has also produced a database for the study area, which is a positive step toward mitigating security challenges faced by the country as the agency concerned would see the study as a referrer for present and future study.
II REVIEW OF LITERATURE
Crime mapping which allows for identification of hot spots, crime trend and pattern started in 1986 during which the US National Institute of Justice (NIJ) funded the a project aimed at experimenting crime mapping as a plus to community policing [11]. The history of crime mapping can be seen, see for example [10].
Historically, mapping out crime has been an important component of crime analysis. Surveying and Mapping plays a very significant role in crime location, detection, control and monitoring, prediction, and its

Journal of Multidisciplinary Engineering Science and Technology (JMEST)
ISSN: 3159-0040
Vol. 2 Issue 1, January - 2015
www.jmest.org
JMESTN42350104 7
intelligent policing. To mitigate crimes and harness their impact, many law enforcement departments including researchers have embarked on the trend by conducting some form of crime analysis through mapping [8]. This is evident from the work of [8, 7, 3, 9]
III STUDY AREA
Katsina Town located at 12059’N and 7
036’E is the
Headquarter of Katsina Emirate and administratively the capital of Katsina state located at 12
015’N and
7030’E of Nigeria. It has a population of 318,132. The
State was carved out of the old Kaduna State in September 1987. It is bounded in the north by Niger Republic, in the east by Kano and Jigawa States, in the south by Kaduna State and by Zamfara State in the west [5]. Figure A is a map showing the study area.
IV MATERIALS USED FOR THE STUDY
The materials used to carry out this research are;
i. HP Pavilion dv5 Laptop ii. Garmin 76 CSXGPS iii. F2000 Series Printer iv. A1 Scanner v. Road map of Katsina Metropolis at 1: 15,000 vi. ArcGIS 9.2 vii. Microsoft Access and Excel
Fig. A: Map of Nigeria highlighting the study area
V DATA ACQUISITION
Data used for any GIS work can be grouped into non spatial and spatial. And numerous methods exist for obtaining them [2].The non-spatial data include the base map of the study area, crime records of six (6) years (January, 2004 to December, 2009) with their geographic locations, the names of the councillorship wards (which were later used in zoning the area) were also collected from Katsina Local Government Secretariat, the population figures of the study area were collected from the National Population Commission, Katsina branch. Handheld Global Positioning System receiver was used for the spatial data acquisition. Some of the data acquired include the X and Y coordinate of notable crime scenes and the coordinates used for the geo-referencing of the
base map. Table 1.0 Presents the Easting and Northings Coordinate acquired for the purpose of Geo-referencing the base map.
VI CREATION OF ATTRIBUTE AND SPATIAL DATA
This is the step by step procedures used in converting analogue data into digital format. The base map of the study area was scanned using an A1 scanner. ArcGIS 9.2 was used for layer Creation, geo-referencing and other required analysis using coordinates presented in table 1.0.
VII DEMARCATION OF THE CRIME ZONES
To carry out a proper analysis of the trend of crime occurrence in the area of study, there was a need to delineate the area into zones. The study area was divided into thirteen (13) zones. The zoning was done based on the councillorship wards that the metropolis covers. This was done so as to help the police in the deployment of security personnel based on councillorship wards and to assist government to take consideration of councillorship wards that have the higher crime rate when carrying out budgets and also for easy planning by the government. See the Table 2.0 for the grouping of the entire study areas into zones.
All the polygons in the 13 zones were displayed in different colors. Fig. 1.0 is a map showing crime zones in Katsina metropolis. The ascending trend of the legend indicates the severity of crime in the zones.
VIII CREATING DATABASE FOR THE CRIMES
Some parts of the database were created in Microsoft Excel and imported to ArcGIS as dBase III file format while some parts of the database were created directly in the ArcGIS environment. The fields consist of the following information:
- Types of crimes. - Gender of suspect - Crime zones. - Total area of each zone. - Total number of crimes for each zone
Table 1.0: Coordinates used for base map geo-referencing
ADDRESS (LOCATION) EASTING(m) NORTHING(m)
Kofar Kaura Roundabout 349372 1434924
Kofar Kwaya Roundabout 347954 1434761
KSTA Roundabout 346852 1435402
Kofar Guga Roundabout 346882 1437029
GRA Roundabout 351318 1436987
Kiddies International Sch.
Roundabout
350101 1435835
State Secretariat Roundabout 352331 1431806
Steel Rolling Roundabout 351149 1433372
Ulul-albab T-junction 348420 1432183
Journal of Multidisciplinary Engineering Science and Technology (JMEST)
ISSN: 3159-0040
Vol. 2 Issue 1, January - 2015
www.jmest.org
JMESTN42350104 8
Table 2.0: Crime zones with their sub-divisions S/N ZONES LOCATIONS
1. BATAGARAWA I BABBAR RUGA, INWALAVILLAGE, HUK POLY, SABONGARIN YAHUZA, PROPOSED CIVIL
DEFENCE SCHOOL, NEAR COMPANION F.M., ULUL-ALBAB SCH., KATSINAUNIVERSITY
2. BATAGARAWAII DANDAGWAURO, KABAKAWA FOREST RESERVE, EEC/KTSG, BARHIN, TAFAWA BALEWA
WAY, F.C.E., FEDERAL SECRETARIATE, KTARDA STAFF QTRS.,
3. KANGIWA KOFARSORO, SAULAWA, YAR’ADUA, YARANCHI, KAYALWA, YAR’ KUTUNGU, GWAN-
GWAN, GENERAL HOSP., KORAU CINEMA,
4. SHINKAF III KAMBARAWA, KWADO, G.R.A., NEW STADIUM, MOBILE POLICE BARRACK, KANGIWA
ROAD, G.D.S.S. K/ SAURI, AIRPORT COMPLEX, BAGARUWA, YAN DADI, KUKAR GYESA,
BAYAJIDDA ROAD, MAKERA, KADAFAWA, KATSINA GOLF COURSE, ALONG MANI ROAD 5. WAKILIN AREWA I OPEN THEATRE, BALA DANSANI, SABONGIDA, ARMY BARRACK, DUTSEN SAFE,
GIDANSARKIN NASARAWA,
6. WAKILIN AREWA II TSOHUWARKASUWA, YAMMAWA, FARIN YARO, GALADANCHI, SABUWARKOFA,
7. WAKILIN GABAS I RAFUKKA, ZANGUNA, K/SAURI, FILIN SAMJI, MODOJI, GORUBA ROAD, O. OBASANJO
DRIVE, TUDUNWADA, K/BAI,
8. WAKILIN GABAS II KOFAR MARUSA, KERAU, DUTSEN AMARE, S/UNGUWAR K/MARUSA, K/DURBI,
SHA’ISKAWA, TUDUN KATSIRA, OLD C.B.N., MAIKUDI HOTEL, KATSINA GUESS INN,
9. WAKILIN KUDU I AMBUTTAI, RAFINDADI, DANMARNA, UNGUWARMADAWAKI, POST OFFICE,
10. WAKILIN KUDU II SABONLAYI, KWALAN-KWALAN, TEXACO FILLING STATION, DAKI TARA, GARAMA,
KOFARKAURA
11. WAKILIN KUDU III INWALA, K/KWAYA, ABERTOUR, LUNAR CASTLE HOTEL, KOFAR KAURA LAYOUT,
CENTRAL MARKET, LIYAFA PALACE HOTEL, KWABRON DOROWA, KORAMAR NAYALLI, S/
UNGUWAR K/KAURA, 12. WAKILINYAMMA I MAKUDAWA, UNGUWARYARI, FILIN BUGU, K/ GUGA, SOKOTORIMA, TUDUNYAR’ LIHIDDA
13. WAKILIN YAMMA II KOFARYANDAKA, FILIN POLO, K.T.S.A., SHAGARILOWCOST
IX HOT SPOTS OF CRIME IN KATSINA
METROPOLIS
Areas prone or susceptible to crime or criminal activities are known as hot spots. Cool spots are places or areas with less than the average amount of crime or disorder. Some hot spots may be hotter than others [1].
Therefore, if that is the case, we can then calculate the hot spots of crimes of the metropolis using Equation (1):
Total Number of CrimeCasesAverage Crime Incidence =
Total Number of Zones (1)
Where total number of crime cases reported between the study period = 746 and
Total Number of zones = 13
Therefore, Average Crime Incidence = 57
The average crime incidence was used in the creation of crimes zone map and querying used for the analysis as shown pictorially in the analysis.
X RESULTS
Some sample queries were carried out to demonstrate the usability of this project. The results obtained from the queries and analysis are shown in the Fig. 2.0 to 11.0.
Table 3.0 shows the zones, their number of recorded crime cases and their hot spot status or designation while Table 4.0 shows the rate of crimes committed by type. This was also presented diagrammatically as Fig. 7.0.

Journal of Multidisciplinary Engineering Science and Technology (JMEST)
ISSN: 3159-0040
Vol. 2 Issue 1, January - 2015
www.jmest.org
JMESTN42350104 9
Fig. 1.0: a map showing crime zones in Katsina metropolis.
Fig. 2.0: A result of query showing the hot spot zones Fig. 3.0: query showing the zones with armed robbery
cases greater than average.

Journal of Multidisciplinary Engineering Science and Technology (JMEST)
ISSN: 3159-0040
Vol. 2 Issue 1, January - 2015
www.jmest.org
JMESTN42350104 10
Fig. 4.0: query showing the zones with rape cases greater Fig. 5.0: query showing the zones with murder
than average or equal to average cases greater than average or equal to average
Fig. 6.0: query showing the zones with arm robbery, murder & rape cases greater than average or equal to average.

Journal of Multidisciplinary Engineering Science and Technology (JMEST)
ISSN: 3159-0040
Vol. 2 Issue 1, January - 2015
www.jmest.org
JMESTN42350104 11
Table 3.0: Zones with high and low crimes
S/N ZONES NO OF CRIME
CASES DIFF. BTW AVC AND NO OF CRIME CASES
REMARKS
1 BATAGARAWA I 37 -20 NOT HOT SPOT
2 BATAGARAWAII 33 -24 NOT HOT SPOT
3 KANGIWA 77 20 HOT SPOT
4 SHINKAFIII 90 33 HOT SPOT
5 WAKILINAREWA I 35 -22 NOT HOT SPOT
6 WAKILINAREWAII 46 -11 NOT HOT SPOT
7 WAKILINGABAS I 68 11 HOT SPOT
8 WAKILINGABASII 67 10 HOT SPOT
9 WAKILIN KUDU I 22 -35 NOT HOT SPOT
10 WAKILIN KUDU II 41 -16 HOT SPOT
11 WAKILIN KUDU III 145 88 HOT SPOT
12 WAKILINYAMMA I 46 -11 NOT HOT SPOT
13 WAKILINYAMMAII 39 -18 NOT HOT SPOT
Table 4: Rate of Crimes Committed By Type
S/NO. TYPES OF CRIME TOTAL NO. OF CRIME RATE OF CRIME IN % RANKING
1 THEFT AND OTHER STEALING 337 45.17 1st
2 ASSAULT 66 8.85 2nd
3 ARMED ROBBERY 65 8.71 3rd
4 RAPE 49 6.57 4th
5 MURDER 49 6.57 5th
6 HOUSE BREAKING 44 5.9 6th
7 CRIMINAL FORCE 38 5.09 7th
8 MOTORVEHICLE THEFT 32 4.29 8th
9 CRIMINAL INTIMIDATION 19 2.55 10th
10 GREVIOUS HURT AND
WOUND
20 2.68 9th
11 UNNATURAL OFFENCE 10 1.34 12th
12 STORE BREAKING 11 1.47 11th
13 KIDNAPPING 6 0.8 13th

Journal of Multidisciplinary Engineering Science and Technology (JMEST)
ISSN: 3159-0040
Vol. 2 Issue 1, January - 2015
www.jmest.org
JMESTN42350104 12
Fig. 7.0: A pie chart showing the types of crime committed in percentages from 2004 to 2009.
Fig. 8.0: A bar chart showing the total number of crimes (for 2005, 2007 and 2009) against the crime zones.
0
5
10
15
20
25
30
35
BAT. I BAT. II KANG. SHINK.II
W/A I W/A II W/G I W/G II W/K I W/K II W/K III W/Y I W/Y II
2005
2007
2009

Journal of Multidisciplinary Engineering Science and Technology (JMEST)
ISSN: 3159-0040
Vol. 2 Issue 1, January - 2015
www.jmest.org
JMESTN42350104 13
Fig.9.0: A bar chart showing the total number of crimes against zones
Fig. 10.0: A bar chart showing the total number of theft and stealing crimes against zones
Journal of Multidisciplinary Engineering Science and Technology (JMEST)
ISSN: 3159-0040
Vol. 2 Issue 1, January - 2015
www.jmest.org
JMESTN42350104 14
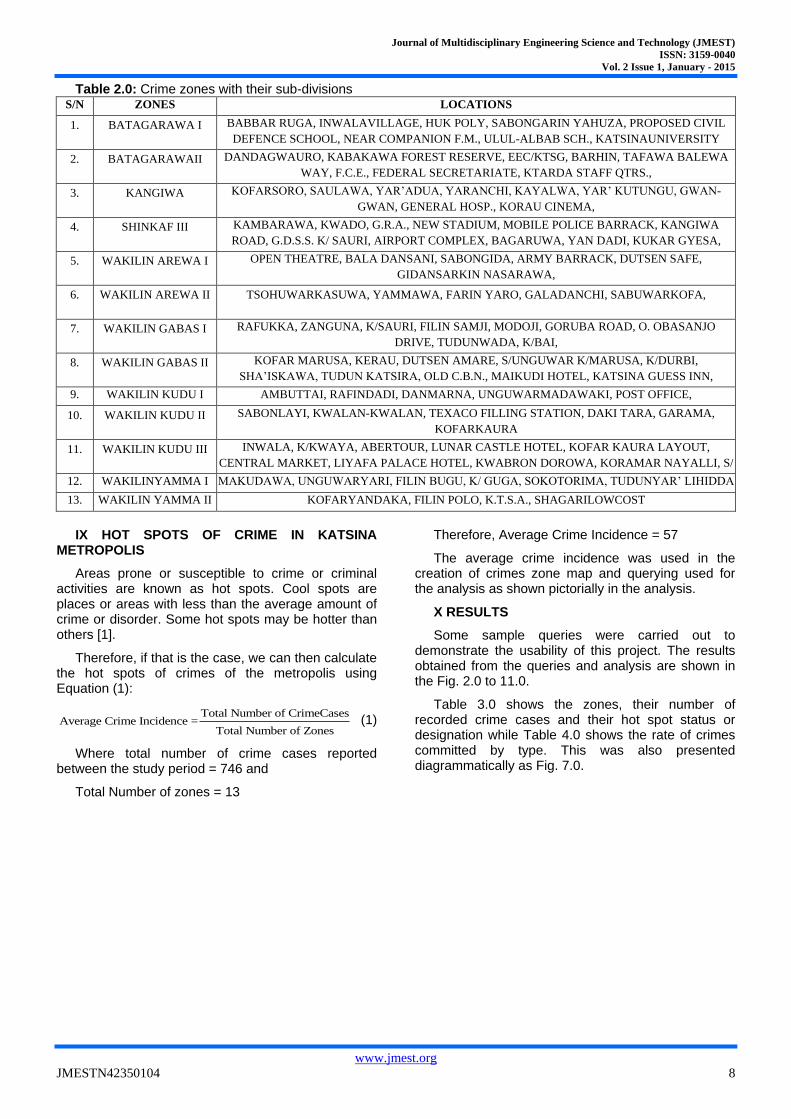
Fig. 11.0: A bar chart showing the total number of armed robbery cases against zone
XI ANALYSIS
The result of the Fig. 1.0 shows the hot spot zones, the colors represent the intensity of the crimes committed. The zone in dark red is the hottest zones with total number 145 cases. From the query in Fig. 2.0 we can see that all the hot spot zones are sharing boundaries among themselves.
The result of the fig. 3.0 shows the areas with armed robbery cases greater than average. It was observed that there are four of such zones (WAKILIN YAMMA I, WAKILIN GABAS, SHINKAFI II and WAKILIN KUDU III) and two (SHINKAFI II and WAKILIN KUDU III) of which are the hottest zones. This is because the average crime incidences are 46-65, 66-85, and 86-120,126-145 respectively for WAKILIN YAMMA I and II, WAKILIN GABAS I and II and SHINKAFI II, WAKILIN KUDU III.
The result in Fig. 4.0 shows the areas with rape cases greater than or equal to average. From the figure we can see that there are six of such zones; three of which are hot spot zones while the remaining three are cool spots.
The result of the query in Fig. 5.0 shows the areas with murder cases greater than or equal to average. From the figure we can see that there are seven of such zones; five of which are hot spot zones while the remaining two are cool spots.
The result of the query in Fig. 6.0 shows the areas that are notorious for armed robbery, murder and rape cases. From the figure we can see that these zones are three in number and all of them belong to hot spot zones. These zones are: Wakilin kudu III, Wakilin gabas I and Wakilin gabas II.
From the Table 3, there are generally five hot spots of crime in the study area, namely Kangiwa, Shinkafi II, Wakilin gabas I, Wakilin GabasII and WakilinKuduIII. It was observed that Wakilin Kudu III is the hottest zone with the difference of 88 from the average.
Table 4 shows that theft and stealing cases alone accounted for about 45.17% of the total crime cases in Katsina Metropolis between 2004 and 2009. Assault accounted for 8.85%, while armed robbery accounted for 8.71% and rape for 6.57%. Murder too has 6.57% while House Breaking and Criminal Force have 5.90% and 5.09% respectively. Other crime categories explain for less than 5% each. This is buttressed with Fig. 7.0.
From Fig. 8.0, the bar chart shows the rate of crimes for the period of study i.e. from 2005 to 2009. It can also be seen that the rate of crime is at increase every year (from 2005-2009).
From Fig 9.0, it can be seen that the zone with the highest recorded cases is the Wakilin Kudu III, with the longest bar, then followed by Shinkafi II. Wakilin Kudu I can be considered to be the coolest spot because it has very few cases recorded.
From Fig. l0.0, Theft and stealing is the highest type of crime committed in the metropolis with 45.17%. It can be seen that the zone with the second highest recorded cases is the Kangiwa zones; this is obviously what we could have expected especially if one consider the fact that this zone has a market known as Yarkutungu where most of the cases were reported to have happened.
Fig. 11.0 shows the rate of armed robbery cases in which Wakilin Kudu III has the highest number of
Journal of Multidisciplinary Engineering Science and Technology (JMEST)
ISSN: 3159-0040
Vol. 2 Issue 1, January - 2015
www.jmest.org
JMESTN42350104 15
cases. It was observed that armed robbery cases are not rampant in the whole metropolis because even the zone with the highest recorded cases has just 14 cases within the period of five years.
XII CONCLUSIONS
The study has effectively used GIS as a tool to develop crime database and map crime zones in Katsina Metropolis. The methodology used includes field work with GPS, police crime records and analogue map. The crime zones were created for the purpose of this study and for effective handling of the data in a GIS environment. Hence, the study posits that application of GIS to crime management in Nigeria will go a long way to aid the prevention and control of crimes as well as to boost the activities of the criminal justice system to fight crime.
From the findings, theft and stealing are the highest type of crime committed in the metropolis, then assaults, followed by robbery, rape and murder, House Breaking and Criminal Force and finally Other crime categories.
XIII RECOMMENDATION FOR FURTHER STUDIES
Every crime has spatial location, so also does crime offenders have their most probable area of residence. Here, geographic profiling comes in. It is recommended that future studies should embark on finding the most probable residence of offenders. This will help in identifying the Hunter, Poacher and the Troller type of offenders which will aid the authority concerned in devising variety of hunting methods.
XIV REFERENCES
[1] Eck, J.E., Chainey S., Cameron J.G., Leitner M. and Wilson R.E., (2005).Mapping Crime: Understanding Hot Spots.U.S. Department of Justice, Office of Justice Programs 810 Seventh Street N.W.Washington, DC20531. Retrieved September 22, 2009, from www.ojp.usdoj.gov/nij.
[2] Fajemirokun, F.,Adewale,O., Idowu,T., Oyewusi,A.,&Maiyegun,B. (2006). A GIS Approach to Crime Mapping and Management in Nigeria: A Case Study of Victoria Island Lagos. Shaping the Change,XXIII FIG Congress, Munich, Germany, October 8 – 13, 2006
[3] Formosa S. (2012). Dilemmas in Crime Mapping: Data dearths, procedures and baseline datasets.
International Journal of Sciences (ISSN 2305 -3925), Nov-2012.
[4] Johnson, C.P. (2000).Crime Mapping and Analysis Using GIS. Conference on Geomatics in Electronic Governance, January 2000, Pune University Campus, Pune 411007 [email protected]
[5] Katsina State (2009). History of Katsina.Retrieved December 12, 2009.from http://www.katsinastate-lgac.com.
[6] Krish, K. (2003), Applications of GIS in Crime Analysis and Geographic Profiling. Project Manager, Banglore, India, NDUSCORP INDIA PVT Ltd. RetrievedOctober 15, 2009 from www.gisdevelopment.net
[7] Odedare, K.O. (2009). “Application of GIS in Spatio Temporal Analysis of Crime in Ogbomoso South”, Nigerian Institution of Surveyors Annual General Meeting and Conference Technical Proceedings, Abia State, Nigeria, 23th April, 2009.
[8] Ojigi, M.L. (2009). Geospatial Mapping for Crime Indexing and Monitoring in Minna and Environs, Nigerian Institution of Surveyors A.G.M and Conference Technical Proceedings, Abia State, Nigeria, 23th April, 2009.
[9] Thangavelu, A., Sathyaraj S.R. & Balasubramanian S. (2013). Assessment of Spatial Distribution of Rural Crime Mapping in India: A GIS Perspective. International Journal of Advanced Remote Sensing and GIS 2013, Volume 2, Issue 1, pp. 70-85, Article ID Tech-62 ISSN 2320 – 0243. Retrieved November 30, 2014, from technical.cloud journals.com/index.php/IJARSG/article/view/Tech-62
[10] Weisburd, D. and McEwen, T. (1998). Crime Mapping and Crime Prevention. In Crime Mapping and Crime Prevention: Crime Prevention Studies, Volume 8.Weisburd, D. and McEwen, T. (eds.) Criminal Justice Press; Monsey, NY. Pp 1-26.
[11] http//www.wikipedia.org/wiki/crim e_mapping. Retrieved November 04, 2014.


![estrategias globales [3159]](https://img.dokumen.tips/doc/110x75/563dbb7b550346aa9aad8e14/estrategias-globales-3159.jpg)