Embed Size (px)
Citation preview

National Center for Supercomputing ApplicationsUniversity of Illinois at Urbana-Champaign
Geospatial Informatics:
From Raw Data To Information and To KnowledgePresenters:Peter Bajcsy, Michal Ondrejcek, Rob Kooper and Luigi MariniNCSA/UIUC

Overview of Geospatial Informatics Presentations at the ILGISA Workshop
Imaginations unbound

Outline• Background to Geospatial Informatics • Introduction to Geospatial Informatics • Prediction Modeling from Spatially Sparse Data
• A Framework for Computer-Assisted Learning of Spatially Dense Recharge/Discharge Rate Models
• Problems Addressed by Spatial Pattern To Learn (SP2Learn)• SP2Learn Architecture and Functionality Overview• Running SP2Learn
• Other Similar Solutions• An Exploratory Framework for Extracting Information and Knowledge
from Remote Sensing Imagery• Integration of Ground and Remote Sensing Variables for Better
Understanding of Algal Biomass Bloom in Illinois
• Summary and Open Problems
3

Background to Geospatial Informatics
4

Background• Funded collaborations in the interdisciplinary areas related
to hydrology, environmental engineering, water quality, ground water and computer science:• ISWS: Momcilo Markus, Yu-Feng Lin• CEE UIUC: Praveen Kumar, Barbara Minsker • UNESCO-IHE Netherlands, Instituto Tecnológico de Costa Rica,
• On-going efforts:• The current collaborations and many other preliminary collaborations
have led to proposals and are currently pending.• NCSA Petascale proposal to NSF
• Terra/Peta/Exa/Zetta/Yotta-scale Computing Will Require Large Investments
• Many Times Large Investments Have to Be Driven by Large Impact Application Drivers
• Institute for Advanced Computation and Technology (IACAT): Advanced Information Theme
• NSF funded efforts to build Earth Observatories
5

Earth Observatories• Multiple efforts to build Earth
Observatories to better understand • our environment in general• the principles governing changes in nature• the decision making required in order to
address the urban and rural environment sustainability challenges.
• Example National Efforts in US: • WATERS, CUAHSI, CLEANER, NEES,
GEON • NEON, ORION, LOOKING, LTER, CZEN,
…
6
WATERS
CUAHSI

Earth Observatories: Challenges • Task: Design, Implement, Test, Deploy, Expand
and Maintain Earth Observatories• Challenges:
• It cannot be done without a multi-disciplinary effort• It is based on rapidly changing information technology
stacks• It has to scale across multiple geographic sites and
continents• It is being built based on community consensus which
has to be reached at some level to make any progress • How can we help building Earth Observatories?
7

Introduction to Geospatial Informatics
8
Geospatial Informatics: Overview
9

Common Requirements• Data:
• Access large amounts of hydrologic, geographic, meteorological, water quality, soil type, land-use and many other types of data
• Ingest and integrate heterogeneous large size data and streaming data• Computational Resources:
• Perform complex CPU and memory intensive data-driven analyses• Utilize a spectrum of distributed computational resources
• Data-driven Analyses (Software):• Design data-driven (data mining, machine learning, pattern recognition,
statistical) analyses• Visualize and interpret data-driven models• Integrate data-driven models with physics/chemistry/bio based models
• Data and Software Integration:• Exercise seamlessly functionality present in heterogeneous software
packages using available computational resources• Provide an environment where heterogeneous visualization and mining
tools could be integrated into workflows, and the analysis workflows could be re-used and modified.
10
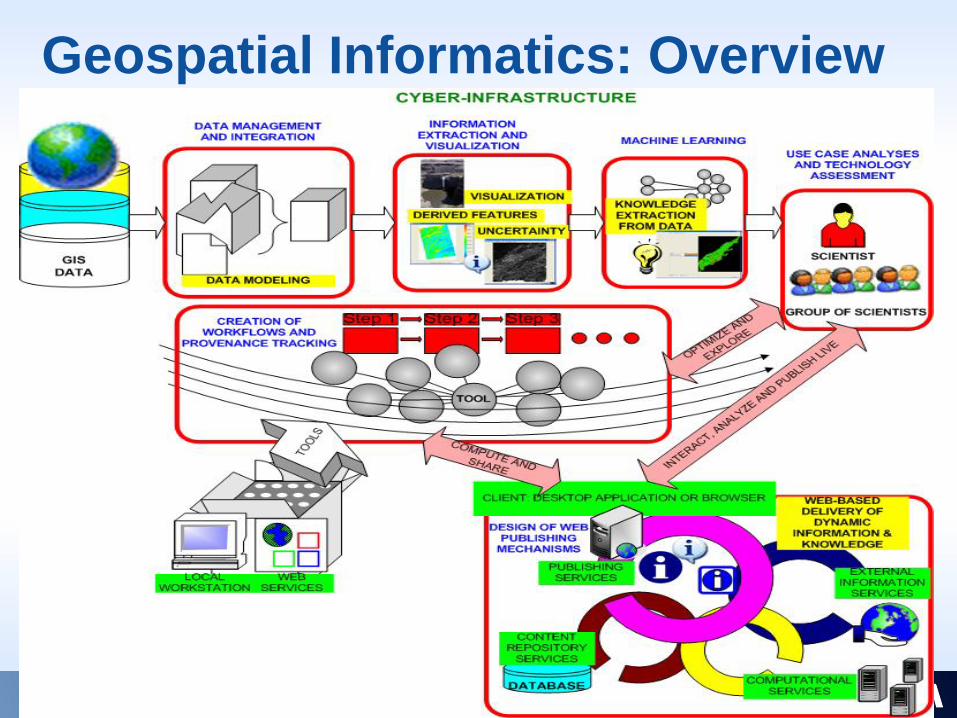
X-informatics Problems• X-informatics Problems: Given some hardware,
software and data, extract information and knowledge from data
• X-informatics Objectives: • Analytical capabilities
• Data-driven analyses, machine learning, pattern recognition, modeling
• Automation• Integration of data and software,
computational scalability, provenance gathering
• Learning• Scientific discovery by visual exploration,
decision support, sharing and collaboration

Terminology
• Raw data: “Anything that can be ingested by a computer”
• Information: “Meaning of raw data that is narrow in scope and it has a simple organization”
• Knowledge: “Interpretation of information that is broad in scope and it is orderly synthesized”
12

Terminology• Informatics (or information science):
• “The process of going from raw data/measurements to information and knowledge”
• X-Informatics:• “Informatics with the focus on inter-
disciplinary research and development of information technology that bridges boundaries across hardware, software and domain users”
13
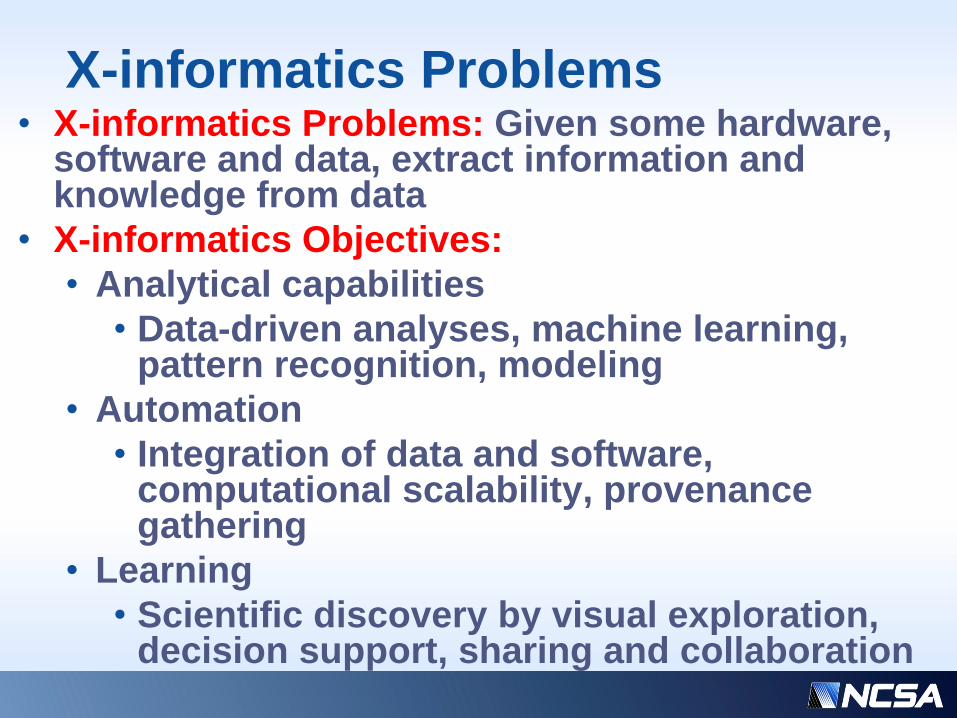
Why X-Informatics?
• Plethora of end-to-end engineering efforts in many scientific disciplines, where X-informatics is the key component
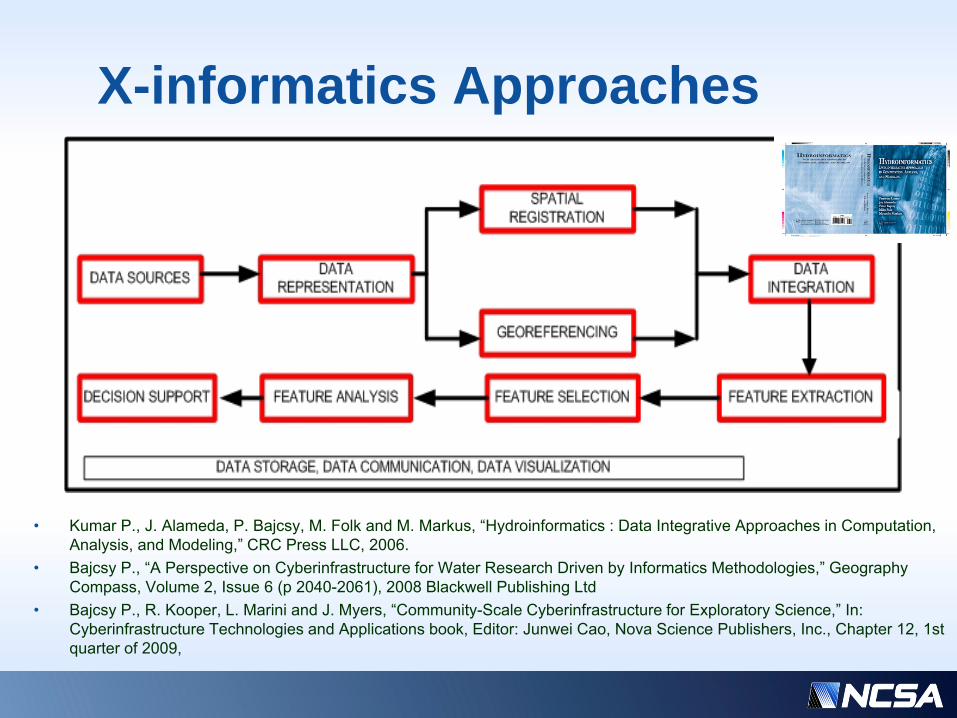
X-informatics Approaches
• Kumar P., J. Alameda, P. Bajcsy, M. Folk and M. Markus, “Hydroinformatics : Data Integrative Approaches in Computation, Analysis, and Modeling,” CRC Press LLC, 2006.
• Bajcsy P., “A Perspective on Cyberinfrastructure for Water Research Driven by Informatics Methodologies,” Geography Compass, Volume 2, Issue 6 (p 2040-2061), 2008 Blackwell Publishing Ltd
• Bajcsy P., R. Kooper, L. Marini and J. Myers, “Community-Scale Cyberinfrastructure for Exploratory Science,” In: Cyberinfrastructure Technologies and Applications book, Editor: Junwei Cao, Nova Science Publishers, Inc., Chapter 12, 1st quarter of 2009,

16
Prediction Modeling from Spatially Sparse Data
-- Spatial Pattern To Learn Framework

17
General Problem
• Compute a set of geo-spatially dense accurate predictions of variables • given a set of direct geo-spatially sparse point
measurements and • auxiliary variables with implicit relationships with
respect to the predicted variable• Motivation:
• minimize cost of taking direct point measurements• maximize accuracy of predictions and • automate discovering relationships among direct
field measurements and indirect variables
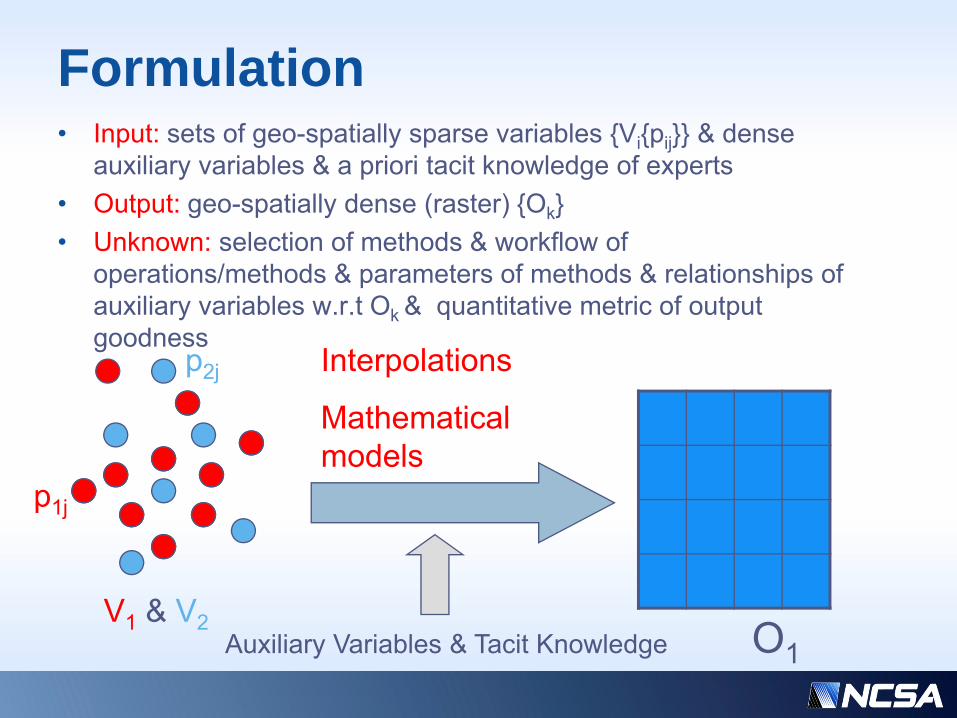
Formulation• Input: sets of geo-spatially sparse variables {Vi{pij}} & dense
auxiliary variables & a priori tacit knowledge of experts• Output: geo-spatially dense (raster) {Ok}• Unknown: selection of methods & workflow of
operations/methods & parameters of methods & relationships of auxiliary variables w.r.t Ok & quantitative metric of output goodness
p1j
Interpolations
Mathematical models
p2j
V1 & V2 O1Auxiliary Variables & Tacit Knowledge

Applied Problem
Discharged Recharged
Recharge and DischargeRate Prediction
Bedrock elevation
Water table elevation

Interdisciplinary Objectives
• Ground Water (Hydrologic Science) View:• Evaluation of Alternative Conceptual (implicit
relationships) and Mathematical Models (explicit relationships)
• Accurate Prediction of Groundwater Recharge and Discharge Rates from Limited Number of Field Measurements
• Computer Science View:• Computer-Assisted Learning to Assess
Alternative Conceptual and Mathematical Models• Optimization of Prediction Models From a Set of
Geo-Spatially Sparse Point MeasurementsDIALOG

21
State-of-the-Art Results• Limited Spatial Resolution and Accuracy
Min. Grid:805mX805m
Recharge zone Noisy pattern or weak R/D
Discharge zone
Discharge
Recharge
Uniform Grid:80mX80m

• MODFLOW is a three-dimensional finite-difference ground-water model • http://water.usgs.gov/nrp/gwsoftware/modflow2005/modflow2005.html -
freeware (2005)• PEST - is software for model calibration, parameter estimation and
predictive uncertainty analysis• http://www.sspa.com/pest/ - freeware (2007); University of Queensland,
Australia • Precipitation-Runoff Modeling System (PRMS) – is deterministic,
distributed-parameter modeling system developed to evaluate the impacts of various combinations of precipitation, climate, and land use on streamflow, sediment yields, and general basin hydrology • http://water.usgs.gov/software/prms.html - freeware (1996); USGS
• Deep Percolation Model (DPM) - facilitates estimation of ground-water recharge under a large range in climatic, landscape, and land-use and land-cover conditions • http://pubs.usgs.gov/sir/2006/5318/; USGS
Existing Software for Groundwater and Surface Water Modeling

Related Work
• Singh A. et al. “Expert-Driven ‘Perceptive’ Models for Reducing User Fatigue in an Interactive Hydrologic Model Calibration Framework”
Conductivity (K) and Hydraulic heads (H) for the hypothetical aquifer

Motivation• Ground Water (Hydrologic) Science:
• Currently, there is no single method that could estimate R/D rates and patterns for all practical applications.
• Therefore, cross analyzing results from various estimation methods and related field information is likely to be superior than using only a single estimation method.
• Computer Science :• It is currently impossible
• (a) to replace an expert with a lot of tacit domain knowledge by computer algorithms or
• (b) to learn by an expert new I/O relationships from a plethora of possible variables and an extremely large space of processing methods and their parameters
• Thus, assisting experts to discover, evaluate and validate new relationships in an iterative way will likely enable
• (a) better understanding of the underlying phenomena, and • (b) more automated and cost-efficient predictions

Problems Addressed by Spatial Pattern To Learn
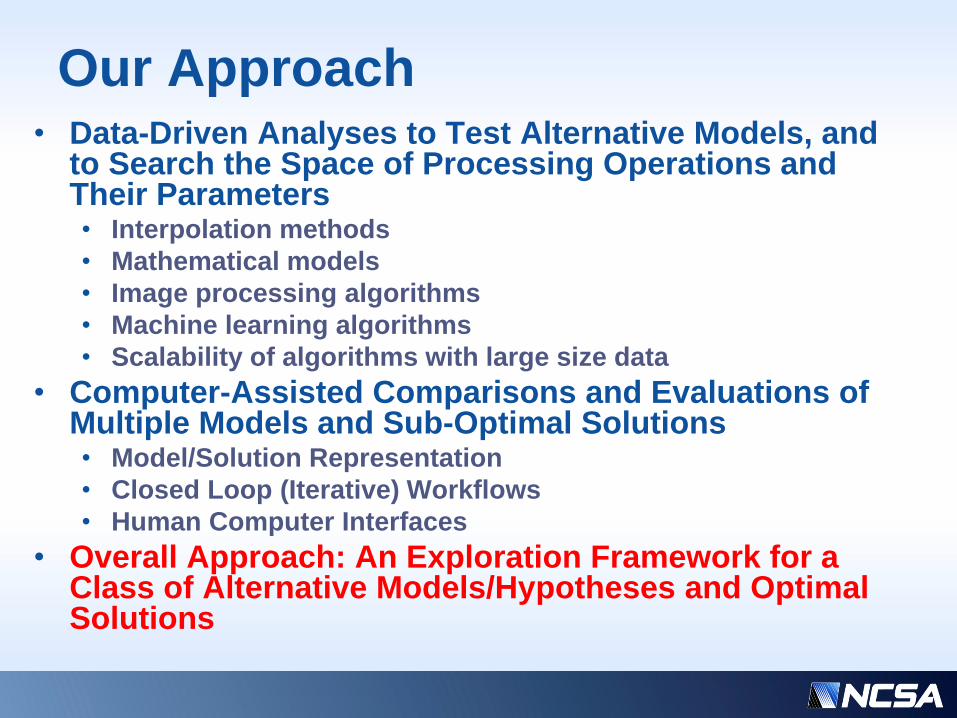
Our Approach• Data-Driven Analyses to Test Alternative Models, and
to Search the Space of Processing Operations and Their Parameters• Interpolation methods• Mathematical models• Image processing algorithms• Machine learning algorithms• Scalability of algorithms with large size data
• Computer-Assisted Comparisons and Evaluations of Multiple Models and Sub-Optimal Solutions• Model/Solution Representation • Closed Loop (Iterative) Workflows• Human Computer Interfaces
• Overall Approach: An Exploration Framework for a Class of Alternative Models/Hypotheses and Optimal Solutions
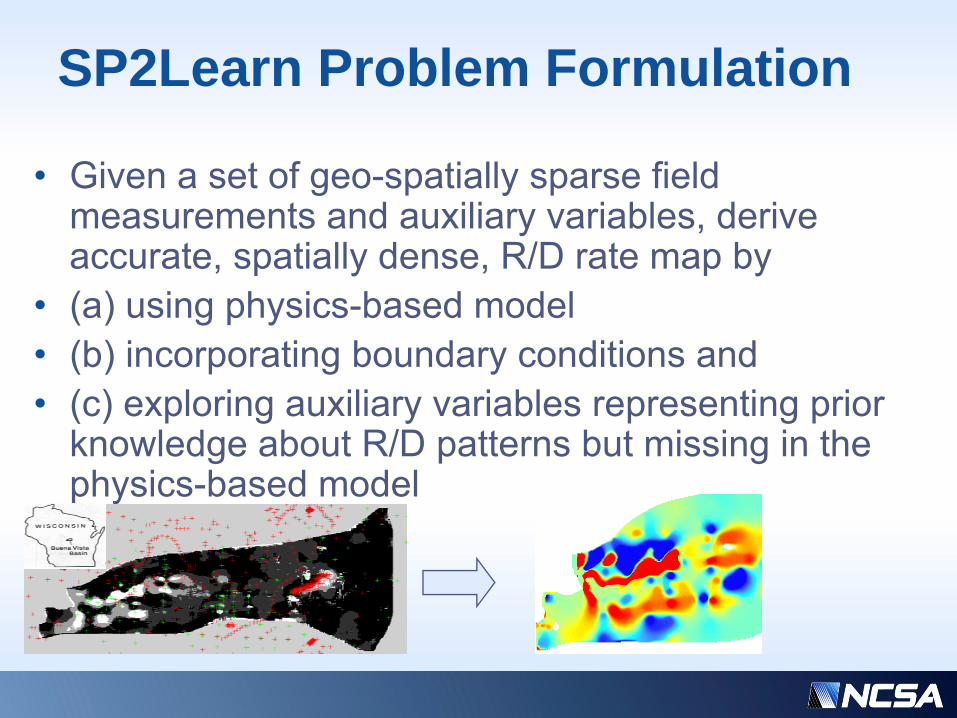
SP2Learn Problem Formulation
• Given a set of geo-spatially sparse field measurements and auxiliary variables, derive accurate, spatially dense, R/D rate map by
• (a) using physics-based model• (b) incorporating boundary conditions and • (c) exploring auxiliary variables representing prior
knowledge about R/D patterns but missing in the physics-based model

Challenges• (1) How to Recognize ‘Meaningful’ Pattern of Predicted
Map?• (2) How to Quantify the Goodness of the Pattern?
Approach:• (1a) Recognize patterns by utilizing multiple image
enhancement and segmentation techniques applied to R/D rate predictions
• (1b) Introduce relationship between R/D pattern and auxiliary (a priori reference) information
• (2a) Define goodness w.r.t. reference information using expert’s selection of ‘meaningful’ relationships
• (2b) Define goodness w.r.t. reference information using complexity of machine learning

Ground water flux=hydraulic conductivity * cell area * gradient of water table elevation (head) over cell distance
Using Physics-Based Model
Incoming water Outgoing waterBed rock
elevation +
Water table elevation +
Hydraulic conductivity +
Discharged Recharged
Field MeasurementsR/D Rate Prediction
+ + ++++ +
+
+
+
++
+
++
* * dhQ K AdL
=

Incorporating Spatial Boundary Conditions
• BC: R/D rate prediction could have smooth transitions and recharge & discharge regions (contiguous pixels) should be clearly delineated
• Approach: Apply Image Restoration and De-noising Techniques• Moving average based low pass filter• TVL (Total Variation regularized L1-norm function) based filter• Morphological operation based filter• Using multiple techniques multiple times
Discharged Recharged

Exploring Auxiliary Variables Driving R/D Patterns
moving average normalization+TVL moving averagenormalization+TVL
Proximity to River: P(R or D area/River is close)~high
Soil Type: P(R or D area/Soil=Clay)~low
Slope: P(R or D area/ slope=high)~low
Prior Tacit Knowledge about R/D and Auxiliary Variables

From Auxiliary Variables To Knowledge and Accurate R/D
Load Variables Integrate Maps
Define ROIMap Ranking
Load R/D Map
Learn from Data-Driven Rules

33
SP2Learn Output• A set of rules that define relationships between
predicted (R/D rate) variable and auxiliary variables
• Modified (more accurate) predictions according to the user selected rules defining relationships of predicted and auxiliary variables
• Sensitivity analysis results with respect to • Methods (interpolations, image enhancement, …)• Models• Parameters
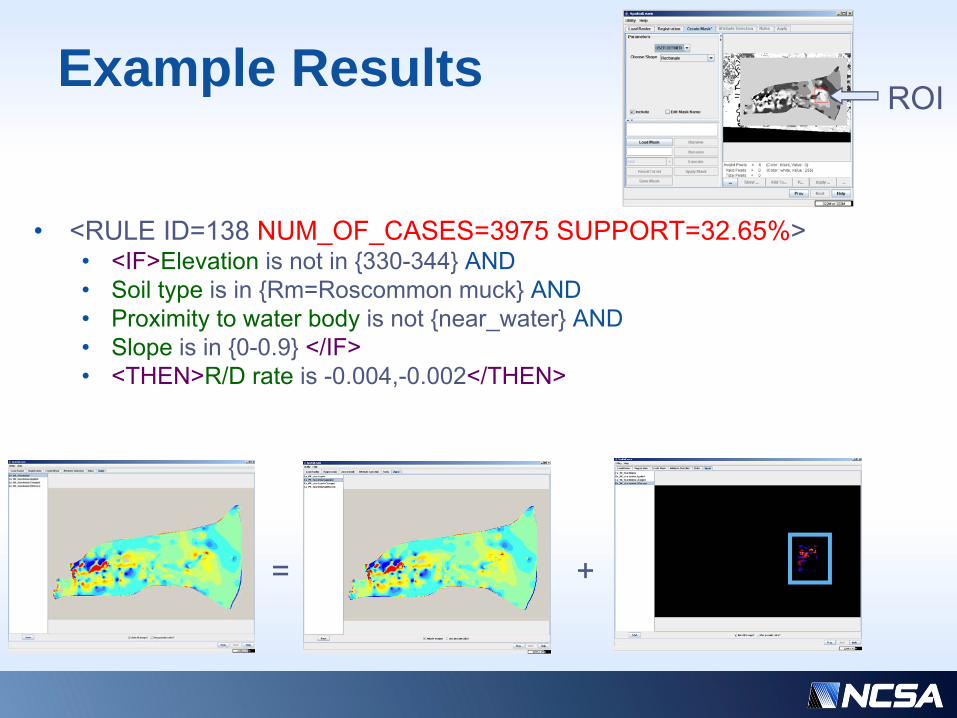
Example Results
• <RULE ID=138 NUM_OF_CASES=3975 SUPPORT=32.65%>• <IF>Elevation is not in {330-344} AND• Soil type is in {Rm=Roscommon muck} AND• Proximity to water body is not {near_water} AND• Slope is in {0-0.9} </IF>• <THEN>R/D rate is -0.004,-0.002</THEN>
= +
ROI

35
SP2Learn Architecture and Functionality

Underlying SP2Learn Technology

SP2Learn Functionality Overview
Load RasterStep
IntegrationStep
RulesStep
User Driven Attribute Selection Step
Apply RuleStep
Create Mask Step
Attribute RankingStep

SP2Learn Workflow

Registration
• Integration of all maps (raster images) to a common projection and spatial resolution
Before “Convert” After “Convert”

Create Mask
A
B
C
Mask Operations
Mask Parameters
Visualization Panel

41
Mask Creation Options in SP2Learn

Ranking of Multiple R/D Rate Maps
Imaginations unbound

Attribute Selection
• Output: Predicted Variable
• Input: Auxiliary Variables
• Check-boxes• Show Table• Prune Tree

Decision Tree Based Modeling
• Tree structure can be represented as a set of rules
Discharge
yes
noyes
no
Recharge DischargeCase A..
Case E.. Case J..
Distance from river ≤ 100 ft?
Soil Type is {sand}?

Rules from Decision Tree• Num: Node number in a
decision tree. • Support(%): Among all
cases satisfying conditions, the ratio of cases having the same class (conclusion).
• # of cases: The number of cases satisfying conditions
• Class: Conclusion of a rule
• Conditions: Conditions of a rule
• MDL Score: MDL score of a decision tree. The less the score is, the better the tree is

Export Rules
• XML format
Export Rules Option

47
Apply Rules
• Visualization of• Modified output variable• Changed pixels• Magnitude of changes (differences)

On-Line Help

49
Other Similar Desktop Solutions

National Center for Supercomputing Applications
GeoLearn
Praveen KumarAssoc. Prof.Civil & Env. Eng.
Peter BajcsyRes. Scientist, NCSA
David TchengNCSA
Wei-Wen FengGrad Student Comp. Sci.
Pratyush SinhaGrad Student Civil and Env. Eng.
Amanda WhiteGrad Student Civil & Env. Eng.
Vikas MehraGrad Student Civil & Env. Eng. David Clutter
NCSA
Ricky RobertsonPost Doc Civil Eng.
Rob KooperNCSA
Ben RuddellGrad Student Civil & Env. Eng.
Qi Li, Grad Student, Dept. of Geology
Chulyun Kim, Grad Student, Comp. Sci.
Yakov Keselman, NCSA
Tim Nee, Undergraduate Student, NCSA

GeoLearn Functionality Overview
51
RAW DATA
INFORMATION
KNOWLEDGE

Types of Research Using Geolearn
• (1) Sensitivity Studies• Data integration and masking variables• Data modeling variables
• (2) Modeling Studies: • Find Common Characteristics
• E.g., using clustering• Find Deviations
• Data-driven modeling• Prediction analysis
• (3) Variable Relevance Ranking52

Deviations ~ Regression Tree Based Modeling of NDVI
corn &soybeans
irrigated river valleymany crops
May 2004, Residual=|RT predicted – measured|

Example of Variable Relevance Ranking
• Prediction of Chl-A in May 2002 using Support Vector Machine (SVM) data-driven modeling technique with linear kernel
• Example conclusion: Chl-A is likely to depend on temperature and unlikely to depend on elevation
Adding VariablesTemperature Slope & Elevation
Ground Measurements
Remote Sensing Measurements
Spatially sparse and temporally incomplete ground measurements & spatially dense and temporally sparse remote sensing measurements of temperature

55
Summary and Open Problems

Summary
• Sp2Learn, Geolearn and other solutions are focusing primarily on supporting analytical flow
• They are java-based desktop solutions• They address software and data integration,
as well as machine learning and exploratory analyses
Imaginations unbound

Open Problems• Automation
• Flexible creation of scripts/workflows • Provenance gathering
• Data sharing and collaboration• Data sharing is supported by exporting intermediate and
resulting files• Parameter sharing?• Visualization sharing?
• Computational and visualization scalability• Out-of-core representation• Utilization of distributed or high-performance computational
resources?
Imaginations unbound

Example: Common Characteristics ~ Eco-region level II
Unsupervised K-means Clustering of Large Size Data ~ (6 Million Pixels) x (29 Variables) x (8 bytes) = 1.4GB

Example: Processing and Visualization of Large Size Data
• Out-of-core representation
• Total file size:372MB
• Total memoryfootprint:less than 30MB
Scalability of algorithms ? Grid Computing ? Algorithms behind web services ?

60
Software and Test Data Download
• Sp2Learn and Geolearn• Download web page of Image Spatial
Data Analysis group at NCSA: http://isda.ncsa.uiuc.edu/download/

Thank you!
• Questions: • Peter Bajcsy [email protected]
• Need More Details• Sp2Learn Project URL:
http://isda.ncsa.uiuc.edu/groundwater/• GeoLearn Project URL:
http://isda.ncsa.uiuc.edu/geolearn/geolearn.html
• Publications: http://isda.ncsa.uiuc.edu
61

62
Backup

Acknowledgement
• This research was partially supported by National Aeronautics and Space Administration (NASA), the Faculty Fellow Program at National Center for Supercomputing Applications (NCSA), the Illinois State Water Survey (ISWS) and by NCSA Industrial partners
• The views and conclusions contained in this document are those of the authors and should not be interpreted as representing the official policies, either expressed or implied, of the sponsors.
• Contributions by the members of the Image Spatial Data Analysis (ISDA) Group at NCSA and our collaborators from ISWS, CEE UIUC and International Institutions
Imaginations unbound

64
Common Characteristics ~ Eco-region level III

Model Interpretation by Input Variable Relevance Assignment
Pixel TN EVI
1 3.38 0.22
2 5.1 0.3
Extracted Table
Multiple Learning Methods
SVMKNNRT
Relevance Analyzer
VisualizationModel Relevance
Sample Relevance
Prediction Result
Prediction Error
Point and Raster Integration
Pixel TN
1 3.38
2 5.1

Support of Analytical Flows
66

Automation Support
67

Sharing and Collaboration Support