Embed Size (px)
Citation preview

1 BASICS OF A MONITORING SYSTEM A typical monitoring system consists of a sensor which converts a physical input into an electrical output and of a recorder which digitises and stores the analogue sensor signal on a storage device. Other than the used hardware, the extraction of behaviour, damage or fatigue related features from the measured data and its further analysis and use as well as dissemination of associated re-sults are the other substantial components in such systems.
To achieve a successful and efficient monitoring system, in addition to the intrinsic require-ments of the hardware and software, basic site requirements must be met and often these have to be checked in advance. It is important, that all of these essentials are available and promptly maintained during the complete system useful lifetime. Thus to monitor with success, the subject project must be properly designed in advance. This chapter gives an overview of what is required to achieve such a sustainable design. 1.1 General Before the project starts, points like: system lifetime (short or long term measurement), the pro-ject budget and the measurement goals must be defined. In case of public access, it is necessary to get in touch with the local authorities to verify a secure installation and to guarantee proper operation during the full project lifetime. The functions and specifications which are more com-plex are described in the following subchapters. 1.2 Electrical Power Scope The electrical power scope of a monitoring system consists of two parts, the power supply and the connection to ground.
Systems and sensors for monitoring purposes GeoSIG Ltd, Othmarsingen, Switzerland
ABSTRACT: Monitoring of infrastructures in modern urban areas is centrally important toachieve, enhance and sustain human civilisation. This paper discusses the available and future possibilities and solutions for such monitoring purposes. Basic components and typical require-ments of such systems, including generic hardware and software specifications are described. Dif-ferent projects are presented to illustrate how a modern monitoring system can be realised with the help of latest measurement methods and technologies. An overview of the future expectations in the industry is given. Monitoring systems are unique. The utilised products must be flexible to serve the requirements. With the help of the modern technology and the latest developments in the industry as well as the increased understanding of systems and applications almost any project is possible. Efficient monitoring systems will contribute to reduced failure risk, timely operational and safety response, extended lifetime and better maintenance of infrastructures which are the building blocks of further growth, development and sustainability of our modern civilisation.

2 C. Kuendig, M. Sabathy, T. Biro
The most common way to supply power to a monitoring system is the standard AC power, but some other power sources are as well used in different projects. For example in areas where no AC is available, solar panels with batteries are a proven option. When AC power is used, utilis-ing a uninterruptible power supply (UPS) is a good strategy to guarantee the power and function-ing of the system during potential AC losses.
In any case the required power autonomy (running on dedicated resources without any external power source) of the system should be defined regarding any kind of power failure.
The connection to ground is a crucial point. Without a proper ground connection disastrous ef-fects can occur in the sensor lines and severely affect the measurement results. 1.3 Recorder and Sensor Sensors and recorders must be selected according to their working area and the project goal, which means that it must be clear which physical phenomenon, is going to be monitored. For ex-ample a strong motion measurement doesn’t require a high resolution sensor and recorder as in a weak motion measurement; and different strong motion applications require different resolutions to achieve a feasible system. For example systems with higher noise levels are acceptable to use in urban strong motion networks as illustrated in Figure 1 comparing the observed noise levels in urban and non-urban areas.
Figure 1: Observed typical noise levels in urban and non-urban areas
The sensor is defined based on:
- Measurement Unit (g, mm/s…) and range - Output format (Voltage, Current loop, Single ended, Differential…) and range - Dynamic range (dB) - Frequency range (Hz) - Power consumption (W) - Environmental Protection (Operational temperature, humidity, water proofing…) - Price
The recorder is defined based on: - Input format (Voltage, Current loop, Single ended, Differential…) and range - Dynamic range (dB) and range - A/D converter resolution (12 Bit, 16 Bit, 18 Bit, 24 Bit...) - Sampling Rates (50 sps, 100 sps, 200 sps, 500 sps, 1000 sps…) - Channel Quantity (3 channel minimum) - Power consumption (W) - Data Storage (Internal/external, Harddisk, USB stick, Compact Flash card…) - Available communication methods (WiFi, Ethernet, serial…) - Time Synchronisation (GPS, NTP…) - Event Trigger (Level, STA/LTA; time based preset trigger, network trigger) - Data format (ASCII, miniSEED…) - Environmental Protection (Operational temperature, humidity, water proofing…) - Price

DETAILS, Systems and Sensors for monitoring purposes 3
The quantity of the sensors and recorders must be selected based on the feasibility and goals of the monitoring project. The sensor dynamic range must match to the dynamic range of the sensor.
Another point which must be verified is the digitising and recording methods. Digitising and/or recording of the analogue sensor signal may happen at the sensor location, may be concentrated at several junction points, then transmitted to a central location, or may take place only at a cen-tral location. These result in different network topologies which can be categorized as seen in the following figure.
Star
Ring
Bus
Tree
Mesh
Figure 2: Different network topologies Typically due to recent technological developments almost all of these topologies can be used
resulting in a range of applications from having a central recording system which means that one recorder collects all the data, to a fully distributed system which means that a recorder exists at each sensor location. Each method has its advantages and disadvantages. In a central recording system all data is collected and kept at a central location which makes it very comfortable in terms of data interrogation and or system interaction, however depending on the used network to-pology, centralised recording systems may be very demanding mainly in terms of cost and effort spent on installation due to long distances to each measuring point, thus long cables as well as potential data contamination in the analogue sensor signals due to these long cables. In case of the distributed recording systems, issues arise due to common operation (timing, triggering, etc) of the system as a whole, plus data interrogation difficulties due to distributed topology, size and lo-cation factors effect proper positioning of the measuring nodes, and so on. 1.4 Time Source and Synchronisation The time synchronisation between each digitised signal is very important to achieve a data set that consists of several signals with data points which corresponds to the exact same time of occur-rence in the measured phenomenon. Especially for modal analysis, each sample in the data of a sensor must correspond with the time of the samples from other sensors.
GPS delivers the most precise time source and is the most common way to synchronise data in a monitoring system. GPS requires a direct view to sky. One recorder (master) can supply this time source to several recorders (slaves) with the help of an interconnected network, in this case only one GPS receiver is required. In case of such a network, the interconnection can be achieved through a wire or wirelessly. If a wireless time synchronisation network is selected, the radio regulations of the country must be respected.
Since many modern recorders can be connected to the internet, NTP (Network Time Protocol) is another possible time source. With NTP, a synchronisation precision of less than 5 ms can be achieved.
The following figure shows a setup of GeoSIG Ltd interconnected seismic network. The setup consists of ten GSR recorder units. Every GSR has three A/D channels. Each has a sensor con-

4 C. Kuendig, M. Sabathy, T. Biro
nected. The GSR recorders are connected together to have common time and common trigger over wired interconnection. The master time source is the GSR #3 which has a GPS as time source connected. As well the recorders are accessible through the LAN.
Figure 3 : Interconnected recording network (Bus Topology) by GeoSIG Ltd
The next figure demonstrates the cabling difference between a star and tree topology within a
central recording scheme utilising CR-5P multichannel instrument manufactured by GeoSIG Ltd. This example clearly demonstrates how selection of the correct topology is important in the im-plementation of an efficient monitoring project.
Figure 4 : Optimisation of the cabling for a structural monitoring system by GeoSIG Ltd

DETAILS, Systems and Sensors for monitoring purposes 5
1.5 Data Transfer and Storage Recorded data is valuable, thus it is important to maintain the maximum security against data loss or corruption. Data storage is a serious issue. In many cases the data is additionally backed up. The lifetime of each monitoring setup is different and must be defined by the project adminis-trators. Data storage can be either on site, which means that the data is recorded and stored in the recorder at site, or (and in addition) it is possible to collect the data at a central station. In any case adequate storage space needs to be reserved for the expected amount of data. For instance for a one hour continuous recording of 3 channel data at 200 sps with a resolution of 24 Bit re-quires approximately 6 MByte of space in a compressed format (i.e. GeoSIG GBR format). In addition to the sampling rate and resolution, the typical space requirement depends also on the storage format as well as the amplitude context of the data.
For remote storage purposes, an appropriate communication and data transfer method must be defined. This can be realised via sending datastreams of actual data or blocks of recorded data (files) over a wired or wireless (by using a telemetry link on 433 MHz, 2.4 GHz or 5.6 GHz) communication channel.
Nowadays, several modern communication methods exist with the help of latest technology, thus the design of the monitoring system shall consider the most feasible method. The most com-mon method is to utilise the internet in modern applications, where different file transfer protocols may send the files or data to their destination. To achieve an internet connection standard wired or wireless analogue or digital systems as well as GPRS backbones can be used. The connections may be established continuously or dial-up depending on local availabilities. Satellites can as well be utilised to achieve data links at areas that are hard to reach with other communication meth-ods. Older monitoring systems use often analogue modems to make a serial link to their central stations. 1.6 Data Analysis Once the data is stored, analyses can be performed using this data. This is either done manually by the project administrator or automatically with the help of an assortment of software. Such analysis often includes some common and basic algorithms like filtering, integration, FFT, etc as well as highly advanced and customised scientific algorithms such as stochastic and/or statistical methods for modal and structural analysis, especially suited to the nature and goal of the meas-urement undertaken. 1.7 Conclusion and Reporting In many cases an almost-real-time report is generated consisting of the immediate and/or most important measurement results which is very important in cases where a monitoring report is needed due to legal regulations for example in a nuclear power plant or construction monitoring or due to safety or organisation reasons for example in rapid response or alert systems.

6 C. Kuendig, M. Sabathy, T. Biro
2 BRIDGE MONITORING AACHEN ERFTTAL
This example project was realized by Rheinisch-Westfälische Technische Hochschule, RWTH Aachen (Rauert (2009)) in cooperation with the German Railways.
2.1 General In this project a railway bridge in Aachen, Germany was monitored. The bridge is part of the high-speed line from Cologne to Aachen. Both passenger and heavy freight trains are using the bridge quite frequently. Maximum speed is about 245 km/h (ICE and Thalys). On the bridge two trains can pass parallel to each other. Below the bridge there is a major road.
Figure 5 : General View of the Bridge
The preparation and definition phase of the project consisted of:
- Selection of a bridge on the basis of the goal to investigate dynamic behaviour of filler beam bridges near Aachen/Cologne
- Study of the drawings and the design of the bridge - Determination of sensor types and positions - Test measurements for testing sensor type - Contact to local authority in terms of road closure being required for installation
The duration of the monitoring is specified as 2 years. The monitoring started in December 2008 and is expected to be finished at the end of 2010. The goals are:
- Investigation of bridge behavior during train passages - Estimation of bridge properties, fatigue and damage detection - Application of system identification methods
The overall costs were about 51'000 EUR. About 45'000 EUR were used for the system and installation and about 6'000 EUR were used for the power supply.
2.2 Electrical Power Scope The system is powered by standard AC power. No special power autonomy is available. The earth line is connected to the steel construction of the bridge to achieve proper grounding. 2.3 Recorder and Sensor Strains and accelerations due to train passages and ambient vibrations are measured with respec-tive sensors. The sensors are units developed by GBF. The following figure shows the sensor con-figuration utilised on the bridge. Totally 44 sensors are mounted. Each sensor has 3 acceleration channels and 1 strain channel.

DETAILS, Systems and Sensors for monitoring purposes 7
Figure 6 : Sensor Configuration
The following tables show the sensor specifications. The strain sensors are as follows:
Table 1: Strain Sensor Specifications Signal to Noise Distor-tion (SINAD)
70 dB
Total Harmonic Distor-tion (THD)
65 dB
Largest signal To be handled with software max. strain
2% The accelerometers are as follows:
Table 2: Accelerometer Specifications Signal to Noise Distor-tion (SINAD)
70 dB
Total Harmonic Distor-tion (THD)
65 dB
Largest signal To be handled with software ±2 or 6 g
The following figure displays the installed sensors on the steel construction of the bridge.
Figure 7 : The installation of the sensors

8 C. Kuendig, M. Sabathy, T. Biro
The recorder is also a GBF development. The following table gives an overview of the techni-
cal specifications.
Table 3: Recorder Specification. Channels 176 Sampling Rate / Sensor 10 ksps Total Sampling Rate 200 Hz/ sensor in case
of 160 channels
Figure 8 : The monitoring setup in the abutment room
2.4 Data Transfer and Storage The local storage capacity of the recorder is 60 GByte. The data transfer to the GBF Server, which has a capacity of more than 1 TByte, is realized over UMTS. Normally the data is never overwritten, which generates a continuous data archive. The following figure shows the UMTS link antenna.
Figure 9 : UMTS Link for Data Transfer
2.5 Data Analysis Once the data is received in the central, Artemis is used to provide modal analysis results. With the power of this software it is possible to determine and animate the different modes of the bridge.
The first Eigenfrequency of the bridge and related damping can be derived accurately from de-cay curves after train passages.

DETAILS, Systems and Sensors for monitoring purposes 9
Figure 10 : Diagram illustrating all strain gauge signals
Figure 11 : Excitation during a train passage strains
2.6 Conclusion Utilised system and sensors are applicable for measuring bridge behaviour under train loads. A higher sensitivity is required for collecting high-quality ambient data. During operation, UMTS link was sometimes slow or disconnected.
3 BRIDGE MONITORING M5 AND M6
This example project was realized by Vienna Consulting Engineers, VCE (Wenzel (2009)), for the Austrian Railways, ÖBB.
3.1 General In this project the M5 and M6 railway bridges near Melk in Austria are monitored. The following image gives an overview of the location of these bridges.
A
ccel
erat
ion
[m/s
²]
Stra
in [-
]

10 C. Kuendig, M. Sabathy, T. Biro
Figure 12 : M5 and M6 bridge near Melk in Austria
During the preparation period, the equipment to use was defined based on the structure. The
drawings of the bridge were obtained to generate a model to define the required sensor layout. The duration of the monitoring is specified as 2 years. Within this measurement period, the
goal is to identify the structural parameters for system identification and to learn about the char-acteristics and effects of train passages on this kind of structures.
The overall costs were about 46'000 EUR and most of the sensors and the system components could be reused after the project is closed.
3.2 Electrical Power Scope The system is powered by the railroad's AC power supply. The grounding was performed via the steel structure of the bridge. A UPS is utilised to power the system for 8 hours during AC power loss. The complete system requires a maximum of 500 W. 3.3 Recorder and Sensor The following figure shows the measurement setup of the two bridges.
Figure 13 : The measurement setup of the M5 and M6 bridge near Melk in Austria
DETAILS, Systems and Sensors for monitoring purposes 11
Several different types of sensors are used during the permanent monitoring. The specifications
of each sensor is give below. Force Balance Accelerometers which are suitable in permanent monitoring systems and also
during short term measurements were used.
Table 4: EpiSensor ES-T Accelerometer Specifications Type Force Balance Channel(s) 3 Full Scale ±0.25 g, ±0.5 g, ±1 g,
±2 g or ±4 g Bandwith DC to 200 Hz Dynamic Range > 155 dB
Table 5: EpiSensor ES-U Accelerometer Specifications
Type Force Balance Channel(s) 1 Full Scale ±0.25, 0.5, 1, 2 or 4 g Bandwidth DC to 200 Hz Dynamic Range > 140 dB
The displacement sensors were used to measure the horizontal dilatation of the bridge deck.
For this purpose cable extension linear position (CELP) sensors are utilized which can span a long distance for measuring utilizing a retractable steel wire.
Table 6: MicroEpsilon WDS-100-P60 Displacement Sensor Specifications
Type CELP Channel(s) 1 Full Scale 0 - 100 mm Resolution 0.1 mm
To measure the influence of the humidity and temperature to the dynamic bridge behaviour a
combined temperature / humidity sensor is used. In order to get the influence of the temperature to the longitudinal displacement of the bridge, the sensors are placed next to the instrumented bearings.
Table 7: MP100A Temperature / Humidity Sensor Specifications
Type Relative Humidity & Temperature
Channel(s) 2 Full Scale 0 - 100 % RH
–40 - 60 °C Resolution 0.5 % RH
0.1 °C The digitiser module is a µ-MUSYCS from IMC Germany. The resolution is 19 Bit. The re-
corder is VCE's development. 3.4 Time Source and Synchronisation The time source was a GPS. 3.5 Data Transfer and Storage The monitoring system has a 500 GByte hard disk locally on site. The recording is done with a ringbuffer routine. This results in a file lifetime of approximately 6 months, if they are not copied to another location. A VCE internal binary format is used which 10x smaller than an equivalent ASCII file. Single results or calculated values can be downloaded through the web interface and UMTS.

12 C. Kuendig, M. Sabathy, T. Biro
3.6 Data Analysis The data analysis is an automated process in this project. This is done with the VCE BRIMOS 9.12 software.
4 BRIDGE MONITORING SESIA VIADUCT
This project was realized by the University of Pisa (Chellini (2009)) in cooperation with LMS measurement systems.
4.1 General The bridge is located on the new Italian high-speed line between Torino and Milano. The bridge has seven spans and a total length of 322 meter.
The monitoring system is installed on the bridge to stay several months for evaluation of the daily-monthly variation of the main dynamical properties and modal parameters of the bridge as a function of temperature and humidity.
Figure 14 : General View of the span of the bridge
4.2 Electrical Power Scope The system is powered from an AC power source close to the bridge supplied by Rete Ferroviaria Italiana (RFI). The AC power is only available during the service time of the railway line; from 06:50 to 09:50, from 11:50 to 13:50 and from 15:50 to 21:50. During the time while AC is not available, the monitoring system operates with the power of two backup batteries. The battery specifications are 12 VDC 100 Ah. The total power of the system is 50 W. With a battery of 100 Ah capacity, the monitoring system can run without AC power up to 24 Hours. The full system is powered by the interface box developed by GeoSIG Ltd, which is described in the next chapter. 4.3 Recorder and Sensor The recording unit utilizes a LMS system which is a centralised high resolution digitiser. The sampled data can be read out with a standard computer, whereas a MACmini computer is utilised here.

DETAILS, Systems and Sensors for monitoring purposes 13
Figure 15 : System Overview
Different sensors are utilised to discover the modes of the bridge. The following figure illus-
trates how they are mounted.
Figure 16 : Sensor configuration
The accelerometers are four AC-61-V vertical accelerometers and one AC-43 triaxial acceler-
ometer; both are standard sensors of GeoSIG Ltd based on MEMS technology. The specifications are as follows:
Table 8: AC-61-V Accelerometer Specifications
Type Force Balance Channel(s) 1 (Vertical) Full Scale ±2g (0.5g, 1g, 3g, 4 g
optional) Bandwith DC to 100 Hz Dynamic Range > 120 dB
Table 9: AC-43 Accelerometer Specifications
Type Force Balance Channel(s) 3 Full Scale ±2g (0.625g, 1g, 4 g,
5g optional)
FTP Server/Client relationship
Real/Virtual network
GeoSIG Interface Box
VirtualConnection
Host OS
Guest OS
Power Supply
14 C. Kuendig, M. Sabathy, T. Biro
Bandwith DC to 100 Hz Dynamic Range 88.5 dB at 2 g FS (0.1
to 30 Hz) 96.5 dB at 5 g FS
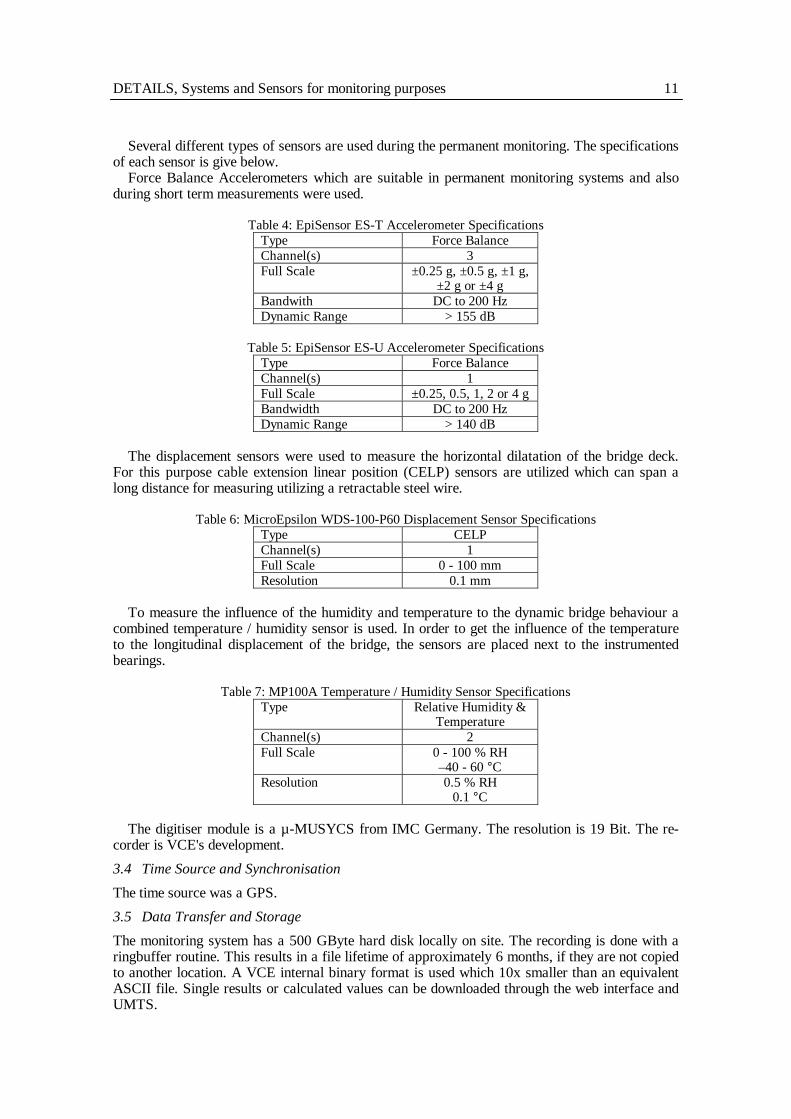
Figure 17 : AC-43 and AC-61-V Sensors
For the temperature and humidity measurement, a MP100A sensor was used. The specifica-
tions are as follow.
Table 10: MP100A Specifications Type Relative Humidity &
Temperature Channel(s) 2 Full Scale 0 - 100 % RH
–40 - 60 °C Resolution 0.5 % RH
0.1 °C To connect all sensors to the LMS system, an interface box was developed by GeoSIG Ltd
which converts the sensor signals to the LMS readable signals. In addition comprehensive over voltage protection on all sensor channels are included, to guarantee a maximum of safety. The next pictures demonstrate the interface box between Sensor/ Power and the LMS as well as the complete recording system.
GeoSIG Interface Box Complete recording system
Figure 18 : System Components
4.4 Time Source and Synchronisation

DETAILS, Systems and Sensors for monitoring purposes 15
No high accuracy absolute time reference (e.g. GPS) was utilised, however time synchronisation among all recorded channels is taken care of the high accuracy synchronised digitiser. 4.5 Data Transfer and Storage
Acquired data is stored in LMS format in the virtual computer running within the MAC oper-ating system in the mini computer. Two types of data are available:
Time based measurements, where, the user specifies the time when the application should start, the time interval for which the application has to repeat the measurements, the time duration which will be measured at the start of every interval, and the bandwidth of the time based meas-urements.
Trigger based measurements, where, the user specifies the duration of the trigger based meas-urements, the pre-trigger interval which will be added to the saved TDF before the trigger level was exceeded, the channel to which the trigger settings apply, the level above which the trigger based measurement will start, and the bandwidth of the trigger based measurement. The trigger based measurements are repeated after the time based measurements until the end of the interval. 4.6 Data Analysis A custom Bridge Monitoring Software developed by the University of Pisa was used. 4.7 Conclusion The high resolution and low noise level of the AC-61-V accelerometer is useful for modal analy-sis. The resolution of the AC-43 is too low and the inherent noise level is not low enough to dis-cover building modes.
5 BRIDGE MONITORING RAILWAY BRIDGE EGLISAU
This proposed project to instrument a Swiss railway bridge in Eglisau will use the latest technol-ogy in cabled monitoring systems. General The bridge was designed by the famous architect Gustave Eiffel and was built within 2 years from 1895 to 1897.
Figure 19 : The Train Bridge
The measurement concept consist of strain gauges, linear variable displacement transducers
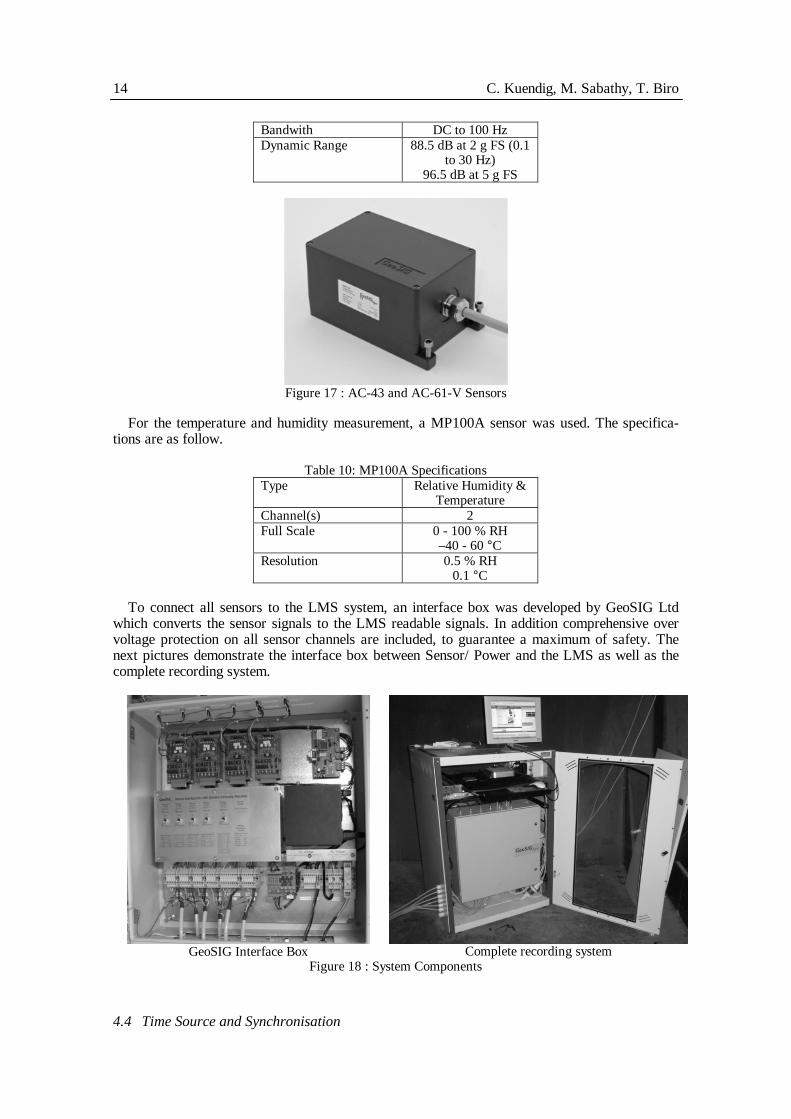
(LVDT), accelerometers and temperature sensors. The recorder is required to be sample the data with at least 100 sps. It will be a long term installation and the equipment will be in operation for more than 5 years. The following figure shows the tentative sensor locations.
16 C. Kuendig, M. Sabathy, T. Biro
Figure 20 : Sensor Locations of the bridge
5.1 Electrical Power Scope This point is still open and not defined by the SBB. But since it is close to the town centre close to the bridge it won't be a problem to obtain a proper power source. 5.2 Recorder and Sensor In total 115 sensors will be installed. 88 different strain gauges will be mounted on the steel con-struction. These strain gauges will be glued. To protect them against environmental effects, they will be sealed with finish and filler and covered with a special foil. The specifications are as fol-lows:
Table 11: Strain Gauges Specifications Type Bridged Range ± 5000 ustrain Resistance 350 Ohm
Additional 21 temperatures sensors are mounted on the bridge. The specifications are as fol-
lows: Table 12: Temperature Sensor Specifications
Type Temperature Temperature Range –30 - +80 °C Resolution 0.5 °C
At the north east side, there will be 4 units of LVDT displacement sensors. The specifications
are as follows: Table 13: Displacement Sensor Specifications
Type LVDT Range ± 250 mm Resolution 0.01 mm
In the middle of the bridge there is a MEMS based Accelerometer. The specifications are as
follows: Table 14: Accelerometer Specifications
Type Force Balance Range ± 2 g Bandwith DC – 200 Hz Dynamic Range > 88 dB

DETAILS, Systems and Sensors for monitoring purposes 17
The large amount of sensors presents a big challenge for mounting and cabling, where the Bus topology as shown in Figure 2 comes into play. With the help of the latest "Array Digitizer" based on field bus technology the costly and heavy effort of cabling can be minimized. This new generation of Array Digitizer have a dedicated digitizer close to each sensor and they are all con-nected to a single data cable which is at the same time the power line. The following figure shows such a system. The small T shaped boxes are the digitisers.
Figure 21 : Array Digitizer
With an oversampling strategy a resolution of 24 Bit can be achieved. The sampling rate can
be selected to go up to 500 sps. The digitizer array can be connected to a standard PC which then records all the data. Different parameters like level trigger or automatic calculations of the data can be selected. 5.3 Time Source and Synchronisation The synchronisation of the each channel is done utilising a GPS receiver. Only one GPS receiver will be required. The timing signal will be provided to all digitiser units via the bus cable. 5.4 Data Transfer and Storage The data can be acquired in different ways. A password protected web interface displays the data. But before, the system will transfer to a backup server and to a central with a UMTS modem. The format of the data will be CSV.
This relatively new method of publishing data through a web interface helps to present data and results to different people immediately and facilitates immediate reaction of relevant parties. 5.5 Data Analysis Automated data reports are going to be generated for the client, which include minimum and maximum values, RMS values, rainflow histograms, etc…
Some further analysis is going to be performed as follows: - Static calculations and measurement: Changes in the bridge static behaviour during op-
eration, Maximum pressure during traffic load, Global and local boundary conditions - Dynamic calculation and measurement: dynamic effects during train loads, delta sigma
coefficients, natural, frequency, global and local damping.
6 CONCLUSIONS
- So far no common and standard monitoring system exists, that is suitable to all cases, since each and every project has different and diverse requirements,
- Standardisation of monitoring systems needs more experience to be gained regarding the requirements, the deployment and the use,
18 C. Kuendig, M. Sabathy, T. Biro
- Optimised systems with versatile and reusable design, high cross-compatibility, easy in-stallation, efficient and straightforward data management and system operation, are be-coming more and more available,
- New technology will allow better performance/cost ratios, such as the Array Digitizer, wireless systems, MEMS sensor technology,
- Enhancing the design of commercialised monitoring systems that would result in equipments that can be easily deployed within more than one network topology may fa-cilitate achieving more productive and sustainable solutions.
REFERENCES
Chellini, G., Personal Communication, Università di Pisa, Dipartimento di Ingegneria Civile, via Gab-ba, 22 56126 Pisa, Italy, 2009.
Rauert, T., Personal Communication, RWTH Rheinisch-Westfälische Technische Hochschule Aachen, Lehrstuhl für Stahlbau und Leichtmetallbau Mies-van-der-Rohe Str. 1 - 52074 Aachen, Germany, 2009.
Wenzel, H., Personal Communication, VCE Vienna Consulting Engineers, Hadikgasse 60, 1140 Vien-na, Austria, 2009.