Embed Size (px)
Citation preview

Georgia’s Property Taxes
by the Numbers
March 8, 2016
David L. Sjoquist Nicholas Warner

Georgia’s Property Taxes by the Numbers frc.gsu.edu
Table of Contents
Introduction 2
Property Tax Base 2
Property Tax Base by Components 8
Property Tax Base by County 9
Property Tax Revenue 13
Property Tax Levies by Type of Government 23
Appendix 25
About the Authors 36
About the Fiscal Research Center 36
2
Georgia’s Property Taxes by the Numbers frc.gsu.edu
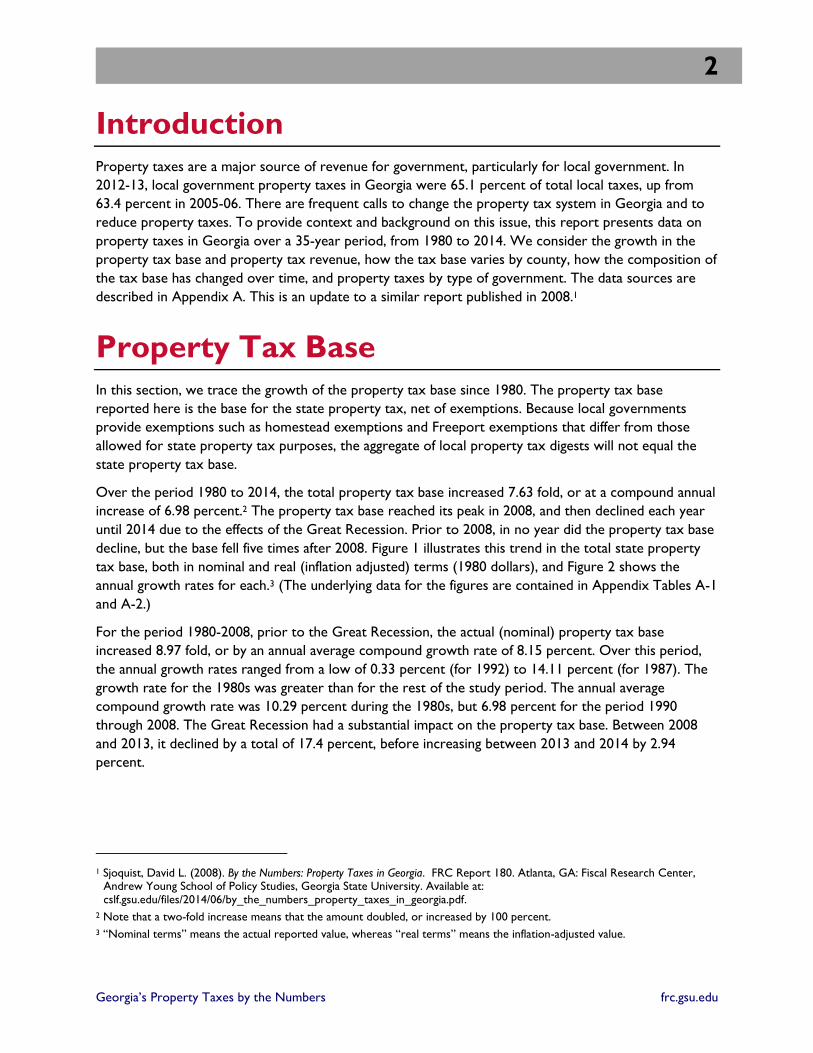
Introduction
Property taxes are a major source of revenue for government, particularly for local government. In
2012-13, local government property taxes in Georgia were 65.1 percent of total local taxes, up from
63.4 percent in 2005-06. There are frequent calls to change the property tax system in Georgia and to
reduce property taxes. To provide context and background on this issue, this report presents data on
property taxes in Georgia over a 35-year period, from 1980 to 2014. We consider the growth in the
property tax base and property tax revenue, how the tax base varies by county, how the composition of
the tax base has changed over time, and property taxes by type of government. The data sources are
described in Appendix A. This is an update to a similar report published in 2008.1
Property Tax Base
In this section, we trace the growth of the property tax base since 1980. The property tax base
reported here is the base for the state property tax, net of exemptions. Because local governments
provide exemptions such as homestead exemptions and Freeport exemptions that differ from those
allowed for state property tax purposes, the aggregate of local property tax digests will not equal the
state property tax base.
Over the period 1980 to 2014, the total property tax base increased 7.63 fold, or at a compound annual
increase of 6.98 percent.2 The property tax base reached its peak in 2008, and then declined each year
until 2014 due to the effects of the Great Recession. Prior to 2008, in no year did the property tax base
decline, but the base fell five times after 2008. Figure 1 illustrates this trend in the total state property
tax base, both in nominal and real (inflation adjusted) terms (1980 dollars), and Figure 2 shows the
annual growth rates for each.3 (The underlying data for the figures are contained in Appendix Tables A-1
and A-2.)
For the period 1980-2008, prior to the Great Recession, the actual (nominal) property tax base
increased 8.97 fold, or by an annual average compound growth rate of 8.15 percent. Over this period,
the annual growth rates ranged from a low of 0.33 percent (for 1992) to 14.11 percent (for 1987). The
growth rate for the 1980s was greater than for the rest of the study period. The annual average
compound growth rate was 10.29 percent during the 1980s, but 6.98 percent for the period 1990
through 2008. The Great Recession had a substantial impact on the property tax base. Between 2008
and 2013, it declined by a total of 17.4 percent, before increasing between 2013 and 2014 by 2.94
percent.
1 Sjoquist, David L. (2008). By the Numbers: Property Taxes in Georgia. FRC Report 180. Atlanta, GA: Fiscal Research Center, Andrew Young School of Policy Studies, Georgia State University. Available at: cslf.gsu.edu/files/2014/06/by_the_numbers_property_taxes_in_georgia.pdf.
2 Note that a two-fold increase means that the amount doubled, or increased by 100 percent.
3 “Nominal terms” means the actual reported value, whereas “real terms” means the inflation-adjusted value.

3
Georgia’s Property Taxes by the Numbers frc.gsu.edu
As Figure 2 shows, the variation in annual growth rates was much greater for the first 14 years of the
period (1980-1993) than the next 20 years (1994-2014). The period since 2008 has seen not only
decreases in the property tax base but also sizable differences in annual percentage changes.
The growth in the tax digest can be attributed to general inflation, economic growth that results in new
real and personal property, increases in property value in excess of inflation, and legislative changes to
the base.4 In addition, the growth of the tax digest in any particular year is dependent on whether tax
assessors have reassessed property. We can sort out some of these factors, in particular the effect of
inflation and economic growth.
Figure 1. Georgia Net Property Tax Base
4 Tax digest is the common term used for property tax base.
0
500
1,000
1,500
2,000
2,500
3,000
3,500
4,000
Base
(in
millio
ns)
Year
Net State Property Tax Base
Inflation Adjusted Net State Property Tax Base

4
Georgia’s Property Taxes by the Numbers frc.gsu.edu
Figure 2. Growth in Georgia Property Net Tax Base
The effect of inflation can be seen by comparing the nominal and real tax digests in Figure 1. Between
1980 and 2008, the real property tax base increased 2.75 fold, or at an annual average compound
growth rate of 3.68 percent. The growth rate of the real property tax base slowed over the period; the
annual average compound growth rate was 4.75 percent for the 1980s, 3.39 percent for the 1990s, and
2.70 percent for 2000 through 2008. Between 2008 and 2014, the real property tax base decreased by
24.1 percent. In 2014, the real property tax base was only 27.4 percent of the nominal tax base. Thus,
for the entire period, inflation accounted for 83.6 percent of the increase in the property tax base.
Population growth is one way of measuring economic growth. We are particularly interested in whether
the growth in the property tax digest kept up with population growth. To account for population
growth, we consider the tax digest per capita. Figure 3 presents the state net property tax base per
capita, both in nominal and real terms, while Figure 4 presents annual growth rates. The two graphs
look very similar to figures 1 and 2. For the entire period, the tax base per capita increased 4.14 fold.
Before the Great Recession, the nominal property tax base per capita rose from $7,170 in 1980 to
$36,944 in 2008, a 5.17 fold increase. The average annual compound growth rate was 6.05 percent, with
a somewhat larger growth rate for the 1980s. Between 2008 and 2013, the property tax base per capita
decreased by 21.4 percent, before increasing by 1.90 percent in 2014.
We can combine the effects of inflation and population growth by considering the real property tax base
per capita. Over the 1980-2014 period, the real property tax base per capita increased a total of 13.4
percent, from $7,140 to $8,095 (Figure 3). The real property tax base per capita peaked in 2006 at
$11,750, a 64.6 percent increase over the 1980 value. This increase in the real tax base per capita is due
-15.0%
-10.0%
-5.0%
0.0%
5.0%
10.0%
15.0%
20.0%
An
nu
al
Gro
wth
Rate
Year
Net State Property Tax BaseInflation Adjusted Net State Property Tax Base

5
Georgia’s Property Taxes by the Numbers frc.gsu.edu
to such factors as larger home sizes and a switch in industrial composition from labor-intensive to more
capital-intensive businesses, as well as growth in land and construction prices that exceeded inflation.
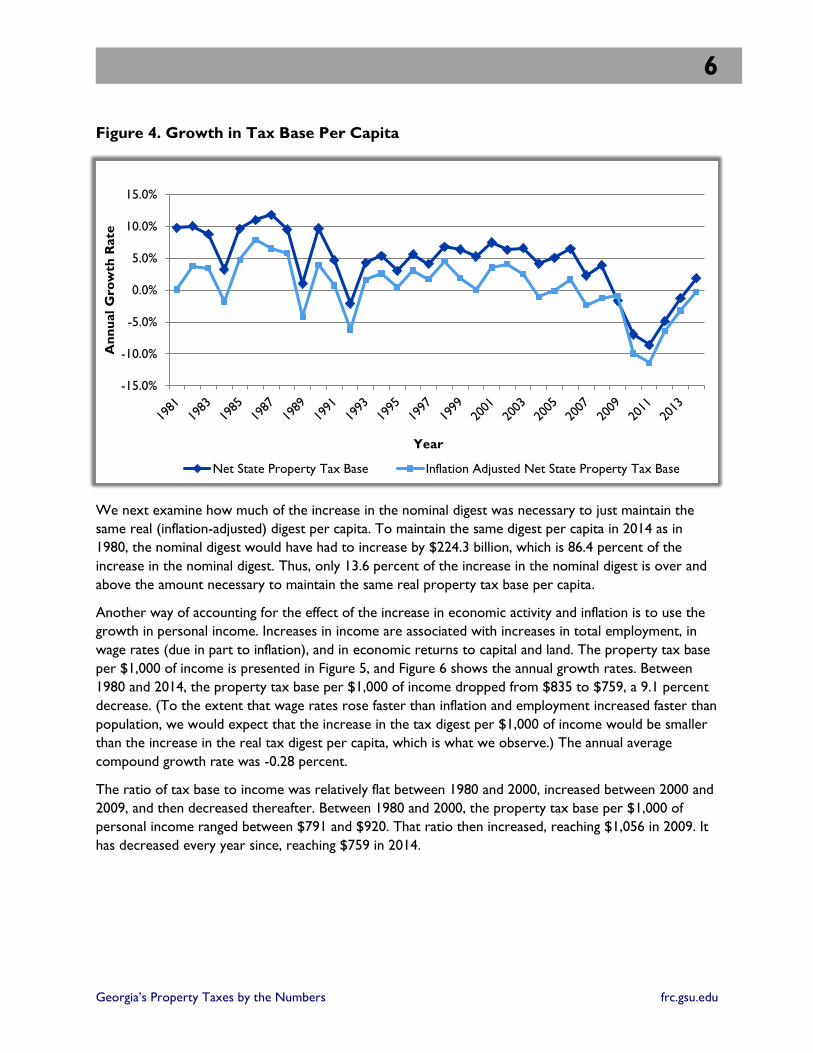
As seen in Figure 4, prior to the Great Recession the annual growth rate of the real tax digest per capita
ranged from a low of -6.19 percent (in 1992) to a high of 7.9 percent (in 1986). While the growth rates
fluctuated over the period 1981-92, they do trend downward. The growth rate of real per capita
property tax base was negative from 2006-14; over the period 2006-14, real per capita property tax
base fell by 31.1 percent.
Figure 3. Georgia Net State Property Tax Base Per Capita
0
5,000
10,000
15,000
20,000
25,000
30,000
35,000
40,000
Base
Per
Cap
ita
Year
Net State Property Tax Base Inflation Adjusted Net State Property Tax Base
6
Georgia’s Property Taxes by the Numbers frc.gsu.edu
Figure 4. Growth in Tax Base Per Capita
We next examine how much of the increase in the nominal digest was necessary to just maintain the
same real (inflation-adjusted) digest per capita. To maintain the same digest per capita in 2014 as in
1980, the nominal digest would have had to increase by $224.3 billion, which is 86.4 percent of the
increase in the nominal digest. Thus, only 13.6 percent of the increase in the nominal digest is over and
above the amount necessary to maintain the same real property tax base per capita.
Another way of accounting for the effect of the increase in economic activity and inflation is to use the
growth in personal income. Increases in income are associated with increases in total employment, in
wage rates (due in part to inflation), and in economic returns to capital and land. The property tax base
per $1,000 of income is presented in Figure 5, and Figure 6 shows the annual growth rates. Between
1980 and 2014, the property tax base per $1,000 of income dropped from $835 to $759, a 9.1 percent
decrease. (To the extent that wage rates rose faster than inflation and employment increased faster than
population, we would expect that the increase in the tax digest per $1,000 of income would be smaller
than the increase in the real tax digest per capita, which is what we observe.) The annual average
compound growth rate was -0.28 percent.
The ratio of tax base to income was relatively flat between 1980 and 2000, increased between 2000 and
2009, and then decreased thereafter. Between 1980 and 2000, the property tax base per $1,000 of
personal income ranged between $791 and $920. That ratio then increased, reaching $1,056 in 2009. It
has decreased every year since, reaching $759 in 2014.
-15.0%
-10.0%
-5.0%
0.0%
5.0%
10.0%
15.0%
An
nu
al
Gro
wth
Rate
Year
Net State Property Tax Base Inflation Adjusted Net State Property Tax Base

7
Georgia’s Property Taxes by the Numbers frc.gsu.edu
Figure 5. Georgia Property Tax Base Per $1000 of Income
Figure 6. Growth in Base Per $1000 of Income
0
200
400
600
800
1000
1200
Base
per
$1000 o
f In
co
me
Year
-15.0%
-10.0%
-5.0%
0.0%
5.0%
10.0%
An
nu
al
Gro
wth
Rate
Year

8
Georgia’s Property Taxes by the Numbers frc.gsu.edu
Property Tax Base by Components
This section examines the distribution of the gross property tax base by its components and how that
distribution has changed over the past eight years. We report the gross digest, i.e., the base before any
exemptions such as homestead exemptions or Freeport exemptions are subtracted, because it is not
possible to assign all exemptions to the appropriate property categories. In 2007, residential property
was the largest single component of the gross property tax base (Table 1), accounting for 54.8 percent
of the base. Residential property includes all land that is utilized, or best suited to be utilized, as a single-
family home site, plus any house or structure and other improvements on the land. It includes both
owner-occupied and rental housing as well as duplexes and triplexes. Homes that are located on farms
are included in the agricultural category. The second largest category of property is commercial
property, which was 22.2 percent of the gross digest in 2007. Commercial property includes all real and
personal property for businesses at both the wholesale and retail levels as well as multifamily dwellings
with four or more units. The other categories in Table 1 each account for less than 10 percent of the
property tax base. Miscellaneous includes all of the categories that comprise less than 1 percent of the
gross tax digest.
Between 2007 and 2014, the total nominal gross digest decreased by 3.9 percent, with the residential,
agricultural and motor vehicle components declining and the conservation, commercial, utility and
miscellaneous components increasing. These latter components had an increase in their share of the
gross digest. The last column of Table 1 shows that the declining digests were large enough to generate
a declining total gross digest between 2007 and 2014. The sharpest decline was to the agricultural digest
at 3.9 percent per year, and the residential digest declined by over $21 billion in value. Residential
property decreased from 54.8 percent to 51.0 percent of the gross property tax base.
Table 1. Gross State Property Tax Base by Components Digest
2007 2014 COMPONENT
ANNUAL GROWTH
RATE COMPONENT VALUE SHARE VALUE SHARE
Residential $204,755,657,354 54.8% $182,956,476,839 51.0% -1.60%
Agricultural $13,275,004,777 3.6% $10,059,511,354 2.8% -3.88%
Conservation Use $11,403,223,872 3.1% $12,741,078,218 3.6% 1.60%
Commercial $82,962,501,498 22.2% $89,077,170,523 24.8% 1.02%
Industrial $23,542,028,082 6.3% $24,979,732,005 7.0% 0.85%
Utility $11,962,960,904 3.2% $14,438,855,807 4.0% 2.72%
Motor Vehicle $22,529,507,106 6.0% $20,626,442,765 5.7% -1.25%
Miscellaneous $2,913,045,560 0.8% $3,888,060,126 1.1% 4.21%
Total Gross Digest $373,343,929,153 $358,767,327,637 -0.57%

9
Georgia’s Property Taxes by the Numbers frc.gsu.edu
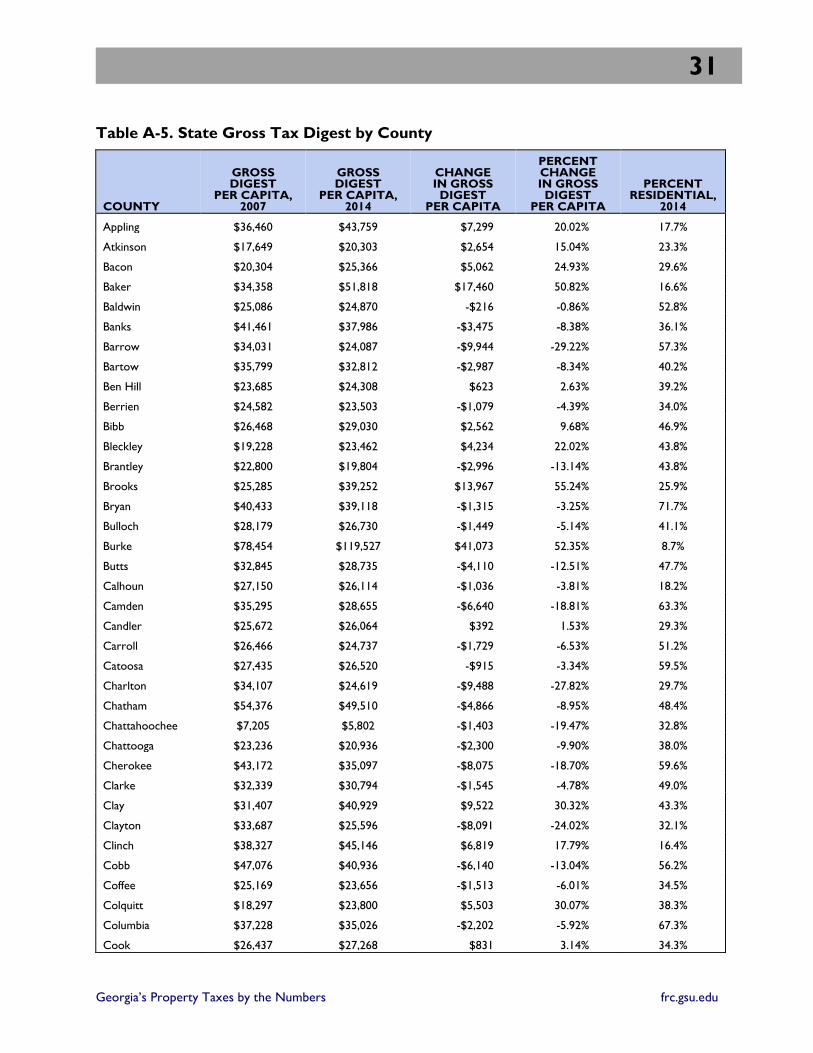
Appendix Table A-5 shows the state gross tax digest by county for 2007 and 2014. The percentage of
the gross digest that is residential varies substantially by county (see last column). In 2014, only 8.7
percent of Burke County’s gross digest was residential, whereas 79.5 percent was utility. At the other
extreme is Towns County, for which 79.2 percent of the 2014 gross digest was residential. In general,
the percentage residential is greater in urban counties. For example, of the 10 counties in the Atlanta
Regional Commission planning district, eight have a percentage residential exceeding 50 percent (Fulton
and Clayton are the two exceptions.).5
Only the gross state digest has been discussed so far during this section, but the actual property tax
base equals the gross digest less exemptions. Total exemptions from the state digest were $40.6 billion
for 2007 and $60 billion for 2014, an increase of 47.7 percent. As a share of the gross digest,
exemptions increased from 10.9 percent in 2007 to 16.7 percent in 2014. This increase is due, at least in
part, to the rise in the number of homestead exemptions taken and to the increase in the types of state
homestead exemptions that are allowed.
Property Tax Base by County
We now turn to a discussion of how the state gross property tax base and the state gross property tax
base per capita vary across the state. Appendix Table A-5 presents the data by county. Maps 1 and 2
show the geographic distribution of the state gross tax digest per capita for 2007 and 2014, respectively,
and Map 3 presents the distribution of the percentage change. Higher gross digest values were located in
the northern parts of the state in 2007 but were less concentrated in particular parts of the state in
2014. Per capita property tax digests declined in most areas of the state between 2007 and 2014,
particularly in the metro-Atlanta suburban counties. Growing per capita property tax bases occurred in
the southern and more rural areas of the state.
Across the state, counties varied substantially in their gross digest per capita and percentage change
over the period 2007 to 2014. In 2007, Greene County had the highest gross digest per capita at
$110,693. Rabun County and Towns County were second and third at $99,772 and $88,947,
respectively. In 2007, Chattahoochee County had the lowest gross digest per capita value. In 2007, the
ratio of the highest to the lowest gross tax digest per capita was 15.4 to 1. In 2014, Burke County had
the highest gross digest per capita at $119,527. Rabun and Greene were second and third at $100,439
and $93,804, respectively. In 2014, Chattahoochee still had the lowest per capita gross digest and Long
County had the second lowest. In 2014, the ratio of the highest to the lowest gross digest per capita
was 20.6 to 1.
Over the period 2007 to 2014, four counties had an increase in their gross digest per capita of more
than 50 percent: Twiggs County at 82.4 percent, Madison County at 76.2 percent, Brooks County at
55.2 percent and Burke County at 52.4 percent. For Wayne County, data for 2014 are not available.
Between 2007 and 2013, that county saw a 54.3 percent increase in its gross digest per capita. Eighty-
seven counties experienced a decrease in gross value per capita from 2007 to 2014 due to the collapse
in housing values related to the Great Recession, and 13 of these saw a decline of more than 25 percent.
5 The ten Atlanta Regional Commission planning district are: Cherokee, Clayton, Cobb, DeKalb, Douglas, Fayette, Fulton, Gwinnett, Henry and Rockdale counties.

10
Georgia’s Property Taxes by the Numbers frc.gsu.edu
Map 1. State Gross Tax Digest per Capita, 2007

11
Georgia’s Property Taxes by the Numbers frc.gsu.edu
Map 2. State Gross Tax Digest per Capita, 2014

12
Georgia’s Property Taxes by the Numbers frc.gsu.edu
Map 3. Percentage Change in State Gross Tax Digest per Capita, 2007-2014

13
Georgia’s Property Taxes by the Numbers frc.gsu.edu
Property Tax Revenue
We next look at trends in the level of property tax revenue. According to data from the U.S. Census
Bureau, in 2012-13, property taxes in Georgia were 20.4 percent of state and local own source
revenue.6 This figure is essentially unchanged from 1991-92 and 2006-07. Property taxes accounted for
30.4 percent of total state plus local taxes in 2012-13, slightly more than in 2005-06, but essentially the
same as in 1991-92. Thus, over these 22 years, property taxes did not increase more rapidly than other
sources of revenue or other taxes.
Before considering how property taxes in Georgia have changed, we look at how Georgia ranks relative
to other states. Table 2 presents property tax per capita and per $100 of income (this can be
interpreted as property tax as a percentage of income) for all states, along with each state’s 2013
ranking. The table also includes the state ranking for total (state plus local) taxes per capita and per
$100 of income. The states are ordered by their ranking of property tax per capita. Georgia ranks 33rd
both in terms of property taxes per capita and per $100 of income. (Georgia ranks 47th in total taxes
per capita and 42nd in total taxes per $100 of income.) In general, states have similar rankings on the
two measures, but a state with high income per capita and highly ranked property taxes per capita will
rank lower on property taxes per $100 of income. Georgia’s property tax ranking has increased over
time. In 1981, Georgia ranked 40th in terms of property taxes per capita and 38th in terms of property
taxes per $100 of income.
Table 2. State Rankings, 2013
PROPERTY TAX
PER CAPITA PROPERTY TAX
PER $100 OF INCOME TOTAL STATE AND
LOCAL TAXES RANK
STATE DOLLARS RANK DOLLARS RANK PER
CAPITA PER $100
OF INCOME
District of Columbia 3,034 1 4.42 7 1 4
New Jersey 2,988 2 5.41 1 6 11
Connecticut 2,725 3 4.39 8 5 9
New Hampshire 2,691 4 5.32 2 2 48
New York 2,493 5 4.65 6 4 3
Vermont 2,332 6 5.20 3 1 7
Rhode Island 2,281 7 4.94 4 1 14
Wyoming 2,172 8 4.19 1 7 13
Massachusetts 2,069 9 3.66 1 8 23
Illinois 1,981 10 4.26 1 1 10
Alaska 1,914 11 3.73 12 2 1
Maine 1,907 12 4.82 5 16 6
Wisconsin 1,843 13 4.31 9 17 0
Nebraska 1,649 14 3.56 15 18 24
Texas 1,560 15 3.56 16 31 43
6 Own source revenues are revenues raised by government. They include taxes, fees and charges, but exclude intergovernmental grants.

14
Georgia’s Property Taxes by the Numbers frc.gsu.edu
PROPERTY TAX
PER CAPITA PROPERTY TAX
PER $100 OF INCOME TOTAL STATE AND
LOCAL TAXES RANK
Minnesota 1,547 16 3.26 19 10 8
STATE DOLLARS RANK DOLLARS RANK PER
CAPITA PER $100
OF INCOME
Iowa 1,515 17 3.46 17 21 22
Maryland 1,503 18 2.86 27 11 19
United States 1,439 3.24
Virginia 1,430 19 2.92 26 26 44
Kansas 1,425 20 3.22 21 22 25
Montana 1,406 21 3.62 14 32 31
Pennsylvania 1,376 22 2.99 23 19 26
California 1,365 23 2.84 30 14 16
Washington 1,350 24 2.84 29 23 36
Colorado 1,333 25 2.85 28 24 39
Michigan 1,320 26 3.37 18 35 34
Oregon 1,285 27 3.26 20 28 28
South Dakota 1,230 28 2.75 31 40 51
Florida 1,215 29 2.94 25 46 49
Ohio 1,215 30 2.98 24 25 17
North Dakota 1,140 31 2.10 44 3 2
South Carolina 1,077 32 3.04 22 48 40
Georgia 1,011 33 2.69 33 47 42
Arizona 1,008 34 2.75 32 45 37
Missouri 976 35 2.42 39 43 45
Nevada 972 36 2.48 38 30 30
Indiana 968 37 2.53 36 34 29
Utah 952 38 2.61 35 39 33
Hawaii 943 39 2.13 43 9 5
North Carolina 903 40 2.39 40 38 35
Mississippi 899 41 2.67 34 44 21
Idaho 887 42 2.49 37 49 41
Louisiana 849 43 2.08 45 33 38
Tennessee 838 44 2.13 42 50 50
Delaware 825 45 1.84 48 20 20
West Virginia 798 46 2.27 41 29 15
Kentucky 731 47 2.03 46 41 32
New Mexico 685 48 1.94 47 36 18
Arkansas 659 49 1.80 49 37 27
Oklahoma 595 50 1.42 51 42 47
Source: Authors’ calculations

15
Georgia’s Property Taxes by the Numbers frc.gsu.edu
Between 1980 and 2013, total property taxes in Georgia, as reported by the U.S. Census Bureau,
increased from $1.087 billion to $10.100 billion, or by 9.3 fold, which is substantially greater than the
increase in the property tax base. Property tax revenue for 1981 was 3.1 percent of the state net
property tax base for 1980. Property tax revenue for 2006 was also 3.1 percent of the state net
property tax base for 2005.7 However, property tax revenue for 2013 was 3.5 percent of the state net
property tax base for 2012. These changes suggest that relative to the property tax base, property taxes
in Georgia have increased over the 34-year period, particularly over the most recent seven years. Recall
that the property tax base decreased over this seven-year period. We have not adjusted for changes in
the tax base due to legislative policies such as new exemptions, or to changes in the aggressiveness of
the assessment process. And, of course, we are using the state property tax base, whereas local
governments use their own tax bases, which differ from the state tax base. This issue is discussed
further in the last section.
Figure 7 presents the annual property tax revenue per capita for both Georgia and the United States.
Property taxes per capita in Georgia increased from $198 in 1980 to $1,011 in 2013, a 5.11 fold
increase. Figure 8 presents the annual growth rates. The trend for property tax per capita was similar
for Georgia and the United States until 2009, when the numbers fell in Georgia but remained flat for the
United States. However, for most of the 1980 to 2013 period, property taxes per capita grew faster in
Georgia than in the United States. Over the period 1980 to 2009, the annual average compound growth
rate of property taxes per capita was 6.6 percent for Georgia and 3.4 percent for the United States.
However, the greater growth for Georgia relative to the United States for the entire period was due to
the much more rapid growth in Georgia during the 1980s, when the annual average compound growth
rate was 9.5 percent for Georgia and 7.5 percent for the United States. During the 1990s, Georgia’s
property taxes per capita increased at a rate of 3.9 percent per year compared to 3.5 percent for the
United States, but between 2000 and 2009, the growth rates were 4.8 percent and 5.4 percent for
Georgia and the United States, respectively. Between 2009 and 2013, property taxes per capita fell
8.0 percent in Georgia and increased by 1.5 percent in the United States. This pattern can be seen in
Figure 8.
Figure 9 shows the ratio of property taxes per capita in Georgia to property taxes per capita for the
United States. In 1980, Georgia’s property taxes were 65.7 percent of those for the United States. That
ratio increased to 82.2 percent in 1994 and remained roughly the same since until 2006. However, by
2013, the ratio had fallen to 70.2 percent.
7 Property taxes are based on fiscal years, but tax base data are for the calendar year. Years are selected to try to match property tax collections to the appropriate property tax base. If we use the same years for both tax base and tax revenue, the effective tax rates are lower but have the same values.

16
Georgia’s Property Taxes by the Numbers frc.gsu.edu
Figure 7. Property Taxes Per Capita
$0
$200
$400
$600
$800
$1,000
$1,200
$1,400
$1,600
Year
Georgia United States

17
Georgia’s Property Taxes by the Numbers frc.gsu.edu
Figure 8. Growth in Property Taxes Per Capita
-6.0%
-4.0%
-2.0%
0.0%
2.0%
4.0%
6.0%
8.0%
10.0%
12.0%
14.0%
16.0%
Year
Georgia United States

18
Georgia’s Property Taxes by the Numbers frc.gsu.edu
Figure 9. Property Taxes Per Capita: Georgia as a Percentage of United States
0.0%
10.0%
20.0%
30.0%
40.0%
50.0%
60.0%
70.0%
80.0%
90.0%
Year

19
Georgia’s Property Taxes by the Numbers frc.gsu.edu
Figure 10. Georgia Property Taxes Per Capita
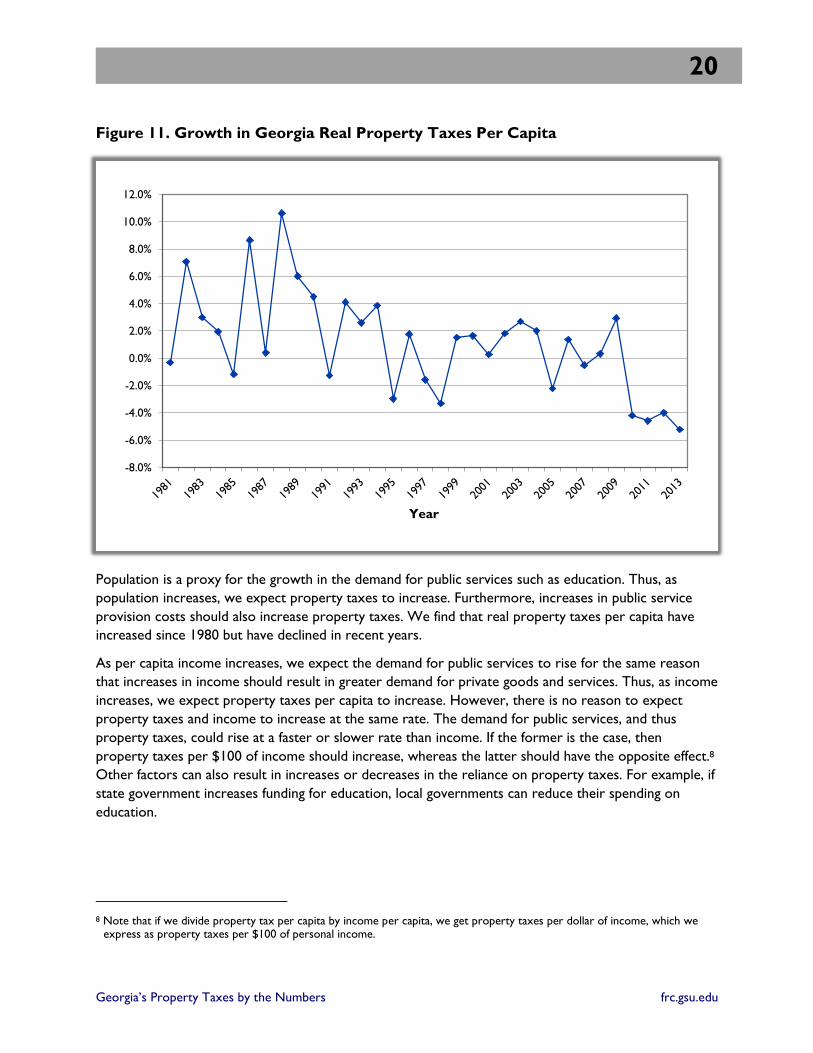
Figure 10 shows the trend in nominal and real property taxes per capita for Georgia, and Figure 11
presents the annual growth rates. Adjusted for inflation, property taxes per capita in Georgia increased
at an annual average compound growth rate of 1.1 percent over the period 1980 to 2013. During the
1980s, real property taxes per capita increased at an annual rate of 4.0 percent. The rate of increase fell
to 0.6 percent during the 1990s and to -0.8 percent after 2000. This pattern is evident in Figure 11.
$0
$200
$400
$600
$800
$1,000
$1,200
Year
Nominal Inflation Adjusted
20
Georgia’s Property Taxes by the Numbers frc.gsu.edu
Figure 11. Growth in Georgia Real Property Taxes Per Capita
Population is a proxy for the growth in the demand for public services such as education. Thus, as
population increases, we expect property taxes to increase. Furthermore, increases in public service
provision costs should also increase property taxes. We find that real property taxes per capita have
increased since 1980 but have declined in recent years.
As per capita income increases, we expect the demand for public services to rise for the same reason
that increases in income should result in greater demand for private goods and services. Thus, as income
increases, we expect property taxes per capita to increase. However, there is no reason to expect
property taxes and income to increase at the same rate. The demand for public services, and thus
property taxes, could rise at a faster or slower rate than income. If the former is the case, then
property taxes per $100 of income should increase, whereas the latter should have the opposite effect.8
Other factors can also result in increases or decreases in the reliance on property taxes. For example, if
state government increases funding for education, local governments can reduce their spending on
education.
8 Note that if we divide property tax per capita by income per capita, we get property taxes per dollar of income, which we express as property taxes per $100 of personal income.
-8.0%
-6.0%
-4.0%
-2.0%
0.0%
2.0%
4.0%
6.0%
8.0%
10.0%
12.0%
Year
21
Georgia’s Property Taxes by the Numbers frc.gsu.edu
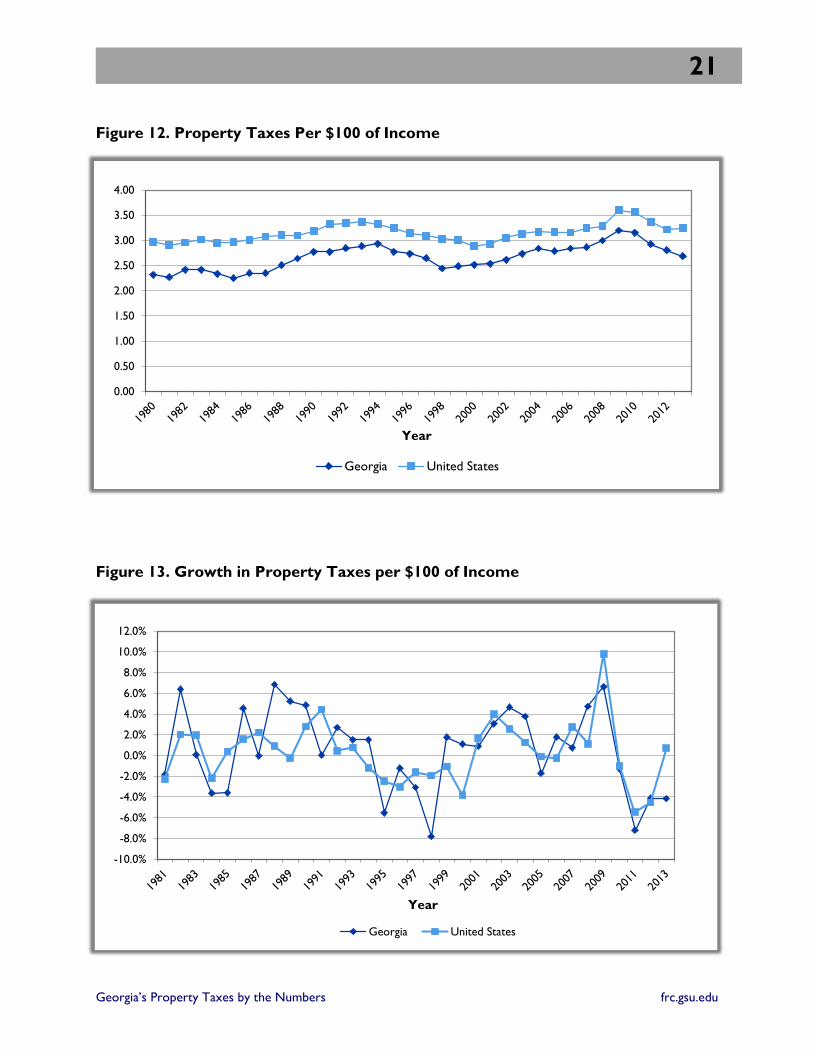
Figure 12. Property Taxes Per $100 of Income
Figure 13. Growth in Property Taxes per $100 of Income
0.00
0.50
1.00
1.50
2.00
2.50
3.00
3.50
4.00
Year
Georgia United States
-10.0%
-8.0%
-6.0%
-4.0%
-2.0%
0.0%
2.0%
4.0%
6.0%
8.0%
10.0%
12.0%
Year
Georgia United States

22
Georgia’s Property Taxes by the Numbers frc.gsu.edu
Figure 12 shows the trends in property taxes per $100 for Georgia and the United States, and Figure 13
provides the growth rates. The patterns are similar for Georgia and the country as a whole, as are the
fluctuations in annual growth rates. For the entire 1980-2013 period, the annual average compound
growth rate was 0.5 percent for Georgia and 0.3 percent for the United States. For Georgia, the annual
growth rate in property taxes per $100 of income from 2000 was 0.5 percent, compared to 0.9 percent
for the United States. We know from figures 7 and 8 that since 2000 property taxes per capita have
increased more rapidly for the United States than for Georgia, yet property taxes per $100 of income
increased faster in Georgia over the post-2000 period. This difference stems in part from income per
capita in Georgia increasing at a slower rate than for the United States.
Figure 14. Property Taxes Per $100 of Income: Georgia as a Percentage of United States
Figure 14 shows the ratio of property taxes per $100 of income in Georgia to the same for the United
States. In 1980, property taxes per $100 of income in Georgia were 78.0 percent of the U.S. average.
That ratio has fluctuated since 1980 but exhibited a general upward trend through the 2000s. By 2008,
the ratio had risen to 91.4 percent but then decreased to 83.0 percent by 2013.
0.0%
10.0%
20.0%
30.0%
40.0%
50.0%
60.0%
70.0%
80.0%
90.0%
100.0%
Year

23
Georgia’s Property Taxes by the Numbers frc.gsu.edu
Property Tax Levies by Type of Government
This section examines the level and share of property taxes levied by different types of government in
Georgia. Note that property tax levied is not the same as property taxes collected, because not all
property taxes are collected (i.e., paid). However, the levy provides a good approximation of tax
collections. To determine the levy, we took the property tax consolidation sheets for each jurisdiction
that levies a property tax and multiplied the jurisdiction’s reported net tax digest by its reported
property tax rate. We then summed across all jurisdictions that fall within each of five governmental
categories: state, school systems, counties, municipalities and special districts.
A major drawback of these data is that local exemptions are not always included in the consolidation
sheet. Thus, the reported net tax digest for local jurisdictions will be overstated. Consequently, the
levies reported below overstate by an unknown amount the actual levies. Note also that these levies are
only for general operations and do not include property tax levies to pay general obligation bonded
debt.
Table 3 shows the distribution of property tax levy by type of government for 2007 and 2014 as well as
the percentage change in the levy. The three consolidated city-counties are included under counties.
The state government’s millage rate declined from 0.25 mill to 0.1 mill between 2007 and 2014 and
generates a small amount of revenue, accounting for about 0.3 percent of the total property tax levy in
2014. School systems account for over half of the property tax levy, 55.2 percent in 2014, which is a
slight decrease from 2007. Property taxes increased by the largest percentage for special districts, which
include fire districts, community improvement districts (CID), special service districts and others.
Overall, the property tax levy increased by 1.2 percent. This method of calculating property taxes per
capita by type of government using property tax consolidation sheets is problematic for two reasons: we
do not know the population served by special districts, and municipal population data are not current.
Therefore, we employ two additional methods to more accurately assess the level and share of property
tax levied by different types of government in Georgia.
Table 3. Property Tax Levies by Type of Government
TYPE OF GOVERNMENT
SHARE PERCENT CHANGE 2007 2014
State 0.8% 0.3% -64.0%
School Systems 57.8 55.2 -3.2
Counties 26.9 28.7 8.0
Municipalities 7.5 7.9 7.0
Special Districts 7.1 7.9 12.9

24
Georgia’s Property Taxes by the Numbers frc.gsu.edu
As a second way of calculating recent property taxes per capita or per student by type of government,
we follow the method used in a 2007 report jointly prepared by the Fiscal Research Center, the Georgia
Budget and Policy Institute, and the Georgia Public Policy Foundation.9 We updated the data and
calculated growth in property taxes per capita or per student by type of government.
Table 4. Georgia's Government Property Tax Growth: 2007-14
PER CAPITA OR PER FTE
NOMINAL INFLATION ADJUSTED
School Systems -6.6% -20.6%
Counties 11.1% -5.6%
Municipalities 20.8% 2.6%
Consolidated Governments -4.7% -19.0%
State -58.4% -64.7%
Note: For schools, local revenue was used, which includes some non-property tax revenue.
Table 4 presents the growth of nominal and inflation-adjusted property taxes on a per capita or per full-
time equivalent (FTE) student basis for 2007 to 2014 and re-creates the calculation from the 2007
report. These calculations are based on property tax receipts as reported by local governments, not the
consolidation sheets. State government property taxes per capita decreased by the largest percentage
due to the declining millage rate and declining property values, followed by school property taxes per
student. Consolidated governments saw a 19 percent drop in property taxes per capita compared to a
5.6 percent decline for county governments. Municipalities were the only level of government in Georgia
that experienced growing real per capita property tax revenue.
Our third method of determining the change in property tax rates uses the 2014 property tax digest to
calculate what the property tax levy would be using 2007 property tax rates. We compare that levy to
the actual 2014 levy. If property tax rates had not changed, the two levies would be the same, but if tax
rates increased, the actual 2014 levy would be higher. Table 5 shows the results, which indicate that
property tax rates, on average, increased by 12.3 percent between 2007 and 2014. Assuming an average
property tax rate of 30 mills, the increase of 12.3 percent implies an increase in the average property
tax rate of 3.7 mills. The average property tax rate for all levies, other than the state digest levy,
increased. Because the property tax rate for the state was 0.25 mills in 2007 and 0.1 in 2014, using the
2007 millage rate on the 2014 digest would produce a large increase in the property tax levy. The
results of the three approaches suggest that property tax rates increased in response to declining
property values during the Great Recession, resulting in declining property tax revenues.
9 Growth in Expenditures and Property Taxes by Level or Type of Government, prepared jointly by the Fiscal Research Center, the Georgia Budget and Policy Institute, and the Georgia Public Policy Foundation, November 14, 2007. The report is available at frc.gsu.edu/files/2016/02/Growth-in-Expenditures-and-Property-Taxes-November-2007.pdf.

25
Georgia’s Property Taxes by the Numbers frc.gsu.edu
Table 5. Property Tax Levies Using 2014 and 2007 Property Tax Rates
LEVY USING 2014 DIGEST (IN MILLIONS)
TYPE OF GOVERNMENT
2007 TAX RATES
2014 TAX RATES
DIFFERENCE
PERCENT CHANGE
State $74.7 $29.9 $-$44.8 -60.0%
School Systems 5,347.1 5,662.0 $314.9 5.9%
Counties 2,566.6 2,939.9 $373.3 14.5%
Cities 700.7 807.4 $106.8 15.2%
Special Districts 512.5 810.1 $297.5 58.0%
Total 9,201.7 10,249.4 $1,122.4 12.3%
Appendix: Data Sources
Personal Income Bureau of Economic Analysis website
Inflation Bureau of Economic Analysis, National Income and Product Accounts, Table
3.10.4, line 47.
State Net Property Tax Base Historic values (1980-2013) obtained from Georgia Department of Revenue
Annual Reports. 2014 value calculated from consolidation sheets (2014 data
were not available for Wayne County, so 2013 values were used). Tax base
by county and by component were calculated using electronic versions of
property tax consolidation sheets obtained from Georgia Department of
Revenue. Year refers to assessment year.
Population U.S. Census Bureaus; population as of July 1.
Property Tax Revenue U.S. Census Bureau, State and Local Government Finances. Year is the fiscal
year.
Property Tax Levy Calculated using electronic versions of property tax consolidation sheets
and reported millage rates obtained from the Georgia Department of
Revenue. Year is the assessment year; revenue would be collected in fall of
that year.

26
Georgia’s Property Taxes by the Numbers frc.gsu.edu
Appendix Table A-1. Property Tax Base
YEAR
PROPERTY TAX BASE
(1000s)
REAL PROPERTY TAX BASE (1000s)(1)
PROPERTY TAX BASE PER $1000
OF INCOME
PROPERTY TAX BASE
PER CAPITA
REAL PROPERTY TAX BASE
PER CAPITA(1)
1990 104,270,086 227,134,776 $902 16,011 34,876
1991 111,543,823 233,699,015 $921 16,766 35,127
1992 111,906,678 224,638,765 $852 16,415 32,952
1993 119,497,207 233,632,187 $857 17,124 33,480
1994 129,156,870 245,866,778 $859 18,046 34,353
1995 136,273,000 252,789,006 $840 18,595 34,494
1996 147,340,350 266,766,273 $841 19,643 35,564
1997 157,172,367 278,031,289 $842 20,452 36,178
1998 171,752,626 297,380,088 $839 21,842 37,818
1999 186,945,231 310,026,244 $857 23,235 38,532
2000 201,251,229 317,155,903 $853 24,461 38,549
2001 220,229,785 334,430,372 $888 26,290 39,922
2002 237,870,637 353,617,274 $936 27,958 41,562
2003 256,965,131 367,407,018 $978 29,801 42,609
2004 272,207,115 369,755,628 $985 31,041 42,165
2005 291,219,580 375,998,860 $989 32,626 42,124
2006 318,095,398 392,144,565 $1,009 34,742 42,830
2007 332,700,314 391,523,331 $999 35,583 41,874
2008 351,285,061 392,775,532 $1,030 36,959 41,324
2009 349,904,822 394,244,761 $1,057 36,369 40,978
2010 328,357,808 358,127,611 $980 33,801 36,865
2011 303,392,884 320,671,317 $845 30,917 32,678
2012 291,902,775 303,468,134 $790 29,429 30,595
2013 290,504,147 296,002,706 $773 29,066 29,616
2014 298,747,752 298,747,752 $759 29,587 29,587
(1) Constant 2014 Dollars
27
Georgia’s Property Taxes by the Numbers frc.gsu.edu
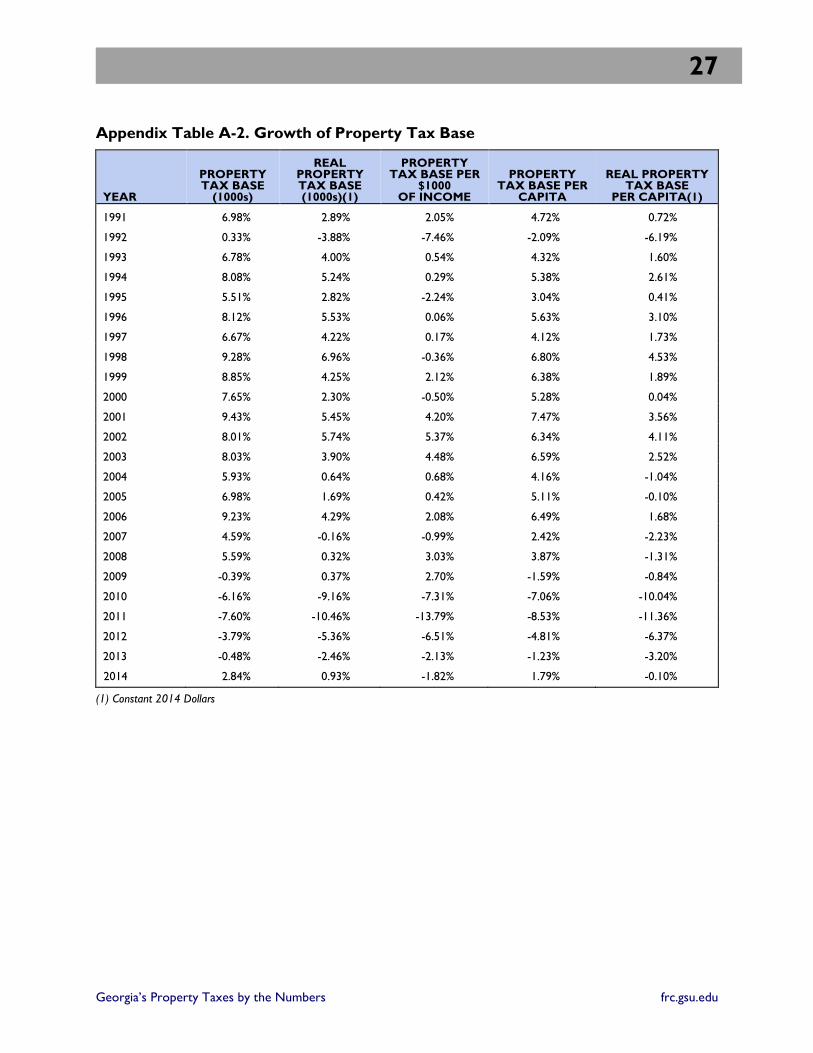
Appendix Table A-2. Growth of Property Tax Base
YEAR
PROPERTY TAX BASE
(1000s)
REAL PROPERTY TAX BASE (1000s)(1)
PROPERTY TAX BASE PER
$1000 OF INCOME
PROPERTY TAX BASE PER
CAPITA
REAL PROPERTY TAX BASE
PER CAPITA(1)
1991 6.98% 2.89% 2.05% 4.72% 0.72%
1992 0.33% -3.88% -7.46% -2.09% -6.19%
1993 6.78% 4.00% 0.54% 4.32% 1.60%
1994 8.08% 5.24% 0.29% 5.38% 2.61%
1995 5.51% 2.82% -2.24% 3.04% 0.41%
1996 8.12% 5.53% 0.06% 5.63% 3.10%
1997 6.67% 4.22% 0.17% 4.12% 1.73%
1998 9.28% 6.96% -0.36% 6.80% 4.53%
1999 8.85% 4.25% 2.12% 6.38% 1.89%
2000 7.65% 2.30% -0.50% 5.28% 0.04%
2001 9.43% 5.45% 4.20% 7.47% 3.56%
2002 8.01% 5.74% 5.37% 6.34% 4.11%
2003 8.03% 3.90% 4.48% 6.59% 2.52%
2004 5.93% 0.64% 0.68% 4.16% -1.04%
2005 6.98% 1.69% 0.42% 5.11% -0.10%
2006 9.23% 4.29% 2.08% 6.49% 1.68%
2007 4.59% -0.16% -0.99% 2.42% -2.23%
2008 5.59% 0.32% 3.03% 3.87% -1.31%
2009 -0.39% 0.37% 2.70% -1.59% -0.84%
2010 -6.16% -9.16% -7.31% -7.06% -10.04%
2011 -7.60% -10.46% -13.79% -8.53% -11.36%
2012 -3.79% -5.36% -6.51% -4.81% -6.37%
2013 -0.48% -2.46% -2.13% -1.23% -3.20%
2014 2.84% 0.93% -1.82% 1.79% -0.10%
(1) Constant 2014 Dollars

28
Georgia’s Property Taxes by the Numbers frc.gsu.edu
Appendix Table A-3. Property Tax Revenue
PROPERTY TAX PER CAPITA REAL PROPERTY TAX
PER CAPITA PROPERTY TAX
PER $100 OF INCOME
YEAR GEORGIA U.S. GA AS
% OF U.S. GEORGIA U.S. GA AS
% OF U.S. GEORGIA U.S. GA AS
% OF U.S.
1980 198 301 65.7% 198 301 65.7% 2.32 2.97 78.0%
1981 217 327 66.3% 198 298 66.3% 2.27 2.90 78.3%
1982 246 354 69.6% 211 304 69.6% 2.42 2.96 81.7%
1983 266 382 69.8% 218 312 69.8% 2.42 3.02 80.2%
1984 286 409 69.8% 222 318 69.8% 2.33 2.95 79.0%
1985 295 436 67.7% 219 324 67.7% 2.25 2.96 75.8%
1986 330 465 71.0% 238 336 71.0% 2.35 3.01 78.1%
1987 348 500 69.6% 239 344 69.6% 2.35 3.08 76.3%
1988 398 541 73.7% 265 360 73.7% 2.51 3.10 80.8%
1989 445 577 77.1% 281 364 77.1% 2.64 3.10 85.3%
1990 491 623 78.8% 293 373 78.8% 2.77 3.18 87.0%
1991 504 664 75.9% 290 382 75.9% 2.77 3.32 83.3%
1992 548 703 77.9% 302 387 77.9% 2.84 3.34 85.2%
1993 577 730 79.0% 309 392 79.0% 2.89 3.36 85.8%
1994 615 749 82.1% 321 391 82.1% 2.93 3.32 88.2%
1995 613 764 80.2% 312 389 80.2% 2.77 3.24 85.4%
1996 639 777 82.2% 317 386 82.2% 2.73 3.14 87.0%
1997 644 803 80.2% 312 390 80.2% 2.65 3.09 85.7%
1998 636 834 76.2% 302 396 76.2% 2.44 3.03 80.5%
1999 674 859 78.5% 307 391 78.5% 2.49 3.00 82.8%
2000 721 883 81.6% 312 382 81.6% 2.51 2.89 87.1%
2001 750 925 81.1% 313 385 81.1% 2.54 2.93 86.4%
2002 780 970 80.4% 318 396 80.4% 2.61 3.05 85.7%
2003 833 1,023 81.5% 327 401 81.5% 2.73 3.13 87.4%
2004 895 1,087 82.3% 333 405 82.3% 2.84 3.17 89.6%
2005 920 1,136 81.0% 326 402 81.0% 2.79 3.16 88.2%
2006 977 1,204 81.2% 330 407 81.2% 2.84 3.16 90.0%
2007 1,018 1,291 78.9% 329 417 78.9% 2.86 3.24 88.2%
2008 1,075 1,347 79.8% 330 413 79.8% 3.00 3.28 91.4%
2009 1,099 1,417 77.5% 340 438 77.5% 3.19 3.60 88.7%
2010 1,087 1,435 75.8% 325 429 75.8% 3.15 3.56 88.5%
2011 1,070 1,430 74.9% 310 415 74.9% 2.93 3.37 86.9%
2012 1,045 1,423 73.4% 298 406 73.4% 2.80 3.22 87.2%
2013 1,011 1,439 70.2% 282 402 70.2% 2.69 3.24 83.0%

29
Georgia’s Property Taxes by the Numbers frc.gsu.edu
Appendix Table A-4. Growth in Property Tax Revenue
GEORGIA UNITED STATES
YEAR PROPERTY
TAX REVENUE
PROPERTY TAX
PER CAPITA
REAL PROPERTY TAX PER CAPITA
PROPERTY TAX PER $100 OF INCOME
PROPERTY TAX REVENUE
PROPERTY TAX
PER CAPITA
PROPERTY TAX PER $100 OF INCOME
1981 11.0% 9.4% -0.3% -1.9% 9.4% 8.4% -2.3%
1982 15.2% 13.5% 7.1% 6.4% 9.3% 8.2% 2.0%
1983 9.8% 8.3% 3.0% 0.1% 9.0% 8.0% 1.9%
1984 9.2% 7.2% 1.9% -3.6% 8.1% 7.1% -2.2%
1985 5.7% 3.4% -1.2% -3.6% 7.6% 6.6% 0.4%
1986 14.1% 11.8% 8.7% 4.6% 7.7% 6.7% 1.6%
1987 7.6% 5.4% 0.4% -0.1% 8.5% 7.5% 2.2%
1988 16.5% 14.5% 10.6% 6.8% 9.1% 8.1% 0.9%
1989 13.4% 11.8% 6.0% 5.2% 7.8% 6.8% -0.3%
1990 12.0% 10.3% 4.5% 4.9% 9.2% 8.0% 2.8%
1991 4.9% 2.7% -1.3% 0.0% 8.0% 6.5% 4.4%
1992 11.3% 8.7% 4.1% 2.7% 7.3% 5.9% 0.5%
1993 7.8% 5.3% 2.6% 1.5% 5.2% 3.8% 0.8%
1994 9.4% 6.7% 3.9% 1.5% 3.9% 2.6% -1.2%
1995 1.9% -0.4% -3.0% -5.5% 3.2% 2.0% -2.5%
1996 6.7% 4.3% 1.8% -1.2% 2.9% 1.8% -3.0%
1997 3.2% 0.7% -1.6% -3.1% 4.5% 3.2% -1.6%
1998 1.1% -1.2% -3.3% -7.8% 5.2% 4.0% -1.9%
1999 8.4% 6.0% 1.5% 1.7% 4.1% 2.9% -1.1%
2000 9.4% 7.0% 1.7% 1.1% 4.0% 2.8% -3.8%
2001 6.0% 4.1% 0.3% 0.9% 5.8% 4.8% 1.7%
2003 5.6% 4.0% 1.8% 3.0% 5.9% 4.9% 4.0%
2004 8.2% 6.8% 2.7% 4.7% 6.3% 5.4% 2.6%
2005 9.2% 7.4% 2.0% 3.8% 7.3% 6.3% 1.2%
2006 4.7% 2.9% -2.2% -1.7% 5.5% 4.5% -0.1%

30
Georgia’s Property Taxes by the Numbers frc.gsu.edu
GEORGIA UNITED STATES
YEAR PROPERTY
TAX REVENUE
PROPERTY TAX
PER CAPITA
REAL PROPERTY TAX PER CAPITA
PROPERTY TAX PER $100 OF INCOME
PROPERTY TAX REVENUE
PROPERTY TAX
PER CAPITA
PROPERTY TAX PER $100 OF INCOME
2007 8.9% 6.2% 1.4% 1.8% 7.0% 6.0% -0.3%
2008 6.4% 4.2% -0.5% 0.8% 8.3% 7.3% 2.8%
2009 7.3% 5.6% 0.3% 4.7% 5.3% 4.3% 1.1%
2010 3.4% 2.2% 3.0% 6.6% 6.2% 5.2% 9.8%
2011 -0.1% -1.0% -4.2% -1.3% 2.1% 1.2% -1.0%
2012 -0.6% -1.6% -4.6% -7.2% 0.4% -0.4% -5.5%
2013 -1.3% -2.4% -4.0% -4.1% 0.3% -0.5% -4.5%
2014 -2.5% -3.3% -5.2% -4.2% 1.9% 1.1% 0.7%
31
Georgia’s Property Taxes by the Numbers frc.gsu.edu
Table A-5. State Gross Tax Digest by County
COUNTY
GROSS DIGEST
PER CAPITA, 2007
GROSS DIGEST
PER CAPITA, 2014
CHANGE IN GROSS
DIGEST PER CAPITA
PERCENT CHANGE IN GROSS
DIGEST PER CAPITA
PERCENT RESIDENTIAL,
2014
Appling $36,460 $43,759 $7,299 20.02% 17.7%
Atkinson $17,649 $20,303 $2,654 15.04% 23.3%
Bacon $20,304 $25,366 $5,062 24.93% 29.6%
Baker $34,358 $51,818 $17,460 50.82% 16.6%
Baldwin $25,086 $24,870 -$216 -0.86% 52.8%
Banks $41,461 $37,986 -$3,475 -8.38% 36.1%
Barrow $34,031 $24,087 -$9,944 -29.22% 57.3%
Bartow $35,799 $32,812 -$2,987 -8.34% 40.2%
Ben Hill $23,685 $24,308 $623 2.63% 39.2%
Berrien $24,582 $23,503 -$1,079 -4.39% 34.0%
Bibb $26,468 $29,030 $2,562 9.68% 46.9%
Bleckley $19,228 $23,462 $4,234 22.02% 43.8%
Brantley $22,800 $19,804 -$2,996 -13.14% 43.8%
Brooks $25,285 $39,252 $13,967 55.24% 25.9%
Bryan $40,433 $39,118 -$1,315 -3.25% 71.7%
Bulloch $28,179 $26,730 -$1,449 -5.14% 41.1%
Burke $78,454 $119,527 $41,073 52.35% 8.7%
Butts $32,845 $28,735 -$4,110 -12.51% 47.7%
Calhoun $27,150 $26,114 -$1,036 -3.81% 18.2%
Camden $35,295 $28,655 -$6,640 -18.81% 63.3%
Candler $25,672 $26,064 $392 1.53% 29.3%
Carroll $26,466 $24,737 -$1,729 -6.53% 51.2%
Catoosa $27,435 $26,520 -$915 -3.34% 59.5%
Charlton $34,107 $24,619 -$9,488 -27.82% 29.7%
Chatham $54,376 $49,510 -$4,866 -8.95% 48.4%
Chattahoochee $7,205 $5,802 -$1,403 -19.47% 32.8%
Chattooga $23,236 $20,936 -$2,300 -9.90% 38.0%
Cherokee $43,172 $35,097 -$8,075 -18.70% 59.6%
Clarke $32,339 $30,794 -$1,545 -4.78% 49.0%
Clay $31,407 $40,929 $9,522 30.32% 43.3%
Clayton $33,687 $25,596 -$8,091 -24.02% 32.1%
Clinch $38,327 $45,146 $6,819 17.79% 16.4%
Cobb $47,076 $40,936 -$6,140 -13.04% 56.2%
Coffee $25,169 $23,656 -$1,513 -6.01% 34.5%
Colquitt $18,297 $23,800 $5,503 30.07% 38.3%
Columbia $37,228 $35,026 -$2,202 -5.92% 67.3%
Cook $26,437 $27,268 $831 3.14% 34.3%

32
Georgia’s Property Taxes by the Numbers frc.gsu.edu
COUNTY
GROSS DIGEST
PER CAPITA, 2007
GROSS DIGEST
PER CAPITA, 2014
CHANGE IN GROSS
DIGEST PER CAPITA
PERCENT CHANGE IN GROSS
DIGEST PER CAPITA
PERCENT RESIDENTIAL,
2014
Coweta $36,401 $34,536 -$1,865 -5.12% 56.5%
Crawford $25,348 $26,250 $902 3.56% 46.6%
Crisp $27,669 $29,509 $1,840 6.65% 40.1%
Dade $30,214 $31,139 $925 3.06% 53.6%
Dawson $65,745 $56,523 -$9,222 -14.03% 59.9%
Decatur $30,127 $38,004 $7,877 26.15% 32.6%
Dekalb $35,822 $31,220 -$4,602 -12.85% 57.2%
Dodge $22,628 $21,408 -$1,220 -5.39% 36.1%
Dooly $25,798 $28,642 $2,844 11.02% 20.5%
Dougherty $25,291 $24,288 -$1,003 -3.97% 46.2%
Douglas $37,367 $27,750 -$9,617 -25.74% 53.7%
Early $43,942 $50,844 $6,902 15.71% 20.0%
Echols $27,953 $29,648 $1,695 6.06% 16.8%
Effingham $34,175 $31,230 -$2,945 -8.62% 55.8%
Elbert $29,237 $30,631 $1,394 4.77% 39.0%
Emanuel $22,523 $24,826 $2,303 10.22% 31.9%
Evans $21,150 $24,102 $2,952 13.96% 39.9%
Fannin $52,452 $63,031 $10,579 20.17% 72.9%
Fayette $51,882 $42,704 -$9,178 -17.69% 66.6%
Floyd $32,779 $32,296 -$483 -1.47% 42.9%
Forsyth $59,573 $47,194 -$12,379 -20.78% 70.3%
Franklin $42,020 $32,416 -$9,604 -22.85% 33.5%
Fulton $54,895 $53,405 -$1,490 -2.71% 49.3%
Gilmer $50,196 $43,449 -$6,747 -13.44% 61.9%
Glascock $37,143 $32,983 -$4,160 -11.20% 23.3%
Glynn $77,845 $60,245 -$17,600 -22.61% 66.1%
Gordon $34,655 $33,960 -$695 -2.01% 34.8%
Grady $29,946 $26,059 -$3,887 -12.98% 37.4%
Greene $110,693 $93,804 -$16,889 -15.26% 71.4%
Gwinnett $43,206 $34,174 -$9,032 -20.90% 55.5%
Habersham $33,652 $30,058 -$3,594 -10.68% 55.4%
Hall $40,120 $36,630 -$3,490 -8.70% 55.4%
Hancock $35,173 $52,953 $17,780 50.55% 39.8%
Haralson $27,160 $27,719 $559 2.06% 43.6%
Harris $39,342 $43,477 $4,135 10.51% 57.1%
Hart $45,350 $40,220 -$5,130 -11.31% 57.0%
Heard $38,662 $42,113 $3,451 8.93% 20.8%
Henry $40,266 $30,514 -$9,752 -24.22% 53.1%
Houston $28,138 $26,650 -$1,488 -5.29% 59.4%

33
Georgia’s Property Taxes by the Numbers frc.gsu.edu
COUNTY
GROSS DIGEST
PER CAPITA, 2007
GROSS DIGEST
PER CAPITA, 2014
CHANGE IN GROSS
DIGEST PER CAPITA
PERCENT CHANGE IN GROSS
DIGEST PER CAPITA
PERCENT RESIDENTIAL,
2014
Irwin $28,914 $33,813 $4,899 16.94% 25.5%
Jackson $43,627 $39,734 -$3,893 -8.92% 38.6%
Jasper $48,133 $33,396 -$14,737 -30.62% 40.7%
Jeff Davis $21,538 $21,318 -$220 -1.02% 33.1%
Jefferson $33,629 $31,913 -$1,716 -5.10% 25.4%
Jenkins $28,943 $28,782 -$161 -0.56% 21.8%
Johnson $23,475 $19,364 -$4,111 -17.51% 28.7%
Jones $31,428 $28,642 -$2,786 -8.86% 53.7%
Lamar $30,345 $31,197 $852 2.81% 43.0%
Lanier $23,646 $20,428 -$3,218 -13.61% 46.5%
Laurens $28,738 $27,571 -$1,167 -4.06% 37.8%
Lee $26,576 $34,601 $8,025 30.20% 55.6%
Liberty $19,966 $21,796 $1,830 9.16% 54.7%
Lincoln $41,425 $39,851 -$1,574 -3.80% 57.1%
Long $21,354 $19,017 -$2,337 -10.94% 55.2%
Lowndes $28,268 $28,365 $97 0.34% 46.8%
Lumpkin $55,257 $37,403 -$17,854 -32.31% 48.7%
Macon $31,456 $19,743 -$11,713 -37.24% 18.6%
Madison $28,936 $50,984 $22,048 76.19% 33.5%
Marion $37,984 $19,866 -$18,118 -47.70% 29.2%
Mcduffie $28,364 $24,035 -$4,329 -15.26% 42.6%
Mcintosh $43,495 $60,160 $16,665 38.31% 68.0%
Meriwether $28,012 $35,894 $7,882 28.14% 31.0%
Miller $28,775 $36,792 $8,017 27.86% 26.2%
Mitchell $25,820 $31,377 $5,557 21.52% 26.3%
Monroe $50,900 $57,826 $6,926 13.61% 34.1%
Montgomery $27,564 $23,814 -$3,750 -13.60% 35.1%
Morgan $76,279 $51,081 -$25,198 -33.03% 42.8%
Murray $26,127 $24,957 -$1,170 -4.48% 41.0%
Muscogee $25,650 $27,692 $2,042 7.96% 49.5%
Newton $33,479 $22,275 -$11,204 -33.47% 55.8%
Oconee $58,616 $48,433 -$10,183 -17.37% 59.3%
Oglethorpe $37,176 $29,784 -$7,392 -19.88% 42.2%
Paulding $33,985 $22,944 -$11,041 -32.49% 70.3%
Peach $23,913 $26,665 $2,752 11.51% 53.2%
Pickens $46,634 $48,834 $2,200 4.72% 61.1%
Pierce $24,161 $27,983 $3,822 15.82% 42.3%
Pike $33,179 $30,332 -$2,847 -8.58% 55.6%
Polk $25,157 $25,976 $819 3.25% 44.5%

34
Georgia’s Property Taxes by the Numbers frc.gsu.edu
COUNTY
GROSS DIGEST
PER CAPITA, 2007
GROSS DIGEST
PER CAPITA, 2014
CHANGE IN GROSS
DIGEST PER CAPITA
PERCENT CHANGE IN GROSS
DIGEST PER CAPITA
PERCENT RESIDENTIAL,
2014
Pulaski $26,762 $23,216 -$3,546 -13.25% 43.3%
Putnam $81,537 $74,234 -$7,303 -8.96% 64.3%
Quitman $33,466 $41,964 $8,498 25.39% 39.4%
Rabun $99,772 $100,439 $667 0.67% 57.6%
Randolph $31,082 $33,985 $2,903 9.34% 17.9%
Richmond $24,640 $26,532 $1,892 7.68% 46.6%
Rockdale $38,538 $26,195 -$12,343 -32.03% 52.9%
Schley $22,688 $29,165 $6,477 28.55% 28.8%
Screven $30,316 $34,529 $4,213 13.90% 28.7%
Seminole $29,360 $42,973 $13,613 46.37% 32.9%
Spalding $26,493 $24,543 -$1,950 -7.36% 44.8%
Stephens $31,680 $28,881 -$2,799 -8.84% 55.7%
Stewart $31,688 $30,116 -$1,572 -4.96% 14.8%
Sumter $24,621 $26,908 $2,287 9.29% 40.3%
Talbot $42,387 $42,676 $289 0.68% 16.3%
Taliaferro $45,894 $55,704 $9,810 21.37% 14.2%
Tattnall $15,666 $19,333 $3,667 23.41% 37.4%
Taylor $24,199 $35,646 $11,447 47.30% 20.9%
Telfair $22,666 $19,189 -$3,477 -15.34% 23.2%
Terrell $29,351 $35,234 $5,883 20.04% 31.0%
Thomas $27,419 $39,049 $11,630 42.42% 37.2%
Tift $27,706 $31,298 $3,592 12.97% 36.5%
Toombs $23,026 $28,044 $5,018 21.79% 35.0%
Towns $88,947 $69,805 -$19,142 -21.52% 79.2%
Treutlen $20,787 $20,351 -$436 -2.10% 33.0%
Troup $31,885 $33,129 $1,244 3.90% 37.7%
Turner $24,313 $34,405 $10,092 41.51% 22.7%
Twiggs $21,688 $39,556 $17,868 82.38% 23.5%
Union $67,255 $61,372 -$5,883 -8.75% 70.2%
Upson $26,031 $27,092 $1,061 4.08% 36.0%
Walker $23,164 $21,919 -$1,245 -5.38% 62.2%
Walton $37,778 $28,038 -$9,740 -25.78% 58.6%
Ware $20,388 $22,519 $2,131 10.45% 41.4%
Warren $33,385 $39,842 $6,457 19.34% 16.4%
Washington $39,966 $38,470 -$1,496 -3.74% 24.5%
Wayne (2013) $21,443 $33,075 $11,632 54.25% 33.3%
Webster $50,321 $43,315 -$7,006 -13.92% 15.5%
Wheeler $22,402 $21,112 -$1,290 -5.76% 15.9%
White $46,755 $34,694 -$12,061 -25.80% 55.6%

35
Georgia’s Property Taxes by the Numbers frc.gsu.edu
COUNTY
GROSS DIGEST
PER CAPITA, 2007
GROSS DIGEST
PER CAPITA, 2014
CHANGE IN GROSS
DIGEST PER CAPITA
PERCENT CHANGE IN GROSS
DIGEST PER CAPITA
PERCENT RESIDENTIAL,
2014
Whitfield $37,214 $33,381 -$3,833 -10.30% 35.1%
Wilcox $18,887 $19,105 $218 1.15% 26.3%
Wilkes $35,534 $44,060 $8,526 23.99% 25.8%
Wilkinson $37,809 $45,449 $7,640 20.21% 17.6%
Worth $24,573 $35,463 $10,890 44.32% 30.6%

36
Georgia’s Property Taxes by the Numbers frc.gsu.edu
About the Authors
DAVID SJOQUIST is a faculty member in the Andrew Young School of Policy
Studies at Georgia State University. A specialist in the field of public finance, Sjoquist
has an extensive interest in urban economics, especially local economic development,
central city poverty, and education policy. He has published extensively on topics,
such as analysis of public policies, tax allocation districts, teenage employment, local
government fiscal conditions, and the urban underclass. His current research interests
include property taxation, school financing, local sales taxes and income taxes. His
work has been published in such journals as American Economic Review, Journal of
Public Economics, National Tax Journal, and Review of Economics and Statistics. He
holds a doctorate from the University of Minnesota.
NICHOLAS WARNER, a research associate at the Fiscal Research Center at
Georgia State University, specializes in education finance. His recent research has
focused on school district expenditure and revenue portfolio analysis, tax expenditure
estimation, examination of Georgia’s special option sales tax for school facility funding,
and school districts’ responses to the Great Recession. His work has been published
in the Journal of Education Finance as well as by the Georgia Department of Early
Care and Learning. Warner received his master’s degree in economics from the
Andrew Young School of Policy Studies.
About the Fiscal Research Center
Established in 1995, the Fiscal Research Center (FRC) provides nonpartisan research, technical assistance
and education in the evaluation and design of state tax and economic policy. FRC’s responsibilities
include developing estimates for tax-related fiscal notes, writing the Georgia State Tax Expenditure
Budget, supporting the state’s economist, and conducting policy and academic research on a variety of
topics associated with state tax policy issues.
FRC reports, policy briefs, and other publications maintain a position of neutrality on public policy issues
in order to safeguard the academic freedom of the authors. Thus, interpretations or conclusions in FRC
publications should be understood to be solely those of the author(s).
For more information on the Fiscal Research Center, visit our website at: frc.gsu.edu.