Embed Size (px)
Citation preview

Georgia Charter Systems
2010-2011
A comprehensive overview of the current status of Georgia’s Charter Systems.
Charter School Division 2010-2011 Charter Systems Annual Report

Dr. John D. Barge, State School Superintendent
Page 2 of 242
Dear Georgia Public Education Supporters,
The Georgia Department of Education compiles annual academic and financial data on each operating
charter system and charter system school. This report examines how Georgia’s charter systems and
charter system schools are performing against other Georgia public schools.
During the 2010–11 school year, Georgia had 8 charter systems operating and 61 charter system
schools. Of these charter systems, 74% of the charter system schools made Adequate Yearly Progress
this year. This is comparable to the 73% of traditional public schools that made Adequate Yearly
Progress this year.
Over the past year, the Georgia Department of Education has adopted new Charter Schools Rules and
Guidelines that focus on accountability and transparency. We also launched a comprehensive training
program for new and existing charter schools. The Georgia Department of Education is also developing
additional resources for local school districts to strengthen authorizer practices.
Please note that this annual report includes summary and detailed information on each of Georgia’s
charter systems and charter system schools. Detailed information on each of Georgia’s charter systems
and charter system schools is include in Appendix B. Detailed information on start-up and conversion
charter ups is included in the 2010-2011 Georgia Charter School Annual Report to be released
separately.
Thank you for your ongoing dedication and hard work in helping to strengthen Georgia’s public
education system.
Sincerely,
Louis Erste
Charter Schools Director

Dr. John D. Barge, State School Superintendent
Page 3 of 242
Table of Contents
Highlights from the 2010-2011 School Year ................................................................................................ 4
Characteristics: Charter System Students and Charter System Schools ...................................................... 6
Georgia Charter System Student Demographics ................................................................................. 8
Georgia Charter System Free and Reduced-Price Lunch Eligible Compared to the State ................... 9
Figure 6: Georgia Charter System English Language Learners Compared to the State ..................... 10
Figure 7: Georgia Charter System Students with Disabilities Compared to the State ........................ 10
Charter System Schools by the Numbers .............................................................................................. 11
Growth .............................................................................................................................................. 11
Location ............................................................................................................................................ 13
Program and Operating Services and Innovative Features ............................................................... 14
Academic Performance of Charter Systems Compared to the State..................................................... 16
All Charter System Students ................................................................................................................. 16
By Type of Charter School ................................................................................................................. 18
Charter System AYP Performance By Grade Configuration ............................................................... 18
Academic Performance By Title I Status ........................................................................................... 19
Looking Forward to 2011 – 2012 .............................................................................................................. 20
Appendix A ................................................................................................................................................ 22
Appendix B ............................................................................................................................................ 25

Dr. John D. Barge, State School Superintendent
Page 4 of 242
Highlights from the 2010-2011 School Year Across the state, charter system schools and charter system students were recognized for excellence in
the 2010–2011 school year. Examples include:
69% of charter system schools (42 total schools of 61 schools) were recognized as
Distinguished Schools by Adequate Yearly Progress Standards:
o Cartersville City (2 schools)
o Decatur City (6 schools)
o Floyd County (13 schools)
o Gainesville City (5 schools)
o Marietta City (9 schools)
o Warren County (1school)
o White County (6 schools)
82% of Georgia’s Charter System High Schools* Scored Above State and/or National
Averages on the 2011 SATs:
o 4 Scored above the National Public School Average of 1483
o 9 scored above the Georgia Public School Average of 1431
o 1 is in the top 5% of SAT scores in Georgia,
o 4 additional in the top 20% ,
o 3 in the top 25%, and
o 1 more in the top 30% of SAT scores in Georgia.
Figure 1: 2011 SAT High Scoring Charter Schools
Charter System School, Charter System Total Score
Rank in
Georgia
Charter Schools Scoring Above National Average of 1483
Coosa High School (Floyd County) 1621 20th
Decatur High School (Decatur City) 1518 Top 20%
Armuchee High School (Floyd County) 1510 Top 20%
Model High School (Floyd County) 1500 Top 20%
Charter Schools Scoring Above the State Average of 1431
Marietta High School (Marietta City) 1482 Top 20%
Pepperell High School (Floyd County) 1475 Top 25%
Cartersville High School (Cartersville City) 1452 Top 25%
White County High School (White County) 1444 Top 25%
Putnam County High School (Putnam County) 1434 Top 30%
*11 of 12 Charter System High Schools administered the SAT in 2011

Dr. John D. Barge, State School Superintendent
Page 5 of 242
Thirteen schools (one per Congressional District) were named 2011 Georgia Schools of
Excellence, in the “Greatest Gains” category, including one charter system school,
Clairemont Elementary, City Schools of Decatur.
Eight Georgia schools received the 2011 National Blue Ribbon Award including charter
system school, Mount Yonah Elementary, White County. At least one charter schools in
Georgia has received the National Blue Ribbon Award four out of the last five years.
The number of Charter Systems doubled in 2010-11
o 4 new systems began their first year as charter systems in 2010-11 more than
doubling the 2009-10 number of charter system schools (27) to 61.
Cartersville City
Floyd County
Putnam County
White County

Dr. John D. Barge, State School Superintendent
Page 6 of 242
Characteristics: Charter System Students and Charter System Schools
Figure 2: Three Year history of Charter System Growth
The first four charter systems started operating under the terms of their charter during the 2008-2009
school year: Decatur City Schools, Gainesville City Schools, Marietta City Schools and Warren County
Schools. During the 2010-2011 school year, four additional charter systems opened: Cartersville City
Schools, Floyd County Schools, Putnam County Schools and White County Schools. As a result of the four
new charter systems, the number of charter system students increased to 39,070. The number of
students enrolled in charter systems is expected to increase dramatically over the next few years. Six
local districts opened as charter systems in the 2011-2012 school year and two more systems recently
applied to be charter systems in the 2012-2013 school year.

Dr. John D. Barge, State School Superintendent
Page 7 of 242
Figure 3: All Charter School Enrollment
While conversion and start-up charter schools have seen growth of around 20% in the past two years,
total charter school enrollment increased even more significantly with the addition of the four new
charter systems.
Nationally, charter school students represented 3.7% of all public school students in the 2010-11 school
year.1 Georgia charter school students represent 5.9% of the public school population in Georgia. Since
2009-2010, Georgia increased the number of charter school students by .2% each year when charter
system students are included. Conversion and start-up charter schools represent over half of the total
charter school enrolment with 3.5% of all public school students in Georgia.2
1 The Public Charter Schools Dashboard, A Comprehensive Data Resource from the National Alliance for Public Charter Schools. Accessed online via http://dashboard.publiccharters.org/dashboard/schools/year/2011. 2 Enrollment is based on the October 5, 2010 (FTE 2011-1) count and can be accessed online from the Georgia Department of Education’s website http://app3.doe.k12.ga.us/ows-bin/owa/fte_pack_ethnicsex.entry_form.

Dr. John D. Barge, State School Superintendent
Page 8 of 242
Georgia Charter System Student Demographics
Figure 4: Charter System Student Demographics for 2010-2011
While the enrollments of conversion and charter schools mirror the state demographics closely, charter
system enrollments diverge in three subgroups. Charter systems have higher percentages of students in
the hispanic subgroup than the overall state demographics. This is due primarily to the higher
concentration of hispanic populations in two of the charter systems in the Metro Atlanta Area, Marietta
City and Gainesville City. Each of these systems have hispanic populations over 30%.

Dr. John D. Barge, State School Superintendent
Page 9 of 242
Georgia Charter System Free and Reduced-Price Lunch Eligible Compared to the State
Figure 5: Georgia Charter System Eligibility for Free and Reduced-Price Lunch Compared to the State
During the 2010-11 school year 61.7% of Georgia’s charter system school students qualified for free and
reduced lunch compared with 57.4% of all public students statewide. This is a decline of 2.2% of charter
system students eligible for free/reduced lunch from 2009-10.
Figure 5: Charter System Free and Reduced Lunch Eligibility in 2009-2010 to 2010-2011

Dr. John D. Barge, State School Superintendent
Page 10 of 242
Figure 6: Georgia Charter System English Language Learners Compared to the State
Forty percent of Georgia charter system schools (24 schools) and four charter systems report English
Language Learners (ELLs) populations equal to or greater than the state average of 6% in at least one of
their schools. However, as in conversion and start-up schools, there is wide variation at the school level
in the percentage of ELLs served with some reporting no ELL students and others reporting as many as
60% of their students as ELLs.
Figure 7: Georgia Charter System Students with Disabilities Compared to the State
Two-thirds of Georgia’s charter system schools (40 schools) report Students with Disabilities (SWDs)
percentages at least equal to that of the state average of 10%. SWDs in charter schools range from a low
of 2.7% at Marietta Center for Advanced Academics to a high of 25% at McHenry Primary School in Floyd
County.

Dr. John D. Barge, State School Superintendent
Page 11 of 242
Charter System Schools by the Numbers
For the 2010-11 school year charter schools in Georgia, including charter system schools, represented
4.2% of all public Georgia schools, which is slightly lower than the national ratio (5.4%) of charter
schools to public schools. 3 Other than Florida, where charter schools represent almost 12% of public
schools, Georgia’s percentage of charter schools leads the neighboring states of North Carolina (3.9%),
South Carolina (3.6%) and Tennessee (1.7%). The remaining neighbor, Alabama, is one of only ten states
which did not have a charter law in 2010-11.
Figure 8: Number of Charter Schools in Operation in Georgia by School Year
Since 2007, four charter systems with a total of 27 schools have been operating in Georgia: Decatur City
Schools, Gainesville City Schools, Marietta City Schools and Warren County Schools.
Growth
Approved during the 2009-10 school year, four systems operated as charter systems in 2010-11:
Cartersville City, Floyd County, Putnam County and White County. This increased the number of charter
system schools by 34 to 61. Of the new charter systems, they range in size from 4 schools (Cartersville
City and Putnam County) to 19 schools (Floyd County).
3 The Public Charter Schools Dashboard. http://dashboard.publiccharters.org/dashboard/schools/year/2011.

Dr. John D. Barge, State School Superintendent
Page 12 of 242
Figure 9: Number of Schools within Each Charter System

Dr. John D. Barge, State School Superintendent
Page 13 of 242
Location
For the 2010-11 school year the eight charter systems were split inside and outside the 28-county
Atlanta Metro Statistical Area (MSA). The four city school districts: Cartersville, Decatur, Gainesville, and
Marietta are all inside the Atlanta MSA. The four counties: Floyd, Putnam, Warren and White, lie outside
the Atlanta MSA. All of the charter systems are located north of I-16.

Dr. John D. Barge, State School Superintendent
Page 14 of 242
Program and Operating Services and Innovative Features
Figure 11: Georgia Charter System High School with College and Career Opprotunities
Each of the charter system high schools offer at least some form of career or techical training for high
school course credit.
Figure 12: Innovative Features of Classroom Arrangements in Georgia Charter System Schools
More than half of charter system schools report using some innovate classroom features.

Dr. John D. Barge, State School Superintendent
Page 15 of 242
Figure 13: Innovative Scheduling Features in Charter System Schools
Over 70% of charter system schools indicated using innovate scheduling either daily, weekly or yearly.
Only 17 schools reported following the traditional class scheduling model.

Dr. John D. Barge, State School Superintendent
Page 16 of 242
Academic Performance of Charter Systems Compared to the State
All Charter System Students Figure 14: Percentage of Charter Schools Making AYP vs. Traditional Public Schools
Seventy percent of charter schools made AYP in 2010-11. This is a decrease from 80% in 2009-10. In
comparison, traditional public schools also declined from 2009-10 to 2010-11 although by a smaller
percentage. However, charter system schools have managed to outperform the state average AYP rate
for the 3rd consecutive year.
Figure 15: Percentage of Charter System Schools Making AYP vs. Traditional Public Schools

Dr. John D. Barge, State School Superintendent
Page 17 of 242
Figure 16: Charter System Schools Not Making AYP in 2010-11 (listed alphabetically)
Charter School Charter System
Grades Served AYP Status Reason
Armuchee High School Floyd County High NI - 1 Graduation Rate
Coosa High School Floyd County High NI - 1 Graduation Rate
Freeman Elementary School Warren County Elementary Did Not Meet - Adequate
Math – All Students; Attendance Rate
Gainesville Middle School Gainesville City Middle NI - 3
Math – ELL subgroup; ELA – SWD and ELL subgroups
Marietta Middle School Marietta City Middle Did Not Meet - Adequate ELA – SWD subgroup
Model High School Floyd County High Did Not Meet - Adequate Graduation Rate
Mossy Creek Elementary School White County Elementary Did Not Meet - Adequate
ELA and Math – SWD subgroup
New Pepperell High School Floyd County High Did Not Meet - Adequate Graduation Rate
Pepperell Elementary School Floyd County Elementary Did Not Meet - Adequate
Math – SWD subgroup
Pepperell Primary School Floyd County Elementary Did Not Meet - Adequate
Math – Econ. Disadv. Subgroup
Putnam County Elementary School Putnam County Elementary Did Not Meet - Adequate
Math – SWD subgroup
Putnam County High School Putnam County High NI - 3 Graduation Rate
Putnam County Middle School Putnam County Middle Did Not Meet - Adequate ELA – SWD subgroup
Putnam County Primary School Putnam County Elementary Did Not Meet - Adequate
Math – SWD subgroup
Warren County High School Warren County High NI – 2 Graduation Rate
Wood’s Mill Non-Traditional Academy Gainesville City High Did Not Meet - Adequate Math – All Students

Dr. John D. Barge, State School Superintendent
Page 18 of 242
By Type of Charter School
Figure 17: Charter Schools Making AYP by Type of Charter School
Charter system schools outperformed conversion and start-up schools with 74% of charter system
schools making AYP. One charter system, Decatur City Schools, made AYP with all six of its schools
making AYP for the third year in a row.
Charter System AYP Performance by Grade Configuration
Figure 18 : 2010-11 Percentage of Charter System Schools that Made AYP by Type
Charter System
Schools
State
Better Than the
State?
Elementary 83.3% 83.1% YES
Middle 75.0% 70.6% YES
High School 46.2% 41.5% YES
Charter system schools outperformed the state at the elementary, middle and high school level in the
number of schools making AYP for the 2010-11 school year. While charter system high schools did not
perform as well as charter system elementary or middle schools, six out of seven charter system high
schools passed the State Annual Measurable Objectives (AMOs) for the Georgia High School Graduation
Tests in Math and English. Although seven high schools failed to make AYP, six did so because of
Graduation Rate alone as noted in Figure 16 on page 17 of this report.

Dr. John D. Barge, State School Superintendent
Page 19 of 242
Academic Performance by Title I Status
Figure 19: Percentage of Charter System Schools that Made AYP by Title I Status in 2010-2011
Two-thirds of Georgia’s charter system schools are Title I. However, charter system schools performed
relatively similar regardless of Title I status.

Dr. John D. Barge, State School Superintendent
Page 20 of 242
Looking Forward to 2011 – 2012
Figure 20: 2010-11 SBOE and Charter Commission Activity
State Board of Education Petition Activity 2010-2011
Approved Withdrawn Denied Totals
Start-ups 8 1 1 10
Conversions 1 1 1 3
Renewals 10 7 0 17
Charter Systems 6 1 0 7
State Chartered Special Schools 11 5 0 16
Locally Approved former Commission Schools 2 1 4 7
Subtotal 38 16 6 60
Amendments 5 n/a n/a 5
Terminations 1 n/a n/a 1
Closed 4 n/a n/a 4
Subtotal 10 n/a n/a 10
The State Board of Education and the former Georgia Charter Schools Commission had a busy 2010-11
year reviewing applicants for charter schools and charter systems. Seven school districts applied for
charter system status, six were approved and one withdrew with plans to resubmit. The six approved
charter systems include: Barrow County, Calhoun City, Dawson County, Dublin City, Gordon County and
Morgan County. This brings the total charter system count to 14, nearly doubling the 2010-11
enrollments to 70,630 and 108 schools.
Figure 21: Currently Operating Charter Systems by Year Opened as Charter System
14 Charter Systems in Operation
2008-2010 2010-11 2011-12
Decatur City Cartersville City Barrow County
Gainesville City Floyd County Calhoun City
Marietta City Putnam County Dawson County
Warren County White County Dublin City
Gordon County
Morgan County

Dr. John D. Barge, State School Superintendent
Page 21 of 242
The 2011-12 school year began with the addition of the six newly approved charter systems bringing the
total number of charter system schools to 108. For the first time, charter system schools make up 50%
of the total number of charter schools. With the approaching deadline of 2015 for school districts to
choose to be either a charter system, IE2 system or remain the status quo, the continued growth in
districts becoming charter systems is anticipated. To date, there are two applications for charter system
status under consideration and 11 additional school systems have expressed intent to apply to be a
charter system. If all 13 districts were to be approved in the next two years, it would bring the total
number of charter systems to 27, with 277 charter system schools serving a total of 207,695 students.
Figure 22: Charter System Letters of Intent and Applications Received
Letters of Intent and Applications Received 2011-12
Number of
Districts Enrollment of Districts
Number of Schools
Applications Received 2 97,324 107
Letters of Intent Received 11 39,741 62
Subtotal 13 137,065 169

Dr. John D. Barge, State School Superintendent
Page 22 of 242
Appendix A
Charter Types referred to in this report
1. Conversion: a charter school that existed as a local school prior to becoming a charter school. To apply as a conversion, a majority of the faculty and instructional staff members and a majority of parents or guardians of students enrolled in the petitioning school must vote by secret ballot to apply for a charter.
2. Start-up: a charter school created by a petition brought forth by private individuals, private organizations, or a state or local public entity.
a. State-Chartered Special School: a charter school created as a special school that is operating under the terms of a charter between the charter petitioner and the SBOE. Petitioners may apply to become a state chartered special school if their petition is first denied by the local board and they apply for state chartered special school status to the SBOE. Conversion charter school petitioners may not apply to be state chartered special schools.
b. Charter Commission School: a charter school created as an independent school that operated under terms of a charter between the charter petitioner and the Georgia Charter Schools Commission. Petitioners were apply to become a charter commission school if their petition was denied by their local board or if they draw students from five or more counties.
c. Locally Approved Start-up: a charter school that is operating under the terms of a charter between the charter petitioner and the local district.
3. Charter System: a local school district that operates under a charter between the district as the charter petitioner and the SBOE.
Conversions, start-ups, and system charter schools are under the management and control of
their local board, with the SBOE as a third party to the contract. Only state-chartered special
schools are under the management and control of the SBOE. Commission schools were
managed and monitored by the Georgia Charter Schools Commission, however, since the
Commission disbanded no more Commission schools currently exist. All Commission schools
were either approved by their local districts, became State Chartered Special Schools or were
closed.
Testing History
In 2000, the State instituted the first year of the state assessment, the Criterion Referenced
Competency Tests (CRCT), for grades four, six, and eight. Spring 2002 and 2004 marked the first
operational administrations in all grades, which included English/ Language Arts, Mathematics, and
Reading in grades 1 through 8. Science and Social Studies are covered in grades 3 through 8.

Dr. John D. Barge, State School Superintendent
Page 23 of 242
Academic Data
From the academic data available on Georgia’s public schools, this Report highlights the most
useful. To look at progress over time, this Report includes standardized test scores for each charter
school, its local district, and the state. This selection of data allows readers to compare the charter
school’s achievement level to the local district and the State as well as to compare the charter school’s
rate of improvement to the local district and state. Further disaggregated data can be found for each
charter school on the Governor’s Office of Student Achievement website (www.gaosa.org).
Progress Towards Goals and Financial Audit
For locally-approved charter schools, information on academic goals and the financial audit was
provided by each charter school. This Report also contains information about the financial condition of
each charter school, including whether each school had a surplus at the end of the reporting period and
how much each school spent on facilities costs. Charter schools’ progress towards the academic goals
stated in their charters is important because, in conjunction with state and national accountability
systems, charter schools are held accountable for meeting these goals.
Acronyms
Throughout the report, a number of acronyms appear. Among these are: AYP or Adequate
Yearly Progress; CRCT or Criterion Reference Competency Test; GHSGT or Georgia High School
Graduation Test; GaDOE or Georgia Department of Education; LEA or Local Educational Agency; SBOE or
State Board of Education.
Acknowledgements
A special thank you from the Charter Schools Division to the following individuals and teams for
contributing time and data to this report:
State Board of Education Charter Schools Committee:
Mr. Brian Burdette, Chair
Mr. Kenneth Mason
Mr. Mike Royal
Ms. Linda Zechmann
Georgia Department of Education:
Dr. Dan Carter, Deputy Superintendent Policy, External Affairs and Charter Schools
Dr. Garry McGiboney, Associate Superintendent Policy, External Affairs and Charter Schools
Mr. Dennis Kramer, Federal Policy Analyst

Dr. John D. Barge, State School Superintendent
Page 24 of 242
Georgia Charter Schools Division Contact Information
Georgia Department of Education
2053 Twin Towers East
205 Jesse Hill Jr. Dr. SE
Atlanta, Georgia 30334-5040
(404) 657-0515
(404) 657-6978 (Fax)
STAFF: Charter Schools Division
Mr. Louis Erste, Director
Ms. Tabitha Press, Strategic Development Coordinator
Ms. Jackie Dodd, Administrative Assistant
Ms. Morgan Felts, Staff Attorney and Petition Specialist
Ms. Michelle Hansberry, Program Associate
Ms. Sarah Oliver, Operations Analyst
Mr. Terence Washington, Fiscal Analyst
Ms. Jennifer Wilson, Staff Attorney

Dr. John D. Barge, State School Superintendent
Page 25 of 242
Appendix B – Individual Charter System Reports and Charter System
School Reports
Appendix B includes individual school templates for the 8 charter systems and the 61 charter system
schools. Every charter school was required to submit an annual report to the Georgia Department of
Education by October 1st, 2011.
Please note that we have include academic performance graphs for all charter system schools
even ones that did not have students that took either the CRCT or GHSGTs. For these charter
schools, the graphs contain information on how the local district and state performed.
Please note that if a charter system high school was the only high school within a local district,
that there will not be a separate high school line on the academic performance graphs.
Please note that all academic performance data is the official GaDOE report card data. Please be
aware that other information is self-reported data including progress towards goals and
innovative features. Any typos or inaccuracies contained within these self-reported sections
reflect the school’s self-reported responses to the annual report survey.
Appendix B
Cartersville City Schools………………………………………………………………………………………………………………………...28
Cartersville Primary School ……………………………………………………………………………………………………………….32
Cartersville Elementary School…………………………………………………………………………………………………………. 35
Cartersville Middle School ………………………………………………………………………………………………………………..38
Cartersville High School …………………………………………………………………………………………………………………….41
City Schools of Decatur …………………………………………………………………………………………………………………………44
Clairemont Elementary School…………………………………………………………………………………………………………. 48
Glennwood Academy………………………………………………………………………………………………………………………. .51
Oakhurst Elementary School……………………………………………………………………………………………………………. 54
Renfroe Middle School…………………………………………………………………………………………………………………….. 57
Winnona Park Elementary School …………………………………………………………………………………………………….60
Decatur High School ………………………………………………………………………………………………………………………….63
Floyd County Schools ……………………………………………………………………………………………………………………………66
Alto Park Elementary School ..…………………………………………………………………………………………………………..70
Armuchee Elementary School…………………………………………………………………………………………………………...73
Armuchee High School ………………………………………………………………………………………………………………………76
Armuchee Middle School ………………………………………………………………………………………………………………….79
Cave Spring Elementary School …………………………………………………………………………………………………………82
Coosa High School …………………………………………………………………………………………………………………………….85
Coosa Middle School …………………………………………………………………………………………………………………………88

Dr. John D. Barge, State School Superintendent
Page 26 of 242
Garden Lakes Elementary School ………………………………………………………………………………………………………91
Glenwood Primary School …………………………………………………………………………………………………………………94
Johnson Elementary School……………………………………………………………………………………………………………….97
McHenry Primary ……………………………………………………………………………………………………………………………100
Midway Primary ……………………………………………………………………………………………………………………………..103
Model Elementary ………………………………………………………………………………………………………………………….106
Model Middle School……………………………………………………………………………………………………………………….109
Model High School ………………………………………………………………………………………………………………………....112
Pepperell Primary School…………………………………………………………………………………………………………………115
Pepperell Elementary School……………………………………………………………………………………………………………118
Pepperell Middle School …………………………………………………………………………………………………………………121
Pepperell High School ……………………………………………………………………………………………………………………..124
Gainesville City School System ……………………………………………………………………………………………………………127
Centennial Arts Academy ………………………………………………………………………………………………………………..131
Enota Multiple Intelligences ……………………………………………………………………………………………………………134
Gainesville Exploration Academy …………………………………………………………………………………………………….137
Fair Street International Baccalaureate World School …………………………………………………………………….140
Gainesville Middle School ……………………………………………………………………………………………………………….143
Gainesville High School …………………………………………………………………………………………………………………..146
New Holland Core Knowledge Academy …………………………………………………………………………………………149
Wood’s Mill Non-Traditional High School ……………………………………………………………………………………….152
Marietta City Schools ………………………………………………………………………………………………………………………….155
Marietta 6th Grade School ……………………………………………………………………………………………………………….159
Burruss Elementary School ……………………………………………………………………………………………………………..162
Dunleith Elementary School ……………………………………………………………………………………………………………165
Hickory Hills Elementary School ………………………………………………………………………………………………………168
Lockhead Elementary School …………………………………………………………………………………………………………..171
Marietta Center for Advanced Academics ……………………………………………………………………………………….174
Marietta High School ………………………………………………………………………………………………………………………177
Marietta Middle School …………………………………………………………………………………………………………………..180
Park Street Elementary School ………………………………………………………………………………………………………..183
West Side Elementary School ………………………………………………………………………………………………………..186
Putnam County Charter System ………………………………………………………………………………………………………….189
Putnam County Primary School……………………………………………………………………………………………………….193
Putnam County Elementary School ………………………………………………………………………………………………..196
Putnam County Middle School ……………………………………………………………………………………………………….199
Putnam County High School ……………………………………………………………………………………………………………202
Warren County Schools ………………………………………………………………………………………………………………………205
Freeman Elementary School …………………………………………………………………………………………………………..209
Warren County Middle School ………………………………………………………………………………………………………..212
Warren County High School …………………………………………………………………………………………………………….215

Dr. John D. Barge, State School Superintendent
Page 27 of 242
White County Schools …………………………………………………………………………………………………………………………218
White County 9th Grade Academy …………………………………………………………………………………………………..222
Jack P. Nix Primary ………………………………………………………………………………………………………………………….225
Mossy Creek Elementary School ……………..………………………………………………………………………………………228
Mountain Yonah Elementary School ……………………………………………………………………………………………….231
White County Intermediate …………………………………………………………………………………………………………….234
White County Middle ………………………………………………………………………………………………………………………237
White County High ………………………………………………………………………………………………………………………….240

Elementary
Charter Term Middle
High School
Total Schools
2007 2008 2009 2010 2011
Yes Yes No No Yes
2011 7.4% 8.8% Yes 2011 85.6% 80.9% Yes
2010 8.9% 9.7% Yes 2010 78.7% 80.8% No
2009 8.1% 8.7% Yes 2009 84.3% 78.9% Yes
2008 9.4% 9.5% Yes 2008 78.1% 75.4% Yes
2007 8.7% 10.0% Yes 2007 80.5% 72.3% Yes
3.4% 7.9% Yes 6.2% 8.3% Yes
58.2% 56.1% Yes 36.2% 37.0% No
96.6% 92.1% Yes 93.8% 91.7% Yes
8.5% 15.3% Yes 3.7% 15.5% Yes
52.2% 50.7% Yes 29.4% 37.5% No
91.5% 84.7% Yes 96.3% 84.5% YesMeets + Exceeds
Meets
1/0/1900
Key Facts
State
Does Not Meet
Better
than State
Does Not Meet
State
Meets
Math
System
Meets + Exceeds
Academic Achievements
Meets + Exceeds
Charter Approved
2011 GHSGT2011 CRCT
6/30/2015
10/26/2009
ELA / Reading
Year System
Meets
Opened
1
Better
than State
Percent Absent > 15 Days
Better
Than State
ELA
1
StateSystem
5
Meets
Meets + Exceeds
Does Not Meet
State
Math
15 Nelson Street
Cartersville, GA 30120
770.382.5880
Better
Than State
Charter End 4
Year System State
Cartersville City Schools
Adequate Yearly Progress
Better than
State
Better than
State
StateSystem
2
Graduation Rate
Number of Schools
Does Not Meet
System
Dr. John D. Barge, State School Superintendent
Page 28 of 242

Asian Black Hispanic White Multi LEP SWD F/ R Lunch
System 1.0% 22.1% 15.5% 56.6% 4.7% 10.4% 9.3% 55.7%
State 3.0% 37.0% 12.0% 44.0% 3.0% 6.0% 10.0% 57.0%
1)
2)
3)
4)
5)
2007 2008 2009 2010 2011
Yes Yes Yes Yes Yes
Yes Yes Yes Yes Yes
Yes Yes Yes Yes Yes
Yes Yes Yes Yes Yes
Cartersville Primary School
Cartersville Elementary School
Cartersville Middle School
At least 92% of familieis of the Cartersville City School System will rate the school system and its schools as "B" or higher in overall satisfaction on a
perception survey by 2014-2015.
Charter System Schools
Charter System Schools Adequate Yearly Progress
Cartersville High School
Student Demographics
Native American
0.1%
All students will meet high academic standards by 2014-2015.
The percentage of students who exceed high academic standards in reading, math, langauge arts, science, and social studies will increase by at
least 10% by 2014-2015.
The high school graduation rate will increase at least 10% by 2014-2015.
The achievement gap in ethnicty will be reduced by 2014-2015.
0.0%
Cartersville City Schools15 Nelson Street
Cartersville, GA 30120
770.382.5880
Charter System Strategic Goals:
Dr. John D. Barge, State School Superintendent
Page 29 of 242

5 Year History CRCT
Cartersville City Schools15 Nelson Street
Cartersville, GA 30120
770.382.5880
65.0%
70.0%
75.0%
80.0%
85.0%
90.0%
95.0%
100.0%
2007 2008 2009 2010 2011
CRCT: Math(Percent Passing)
Cartersville City Schools
State of Georgia
65.0%
70.0%
75.0%
80.0%
85.0%
90.0%
95.0%
100.0%
2007 2008 2009 2010 2011
CRCT: Reading/ELA(Percent Passing)
Cartersville City Schools
State of Georgia
65.0%
70.0%
75.0%
80.0%
85.0%
90.0%
95.0%
100.0%
2007 2008 2009 2010 2011
CRCT: Social Studies(Percent Passing)
Cartersville City Schools
State of Georgia
65.0%
70.0%
75.0%
80.0%
85.0%
90.0%
95.0%
100.0%
2007 2008 2009 2010 2011
CRCT: Science(Percent Passing)
Cartersville City Schools
State of Georgia
Dr. John D. Barge, State School Superintendent
Page 30 of 242

5 Year History GHSGT and Graduation Rate
15 Nelson Street
Cartersville, GA 30120Cartersville City Schools770.382.5880
55.0%
60.0%
65.0%
70.0%
75.0%
80.0%
85.0%
90.0%
95.0%
100.0%
2007 2008 2009 2010 2011
GHSGT: English Language Arts(Percent Passing)
Cartersville City Schools
State of Georgia
55.0%
60.0%
65.0%
70.0%
75.0%
80.0%
85.0%
90.0%
95.0%
100.0%
2007 2008 2009 2010 2011
GHSGT: Math(Percent Passing)
Cartersville City Schools
State of Georgia
55.0%
60.0%
65.0%
70.0%
75.0%
80.0%
85.0%
90.0%
95.0%
100.0%
2007 2008 2009 2010 2011
GHSGT: Science(Percent Passing)
Cartersville City Schools
State of Georgia
55.0%
60.0%
65.0%
70.0%
75.0%
80.0%
85.0%
90.0%
95.0%
100.0%
2007 2008 2009 2010 2011
GHSGT: Social Studies(Percent Passing)
Cartersville City Schools
State of Georgia
55.0%
60.0%
65.0%
70.0%
75.0%
80.0%
85.0%
90.0%
95.0%
100.0%
2007 2008 2009 2010 2011
High School Graduation Rate
Cartersville City Schools
State of Georgia
Dr. John D. Barge, State School Superintendent
Page 31 of 242

Teachers
Administrators
Support Staff
Teacher Attrition Rate
Principal
School Board Chair
Asian Black Hispanic White Multi LEP SWD F/ R Lunch
School 1% 21% 19% 54% 5% 17% 9% 62%
District 1% 22% 16% 57% 5% 10% 9% 56%
Does Not
MeetN/A 3.4% N/A 8.5% N/A N/A 16.6% N/A
Meets N/A 58.2% N/A 52.2% N/A N/A 49.9% N/A
Meets +
ExceedsN/A 96.6% N/A 91.5% N/A N/A 83.4% N/A
2011 Met Met Equal 2011 8.3% 7.4% No
2010 Met Did Not Meet Yes 2010 9.7% 8.9% No
2009 Met Did Not Meet Yes 2009 8.0% 8.1% Yes
2008 Met Met Equal 2008 6.8% 9.4% Yes
2007 Met Met Equal 2007 7.6% 8.7% Yes
315 Etowah Dr
Cartersville, GA 30120-4072
770.382.1733
4%
Emily Roberson
District
Better
than
District
District
Cartersville Primary School
Current Charter End
School
ELA / Reading
DistrictSchool
Native American
0%
Better
Than
District
Math Science
Adequate Yearly Progress Percent Absent > 15 Days
School DistrictYear
Key Facts Personnel
Instructional Days
Grades
Enrollment
Charter System Cartersville City 87.94
31141
Mission Statement
A Tradition…in preparing students for the challenges of progress and change, through development of the skills necessary to become lifelong learners, in
order that they may live successful and productive lives.
Better
than
District
7.856-8
180
10/26/2009
6/30/2015
Academic Achievements
N/A
Year
Better
Than
District
N/A
Charter Initially Approved Walter Gordon
DistrictSchool
0%
2011 CRCT
School
Student Demographics
N/A
Better
than
District
Dr. John D. Barge, State School Superintendent
Page 32 of 242

Block No Multi-age grouping Yes Career Academy No
Shortened Day No Student/teacher teams Yes International Baccalaureate Program No
Extended Day No Grades subdivided into houses No Pre-K No
Extended Week No Students remain with teacher 2+ years No After School Programs Yes
Extended Year No Single gender classes No Community Service No
•
•
•
Goal 1:
Goal 2:
Target:
Goal 3:
Target:
Goal 4:
Target:
Met Goal
315 Etowah Dr Cartersville, GA 30120-4072
770.382.1733
Did not meet goal
0.92
N/A
N/A
Increase % of students meeting/exceeding standards in reading on the CRCT by 2%.
0.95
Classroom Arrangements
What makes Cartersville Primary School Unique?
Did not meet goal
0.9
Increased percentage of students meeting/exceeding standards in reading, language arts, and mathematics.
Unique Accomplishments
Did not meet goal
Academic Goals
Increase % of parent involvement by 2%
676 contacts
Increase % of students meeting/exceeding standards in Language Arts on CRCT by 2%.
0.95
Met/Did Not Meet:
2010-11 Results:
Met/Did Not Meet:
0.95
2010-11 Results: 0.92
Met/Did Not Meet:
2010-11 Results: 1168 contacts
Increase % of students meeting/exceeding standards in math on the CRCT by 2%.
2010-11 Results:
Met/Did Not Meet:
Target:
Scheduling Instructional Type/Services Offered
Cartersville Primary School
Dr. John D. Barge, State School Superintendent
Page 33 of 242

315 Etowah Dr
Cartersville, GA 30120-4072
5 Year History of CRCT and Student Attendance
770.382.1733
Cartersville Primary School
65.0%
70.0%
75.0%
80.0%
85.0%
90.0%
95.0%
100.0%
2007 2008 2009 2010 2011
CRCT: Mathematics (Percent Passing)
Cartersville Primary School
Cartersville City
State of Georgia
65.0%
70.0%
75.0%
80.0%
85.0%
90.0%
95.0%
100.0%
2007 2008 2009 2010 2011
CRCT: Reading (Percent Passing)
Cartersville Primary School
Cartersville City
State of Georgia
65.0%
70.0%
75.0%
80.0%
85.0%
90.0%
95.0%
100.0%
2007 2008 2009 2010 2011
CRCT: English Language Arts (Percent Passing)
Cartersville Primary School
Cartersville City
State of Georgia
65.0%
70.0%
75.0%
80.0%
85.0%
90.0%
95.0%
100.0%
2007 2008 2009 2010 2011
CRCT: Science (Percent Passing)
Cartersville Primary School
Cartersville City
State of Georgia
65.0%
70.0%
75.0%
80.0%
85.0%
90.0%
95.0%
100.0%
2007 2008 2009 2010 2011
CRCT: Social Studies (Percent Passing)
Cartersville Primary School
Cartersville City
State of Georgia
65.0%
70.0%
75.0%
80.0%
85.0%
90.0%
95.0%
100.0%
2007 2008 2009 2010 2011
Student Attendance
Cartersville Primary School
Cartersville City
State of Georgia
Dr. John D. Barge, State School Superintendent
Page 34 of 242

Teachers
Administrators
Support Staff
Teacher Attrition Rate
Principal
School Board Chair
Asian Black Hispanic White Multi LEP SWD F/ R Lunch
School 1% 24% 16% 54% 4% 15% 11% 59%
District 1% 22% 16% 57% 5% 10% 9% 56%
Does Not
Meet3.3% 3.4% Yes 8.5% Yes 14.4% 16.6% Yes
Meets 57.2% 58.2% No 52.2% No 43.9% 49.9% No
Meets +
Exceeds96.7% 96.6% Yes 91.5% Yes 85.6% 83.4% Yes
2011 Met Met Equal 2011 2.4% 7.4% Yes
2010 Did Not Meet Did Not Meet Equal 2010 3.9% 8.9% Yes
2009 Met Did Not Meet Yes 2009 4.4% 8.1% Yes
2008 Met Met Equal 2008 3.5% 9.4% Yes
2007 Met Met Equal 2007 3.4% 8.7% Yes
Charter Initially Approved Kenneth MacKenzie
DistrictSchool
0%
2011 CRCT
School
Student Demographics
92.2%
42.9%
Academic Achievements
7.8%
Year
Better
Than
District
Mission Statement
To educate students to become knowledgeable, emotionally stable, responsible children who are prepared to meet life's challenges.
Better
than
District
Better
than
District
5.35K-5
180
10/26/2009
6/30/2015
Key Facts Personnel
Instructional Days
Grades
Enrollment
Charter System Cartersville City 63.11
2969
Adequate Yearly Progress Percent Absent > 15 Days
School District
Native American
0%
Better
Than
District
Math Science
School DistrictDistrict School
Year
Better
than
District
District
Cartersville Elementary School
Current Charter End T. Andrew Davis
ELA / Reading
340 Old Mill Rd
Cartersville, GA 30120-4027
770.382.0983
5%
Dr. John D. Barge, State School Superintendent
Page 35 of 242

Block No Multi-age grouping Yes Career Academy No
Shortened Day No Student/teacher teams Yes International Baccalaureate Program No
Extended Day No Grades subdivided into houses No Pre-K No
Extended Week No Students remain with teacher 2+ years No After School Programs Yes
Extended Year No Single gender classes No Community Service No
•
•
•
Goal 1:
Goal 2:
Target:
Goal 3:
Target:
Goal 4:
Target:
Scheduling Instructional Type/Services Offered
Cartersville Elementary School
2010-11 Results: 3rd Grade: 100%, 4th Grade: 56%, 5th Grade: 97%
Increase student achievement in mathematics.
2010-11 Results:
Met/Did Not Meet:
Target:
2010-11 Results:
Met/Did Not Meet:
3rd Grade: 85%, 4th Grade: 85%, 5th Grade: 88%
2010-11 Results: 3rd Grade: 87%, 4th Grade: 91%, 5th Grade 98%
Met/Did Not Meet:
Met/Did Not Meet:
Increase student achievement for students with disabilities (SWD) in reading.
3rd Grade: 81%, 4th Grade: 69%, 5th Grade: 61%
Increase student achievement in English/Language Arts
3rd Grade: 91%, 4th Grade: 90%, 5th Grade 95%
Met Goal
Met Goal
Academic Goals
Students will meet/exceed CRCT in reading: 3rd Grade: 95%, 4th Grade: 90%, 5th Grade: 91%
Met Goal
3rd Grade: 98.5%, 4th Grade 95%, 5th Grade 98.7%
The school's Criterion Reference Competency Test (CRCT) scores for students with disabilities improved dramatically during FY11. This
growth enabled the school to meet AYP requirements.
Unique Accomplishments
3rd Grade 96%, 4th Grade: 93%, 5th Grade 97.5%
All teachers at the school participated in professional learning communities throughout the year.
Improvements in technology throughout the school were accomplished largely due to an expansive fund raising project.
Classroom Arrangements
What makes Cartersville Elementary School Unique?
Increase student achievement in reading.
Did not meet goal but made progress towards goal. The target was met for 3rd & 5th grade SWD students. 4th Grade showed
significant progress from previous year (35%).
340 Old Mill Rd Cartersville, GA 30120-4027
770.382.0983
Dr. John D. Barge, State School Superintendent
Page 36 of 242

770.382.0983
5 Year History of CRCT and Student Attendance
Cartersville Elementary SchoolCartersville, GA 30120-4027
340 Old Mill Rd
65.0%
70.0%
75.0%
80.0%
85.0%
90.0%
95.0%
100.0%
2007 2008 2009 2010 2011
CRCT: Mathematics (Percent Passing)
Cartersville Elementary School
Cartersville City
State of Georgia
65.0%
70.0%
75.0%
80.0%
85.0%
90.0%
95.0%
100.0%
2007 2008 2009 2010 2011
CRCT: Reading (Percent Passing)
Cartersville Elementary School
Cartersville City
State of Georgia
65.0%
70.0%
75.0%
80.0%
85.0%
90.0%
95.0%
100.0%
2007 2008 2009 2010 2011
CRCT: English Language Arts (Percent Passing)
Cartersville Elementary School
Cartersville City
State of Georgia
65.0%
70.0%
75.0%
80.0%
85.0%
90.0%
95.0%
100.0%
2007 2008 2009 2010 2011
CRCT: Science (Percent Passing)
Cartersville Elementary School
Cartersville City
State of Georgia
65.0%
70.0%
75.0%
80.0%
85.0%
90.0%
95.0%
100.0%
2007 2008 2009 2010 2011
CRCT: Social Studies (Percent Passing)
Cartersville Elementary School
Cartersville City
State of Georgia
65.0%
70.0%
75.0%
80.0%
85.0%
90.0%
95.0%
100.0%
2007 2008 2009 2010 2011
Student Attendance
Cartersville Elementary School
Cartersville City
State of Georgia
Dr. John D. Barge, State School Superintendent
Page 37 of 242

Teachers
Administrators
Support Staff
Teacher Attrition Rate
Principal
School Board Chair
Asian Black Hispanic White Multi LEP SWD F/ R Lunch
School 1% 21% 14% 59% 4% 5% 10% 55%
District 1% 22% 16% 57% 5% 10% 9% 56%
Does Not
Meet3.5% 3.4% No 8.5% No 19.1% 16.6% No
Meets 59.3% 58.2% Yes 52.2% Yes 56.6% 49.9% Yes
Meets +
Exceeds96.5% 96.6% No 91.5% No 80.9% 83.4% No
2011 Met Met Equal 2011 6.7% 7.4% Yes
2010 Met Did Not Meet Yes 2010 8.9% 8.9% Equal
2009 Met Did Not Meet Yes 2009 8.2% 8.1% No
2008 Met Met Equal 2008 14.3% 9.4% No
2007 Met Met Equal 2007 10.2% 8.7% No
90.8%
62.6%
Native American
0%
District
Better
than
District
Charter Initially Approved Jeff Hogan
DistrictSchool
0%
2011 CRCT
6/30/2015
SchoolSchool
Student Demographics
Year
Mission Statement
A Tradition…in preparing students for the challenges of progress and change through development of the skills necessary to become lifelong learners, in
order that they may live successful and productive lives.
Better
than
District
Better
than
District
5.856-8
180
10/26/2009
Academic Achievements
Grades
Enrollment
Charter System Cartersville City 56.9
3882
ELA / Reading
Adequate Yearly Progress Percent Absent > 15 Days
School District
Cartersville Middle School
Current Charter End
District
Key Facts Personnel
Instructional Days
825 Douthit Ferry Rd
Cartersville, GA 30120-6401
770.382.3666
District
Better
Than
District
8%
Bryan Edwards
Math Science
School
9.2%
Year
Better
Than
District
Dr. John D. Barge, State School Superintendent
Page 38 of 242

Block Yes Multi-age grouping No Career Academy No
Shortened Day No Student/teacher teams Yes International Baccalaureate Program No
Extended Day No Grades subdivided into houses Yes Pre-K No
Extended Week No Students remain with teacher 2+ years No After School Programs No
Extended Year No Single gender classes No Community Service No
•
•
•
Goal 1:
Goal 2:
Target:
Goal 3:
Target:
Goal 4:
Target:
Scheduling Instructional Type/Services Offered
2010-11 Results: 6th Grade: 78%, 7th Grade: 90%, 8th Grade: 75%
90% or more of all grade 6-8 will meet or exceed academic standards on the CRCT-Science by 2014-2015.
Cartersville Middle School
2010-11 Results:
Met/Did Not Meet:
Target:
2010-11 Results:
Met/Did Not Meet:
6th Grade: 95%, 7th Grade: 95%, 8th Grade: 95%
6th Grade: 84%, 7th Grade: 76%, 8th Grade: 75%
6th Grade: 97%, 7th Grade 98%, 8th Grade: 97%
2010-11 Results: 6th Grade: 93%, 7th Grade: 97%, 8th Grade: 96%
Met/Did Not Meet:
The successful Honors program at the school is unique due to the fact that all core academic teachers have gifted endorsement and we are
able to serve high achieving and gifted students in this program.
Unique Accomplishments
Met Goal
6th Grade: 80%, 7th Grade: 80%, 8th Grade: 70%
Did not meet goal but made progress towards goal. Two of the three grade levels met target (6th & 8th). 7th Grade was only 4%
off target for the year.
100% of all grades 6-8 students will meet or exceed standards on the CRCT-English/Language Arts test by 2014-2015.
Did not meet goal but made progress towards goal. Two of the 3 grades met target (7th & 8th). 6th Grade missed target by only
2%.
Met/Did Not Meet:
Classroom Arrangements
What makes Cartersville Middle School Unique?
6th Grade: 83%, 7th Grade: 82%, 8th Grade: 70%
90% or more of all grade 6-8 will meet or exceed academic standards on the CRCT-Social Studies by 2014-2015.
6th Grade: 95%, 7th Grade: 94%, 8th Grade: 95%
We saw a dramatic increase in Middle Grades Writing Assessment scores this past year due to our Writing Matters Program.
We also saw an increase in our math achievement due to the Math Navigator program and our extended learning time.
100% of all grade 6-8 students will meet or exceed standards on the CRCT-Reading by 2014-2015.
Did not meet goal but made progress towards goal. Two of the 3 grades met target (7th & 8th). 6th Grade missed target by only
5%.
825 Douthit Ferry RdCartersville, GA 30120-6401
Academic Goals
770.382.3666
Dr. John D. Barge, State School Superintendent
Page 39 of 242

Cartersville Middle School
5 Year History of CRCT and Student Attendance
Cartersville, GA 30120-6401
770.382.3666
825 Douthit Ferry Rd
65.0%
70.0%
75.0%
80.0%
85.0%
90.0%
95.0%
100.0%
2007 2008 2009 2010 2011
CRCT: Mathematics (Percent Passing)
Cartersville Middle School
Cartersville City
State of Georgia
65.0%
70.0%
75.0%
80.0%
85.0%
90.0%
95.0%
100.0%
2007 2008 2009 2010 2011
CRCT: Reading (Percent Passing)
Cartersville Middle School
Cartersville City
State of Georgia
65.0%
70.0%
75.0%
80.0%
85.0%
90.0%
95.0%
100.0%
2007 2008 2009 2010 2011
CRCT: English Language Arts (Percent Passing)
Cartersville Middle School
Cartersville City
State of Georgia
65.0%
70.0%
75.0%
80.0%
85.0%
90.0%
95.0%
100.0%
2007 2008 2009 2010 2011
CRCT: Science (Percent Passing)
Cartersville Middle School
Cartersville City
State of Georgia
55.0%
60.0%
65.0%
70.0%
75.0%
80.0%
85.0%
90.0%
95.0%
100.0%
2007 2008 2009 2010 2011
CRCT: Social Studies (Percent Passing)
Cartersville Middle School
Cartersville City
State of Georgia
65.0%
70.0%
75.0%
80.0%
85.0%
90.0%
95.0%
100.0%
2007 2008 2009 2010 2011
Student Attendance
Cartersville Middle School
Cartersville City
State of Georgia
Dr. John D. Barge, State School Superintendent
Page 40 of 242

Teachers
Administrators
Support Staff
Teacher Attrition Rate
Principal
School Board Chair
Asian Black Hispanic White Multi LEP SWD F/ R Lunch
School 1% 22% 12% 59% 5% 4% 7% 47%
District 1% 22% 16% 57% 5% 10% 9% 56%
Does Not
Meet6.2% 6.2% Equal 3.7% Equal 2.9% 2.9% Equal
Meets 36.2% 36.2% Equal 29.4% Equal 32.4% 32.4% Equal
Meets +
Exceeds93.8% 93.8% Equal 96.3% Equal 97.1% 97.1% Equal
2011 Met Met Equal 2011 85.6% 85.6% Equal
2010 Did Not Meet Did Not Meet Equal 2010 78.7% 78.7% Equal
2009 Did Not Meet Did Not Meet Equal 2009 84.3% 84.3% Equal
2008 Met Met Equal 2008 78.1% 78.1% Equal
2007 Met Met Equal 2007 80.5% 80.5% Equal
Better
Than
District
Cartersville High School320 E Church St
Cartersville, GA 30120-3312
770.382.3200
School
ELA
Grades
Enrollment
Charter System
Science
District
96.3%
Graduation Rate
School District
Better
Than
District
Mission Statement
A Tradition . . . in preparing students for the challenges of progress and change, through development of the skills necessary to become lifelong learners,
in order that they may live successful and productive lives.
Year
Key Facts Personnel
Instructional Days
4.34K-5
180
10/26/2009
6/30/2015
Charter Initially Approved
Current Charter End
Cartersville City 59.25
2.251086
4%
Sherry Kellerman
Jaybez Floyd
29.4%
District
District
School
School
3.7%
Year
Better
than
District
District
Adequate Yearly Progress
0%
2011 GHSGT
School
Student Demographics
Better
than
District
Better
than
District
Academic Achievements
Native American
0%
Math
Dr. John D. Barge, State School Superintendent
Page 41 of 242

Block Yes Multi-age grouping No Career Academy No
Shortened Day No Student/teacher teams No International Baccalaureate Program No
Extended Day No Grades subdivided into houses No Pre-K No
Extended Week No Students remain with teacher 2+ years No After School Programs Yes
Extended Year No Single gender classes No Community Service No
•
•
•
Goal 1:
Goal 2:
Target:
Goal 3:
Target:
Goal 4:
Target:
Did not meet goal but made progress towards goal. Target was met in 3 of 4 content areas. Only Social Studies did not meet
target.
320 E Church St
Met Goal
English 58.7%, Math 69.4%, Science 65%, Social Studies 37%
By the end of 2014-2015, the high school graduation rate will be 90% or higher.
Cartersville High School
Classroom Arrangements
What makes Cartersville High School Unique?
Did not meet goal but made progress towards goal. Met targets in 3 of 4 content areas. Only Social Studies did not meet the
target.
770.382.3200
Scheduling Instructional Type/Services Offered
All students will meet high academic standards by 2014-2015.
English 95.3%, Math 96%, Science 97%, Social Studies 77%
Did not meet goal but made progress towards goal. Target was met in 3 of the 4 content areas. Only Social Studies did not meet
the target.
Cartersville, GA 30120-3312
Academic Goals
GHSGT scores: English 92%, Math 96%, Science 92%, Social Studies 92%
The school met AYP in FY2011 after not meeting it in FY2010. The graduation rate increased to over 85%. There was also an increase in
Georgia High School Graduation Test scores.
Forty-five percent of graduates qualified for HOPE scholarship and 50% of students taking Advance Placement classes earned college credit.
A Careers Day was sponsored by local community business owners to advance career readiness.
The percentage of students who exceed high academic standards will increase by at least 10% by 2014-2015.
Exceeding Standards on GHSGT: English 54%, Math 55%, Science 51%, Social Studies 43%
The school received a grant from the Georgia Appalachian Center for Higher Education which focus on moving graduates into some form of
post-secondary institution. The grant promotes a "college culture" at the high school.
Unique Accomplishments
2010-11 Results: English 88.2%, Math 90%, Science 87%, Social Studies 46%
Met/Did Not Meet:
2010-11 Results:
Met/Did Not Meet:
Graduation rate of 80% or higher.
2010-11 Results: Graduation rate was 85.7%
The achievement gap will be reduced by 2014-2015.
GHSGT meets/exceeds for black subgroup: English 75%, Math 82%, Science 79%, Socials Studies 80%
Met/Did Not Meet:
2010-11 Results:
Met/Did Not Meet:
Target:
Dr. John D. Barge, State School Superintendent
Page 42 of 242

320 E Church St
Cartersville High School
5 Year History of GHSGT and Graduation Rate
Cartersville, GA 30120-3312
770.382.3200
65.0%
70.0%
75.0%
80.0%
85.0%
90.0%
95.0%
100.0%
2007 2008 2009 2010 2011
GHSGT: Mathematics (Percent Passing)
Cartersville High School
Cartersville City
State of Georgia
65.0%
70.0%
75.0%
80.0%
85.0%
90.0%
95.0%
100.0%
2007 2008 2009 2010 2011
GHSGT: English Language Arts (Percent Passing)
Cartersville High School
Cartersville City
State of Georgia
65.0%
70.0%
75.0%
80.0%
85.0%
90.0%
95.0%
100.0%
2007 2008 2009 2010 2011
GHSGT: Science (Percent Passing)
Cartersville High School
Cartersville City
State of Georgia
65.0%
70.0%
75.0%
80.0%
85.0%
90.0%
95.0%
100.0%
2007 2008 2009 2010 2011
GHSGT: Social Studies (Percent Passing)
Cartersville High School
Cartersville City
State of Georgia
65.00%
70.00%
75.00%
80.00%
85.00%
90.00%
95.00%
100.00%
2007 2008 2009 2010 2011
Graduation Rate
Cartersville High School
Cartersville City
State of Georgia
Dr. John D. Barge, State School Superintendent
Page 43 of 242

Elementary
Charter Term Middle
High School
Total Schools
2007 2008 2009 2010 2011
Yes No Yes Yes Yes
2011 4.6% 8.8% Yes 2011 88.4% 80.9% Yes
2010 4.3% 9.7% Yes 2010 88.7% 80.8% Yes
2009 6.4% 8.7% Yes 2009 88.1% 78.9% Yes
2008 6.3% 9.5% Yes 2008 81.6% 75.4% Yes
2007 5.1% 10.0% Yes 2007 89.3% 72.3% Yes
3.3% 7.9% Yes 1.7% 8.3% Yes
44.7% 56.1% No 30.2% 37.0% No
96.7% 92.1% Yes 98.3% 91.7% Yes
8.3% 15.3% Yes 6.1% 15.5% Yes
42.2% 50.7% No 42.2% 37.5% Yes
91.7% 84.7% Yes 93.9% 84.5% Yes
City Schools of Decatur
Adequate Yearly Progress
StateBetter
than State
Math
Meets + Exceeds
Meets
Meets + Exceeds
Math
System
ELA / Reading
2011 CRCT
Year
Meets
State
Meets + Exceeds
System
Opened
1
Better
than State
Charter End
System
2011 GHSGT
Charter Approved
Academic Achievements
1
Percent Absent > 15 Days
Better
Than State
ELA
Meets + Exceeds
State
Does Not Meet
758 Scott Boulevard
Decatur, GA 30030
404.370.4400
Better
Than State
Number of Schools
Year System
System
Does Not Meet
4
Graduation Rate
Does Not Meet
Meets
System State
State
Does Not Meet
6
Meets
6/12/2008
6/30/2013
Better than
State
Better than
State
State
Key Facts
8/1/2008
5
Dr. John D. Barge, State School Superintendent
Page 44 of 242

Asian Black Hispanic White Multi LEP SWD F/ R Lunch
System 2.3% 31.9% 4.1% 56.6% 5.0% 2.2% 11.0% 24.4%
State 3.0% 37.0% 12.0% 44.0% 3.0% 6.0% 10.0% 57.0%
1)
2)
3)
4)
5)
2007 2008 2009 2010 2011
Yes Yes Yes Yes Yes
Yes Yes Yes Yes Yes
Yes Yes Yes Yes Yes
Yes Yes Yes Yes Yes
Yes Yes Yes Yes Yes
Yes Yes Yes Yes Yes
0.0%
Charter System Schools Adequate Yearly Progress
0.1%
Native American
Oakhurst Elementary School
Student Demographics
Glennwood Academy
Winnona Park Elementary School
Improve academic achievement for all students.
Close the achievement gap.
Act in a systematic manner.
Be fiscally responsible.
Continue to improve relationships with the community.
City Schools of Decatur758 Scott Boulevard
Decatur, GA 30030
404.370.4400
Charter System Strategic Goals:
Charter System Schools
Clairemont Elementary School
Decatur High School
Renfroe Middle School
Dr. John D. Barge, State School Superintendent
Page 45 of 242

5 Year History CRCT
City Schools of Decatur Decatur, GA 30030
404.370.4400
758 Scott Boulevard
65.0%
70.0%
75.0%
80.0%
85.0%
90.0%
95.0%
100.0%
2007 2008 2009 2010 2011
CRCT: Math(Percent Passing)
City Schools of Decatur
State of Georgia
65.0%
70.0%
75.0%
80.0%
85.0%
90.0%
95.0%
100.0%
2007 2008 2009 2010 2011
CRCT: Reading/ELA(Percent Passing)
City Schools of Decatur
State of Georgia
65.0%
70.0%
75.0%
80.0%
85.0%
90.0%
95.0%
100.0%
2007 2008 2009 2010 2011
CRCT: Social Studies(Percent Passing)
City Schools of Decatur
State of Georgia
65.0%
70.0%
75.0%
80.0%
85.0%
90.0%
95.0%
100.0%
2007 2008 2009 2010 2011
CRCT: Science(Percent Passing)
City Schools of Decatur
State of Georgia
Dr. John D. Barge, State School Superintendent
Page 46 of 242

5 Year History GHSGT and Graduation Rate
City Schools of Decatur758 Scott Boulevard
Decatur, GA 30030
404.370.4400
65.0%
70.0%
75.0%
80.0%
85.0%
90.0%
95.0%
100.0%
2007 2008 2009 2010 2011
GHSGT: English Language Arts(Percent Passing)
City Schools of Decatur
State of Georgia
65.0%
70.0%
75.0%
80.0%
85.0%
90.0%
95.0%
100.0%
2007 2008 2009 2010 2011
GHSGT: Math(Percent Passing)
City Schools of Decatur
State of Georgia
65.0%
70.0%
75.0%
80.0%
85.0%
90.0%
95.0%
100.0%
2007 2008 2009 2010 2011
GHSGT: Science(Percent Passing)
City Schools of Decatur
State of Georgia
65.0%
70.0%
75.0%
80.0%
85.0%
90.0%
95.0%
100.0%
2007 2008 2009 2010 2011
GHSGT: Social Studies(Percent Passing)
City Schools of Decatur
State of Georgia
65.0%
70.0%
75.0%
80.0%
85.0%
90.0%
95.0%
100.0%
2007 2008 2009 2010 2011
High School Graduation Rate
City Schools of Decatur
State of Georgia
Dr. John D. Barge, State School Superintendent
Page 47 of 242

Teachers
Administrators
Support Staff
Teacher Attrition Rate
Principal
School Board Chair
Asian Black Hispanic White Multi LEP SWD F/R Lunch
School 3% 24% 4% 63% 6% 1% 8% 22%
District 2% 32% 4% 57% 5% 2% 11% 24%
Does Not
Meet2.2% 3.3% Yes 8.3% No 6.4% 10.2% Yes
Meets 41.4% 44.7% No 42.2% No 24.5% 37.5% No
Meets +
Exceeds97.8% 96.7% Yes 91.7% No 93.6% 89.8% Yes
2011 Met Met Equal 2011 4.1% 4.6% Yes
2010 Met Met Equal 2010 4.6% 4.3% No
2009 Met Met Equal 2009 5.1% 6.4% Yes
2008 Met Did Not Meet Yes 2008 5.6% 6.3% Yes
2007 Met Met Equal 2007 3.8% 5.1% Yes
District
Better
than
District
District
Clairemont Elementary School155 Erie Ave
Decatur, GA 30030-1861
404.370.4450
School
ELA / Reading
Grades
Enrollment
Charter System
0%
Better
Than
District
Math Science
Adequate Yearly Progress Percent Absent > 15 Days
School District
Mission Statement
Our school's mission is best stated through our motto, "Learning together with our heads, hearts and hands." We believe that all students learn to their
fullest when engaged intellectually, emotionally and physically. We will provide these experiences for all Clairemont students.
Year
Key Facts Personnel
Instructional Days
2.35K-5
176
6/12/2008
6/30/2013
Charter Initially Approved
Current Charter End
District
Decatur City 27.43
2360
7%
Lily Pettus
Erin Wheeler
School
Native American
Year
Better
Than
District
91.3%
28.3%
DistrictSchool
0%
2011 CRCT
School
Student Demographics
Better
than
District
Better
than
District
Academic Achievements
8.7%
Dr. John D. Barge, State School Superintendent
Page 48 of 242

Block No Multi-age grouping No Career Academy No
Shortened Day No Student/teacher teams No International Baccalaureate Program No
Extended Day No Grades subdivided into houses No Pre-K No
Extended Week No Students remain with teacher 2+ years No After School Programs Yes
Extended Year No Single gender classes No Community Service No
•
•
•
Goal 1:
Goal 2:
Target:
Goal 3:
Target:
Goal 4:
Target:
Met. 99% of 3rd graders passed.
Clairemont Elementary School
Met Goal
155 Erie Ave
Met Goal
Met. 71% of 3rd graders exceeded.
Classroom Arrangements
What makes Clairemont Elementary School Unique?
Met Goal
All students will meet academic standards by 2013-14.
404.370.4450Decatur, GA 30030-1861
Met Goal
Academic Goals
By year 3, 96% of 3rd graders will pass reading CRCT.
97% of our 3rd graders met standards on the reading CRCT. 73% of our 3rd graders exceeded standards on the reading CRCT.
We hosted a Saturday Math Academy for 2nd and 3rd graders struggling in math. On average 20 students met for 10 Saturdays to more
deeply work on math skills.
All students will meet academics standards by 2013-2014.
All students will meet academic standards by 2013-14.
By year 3, 60% of 3rd graders will exceed on CRCT Science.
All students will meet academic standards by 2013-14.
By year 3, 41% of 3rd graders will exceed reading CRCT.
Clairemont is one of 17 Expeditionary Learning Mentor Schools. Other EL school leaders will travel to Clairemont to learn. Two of our CL
staff were chosen to present at the National Expeditionary Learning Conference. Clairemont was the 2010-2011 Georgia profile school for the
Safe Routes to School program.
Unique Accomplishments
2010-11 Results: Met. 69% of 3rd graders exceeded.
Met/Did Not Meet:
2010-11 Results:
Met/Did Not Meet:
By year 3, 38% of 3rd graders will exceed on CRCT Math.
2010-11 Results: Met. 63% of 3rd graders exceeded.
Met/Did Not Meet:
2010-11 Results:
Met/Did Not Meet:
Target:
Scheduling Instructional Type/Services Offered
Dr. John D. Barge, State School Superintendent
Page 49 of 242

155 Erie Ave
Clairemont Elementary School
5 Year History of CRCT and Student Attendance
Decatur, GA 30030-1861
404.370.4450
65.0%
70.0%
75.0%
80.0%
85.0%
90.0%
95.0%
100.0%
2007 2008 2009 2010 2011
CRCT: Mathematics (Percent Passing)
Clairemont Elementary School
Decatur City
State of Georgia
65.0%
70.0%
75.0%
80.0%
85.0%
90.0%
95.0%
100.0%
2007 2008 2009 2010 2011
CRCT: Reading (Percent Passing)
Clairemont Elementary School
Decatur City
State of Georgia
65.0%
70.0%
75.0%
80.0%
85.0%
90.0%
95.0%
100.0%
2007 2008 2009 2010 2011
CRCT: English Language Arts (Percent Passing)
Clairemont Elementary School
Decatur City
State of Georgia
65.0%
70.0%
75.0%
80.0%
85.0%
90.0%
95.0%
100.0%
2007 2008 2009 2010 2011
CRCT: Science (Percent Passing)
Clairemont Elementary School
Decatur City
State of Georgia
65.0%
70.0%
75.0%
80.0%
85.0%
90.0%
95.0%
100.0%
2007 2008 2009 2010 2011
CRCT: Social Studies (Percent Passing)
Clairemont Elementary School
Decatur City
State of Georgia
65.0%
70.0%
75.0%
80.0%
85.0%
90.0%
95.0%
100.0%
2007 2008 2009 2010 2011
Percent of Students Missing Less than 15 Days of School
Clairemont Elementary School
Decatur City
State of Georgia
Dr. John D. Barge, State School Superintendent
Page 50 of 242

Teachers
Administrators
Support Staff
Teacher Attrition Rate
Principal
School Board Chair
Asian Black Hispanic White Multi LEP SWD F/R Lunch
School 1% 33% 5% 55% 6% 3% 13% 29%
District 2% 32% 4% 57% 5% 2% 11% 24%
Does Not
Meet5.9% 3.3% No 8.3% No 11.5% 10.2% No
Meets 42.0% 44.7% No 42.2% No 32.2% 37.5% No
Meets +
Exceeds94.1% 96.7% No 91.7% No 88.5% 89.8% No
2011 Met Met Equal 2011 3.5% 4.6% Yes
2010 Met Met Equal 2010 0.0% 4.3% Yes
2009 Met Met Equal 2009 2.7% 6.4% Yes
2008 Met Did Not Meet Yes 2008 4.0% 6.3% Yes
2007 Met Met Equal 2007 3.0% 5.1% Yes
Charter Initially Approved Dianna Herron-Watson
DistrictSchool
0%
2011 CRCT
School
Student Demographics
Better
than
District
Better
than
District
Academic Achievements
8.4%
Year
Better
Than
District
91.6%
35.6%
6/12/2008
6/30/2013
Decatur City 30.59
4.25415
18%
Key Facts Personnel
Instructional Days
4.5K-5
176
Mission Statement
The 4/5 Academy is a caring community that: connects new knowledge with prior experience, creates a deeper understanding of the world in which we live, commits to compassionate
relationships and meaningful service.
Year
Adequate Yearly Progress Percent Absent > 15 Days
School District
School
Native American
0%
Better
Than
District
Math Science
Glennwood Academy440 East Ponce De Leon Avenue
Decatur, GA 30030
404.370.4435
School
ELA / Reading
Grades
Enrollment
Charter System
District
Better
than
District
District
Andrea Berry
District
Current Charter End
Dr. John D. Barge, State School Superintendent
Page 51 of 242

Block No Multi-age grouping No Career Academy No
Shortened Day No Student/teacher teams No International Baccalaureate Program Yes
Extended Day No Grades subdivided into houses No Pre-K No
Extended Week No Students remain with teacher 2+ years Yes After School Programs Yes
Extended Year No Single gender classes No Community Service No
•
•
•
Goal 1:
Goal 2:
Target:
Goal 3:
Target:
Goal 4:
Target:
Scheduling Instructional Type/Services Offered
2010-11 Results: Met. In 2010-2011, 56% of 5th graders exceeded.
Met/Did Not Meet:
2010-11 Results:
Met/Did Not Meet:
Target:
By year 3, 86% of 4th graders will pass CRCT Math.
The 4/5 Academy at 5th Avenue opened on time and under budget. The transition of personnel and materials to the new building was virtually
flawless.
2010-11 Results: Met. In 2010-11, 94% of 5th graders passed.
Met/Did Not Meet:
2010-11 Results:
Met/Did Not Meet:
By year 3, 36% of 5th graders will exceed on CRCT Math.
Academic Goals
By year 3, 50% of 4th graders will exceed on reading CRCT.
All students will meet academic standards by 2013-14.
By year 3, 94% of 5th graders will pass CRCT Reading.
All students will meet academic standards by 2013-2014.
All students will meet academic standards by 2013-2014.
404.370.4435
Unique Accomplishments
Met Goal
Decatur, GA 30030
Met Goal
440 East Ponce De Leon Avenue
Met Goal
Met. In 2010-2011, 89% of 4th graders passed.
Classroom Arrangements
What makes Glennwood Academy Unique?
Met Goal
Glennwood Academy
4th and 5th grade students were in the top 10 ranking on CRCT in Reading and Math. On MAP 56% of all students exceeded grade level
expectations.
N/A
All students will meet academic standards by 2013-2014.
Met. In 2010-2011, 62% of 4th graders exceeded.
Dr. John D. Barge, State School Superintendent
Page 52 of 242

5 Year History of CRCT and Student Attendance
Decatur, GA 30030
404.370.4435
Glennwood Academy440 East Ponce De Leon Avenue
65.0%
70.0%
75.0%
80.0%
85.0%
90.0%
95.0%
100.0%
2007 2008 2009 2010 2011
CRCT: Mathematics (Percent Passing)
Glennwood Academy
Decatur City
State of Georgia
65.0%
70.0%
75.0%
80.0%
85.0%
90.0%
95.0%
100.0%
2007 2008 2009 2010 2011
CRCT: Reading (Percent Passing)
Glennwood Academy
Decatur City
State of Georgia
65.0%
70.0%
75.0%
80.0%
85.0%
90.0%
95.0%
100.0%
2007 2008 2009 2010 2011
CRCT: English Language Arts (Percent Passing)
Glennwood Academy
Decatur City
State of Georgia
65.0%
70.0%
75.0%
80.0%
85.0%
90.0%
95.0%
100.0%
2007 2008 2009 2010 2011
CRCT: Science (Percent Passing)
Glennwood Academy
Decatur City
State of Georgia
65.0%
70.0%
75.0%
80.0%
85.0%
90.0%
95.0%
100.0%
2007 2008 2009 2010 2011
CRCT: Social Studies (Percent Passing)
Glennwood Academy
Decatur City
State of Georgia
65.0%
70.0%
75.0%
80.0%
85.0%
90.0%
95.0%
100.0%
2007 2008 2009 2010 2011
Percent of Students Missing Less than 15 Days of School
Glennwood Academy
Decatur City
State of Georgia
Dr. John D. Barge, State School Superintendent
Page 53 of 242

Teachers
Administrators
Support Staff
Teacher Attrition Rate
Principal
School Board Chair
Asian Black Hispanic White Multi LEP SWD F/R Lunch
School 2% 24% 5% 65% 4% 0% 10% 16%
District 2% 32% 4% 57% 5% 2% 11% 24%
Does Not
Meet3.6% 3.3% No 8.3% No 8.8% 10.2% Yes
Meets 52.8% 44.7% Yes 42.2% Yes 35.1% 37.5% No
Meets +
Exceeds96.4% 96.7% No 91.7% No 91.2% 89.8% Yes
2011 Met Met Equal 2011 2.8% 4.6% Yes
2010 Met Met Equal 2010 0.0% 4.3% Yes
2009 Met Met Equal 2009 2.8% 6.4% Yes
2008 Met Did Not Meet Yes 2008 5.5% 6.3% Yes
2007 Met Met Equal 2007 2.4% 5.1% Yes
District
Better
than
District
District
Oakhurst Elementary School175 Mead Rd
Decatur, GA 30030-3622
404.370.4470
School
ELA / Reading
Grades
Enrollment
Charter System
0%
Better
Than
District
Math Science
Adequate Yearly Progress Percent Absent > 15 Days
School District
Mission Statement
Oakhurst Elementary challenges every student to succeed by providing a rigorous, engaging and authentic learning experience delivered by highly qualified, caring adults in a safe
environment. Oakhurst will be recognized as an exemplar elementary school in the Expeditionary Learning Network of Schools.
Year
Key Facts Personnel
Instructional Days
2.3K-5
176
6/12/2008
6/30/2013
Charter Initially Approved
Current Charter End
District
Decatur City 25.44
2346
18%
N/A
Mary Mack
School
Native American
Year
Better
Than
District
87.3%
50.9%
DistrictSchool
0%
2011 CRCT
School
Student Demographics
Better
than
District
Better
than
District
Academic Achievements
12.7%
Dr. John D. Barge, State School Superintendent
Page 54 of 242

Block No Multi-age grouping No Career Academy No
Shortened Day No Student/teacher teams No International Baccalaureate Program No
Extended Day No Grades subdivided into houses No Pre-K No
Extended Week No Students remain with teacher 2+ years No After School Programs Yes
Extended Year No Single gender classes No Community Service No
•
•
•
Goal 1:
Goal 2:
Target:
Goal 3:
Target:
Goal 4:
Target:
Met. 51% of 3rd graders exceeded.
Oakhurst Elementary School
Met Goal
175 Mead Rd
Met Goal
Met. 95% of 3rd graders passed ELA CRCT.
Classroom Arrangements
What makes Oakhurst Elementary School Unique?
Met Goal
All students will meet academic standards by 2013-2014.
404.370.4470
Decatur, GA 30030-3622
Met Goal
Academic Goals
By year 3, 43% of 3rd graders will exceed CRCT Reading.
Met AYP with 97% of 3rd graders meeting or exceeding expectations in Reading.
Expansion with Farm To School (by adding a Farm To School Book Week) and Oakhurst Community Garden.
All students will meet academic standards by 2013-2014.
All students will meet academic standards by 2013-2014.
By year 3, 42% of 3rd graders will exceed CRCT Science.
All students will meet academic standards by 2013-2014.
By year 3, 94% or 3rd graders will pass CRCT ELA.
Use of the Yearly implementation Review from Expeditionary Learning to improve instructional framework and professional learning. Review
and approval of the School Improvement Plan developed by staff. Assisted with the school system accreditation based on the charter
application. Professional Learning in the area of Formative Assessment in the utilization of data to make instructional adjustments for all
learners.
Unique Accomplishments
2010-11 Results: Met. 56% of 3rd graders exceeded.
Met/Did Not Meet:
2010-11 Results:
Met/Did Not Meet:
By year 3, 34% of 3rd graders will exceed CRCT Math.
2010-11 Results: Met. 36% of 3rd graders exceeded.
Met/Did Not Meet:
2010-11 Results:
Met/Did Not Meet:
Target:
Scheduling Instructional Type/Services Offered
Dr. John D. Barge, State School Superintendent
Page 55 of 242

175 Mead Rd
Oakhurst Elementary School
5 Year History of CRCT and Student Attendance
Decatur, GA 30030-3622
404.370.4470
65.0%
70.0%
75.0%
80.0%
85.0%
90.0%
95.0%
100.0%
2007 2008 2009 2010 2011
CRCT: Mathematics (Percent Passing)
Oakhurst Elementary School
Decatur City
State of Georgia
65.0%
70.0%
75.0%
80.0%
85.0%
90.0%
95.0%
100.0%
2007 2008 2009 2010 2011
CRCT: Reading (Percent Passing)
Oakhurst Elementary School
Decatur City
State of Georgia
65.0%
70.0%
75.0%
80.0%
85.0%
90.0%
95.0%
100.0%
2007 2008 2009 2010 2011
CRCT: English Language Arts (Percent Passing)
Oakhurst Elementary School
Decatur City
State of Georgia
65.0%
70.0%
75.0%
80.0%
85.0%
90.0%
95.0%
100.0%
2007 2008 2009 2010 2011
CRCT: Science (Percent Passing)
Oakhurst Elementary School
Decatur City
State of Georgia
65.0%
70.0%
75.0%
80.0%
85.0%
90.0%
95.0%
100.0%
2007 2008 2009 2010 2011
CRCT: Social Studies (Percent Passing)
Oakhurst Elementary School
Decatur City
State of Georgia
65.0%
70.0%
75.0%
80.0%
85.0%
90.0%
95.0%
100.0%
2007 2008 2009 2010 2011
Percent of Students Missing Less than 15 Days of School
Oakhurst Elementary School
Decatur City
State of Georgia
Dr. John D. Barge, State School Superintendent
Page 56 of 242

Teachers
Administrators
Support Staff
Teacher Attrition Rate
Principal
School Board Chair
Asian Black Hispanic White Multi LEP SWD F/ R Lunch
School 2% 35% 3% 54% 5% 2% 14% 29%
District 2% 32% 4% 57% 5% 2% 11% 24%
Does Not
Meet1.7% 3.3% Yes 8.3% Yes 10.3% 10.2% No
Meets 46.6% 44.7% Yes 42.2% Yes 44.5% 37.5% Yes
Meets +
Exceeds98.3% 96.7% Yes 91.7% Yes 89.7% 89.8% No
2011 Met Met Equal 2011 2.5% 4.6% Yes
2010 Met Met Equal 2010 3.5% 4.3% Yes
2009 Met Met Equal 2009 5.0% 6.4% Yes
2008 Met Did Not Meet Yes 2008 2.8% 6.3% Yes
2007 Met Met Equal 2007 3.5% 5.1% Yes
0%
2011 CRCT
School
Student Demographics
Better
than
District
Better
than
District
Academic Achievements
Decatur City 47.55
3.25655
8%
Peg Bumgardner
Derrick Thomas
4.56-8
176
6/12/2008
6/30/2013
Charter Initially Approved
Mission Statement
We work together to develop curious, self-directed learners who engage in a rigorous and purposeful interdisciplinary curriculum. By participating in inquiry, colloboration, the passionate
exchange of ideas, and self-relfection, we grow into responsible and productive citizens of the world.
Year
Key Facts Personnel
Instructional Days
Adequate Yearly Progress Percent Absent > 15 Days
School District
Better
Than
District
0%
Better
Than
District
Math Science
93.3%
48.9%
Grades
Enrollment
Current Charter End
Charter System
School
Native American
District
Renfroe Middle School220 W College Ave
Decatur, GA 30030-5232
404.370.4440
School
ELA / Reading
District
Better
than
District
District District
School
6.7%
Year
Dr. John D. Barge, State School Superintendent
Page 57 of 242

Block No Multi-age grouping No Career Academy No
Shortened Day No Student/teacher teams No International Baccalaureate Program Yes
Extended Day No Grades subdivided into houses No Pre-K No
Extended Week No Students remain with teacher 2+ years No After School Programs Yes
Extended Year No Single gender classes No Community Service No
•
•
•
Goal 1:
Goal 2:
Target:
Goal 3:
Target:
Goal 4:
Target:
2010-11 Results:
Met/Did Not Meet:
Target:
Met/Did Not Meet:
2010-11 Results:
Met/Did Not Meet:
By year 3, RMS will have 23% of 7th graders exceed Reading CRCT.
2010-11 Results: Met. In 2010-2011, 45% of 7th graders exceeded.
Met Goal
Met/Did Not Meet:
All students will meet academic standards by 2013-2014.
By year 3, RMS will have 88% of 7th graders pass Math CRCT.
2010-11 Results: Met. In 2010-2011, 97% of 7th graders passed.
Academic Goals
By year 3, RMS will have 45% of 6th graders exceed Reading CRCT.
Scheduling Instructional Type/Services Offered
All students will meet academic standards by 2013-2014.
404.370.4440
Unique Accomplishments
Met Goal
By year 3, RMS will have 90% of 6th graders exceed ELA CRCT.
Renfroe Middle School became a fully authorized International Baccalaureate School. We successfully launched IB/Standards Based Grading
pilot.
Decatur, GA 30030-5232
Classroom Arrangements
What makes Renfroe Middle School Unique?
All students will meet academic standards by 2013-2014.
We were named Georgia Title 1 Distinguished School for the 7th year in a row. 98% of all students passed Reading CRCT. 79.8% of
Students with Disabilities met or exceeded standards on the Georgia Criterion Reference Competency Test (CRCT) in Math.
We received a commendation from the City of Decatur for our role in the Decatur Youth Wellness Project. We launched our own Safe Routes
to School program through the City of Decatur to encourage walking and biking safely to school.
All students will meet academic standards by 2013-2014.
Met. In 2010-2011, 56% of 6th graders exceeded.
Renfroe Middle School
Met Goal
220 W College Ave
Met Goal
Met. In 2010-2011, 97% of 6th graders met or exceeded.
Dr. John D. Barge, State School Superintendent
Page 58 of 242

5 Year History of CRCT and Student Attendance
Decatur, GA 30030-5232
404.370.4440
Renfroe Middle School220 W College Ave
65.0%
70.0%
75.0%
80.0%
85.0%
90.0%
95.0%
100.0%
2007 2008 2009 2010 2011
CRCT: Mathematics (Percent Passing)
Renfroe Middle School
Decatur City
State of Georgia
65.0%
70.0%
75.0%
80.0%
85.0%
90.0%
95.0%
100.0%
2007 2008 2009 2010 2011
CRCT: Reading (Percent Passing)
Renfroe Middle School
Decatur City
State of Georgia
65.0%
70.0%
75.0%
80.0%
85.0%
90.0%
95.0%
100.0%
2007 2008 2009 2010 2011
CRCT: English Language Arts (Percent Passing)
Renfroe Middle School
Decatur City
State of Georgia
65.0%
70.0%
75.0%
80.0%
85.0%
90.0%
95.0%
100.0%
2007 2008 2009 2010 2011
CRCT: Science (Percent Passing)
Renfroe Middle School
Decatur City
State of Georgia
60.0%
65.0%
70.0%
75.0%
80.0%
85.0%
90.0%
95.0%
100.0%
2007 2008 2009 2010 2011
CRCT: Social Studies (Percent Passing)
Renfroe Middle School
Decatur City
State of Georgia
65.0%
70.0%
75.0%
80.0%
85.0%
90.0%
95.0%
100.0%
2007 2008 2009 2010 2011
Percent of Students Missing Less than 15 Days of School
Renfroe Middle School
Decatur City
State of Georgia
Dr. John D. Barge, State School Superintendent
Page 59 of 242

Teachers
Administrators
Support Staff
Teacher Attrition Rate
Principal
School Board Chair
Asian Black Hispanic White Multi LEP SWD F/R Lunch
School 4% 22% 7% 61% 6% 8% 8% 18%
District 2% 32% 4% 57% 5% 2% 11% 24%
Does Not
Meet3.7% 3.3% No 8.3% No 8.5% 10.2% Yes
Meets 42.0% 44.7% No 42.2% No 26.8% 37.5% No
Meets +
Exceeds96.3% 96.7% No 91.7% No 91.5% 89.8% Yes
2011 Met Met Equal 2011 4.2% 4.6% Yes
2010 Met Met Equal 2010 0.0% 4.3% Yes
2009 Met Met Equal 2009 4.7% 6.4% Yes
2008 Met Did Not Meet Yes 2008 6.5% 6.3% No
2007 Met Met Equal 2007 5.9% 5.1% No
District
Better
than
District
District
District
Winnona Park Elementary School510 Avery St
Decatur, GA 30030-3809
404.370.4490
School
ELA / Reading
Grades
Enrollment
Current Charter End
Charter System
School
Native American
0%
Better
Than
District
Math Science
Adequate Yearly Progress Percent Absent > 15 Days
School District
Mission Statement
The mission of Winnona Park Elementary School is to become an exemplar primary grades center for expeditionary learning, literally and professional learning. Students, staff and
community will nurture an environment that strives for intellectual success, social responsibility and strong character.
Year
Key Facts Personnel
Instructional Days
2.85K-5
176
6/12/2008
6/30/2013
Charter Initially Approved
Decatur City 29.03
2384
0%
N/A
Greg Wiseman
Better
Than
District
82.7%
33.3%
District
School
0%
2011 CRCT
School
Student Demographics
Better
than
District
Better
than
District
Academic Achievements
17.3%
Year
Dr. John D. Barge, State School Superintendent
Page 60 of 242

Block No Multi-age grouping No Career Academy No
Shortened Day No Student/teacher teams No International Baccalaureate Program No
Extended Day No Grades subdivided into houses No Pre-K No
Extended Week No Students remain with teacher 2+ years Yes After School Programs Yes
Extended Year No Single gender classes No Community Service No
•
•
•
Goal 1:
Goal 2:
Target:
Goal 3:
Target:
Goal 4:
Target:
Winnona Park earned a Platinum Award by the Governor's Office of Student Achievement. Winnona Park was only 1 of 46 schools that
earned this award for greatest gains on the CRCT.
N/A
All students will meet academics standards by 2013-14.
Met. 96% of 3rd graders passed.
Winnona Park Elementary School
Met Goal
510 Avery St
Met Goal
Met. 94% of 3rd graders passed.
Classroom Arrangements
What makes Winnona Park Elementary School Unique?
All students will meet academic standards by 2013-14.
By year 3, 93% of Winnona Park 3rd graders will pass ELA CRCT.
Winnona Park met requirements established by AdvancED Accreditation Commission on 01/04/11.
Decatur, GA 30030-3809
All students will meet academic standards by 2013-14.
404.370.4490
Unique Accomplishments
Met Goal
Academic Goals
By year 3, 94% of Winnona Park 3rd graders will pass Reading CRCT.
All students will meet academics standards by 2013-14.
By year 3, 53% of 3rd graders will exceed Science CRCT.
2010-11 Results: Met. In 2010-11, 65% of 3rd graders exceeded.
Met/Did Not Meet:
2010-11 Results:
Met/Did Not Meet:
By year 3, 34% of 3rd graders will exceed Math CRCT.
2010-11 Results: Met. In 2010-11, 49% of 3rd graders exceeded.
Met Goal
Met/Did Not Meet:
2010-11 Results:
Met/Did Not Meet:
Target:
Scheduling Instructional Type/Services Offered
Dr. John D. Barge, State School Superintendent
Page 61 of 242

510 Avery St
5 Year History of CRCT and Student Attendance
Decatur, GA 30030-3809
404.370.4490
Winnona Park Elementary School
65.0%
70.0%
75.0%
80.0%
85.0%
90.0%
95.0%
100.0%
2007 2008 2009 2010 2011
CRCT: Mathematics (Percent Passing)
Winnona Park Elementary School
Decatur City
State of Georgia
65.0%
70.0%
75.0%
80.0%
85.0%
90.0%
95.0%
100.0%
2007 2008 2009 2010 2011
CRCT: Reading (Percent Passing)
Winnona Park Elementary School
Decatur City
State of Georgia
65.0%
70.0%
75.0%
80.0%
85.0%
90.0%
95.0%
100.0%
2007 2008 2009 2010 2011
CRCT: English Language Arts (Percent Passing)Winnona Park Elementary School
Decatur City
State of Georgia
65.0%
70.0%
75.0%
80.0%
85.0%
90.0%
95.0%
100.0%
2007 2008 2009 2010 2011
CRCT: Science (Percent Passing)
Winnona Park Elementary School
Decatur City
State of Georgia
65.0%
70.0%
75.0%
80.0%
85.0%
90.0%
95.0%
100.0%
2007 2008 2009 2010 2011
CRCT: Social Studies (Percent Passing)
Winnona Park Elementary School
Decatur City
State of Georgia
65.0%
70.0%
75.0%
80.0%
85.0%
90.0%
95.0%
100.0%
2007 2008 2009 2010 2011
Percent of Students Missing Less Than 15 Days of School
Winnona Park Elementary School
Decatur City
State of Georgia
Dr. John D. Barge, State School Superintendent
Page 62 of 242

Teachers
Administrators
Support Staff
Teacher Attrition Rate
Principal
School Board Chair
Asian Black Hispanic White Multi LEP SWD F/R Lunch
School 2% 41% 3% 51% 4% 1% 11% 27%
District 2% 32% 4% 57% 5% 2% 11% 24%
Does Not
Meet1.7% 1.7% Equal 6.1% Equal 0.6% 0.6% Equal
Meets 30.2% 30.2% Equal 42.2% Equal 31.5% 31.5% Equal
Meets +
Exceeds98.3% 98.3% Equal 93.9% Equal 99.4% 99.4% Equal
2011 Met Met Equal 2011 88.4% 88.4% Equal
2010 Met Met Equal 2010 88.7% 88.7% Equal
2009 Met Met Equal 2009 88.1% 88.1% Equal
2008 Did Not Meet Did Not Meet Equal 2008 81.6% 81.6% Equal
2007 Met Met Equal 2007 89.3% 89.3% Equal
42.2%
Charter Initially Approved Lauri L McKain-Fernandez
DistrictSchool
0%
2011 GHSGT
Susi Strickland
Academic Achievements
6.1%
Year
Better
Than
District
School
Student Demographics
Better
than
District
Better
than
District
6.75K-5
176
6/12/2008
6/30/2013
Decatur City 56.94
5.5756
7%
Mission Statement
At Decatur High School, we believe that intercultural understanding provides the foundation for a peaceful world. By providing a safe, compassionate
school community where students and staff value diversity and demonstrate respect for themselves and others, we strive to create caring, service-oriented
individuals who contribute meaningfully to the larger global community. To this end, we work together to develop curious, self-directed learners who engage
in a rigorous and purposeful interdisciplinary curriculum. By participating in inquiry, collaboration, the passionate exchange of ideas, and self-reflection, we
grow into responsible and productive citizens of the world.
Year
Key Facts Personnel
Instructional Days
Adequate Yearly Progress Graduation Rate
School District
Charter System
School
Native American
0%
Better
Than
District
Math Science
District
Decatur High School310 N McDonough St
Decatur, GA 30030-3339
404.370.4420
School
ELA
Grades
Enrollment
District
Better
than
District
District
93.9%
Current Charter End
Dr. John D. Barge, State School Superintendent
Page 63 of 242

Block Yes Multi-age grouping Yes Career Academy Yes
Shortened Day No Student/teacher teams No International Baccalaureate Program Yes
Extended Day No Grades subdivided into houses No Pre-K No
Extended Week No Students remain with teacher 2+ years No After School Programs No
Extended Year No Single gender classes No Community Service No
•
•
•
Goal 1:
Goal 2:
Target:
Goal 3:
Target:
Goal 4:
Target:
404.370.4420
2010-11 Results:
Met/Did Not Meet:
Target:
2010-11 Results: Met. In 2010-11, 30% of DHS students achieved honors.
Met/Did Not Meet:
2010-11 Results:
Met/Did Not Meet:
By year 3, 30% of DHS students will achieve honors on GHSGT Social Studies.
2010-11 Results: Met. In 2010-11, 36% of DHS students achieved honors.
Met/Did Not Meet:
All students will meet academic standards by 2013-14.
By year 3, 27% of DHS students will achieve honors on GHSGT Science.
All students will meet academic standards by 2013-14.
All students will meet academic standards by 2013-14.
By year 3, 95% of DHS students will pass GHSGT ELA.
Met Goal
Met. In 2010-11, 96% of DHS students passed.
Unique Accomplishments
Met Goal
Decatur, GA 30030-3339
Classroom Arrangements
What makes Decatur High School Unique?
By year 3, 94% of DHS students will pass GHSGT Science.
DHS opened the Decatur Career Academy.
Academic Goals
Scheduling Instructional Type/Services Offered
DHS named an Office of Student Achievement Gold School. DHS was named an AP Honor School by the Georgia DOE. DHS was included in
Washington Post's Challenge Index (9th in GA).
DHS was authorized as an IB World School, offering the Middle Years Programme. DHS was approved as an IB Diploma Programme
Candidate School.
All students will meet academic standards by 2013-14.
Met. In 2010-11, 99% of DHS students passed.
Decatur High School
Met Goal
310 N McDonough St
Met Goal
Dr. John D. Barge, State School Superintendent
Page 64 of 242

5 Year History of GHSGT and Graduation Rate
Decatur, GA 30030-3339
404.370.4420
Decatur High School310 N McDonough St
65.0%
70.0%
75.0%
80.0%
85.0%
90.0%
95.0%
100.0%
2007 2008 2009 2010 2011
GHSGT: Mathematics (Percent Passing)
Decatur High School
Decatur City
State of Georgia
65.0%
70.0%
75.0%
80.0%
85.0%
90.0%
95.0%
100.0%
2007 2008 2009 2010 2011
GHSGT: English Language Arts (Percent Passing)
Decatur High School
Decatur City
State of Georgia
65.0%
70.0%
75.0%
80.0%
85.0%
90.0%
95.0%
100.0%
2007 2008 2009 2010 2011
GHSGT: Science (Percent Passing)
Decatur High School
Decatur City
State of Georgia
65.0%
70.0%
75.0%
80.0%
85.0%
90.0%
95.0%
100.0%
2007 2008 2009 2010 2011
GHSGT: Social Studies (Percent Passing)
Decatur High School
Decatur City
State of Georgia
65.00%
70.00%
75.00%
80.00%
85.00%
90.00%
95.00%
100.00%
2007 2008 2009 2010 2011
Graduation Rate
Decatur High School
Decatur City
State of Georgia
Dr. John D. Barge, State School Superintendent
Page 65 of 242

Elementary
Charter Term Middle
High School
Total Schools
2007 2008 2009 2010 2011
Yes No No No No
2011 8.0% 8.8% Yes 2011 78.4% 80.9% No
2010 10.6% 9.7% No 2010 81.0% 80.8% Yes
2009 9.6% 8.7% No 2009 78.1% 78.9% No
2008 9.9% 9.5% No 2008 78.1% 75.4% Yes
2007 8.8% 10.0% Yes 2007 73.1% 72.3% Yes
5.4% 7.9% Yes 9.0% 8.3% No
62.1% 56.1% Yes 38.6% 37.0% Yes
94.6% 92.1% Yes 91.1% 91.7% No
12.0% 15.3% Yes 11.7% 15.5% Yes
59.0% 50.7% Yes 42.3% 37.5% Yes
88.0% 84.7% Yes 88.3% 84.5% Yes
Better than
State
State
Does Not Meet
Does Not Meet
Meets
600 Riverside Parkway NE
Rome, GA 30161
706.234.1031
Better
Than State
Number of Schools
Better than
State
Year System StateYear System
ELA / Reading
Meets
Percent Absent > 15 Days
Better
Than State
ELA
Meets + Exceeds
State
Meets
4
Better
than State
Meets
State
Math
System
System
2011 GHSGT
Academic Achievements
2011 CRCT
StateSystem
Charter End
System
Meets + Exceeds
Math
Graduation Rate
Does Not Meet
Floyd County Schools
Adequate Yearly Progress
Meets + Exceeds Meets + Exceeds
State
Does Not Meet
Better
than State
Key Facts
8/10/2010
5
5/10/2010
6/30/2015
11Opened
Charter Approved
19
4
Dr. John D. Barge, State School Superintendent
Page 66 of 242

Asian Black Hispanic White Multi LEP SWD F/ R Lunch
System 0.9% 5.9% 8.3% 81.8% 3.0% 3.7% 17.2% 58.1%
State 3.0% 37.0% 12.0% 44.0% 3.0% 6.0% 10.0% 57.0%
1)
2)
3)
4)
5)
2007 2008 2009 2010 2011
Yes Yes Yes Yes Yes
No No No No No
Yes Yes Yes Yes Yes
Yes Yes Yes Yes Yes
Yes Yes Yes Yes Yes
Yes Yes Yes Yes Yes
Yes Yes Yes Yes Yes
Yes Yes Yes Yes Yes
Yes Yes Yes Yes Yes
Yes Yes Yes Yes Yes
Yes Yes Yes Yes Yes
Yes Yes Yes Yes Yes
Yes Yes Yes Yes Yes
Yes Yes Yes Yes Yes
Yes Yes Yes Yes Yes
Yes Yes Yes Yes Yes
Yes Yes Yes Yes Yes
Yes Yes Yes Yes Yes
Yes Yes Yes Yes Yes
Charter System Strategic Goals:
Charter System Schools
Armuchee High School
Glenwood Primary School
Alto Park Elementary School
Garden Lakes Elementary School
Midway Primary
Cave Spring Elementary School
Improve student achievement through effective instructional programs.
Pepperell Primary
McHenry Primary
Armuchee Elementary School
Armuchee Middle School
Model Elementary School
Floyd County Schools 600 Riverside Parkway NE
Rome, GA 30161
706.234.1031
Provide highly qualified staff to support all system programs.
Provide a safe and orderly environment that fosters effective instructional programs.
Provide funding that will allow students to maximize their potential.
Provide effective and efficient communication with and for all stakeholders.
Pepperell High School
Coosa High School
Model High School
Model Middle School
Pepperell Middle School
Johnson Elementary
Coosa Middle School
0.0%
Student Demographics
Pepperell Elementary
Charter System Schools Adequate Yearly Progress
Native American
0.1%
Dr. John D. Barge, State School Superintendent
Page 67 of 242

Floyd County Schools 600 Riverside Parkway NE
Rome, GA 30161
706.234.1031
5 Year History CRCT
65.0%
70.0%
75.0%
80.0%
85.0%
90.0%
95.0%
100.0%
2007 2008 2009 2010 2011
CRCT: Math(Percent Passing)
Floyd County Schools
State of Georgia
65.0%
70.0%
75.0%
80.0%
85.0%
90.0%
95.0%
100.0%
2007 2008 2009 2010 2011
CRCT: Reading/ELA(Percent Passing)
Floyd County Schools
State of Georgia
65.0%
70.0%
75.0%
80.0%
85.0%
90.0%
95.0%
100.0%
2007 2008 2009 2010 2011
CRCT: Social Studies(Percent Passing)
Floyd County Schools
State of Georgia
65.0%
70.0%
75.0%
80.0%
85.0%
90.0%
95.0%
100.0%
2007 2008 2009 2010 2011
CRCT: Science(Percent Passing)
Floyd County Schools
State of Georgia
Dr. John D. Barge, State School Superintendent
Page 68 of 242

600 Riverside Parkway NE
Rome, GA 30161
706.234.1031
5 Year History GHSGT and Graduation Rate
Floyd County Schools
65.0%
70.0%
75.0%
80.0%
85.0%
90.0%
95.0%
100.0%
2007 2008 2009 2010 2011
GHSGT: English Language Arts(Percent Passing)
Floyd County Schools
State of Georgia
65.0%
70.0%
75.0%
80.0%
85.0%
90.0%
95.0%
100.0%
2007 2008 2009 2010 2011
GHSGT: Math(Percent Passing)
Floyd County Schools
State of Georgia
65.0%
70.0%
75.0%
80.0%
85.0%
90.0%
95.0%
100.0%
2007 2008 2009 2010 2011
GHSGT: Science(Percent Passing)
Floyd County Schools
State of Georgia
65.0%
70.0%
75.0%
80.0%
85.0%
90.0%
95.0%
100.0%
2007 2008 2009 2010 2011
GHSGT: Social Studies(Percent Passing)
Floyd County Schools
State of Georgia
65.0%
70.0%
75.0%
80.0%
85.0%
90.0%
95.0%
100.0%
2007 2008 2009 2010 2011
High School Graduation Rate
Floyd County Schools
State of Georgia
Dr. John D. Barge, State School Superintendent
Page 69 of 242

Teachers
Administrators
Support Staff
Teacher Attrition Rate
Principal
School Board Chair
Asian Black Hispanic White Multi LEP SWD F/R Lunch
School 1% 7% 32% 57% 3% 21% 16% 76%
District 1% 6% 8% 82% 3% 4% 17% 58%
Does Not
Meet8.5% 5.4% No 12.0% Yes 25.7% 23.6% No
Meets 63.3% 62.1% Yes 59.0% Yes 53.9% 54.2% No
Meets +
Exceeds91.5% 94.6% No 88.0% Yes 74.3% 76.4% No
2011 Met Did Not Meet Yes 2011 5.0% 8.0% Yes
2010 Met Did Not Meet Yes 2010 6.4% 10.6% Yes
2009 Met Did Not Meet Yes 2009 3.5% 9.6% Yes
2008 Met Did Not Meet Yes 2008 3.5% 9.9% Yes
2007 Met Met Equal 2007 4.8% 8.8% Yes
District
Current Charter End
District
Better
than
District
District
Alto Park Elementary School528 Burnett Ferry Rd SW
Rome, GA 30165-3655
706.236.1892
School
ELA / Reading
Grades
Enrollment
Charter System
School
Native American
0%
Better
Than
District
Math Science
Adequate Yearly Progress Percent Absent > 15 Days
School District
Mission Statement
Working together to provide a strong foundation for lifelong learning.
Year
Key Facts Personnel
Instructional Days
5K-5
193
5/10/2010
6/30/2015
Floyd County 36.49
2499
0%
Charlotte Jones
Academic Achievements
10.6%
Year
Better
Than
District
89.4%
63.3%
Charter Initially Approved Aaron Anderson
DistrictSchool
0%
2011 CRCT
School
Student Demographics
Better
than
District
Better
than
District
Dr. John D. Barge, State School Superintendent
Page 70 of 242

Block Yes Multi-age grouping No Career Academy No
Shortened Day No Student/teacher teams No International Baccalaureate Program No
Extended Day Yes Grades subdivided into houses No Pre-K No
Extended Week Yes Students remain with teacher 2+ years No After School Programs Yes
Extended Year Yes Single gender classes No Community Service No
•
•
•
Goal 1:
Goal 2:
Target:
Goal 3:
Target:
Goal 4:
Target:
N/A
N/A
Increase the percent of all students (grades 3,4,5) who meet/exceed in Reading/ELA on the CRCT
Mel Goal-92.9% of student met or exceeded in Reading/ELA on the spring, 2011 CRCT
Met Goal
528 Burnett Ferry Rd SW
Met Goal
Met Goal – All subgroups surpassed 80% goal in Reading/ELA on the 2011 CRCT: Hispanic Subgroup = 90.9%, ELL Subgroup =
89.6%, Econ. Dis. Subgroup = 90.8%
Classroom Arrangements
What makes Alto Park Elementary School Unique?
Met Goal
Rome, GA 30165-3655
Increase the percent of all students (grades 3, 4, 5) who meet/exceed in Math on the CRCT
706.236.1892
Unique Accomplishments
Met Goal
Academic Goals
90% of all students
Increase the percent of students in subgroups (= to 40) who meet/exceed in Math on the CRCT
75.5% of students in the Hispanic, ELL, and Econ. Dis. Subgroups
Increase the percent of students in subgroups (= to 40) who meet/exceed in Reading/ELA on the CRCT
80% of students in the Hispanic, ELL, and Econ. Dis. Subgroups
The first Alto Park ES Local School Governance Team was established in the fall of 2010. The LSGT worked with other parent organizations
and school staff to redesign the way we plan and conduct many of our annual school activities. The role of the LSGT, in conjunction with our
PTO and Title I programming was defined. Our LSGT was also involved along the way in discussions regarding the planning and construction
of our new classroom addition which we occupied in September 2011. Also, the LSGT worked in the Spring of 2011 to provide decision
making on how FY 2012 Title I funds will be used to promote student achievement and parent involvement.
2010-11 Results:Met Goal – All subgroups surpassed 80% goal in Math on the 2011 CRCT: Hispanic Subgroup = 97%, ELL Subgroup = 97.9%,
Econ. Dis. Subgroup = 89.2%
Met/Did Not Meet:
2010-11 Results:
Met/Did Not Meet:
80% of all students
2010-11 Results: Met Goal – 90.1% of all students met or exceeded in Math on the spring, 2011 CRCT
Met/Did Not Meet:
2010-11 Results:
Met/Did Not Meet:
Target:
Scheduling Instructional Type/Services Offered
Alto Park Elementary School
Dr. John D. Barge, State School Superintendent
Page 71 of 242

5 Year History of CRCT and Student Attendance
Rome, GA 30165-3655
706.236.1892
Alto Park Elementary School
528 Burnett Ferry Rd SW
65.0%
70.0%
75.0%
80.0%
85.0%
90.0%
95.0%
100.0%
2007 2008 2009 2010 2011
CRCT: Mathematics (Percent Passing)
Alto Park Elementary School
Floyd County
State of Georgia
65.0%
70.0%
75.0%
80.0%
85.0%
90.0%
95.0%
100.0%
2007 2008 2009 2010 2011
CRCT: Reading (Percent Passing)
Alto Park Elementary School
Floyd County
State of Georgia
65.0%
70.0%
75.0%
80.0%
85.0%
90.0%
95.0%
100.0%
2007 2008 2009 2010 2011
CRCT: English Language Arts (Percent Passing)Alto Park Elementary School
Floyd County
State of Georgia
65.0%
70.0%
75.0%
80.0%
85.0%
90.0%
95.0%
100.0%
2007 2008 2009 2010 2011
CRCT: Science (Percent Passing)
Alto Park Elementary School
Floyd County
State of Georgia
55.0%
60.0%
65.0%
70.0%
75.0%
80.0%
85.0%
90.0%
95.0%
100.0%
2007 2008 2009 2010 2011
CRCT: Social Studies (Percent Passing)
Alto Park Elementary School
Floyd County
State of Georgia
65.0%
70.0%
75.0%
80.0%
85.0%
90.0%
95.0%
100.0%
2007 2008 2009 2010 2011
Student Attendance
Alto Park Elementary School
Floyd County
State of Georgia
Dr. John D. Barge, State School Superintendent
Page 72 of 242

Teachers
Administrators
Support Staff
Teacher Attrition Rate
Principal
School Board Chair
Asian Black Hispanic White Multi LEP SWD F/R Lunch
School 2% 3% 4% 88% 4% 2% 14% 42%
District 1% 6% 8% 82% 3% 4% 17% 58%
Does Not
Meet4.4% 5.4% Yes 12.0% Yes 14.8% 23.6% Yes
Meets 56.9% 62.1% No 59.0% No 49.5% 54.2% No
Meets +
Exceeds95.6% 94.6% Yes 88.0% Yes 85.2% 76.4% Yes
2011 Met Did Not Meet Yes 2011 3.9% 8.0% Yes
2010 Met Did Not Meet Yes 2010 4.6% 10.6% Yes
2009 Met Did Not Meet Yes 2009 3.0% 9.6% Yes
2008 Met Did Not Meet Yes 2008 5.0% 9.9% Yes
2007 Met Met Equal 2007 2.6% 8.8% Yes
Current Charter End
District
Better
than
District
District
Armuchee Elementary School5075 Martha Berry Hwy NW
Rome, GA 30165-8662
706.802.6758
School
ELA / Reading
Grades
Enrollment
Charter System
School
Native American
0%
Better
Than
District
Math Science
District
Adequate Yearly Progress Percent Absent > 15 Days
School District
Mission Statement
The mission of Armuchee Elementary School is to discover, to develop, and to demonstrate our highest potential as students, educators, and community.
Year
Key Facts Personnel
Instructional Days
4K-5
173
5/10/2010
6/30/2015
Floyd County 28
2488
11%
Suzette Davis
Better
than
District
Academic Achievements
10.3%
Year
Better
Than
District
89.7%
52.9%
Charter Initially Approved Rodney Stewart
DistrictSchool
0%
2011 CRCT
School
Student Demographics
Better
than
District
Dr. John D. Barge, State School Superintendent
Page 73 of 242

Block Yes Multi-age grouping No Career Academy No
Shortened Day No Student/teacher teams No International Baccalaureate Program No
Extended Day Yes Grades subdivided into houses Yes Pre-K No
Extended Week Yes Students remain with teacher 2+ years No After School Programs Yes
Extended Year Yes Single gender classes No Community Service No
•
•
•
Goal 1:
Goal 2:
Target:
Goal 3:
Target:
Goal 4:
Target:
A Local School Governance Team member raised money in the community to enable the entire staff at AES to participate in a wonderful
Team Building activity at Berry College
N/A
Increase the percent of all students (grades 3, 4, 5) who meet/exceed in Reading/ELA on the CRCT
Met Goal – 94.9% of all students met or exceeded in Reading /ELA on the spring, 2011 CRCT
Met Goal
5075 Martha Berry Hwy NW
Met Goal
Met Goal – 39.9% of all students exceeded in Reading/ELA on the spring, 2011 CRCT
Classroom Arrangements
What makes Armuchee Elementary School Unique?
Met Goal
Rome, GA 30165-8662
Unique Accomplishments
Met Goal
Armuchee Elementary School
93% of all students
Increase the involvement of all Charter School stakeholders in the school's decision-making process
Provide 4 training sessions for all Local School Governance Team members during the 2010-11 year
Increase the percent of all students (grades 3, 4, 5) who exceed in Reading/ELA on the CRCT
Increase the percent of students in subgroups (= to 40) who meet/exceed in Math on the CRCT
38% of all students will score in the exceeds category in Reading/ELA
Students With Disabilities at AES saw a 19% increase in the meets and exceeds category from the previous school year. 94% of Students
with Disabilities scored in the "meets and exceeds" category in math.
2010-11 Results: Met Goal – All LSGT members participated in the 4 training sessions provided during the 2010-11 school year
Met/Did Not Meet:
2010-11 Results:
Met/Did Not Meet:
75.7% of students in the SWD and Econ. Dis. Subgroups
Academic Goals
2010-11 Results: Met Goal - All subgroups surpassed 80% goal in Math on the 2011 CRCT: SWD = 79.7% and Econ. Dis. = 81.4%
Met/Did Not Meet:
2010-11 Results:
Met/Did Not Meet:
Target:
Scheduling Instructional Type/Services Offered
706.802.6758
Dr. John D. Barge, State School Superintendent
Page 74 of 242

5075 Martha Berry Hwy NW
5 Year History of CRCT and Student Attendance
Rome, GA 30165-8662
706.802.6758
Armuchee Elementary School
65.0%
70.0%
75.0%
80.0%
85.0%
90.0%
95.0%
100.0%
2007 2008 2009 2010 2011
CRCT: Mathematics (Percent Passing)
Armuchee Elementary School
Floyd County
State of Georgia
65.0%
70.0%
75.0%
80.0%
85.0%
90.0%
95.0%
100.0%
2007 2008 2009 2010 2011
CRCT: Reading (Percent Passing)
Armuchee Elementary School
Floyd County
State of Georgia
65.0%
70.0%
75.0%
80.0%
85.0%
90.0%
95.0%
100.0%
2007 2008 2009 2010 2011
CRCT: English Language Arts (Percent Passing)
Armuchee Elementary School
Floyd County
State of Georgia
65.0%
70.0%
75.0%
80.0%
85.0%
90.0%
95.0%
100.0%
2007 2008 2009 2010 2011
CRCT: Science (Percent Passing)
Armuchee Elementary School
Floyd County
State of Georgia
65.0%
70.0%
75.0%
80.0%
85.0%
90.0%
95.0%
100.0%
2007 2008 2009 2010 2011
CRCT: Social Studies (Percent Passing)
Armuchee Elementary School
Floyd County
State of Georgia
65.0%
70.0%
75.0%
80.0%
85.0%
90.0%
95.0%
100.0%
2007 2008 2009 2010 2011
Percent of Students Missing Less than 15 Days of School
Armuchee Elementary School
Floyd County
State of Georgia
Dr. John D. Barge, State School Superintendent
Page 75 of 242

Teachers
Administrators
Support Staff
Teacher Attrition Rate
Principal
School Board Chair
Asian Black Hispanic White Multi LEP SWD F/R Lunch
School 2% 4% 4% 86% 3% 1% 13% 36%
District 1% 6% 8% 82% 3% 4% 17% 58%
Does Not
Meet6.4% 9.0% Equal 11.7% Equal 2.8% 6.6% Equal
Meets 35.0% 38.6% No 42.3% No 25.5% 31.6% No
Meets +
Exceeds93.6% 91.1% Yes 88.3% Yes 97.2% 93.4% Yes
2011 Did Not Meet Did Not Meet Equal 2011 82.5% 78.4% Yes
2010 Did Not Meet Did Not Meet Equal 2010 77.9% 81.0% No
2009 Met Did Not Meet Yes 2009 81.2% 78.1% Yes
2008 Met Did Not Meet Yes 2008 79.4% 78.1% Yes
2007 Met Met Equal 2007 81.1% 73.1% Yes
Charter Initially Approved James Burris
DistrictSchool
0%
2011 GHSGT
School
Student Demographics
Better
than
District
Better
than
District
Academic Achievements
8.5%
Year
Better
Than
District
91.6%
28.2%
5/10/2010
6/30/2015
Floyd County 43.64
3606
N/A
Dan Hyde
Mission Statement
To constantly improve what is essential to the progress of Armuchee High School.
Year
Key Facts Personnel
173
Grades
Enrollment
Charter System
Adequate Yearly Progress Graduation Rate
School District
School
Native American
0%
Better
Than
District
Math Science
Armuchee High School4203 Martha Berry Hwy NW
Rome, GA 30165-8657
706.236.1888
School
ELA
Instructional Days
4K-5
District
Better
than
District
District District
Current Charter End
Dr. John D. Barge, State School Superintendent
Page 76 of 242

Block Yes Multi-age grouping No Career Academy Yes
Shortened Day No Student/teacher teams No International Baccalaureate Program No
Extended Day Yes Grades subdivided into houses Yes Pre-K No
Extended Week Yes Students remain with teacher 2+ years Yes After School Programs Yes
Extended Year Yes Single gender classes No Community Service Yes
•
•
•
Goal 1:
Met Goal
Goal 2:
Target:
Goal 3:
Target:
Goal 4:
Target:
Scheduling Instructional Type/Services Offered
2010-11 Results:
Met/Did Not Meet:
Target:
Met/Did Not Meet:
2010-11 Results:
Met/Did Not Meet:
Provide 4 training sessions for all Local School Governance Team members during the 2010-11 year
2010-11 Results: Met Goal – All LSGT members participated in the 4 training sessions provided during the 2010-11 school year
Met/Did Not Meet:
81.2% pass rate for all first time test takers
AHS Governance Team development of a new constitution. The constitution states as a mission: To constantly improve what is essential to
the progress of Armuchee High School. It includes value statements, establishing of committees, and a strategic planning process. We feel
that the "committees" section will strengthen community involvement, particularly because each committee must be made up of at least one
parent and one community member.
2010-11 Results: Met Goal – Members of the Armuchee Middle LSGT were present during the 4 scheduled meetings for the 2010-11 school year
Academic Goals
90.8% pass rate for all first time test takers
Increase the involvement of all Charter School stakeholders in the school's decision-making process
Conduct a minimum of 4 LSGT meetings at the school level during the 2010-11 year
Increase the pass rate of all first time test takers on the GHSGT in Math
706.236.1888
Unique Accomplishments
Rome, GA 30165-86574203 Martha Berry Hwy NW
Met Goal
Met Goal – 88.6% of all students passed the GHSGT in Math on the spring, 2011 Administration
Classroom Arrangements
What makes Armuchee High School Unique?
Met Goal
Increase the involvement of all Charter School stakeholders in the school's decision-making process
N/A
N/A
Increase the pass rate of all first time test takers on the GHSGT in English Language Arts
Met Goal - 92.8% of all students passed the GHSGT in English Language Arts on the spring, 2011 Administration
Armuchee High School
Met Goal
Dr. John D. Barge, State School Superintendent
Page 77 of 242

706.236.1888
5 Year History of GHSGT and Graduation Rate
Rome, GA 30165-8657Armuchee High School
4203 Martha Berry Hwy NW
65.0%
70.0%
75.0%
80.0%
85.0%
90.0%
95.0%
100.0%
2007 2008 2009 2010 2011
GHSGT: Mathematics (Percent Passing)
Armuchee High School
Floyd County
State of Georgia
65.0%
70.0%
75.0%
80.0%
85.0%
90.0%
95.0%
100.0%
2007 2008 2009 2010 2011
GHSGT: English Language Arts (Percent Passing)
Armuchee High School
Floyd County
State of Georgia
65.0%
70.0%
75.0%
80.0%
85.0%
90.0%
95.0%
100.0%
2007 2008 2009 2010 2011
GHSGT: Science (Percent Passing)
Armuchee High School
Floyd County
State of Georgia
65.0%
70.0%
75.0%
80.0%
85.0%
90.0%
95.0%
100.0%
2007 2008 2009 2010 2011
GHSGT: Social Studies (Percent Passing)
Armuchee High School
Floyd County
State of Georgia
65.00%
70.00%
75.00%
80.00%
85.00%
90.00%
95.00%
100.00%
2007 2008 2009 2010 2011
Graduation Rate
Armuchee High School
Floyd County
State of Georgia
Dr. John D. Barge, State School Superintendent
Page 78 of 242

Teachers
Administrators
Support Staff
Teacher Attrition Rate
Principal
School Board Chair
Asian Black Hispanic White Multi LEP SWD F/R Lunch
School 2% 1% 3% 90% 3% 1% 15% 41%
District 1% 6% 8% 82% 3% 4% 17% 58%
Does Not
Meet3.8% 5.4% Yes 12.0% Yes 20.9% 23.6% Yes
Meets 56.6% 62.1% No 59.0% Yes 56.1% 54.2% Yes
Meets +
Exceeds96.2% 94.6% Yes 88.0% Yes 79.1% 76.4% Yes
2011 Met Did Not Meet Yes 2011 4.8% 8.0% Yes
2010 Met Did Not Meet Yes 2010 6.4% 10.6% Yes
2009 Met Did Not Meet Yes 2009 7.6% 9.6% Yes
2008 Met Did Not Meet Yes 2008 7.0% 9.9% Yes
2007 Met Met Equal 2007 4.4% 8.8% Yes
Charter Initially Approved Steve Turrentine
DistrictSchool
0%
2011 CRCT
School
Student Demographics
Better
than
District
Better
than
District
Academic Achievements
7.2%
Year
Better
Than
District
92.8%
61.0%
173
5/10/2010
6/30/2015
Floyd County 40.98
3506
0%
Mission Statement
The mission of Armuchee Middle School is to equip students to become positive contributers to society.
Year
Key Facts Personnel
Grades
Enrollment
Charter System
Adequate Yearly Progress Percent Absent > 15 Days
School District
School
Native American
0%
Better
Than
District
Math Science
Armuchee Middle School471 Floyd Springs Rd NE
Armuchee, GA 30105-2401
706.378.7924
School
ELA / Reading
Instructional Days
2.76-8
District
Better
than
District
District
Cathy Cothran
District
Current Charter End
Dr. John D. Barge, State School Superintendent
Page 79 of 242

Block Yes Multi-age grouping No Career Academy No
Shortened Day No Student/teacher teams Yes International Baccalaureate Program No
Extended Day Yes Grades subdivided into houses No Pre-K No
Extended Week Yes Students remain with teacher 2+ years No After School Programs Yes
Extended Year Yes Single gender classes No Community Service Yes
•
•
•
Goal 1: Increase the percent of students in the Econ. Dis. subgroup who meet/exceed in math on the CRCT
Goal 2:
Target:
Goal 3:
Target:
Goal 4:
Target:
Scheduling Instructional Type/Services Offered
Met/Did Not Meet:
2010-11 Results:
Met/Did Not Meet:
Target:
Met/Did Not Meet:
2010-11 Results:
Met/Did Not Meet:
Provide 4 training sessions for all Local School Governance Team members during the 2010-11 year
2010-11 Results: Met Goal – All LSGT members participated in the 4 training sessions provided during the 2010-11 school year
Increased the number of students that exceeded in one or more areas of the CRCT for all grades; 93% of our students exceeded on the Math
1 EOCT; won the 8th grade "egg bowl" CRCT preparation contest
2010-11 Results: Conduct a minimum of 4 LSGT meetings at the school level during the 2010-11 year
75.7% of Econ. Dis. students
Increase the involvement of all Charter School stakeholders in the school's decision-making process
Conduct a minimum of 4 LSGT meetings at the school level during the 2010-11 year
Decrease the % of SWD and Econ. Dis. students who are absent 15 or more school days
No more than 15% of subgroup students will be absent 15 or more school days during the 2010-2011 year
Increase the involvement of all Charter School stakeholders in the school's decision-making process
Unique Accomplishments
Met Goal
Academic Goals
706.378.7924
471 Floyd Springs Rd NEArmuchee, GA 30105-2401
Met Goal
Met Goal – 7.2% of SWD subgroup students and 7.3% of Econ. Dis. subgroup students were absent 15 or more days during the
2010-2011 year
Classroom Arrangements
What makes Armuchee Middle School Unique?
Met Goal
Armuchee Middle School
Partnered with Berry College in their Berry Service Project
N/A
86.2% of Econ. Dis. subgroup students met/exceeded in Math on the spring, 2011 CRCT
Met Goal
Dr. John D. Barge, State School Superintendent
Page 80 of 242

706.378.7924
Armuchee, GA 30105-2401
5 Year History of CRCT and Student Attendance
Armuchee Middle School
471 Floyd Springs Rd NE
65.0%
70.0%
75.0%
80.0%
85.0%
90.0%
95.0%
100.0%
2007 2008 2009 2010 2011
CRCT: Mathematics (Percent Passing)
Armuchee Middle School
Floyd County
State of Georgia
65.0%
70.0%
75.0%
80.0%
85.0%
90.0%
95.0%
100.0%
2007 2008 2009 2010 2011
CRCT: Reading (Percent Passing)
Armuchee Middle School
Floyd County
State of Georgia
65.0%
70.0%
75.0%
80.0%
85.0%
90.0%
95.0%
100.0%
2007 2008 2009 2010 2011
CRCT: English Language Arts (Percent Passing)
Armuchee Middle School
Floyd County
State of Georgia
65.0%
70.0%
75.0%
80.0%
85.0%
90.0%
95.0%
100.0%
2007 2008 2009 2010 2011
CRCT: Science (Percent Passing)
Armuchee Middle School
Floyd County
State of Georgia
55.0%
60.0%
65.0%
70.0%
75.0%
80.0%
85.0%
90.0%
95.0%
100.0%
2007 2008 2009 2010 2011
CRCT: Social Studies (Percent Passing)
Armuchee Middle School
Floyd County
State of Georgia
65.0%
70.0%
75.0%
80.0%
85.0%
90.0%
95.0%
100.0%
2007 2008 2009 2010 2011
Percent of Students Missing Less than 15 Days of School
Armuchee Middle School
Floyd County
State of Georgia
Dr. John D. Barge, State School Superintendent
Page 81 of 242

Teachers
Administrators
Support Staff
Teacher Attrition Rate
Principal
School Board Chair
Asian Black Hispanic White Multi LEP SWD F/R Lunch
School 1% 2% 2% 90% 5% 1% 17% 64%
District 1% 6% 8% 82% 3% 4% 17% 58%
Does Not
Meet4.4% 5.4% Yes 12.0% No 12.2% 23.6% Yes
Meets 60.9% 62.1% No 59.0% No 40.3% 54.2% No
Meets +
Exceeds95.6% 94.6% Yes 88.0% No 87.8% 76.4% Yes
2011 Met Did Not Meet Yes 2011 5.0% 8.0% Yes
2010 Met Did Not Meet Yes 2010 4.6% 10.6% Yes
2009 Met Did Not Meet Yes 2009 3.1% 9.6% Yes
2008 Met Did Not Meet Yes 2008 4.7% 9.9% Yes
2007 Met Met Equal 2007 4.0% 8.8% Yes
Current Charter End
District
Better
than
District
District
Cave Spring Elementary School13 Rome Rd SW
Cave Spring, GA 30124-2700
706.777.3371
School
ELA / Reading
Grades
Enrollment
Charter System
School
Native American
0%
Better
Than
District
Math Science
District
Adequate Yearly Progress Percent Absent > 15 Days
School District
Mission Statement
Our purpose is to provide a safe and comfortable child centered atmosphere in which students achieve their maximum educational, creative, emotional
and physical potential through a developmentally appropriate instructional delivery which is compatible with the needs and values of the community.
Year
Key Facts Personnel
Instructional Days
4K-5
173
5/10/2010
6/30/2015
Floyd County 27
2332
3%
Jan Musick
Academic Achievements
14.6%
Year
Better
Than
District
85.4%
43.8%
Charter Initially Approved Susan Hall Childers
DistrictSchool
0%
2011 CRCT
School
Student Demographics
Better
than
District
Better
than
District
Dr. John D. Barge, State School Superintendent
Page 82 of 242

Block Yes Multi-age grouping Yes Career Academy No
Shortened Day No Student/teacher teams No International Baccalaureate Program No
Extended Day Yes Grades subdivided into houses Yes Pre-K No
Extended Week Yes Students remain with teacher 2+ years Yes After School Programs Yes
Extended Year Yes Single gender classes No Community Service Yes
•
•
•
Goal 1:
Goal 2:
Target:
Goal 3:
Target:
Goal 4:
Target:
Cave Spring Elementary is fortunate to have a wealth of community interest and a large number of business partners. However, as a result of the new community leaders
on the LSGT, even more business partnerships were formed.
Another indicator of the positive results of additional partnerships and collaborations can be seen in the improved CRCT Spring 2011 results. Overall in the areas of ELA,
Reading and Math, we had fewer students scoring in the “DNM” category and an increase in the number scoring in the “Exceeds” category. We are especially proud of
these accomplishments in light of the fact that the number of students who qualify for McKinney Vento (homeless) services and free and reduced meals climbed
approximately 10 percent during the school year. With these increased needs, community support for struggling families (not just students) increased, as well as
academic achievement.
Increase the percent of all students (grades 3, 4, 5) who meet/exceed in Reading/ELA on the CRCT
Met Goal – 95.6% of all students met or exceeded in Reading /ELA on the spring, 2011 CRCT
Met Goal
13 Rome Rd SW
Met Goal
Met Goal – 94.1% of Econ. Dis subgroup students met/exceeded in Reading/ELA on the spring, 2011 CRCT
Classroom Arrangements
What makes Cave Spring Elementary School Unique?
Met Goal
Cave Spring, GA 30124-2700
Unique Accomplishments
Met Goal
Cave Spring Elementary School
90% of all students
Increase the percent of students in subgroups (= to 40) who meet/exceed in Math on the CRCT
80% of subgroup students
Increase the percent of students in subgroups (= to 40) who meet/exceed in Reading/ELA on the CRCT
Increase the percent of all students (grades 3, 4, 5) who meet/exceed in Math on the CRCT
90% of subgroup students
The interest and participation of the LSGT members in the school and students' accomplishments is definitely reflected in some successes seen at CSE during the 2010-
12 school year. A suggestion for a need for a comprehensive phonics /reading programs for grades k-2 came from both parent and teacher members of the team.
Teachers, administrators and School Improvement Team members worked to pool funds from the school’s Title 1 budget, locally budgeted instructional dollars and
fundraisers were used to purchase a program (SRA’s Imagine It!). Training for the teachers took place in spring of 2011 and the implementation began at the start of the
2011-12 school year. We believe this will strengthen our program and bring school wide consistency to our instruction.
2010-11 Results: Met Goal - 82.9% of Econ. Dis. subgroup students met/exceeded in Math on the spring, 2011 CRCT
Met/Did Not Meet:
2010-11 Results:
Met/Did Not Meet:
80% of all students
Academic Goals
2010-11 Results: Met Goal – 86.8% of all students met or exceeded in Math on the spring, 2011 CRCT
Met/Did Not Meet:
2010-11 Results:
Met/Did Not Meet:
Target:
Scheduling Instructional Type/Services Offered
706.777.3371
Dr. John D. Barge, State School Superintendent
Page 83 of 242

13 Rome Rd SW
5 Year History of CRCT and Student Attendance
Cave Spring, GA 30124-2700
706.777.3371
Cave Spring Elementary School
65.0%
70.0%
75.0%
80.0%
85.0%
90.0%
95.0%
100.0%
2007 2008 2009 2010 2011
CRCT: Mathematics (Percent Passing) Cave Spring Elementary School
Floyd County
State of Georgia
65.0%
70.0%
75.0%
80.0%
85.0%
90.0%
95.0%
100.0%
2007 2008 2009 2010 2011
CRCT: Reading (Percent Passing)
Cave Spring Elementary School
Floyd County
State of Georgia
65.0%
70.0%
75.0%
80.0%
85.0%
90.0%
95.0%
100.0%
2007 2008 2009 2010 2011
CRCT: English Language Arts (Percent Passing)
Cave Spring Elementary School
Floyd County
State of Georgia
65.0%
70.0%
75.0%
80.0%
85.0%
90.0%
95.0%
100.0%
2007 2008 2009 2010 2011
CRCT: Science (Percent Passing)
Cave Spring Elementary School
Floyd County
State of Georgia
65.0%
70.0%
75.0%
80.0%
85.0%
90.0%
95.0%
100.0%
2007 2008 2009 2010 2011
CRCT: Social Studies (Percent Passing)
Cave Spring Elementary School
Floyd County
State of Georgia
65.0%
70.0%
75.0%
80.0%
85.0%
90.0%
95.0%
100.0%
2007 2008 2009 2010 2011
Percent of Students Missing Less Than 15 Days of School
Cave Spring Elementary School
Floyd County
State of Georgia
Dr. John D. Barge, State School Superintendent
Page 84 of 242

Teachers
Administrators
Support Staff
Teacher Attrition Rate
Principal
School Board Chair
Asian Black Hispanic White Multi LEP SWD F/ R Lunch
School 0% 9% 13% 75% 2% 2% 18% 53%
District 1% 6% 8% 82% 3% 4% 17% 58%
Does Not
Meet9.8% 9.0% Equal 11.7% Equal 8.5% 6.6% Equal
Meets 35.3% 38.6% No 42.3% Yes 35.2% 31.6% Yes
Meets +
Exceeds90.2% 91.1% No 88.3% No 91.5% 93.4% No
2011 Did Not Meet Did Not Meet Equal 2011 72.0% 78.4% No
2010 Did Not Meet Did Not Meet Equal 2010 79.9% 81.0% No
2009 Met Did Not Meet Yes 2009 76.7% 78.1% No
2008 Did Not Meet Did Not Meet Equal 2008 73.7% 78.1% No
2007 Met Met Equal 2007 67.5% 73.1% No
84.6%
50.9%
District
Charter Initially Approved Joseph Hubbard
DistrictSchool
0%
2011 GHSGT
Rob Masters
Academic Achievements
15.4%
Year
Better
Than
District
School
Student Demographics
Better
than
District
Better
than
District
6K-5
173
5/10/2010
6/30/2015
Floyd County 53.47
4706
18%
Mission Statement
Every Student’s Excellence; Everyday Champions.
Year
Key Facts Personnel
Instructional Days
Science
Adequate Yearly Progress Graduation Rate
School District
Charter System
School
Native American
0%
Better
Than
District
Math
Coosa High School4454 Alabama Hwy NW
Rome, GA 30165-9204
706.236.1870
School
ELA
Grades
Enrollment
District
Better
than
District
District
Current Charter End
Dr. John D. Barge, State School Superintendent
Page 85 of 242

Block Yes Multi-age grouping No Career Academy Yes
Shortened Day No Student/teacher teams Yes International Baccalaureate Program No
Extended Day Yes Grades subdivided into houses Yes Pre-K No
Extended Week Yes Students remain with teacher 2+ years Yes After School Programs Yes
Extended Year Yes Single gender classes No Community Service Yes
•
•
•
Goal 1:
Goal 2:
Target:
Goal 3:
Target:
Goal 4:
Target:
Instructional Type/Services Offered
2010-11 Results:
Met/Did Not Meet:
Target:
2010-11 Results: Met Goal – Members of the Coosa High LSGT were present during the 4 scheduled meetings for the 2010-11 school year
Met/Did Not Meet:
2010-11 Results:
Met/Did Not Meet:
Provide 4 training sessions for all Local School Governance Team members during the 2010-11 year
2010-11 Results: Met Goal – All LSGT members participated in the 4 training sessions provided during the 2010-11 school year
Met/Did Not Meet:
Academic Goals
90.8% pass rate for first time test takers
Increase the involvement of all Charter School stakeholders in the school's decision-making process
Conduct a minimum of 4 LSGT meetings at the school level during the 2010-11 year
Increase the involvement of all Charter School stakeholders in the school's decision-making process
706.236.1870
Unique Accomplishments
Met Goal
Met Goal
Rome, GA 30165-9204
Met Goal - 77% of all students passed the GHSGT in Math on the spring, 2011 Administration
Classroom Arrangements
What makes Coosa High School Unique?
Increase the pass rate of all first time test takers on the GHSGT in Math
76% pass rate for all first time test takers (AMO was amended by the State from 81.2% to 76% AMO pass rate)
Use of technology to improve graduation rate.
Scheduling
Use of SMART Boards to increase student EOCT scores.
N/A
Increase the pass rate of first time test takers on the GHSGT in English Language Arts
Met Goal – 100% of African American first time test takers met/exceeded on the GHSGT in English Language Arts
Coosa High School
Met Goal
4454 Alabama Hwy NW
Met Goal
Dr. John D. Barge, State School Superintendent
Page 86 of 242

5 Year History of GHSGT and Graduation Rate
Rome, GA 30165-9204
706.236.1870
Coosa High School4454 Alabama Hwy NW
65.0%
70.0%
75.0%
80.0%
85.0%
90.0%
95.0%
100.0%
2007 2008 2009 2010 2011
GHSGT: Mathematics (Percent Passing)
Coosa High School
Floyd County
State of Georgia
65.0%
70.0%
75.0%
80.0%
85.0%
90.0%
95.0%
100.0%
2007 2008 2009 2010 2011
GHSGT: English Language Arts (Percent Passing)
Coosa High School
Floyd County
State of Georgia
65.0%
70.0%
75.0%
80.0%
85.0%
90.0%
95.0%
100.0%
2007 2008 2009 2010 2011
GHSGT: Science (Percent Passing)
Coosa High School
Floyd County
State of Georgia
65.0%
70.0%
75.0%
80.0%
85.0%
90.0%
95.0%
100.0%
2007 2008 2009 2010 2011
GHSGT: Social Studies (Percent Passing)
Coosa High School
Floyd County
State of Georgia
65.00%
70.00%
75.00%
80.00%
85.00%
90.00%
95.00%
100.00%
2007 2008 2009 2010 2011
Graduation Rate
Coosa High School
Floyd County
State of Georgia
Dr. John D. Barge, State School Superintendent
Page 87 of 242

Teachers
Administrators
Support Staff
Teacher Attrition Rate
Principal
School Board Chair
Asian Black Hispanic White Multi LEP SWD F/R Lunch
School 1% 8% 19% 70% 3% 4% 14% 68%
District 1% 6% 8% 82% 3% 4% 17% 58%
Does Not
Meet5.0% 5.4% Yes 12.0% No 37.2% 23.6% No
Meets 68.2% 62.1% Yes 59.0% Yes 53.7% 54.2% No
Meets +
Exceeds95.0% 94.6% Yes 88.0% No 62.8% 76.4% No
2011 Met Did Not Meet Yes 2011 5.2% 8.0% Yes
2010 Met Did Not Meet Yes 2010 7.2% 10.6% Yes
2009 Met Did Not Meet Yes 2009 6.1% 9.6% Yes
2008 Met Did Not Meet Yes 2008 7.7% 9.9% Yes
2007 Did Not Meet Met No 2007 7.4% 8.8% Yes
Current Charter End
District
Better
than
District
District
Coosa Middle School212 Eagle Dr NW
Rome, GA 30165-9246
706.236.1856
School
ELA / Reading
Grades
Enrollment
Charter System
School
Native American
0%
Better
Than
District
Math Science
District
Adequate Yearly Progress Percent Absent > 15 Days
School District
Mission Statement
Make a difference, educating literate and responsible citizens.
Year
Key Facts Personnel
Instructional Days
2.98K-5
173
5/10/2010
6/30/2015
Floyd County 40.49
3607
4%
Susan Spivey
Academic Achievements
12.2%
Year
Better
Than
District
87.8%
64.7%
Charter Initially Approved Lisa Landrum
DistrictSchool
0%
2011 CRCT
School
Student Demographics
Better
than
District
Better
than
District
Dr. John D. Barge, State School Superintendent
Page 88 of 242

Block Yes Multi-age grouping No Career Academy No
Shortened Day No Student/teacher teams Yes International Baccalaureate Program No
Extended Day No Grades subdivided into houses Yes Pre-K No
Extended Week Yes Students remain with teacher 2+ years Yes After School Programs Yes
Extended Year Yes Single gender classes No Community Service Yes
•
•
•
Goal 1:
Goal 2:
Target:
Goal 3:
Target:
Goal 4:
Target:
Encourage and promote technology funds be raised by the school for Smart Boards to be added in classrooms.
Encourage and promote parent volunteers for awards days and Eaglefest.
Increase the percent of all students who meet/exceed in Reading/ELA on the CRCT
Met Goal - 95.1% of all students met/exceeded in Reading/ELA on the spring, 2011 CRCT
Met Goal
212 Eagle Dr NW
Met Goal
Met Goal – 87.7% of SWD subgroup students met/exceeded in Reading/ELA on the spring, 2011 CRCT
Classroom Arrangements
What makes Coosa Middle School Unique?
Met Goal
Rome, GA 30165-9246
Unique Accomplishments
Met Goal
90% of all students will meet/exceed
Increase the involvement of all Charter School stakeholders in the school's decision-making process
Provide 4 training sessions for all Local School Governance Team members during the 2010-11 year
Increase the percent of SWD subgroup students in Reading/ELA on the CRCT
Increase the percent of all students who meet/exceed in Math on the CRCT
80% of SWD subgroup students will meet/exceed
Encourage and promote parent involvement with planned activities throughout the school year for parents, teachers, and students.
2010-11 Results: Met Goal – All LSGT members participated in the 4 training sessions provided during the 2010-11 school year
Met/Did Not Meet:
2010-11 Results:
Met/Did Not Meet:
83% of all students
Academic Goals
2010-11 Results: Met Goal – 87.3% of all students met/exceeded in Math on the spring, 2011 CRCT
Met/Did Not Meet:
2010-11 Results:
Met/Did Not Meet:
Target:
Scheduling Instructional Type/Services Offered
Coosa Middle School
706.236.1856
Dr. John D. Barge, State School Superintendent
Page 89 of 242

212 Eagle Dr NW
5 Year History of CRCT and Student Attendance
Rome, GA 30165-9246
706.236.1856
Coosa Middle School
65.0%
70.0%
75.0%
80.0%
85.0%
90.0%
95.0%
100.0%
2007 2008 2009 2010 2011
CRCT: Mathematics (Percent Passing)
Coosa Middle School
Floyd County
State of Georgia
65.0%
70.0%
75.0%
80.0%
85.0%
90.0%
95.0%
100.0%
2007 2008 2009 2010 2011
CRCT: Reading (Percent Passing)
Coosa Middle School
Floyd County
State of Georgia
65.0%
70.0%
75.0%
80.0%
85.0%
90.0%
95.0%
100.0%
2007 2008 2009 2010 2011
CRCT: English Language Arts (Percent Passing)
Coosa Middle School
Floyd County
State of Georgia
60.0%
65.0%
70.0%
75.0%
80.0%
85.0%
90.0%
95.0%
100.0%
2007 2008 2009 2010 2011
CRCT: Science (Percent Passing)
Coosa Middle School
Floyd County
State of Georgia
50.0%
55.0%
60.0%
65.0%
70.0%
75.0%
80.0%
85.0%
90.0%
95.0%
100.0%
2007 2008 2009 2010 2011
CRCT: Social Studies (Percent Passing)
Coosa Middle School
Floyd County
State of Georgia
65.0%
70.0%
75.0%
80.0%
85.0%
90.0%
95.0%
100.0%
2007 2008 2009 2010 2011
Percent of Students Missing Less than 15 Days of School
Coosa Middle School
Floyd County
State of Georgia
Dr. John D. Barge, State School Superintendent
Page 90 of 242
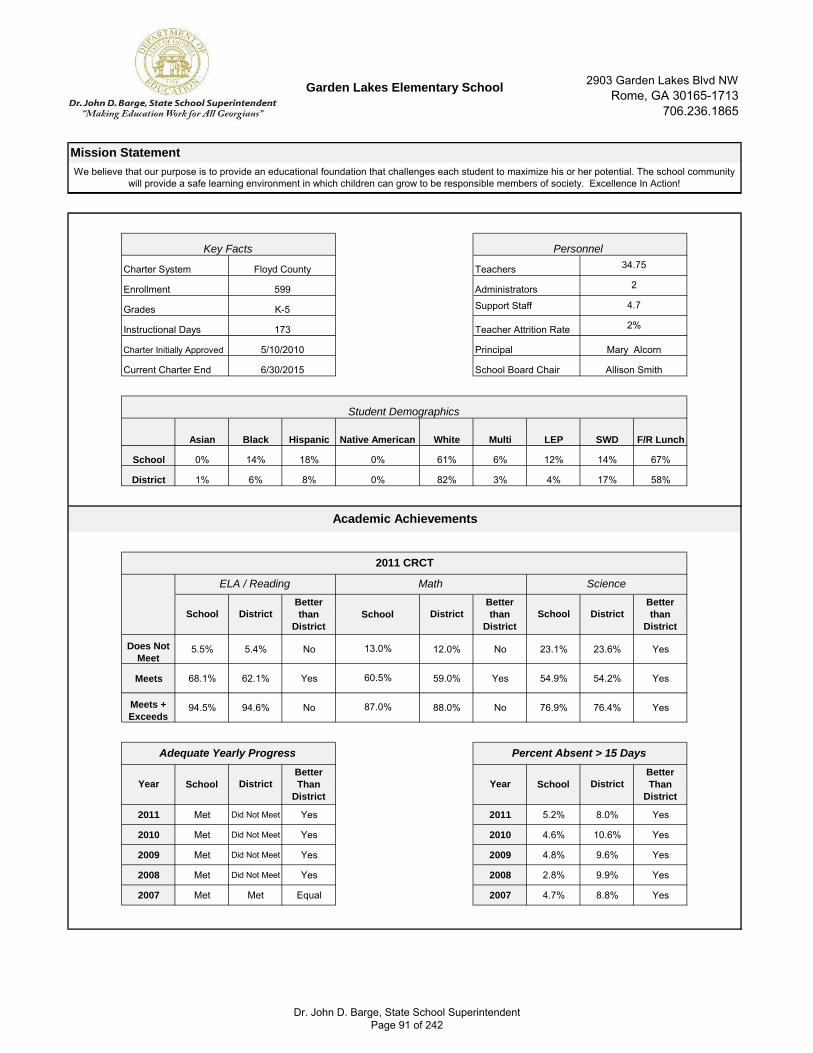
Teachers
Administrators
Support Staff
Teacher Attrition Rate
Principal
School Board Chair
Asian Black Hispanic White Multi LEP SWD F/R Lunch
School 0% 14% 18% 61% 6% 12% 14% 67%
District 1% 6% 8% 82% 3% 4% 17% 58%
Does Not
Meet5.5% 5.4% No 12.0% No 23.1% 23.6% Yes
Meets 68.1% 62.1% Yes 59.0% Yes 54.9% 54.2% Yes
Meets +
Exceeds94.5% 94.6% No 88.0% No 76.9% 76.4% Yes
2011 Met Did Not Meet Yes 2011 5.2% 8.0% Yes
2010 Met Did Not Meet Yes 2010 4.6% 10.6% Yes
2009 Met Did Not Meet Yes 2009 4.8% 9.6% Yes
2008 Met Did Not Meet Yes 2008 2.8% 9.9% Yes
2007 Met Met Equal 2007 4.7% 8.8% Yes
Charter Initially Approved Mary Alcorn
DistrictSchool
0%
2011 CRCT
School
Student Demographics
Better
than
District
Better
than
District
Academic Achievements
13.0%
Year
Better
Than
District
87.0%
60.5%
5/10/2010
6/30/2015
Floyd County 34.75
2599
2%
Key Facts Personnel
Instructional Days
4.7K-5
173
Mission Statement
We believe that our purpose is to provide an educational foundation that challenges each student to maximize his or her potential. The school community
will provide a safe learning environment in which children can grow to be responsible members of society. Excellence In Action!
Year
Adequate Yearly Progress Percent Absent > 15 Days
School District
School
Native American
0%
Better
Than
District
Math Science
Garden Lakes Elementary School2903 Garden Lakes Blvd NW
Rome, GA 30165-1713
706.236.1865
School
ELA / Reading
Grades
Enrollment
Charter System
District
Better
than
District
District
Allison Smith
District
Current Charter End
Dr. John D. Barge, State School Superintendent
Page 91 of 242

Block No Multi-age grouping No Career Academy No
Shortened Day No Student/teacher teams No International Baccalaureate Program No
Extended Day Yes Grades subdivided into houses Yes Pre-K No
Extended Week Yes Students remain with teacher 2+ years No After School Programs Yes
Extended Year Yes Single gender classes No Community Service No
•
•
•
Goal 1:
Goal 2:
Target:
Goal 3:
Target:
Goal 4:
Target:
Scheduling Instructional Type/Services Offered
2010-11 Results: Met goal - All LSGT members participated in the 4 training sessions provided suring the 2010-2011 school year.
Met/Did Not Meet:
2010-11 Results:
Met/Did Not Meet:
Target:
24% of all studnts will score in the exceeds category in Reading/ELA
Distinguished Title I School for eleven consecutive years! We were included in the ArtsNow Race to the Top Grant to be their Northwest
Georgia lab school if the grant is approved.
2010-11 Results: Met goal - All members of the Garden Lakes LSGT were present during the 5 scheduled meeting for the 2010-11 school year.
Met/Did Not Meet:
2010-11 Results:
Met/Did Not Meet:
Provide 4 training sessions for all Local School Governance Team members during the 2010-11 year
Academic Goals
90% of all students
Increase the involvement of all Charter School stakeholders in the school's decision making process.
Conduct a minimum of 5 LSGT meetings at the school level during the 2010-11 school year
Increase the percent of all students (grades 3,4,5) who exceed in Reading/ELA on the CRCT
Increase the involvement of all Charter School stakeholders in the school's decision making priocess
706.236.1865
Unique Accomplishments
Met Goal
Rome, GA 30165-1713
Met Goal
2903 Garden Lakes Blvd NW
Met Goal
Met goal - 26.7% of all students exceeded in Reading/ELA on the spring 2011 CRCT
Classroom Arrangements
What makes Garden Lakes Elementary School Unique?
Met Goal
Garden Lakes Elementary School
GLES provides Interventions/Enrichment for all students five days per week for 50 minutes per day. The curriculum used is purchased with
fundraising funds along with Title I funds. LSGT, PTO, and staff members are involved in the decision making process.
GLES organized a 5K race & Fun Walk to benefit our Assistant Principal battling Luekemia. This involved the entire community!
Increase the percent of all students (grades 3,4,5) who meet/exceed in Reading/ELA CRCT
Met Goal - 93.2 % of all studnts met of exceeded in Rading/ELA on the spring 2011 CRCT
Dr. John D. Barge, State School Superintendent
Page 92 of 242

5 Year History of CRCT and Student Attendance
Rome, GA 30165-1713
706.236.1865
Garden Lakes Elementary School
2903 Garden Lakes Blvd NW
65.0%
70.0%
75.0%
80.0%
85.0%
90.0%
95.0%
100.0%
2007 2008 2009 2010 2011
CRCT: Mathematics (Percent Passing)
Garden Lakes Elementary School
Floyd County
State of Georgia
65.0%
70.0%
75.0%
80.0%
85.0%
90.0%
95.0%
100.0%
2007 2008 2009 2010 2011
CRCT: Reading (Percent Passing)
Garden Lakes Elementary School
Floyd County
State of Georgia
65.0%
70.0%
75.0%
80.0%
85.0%
90.0%
95.0%
100.0%
2007 2008 2009 2010 2011
CRCT: English Language Arts (Percent Passing)Garden Lakes Elementary School
Floyd County
State of Georgia
65.0%
70.0%
75.0%
80.0%
85.0%
90.0%
95.0%
100.0%
2007 2008 2009 2010 2011
CRCT: Science (Percent Passing)
Garden Lakes Elementary School
Floyd County
State of Georgia
65.0%
70.0%
75.0%
80.0%
85.0%
90.0%
95.0%
100.0%
2007 2008 2009 2010 2011
CRCT: Social Studies (Percent Passing)
Garden Lakes Elementary School
Floyd County
State of Georgia
65.0%
70.0%
75.0%
80.0%
85.0%
90.0%
95.0%
100.0%
2007 2008 2009 2010 2011
Percent of Students Missing Less than 15 Days of School
Garden Lakes Elementary School
Floyd County
State of Georgia
Dr. John D. Barge, State School Superintendent
Page 93 of 242

Teachers
Administrators
Support Staff
Teacher Attrition Rate
Principal
School Board Chair
Asian Black Hispanic White Multi LEP SWD F/R Lunch
School 2% 3% 3% 87% 5% 2% 17% 45%
District 1% 6% 8% 82% 3% 4% 17% 58%
Does Not
MeetN/A 5.4% N/A 12.0% N/A N/A 23.6% N/A
Meets N/A 62.1% N/A 59.0% N/A N/A 54.2% N/A
Meets +
ExceedsN/A 94.6% N/A 88.0% N/A N/A 76.4% N/A
2011 Met Did Not Meet Yes 2011 3.9% 8.0% Yes
2010 Met Did Not Meet Yes 2010 6.1% 10.6% Yes
2009 Met Did Not Meet Yes 2009 8.2% 9.6% Yes
2008 Met Did Not Meet Yes 2008 6.9% 9.9% Yes
2007 Met Met Equal 2007 5.1% 8.8% Yes
Charter Initially Approved Jill Shepherd
DistrictSchool
0%
2011 CRCT
School
Student Demographics
Better
than
District
Better
than
District
Academic Achievements
N/A
Year
Better
Than
District
N/A
N/A
5/10/2010
6/30/2015
Floyd County 34
1531
3%
Key Facts Personnel
Instructional Days
4K-5
173
Mission Statement
Our mission is to build a foundation for a community of life-long learners in a caring environment defined by mutual respect through developmentally
appropriate experiences. “We are life-long learners.”
Year
Adequate Yearly Progress Percent Absent > 15 Days
School District
School
Native American
0%
Better
Than
District
Math Science
Glenwood Primary School75 Glenwood School Rd NE
Rome, GA 30165-7459
706.236.1855
School
ELA / Reading
Grades
Enrollment
Charter System
District
Better
than
District
District
Stephen Stewart
District
Current Charter End
Dr. John D. Barge, State School Superintendent
Page 94 of 242

Block Yes Multi-age grouping No Career Academy No
Shortened Day No Student/teacher teams Yes International Baccalaureate Program No
Extended Day Yes Grades subdivided into houses Yes Pre-K No
Extended Week Yes Students remain with teacher 2+ years No After School Programs Yes
Extended Year Yes Single gender classes No Community Service No
•
•
•
Goal 1:
Goal 2:
Target:
Goal 3:
Target:
Goal 4:
Target:
Scheduling Instructional Type/Services Offered
2010-11 Results: Met Goal – All LSGT members participated in the 4 training sessions provided during the 2010-11 school year
Met/Did Not Meet:
2010-11 Results:
Met/Did Not Meet:
Target:
80% of all 3rd grade AES students
Our unique accomplishment would include being named a SSAS Highest Performance Winner and a SSAS Greatest Gains Winner. These
awards were based on the number of students meeting and exceeding the standards on the CRCT.
2010-11 Results: Met Goal – All members of the Glenwood LSGT were present during the 4 scheduled meetings for the 2010-11 school year
Met/Did Not Meet:
2010-11 Results:
Met/Did Not Meet:
Provide 4 training sessions for all Local School Governance Team members during the 2010-11 year
Academic Goals
93% of all 3rd grade AES students
Increase the involvement of all Charter School stakeholders in the school's decision-making process
Conduct a minimum of 4 LSGT meetings at the school level during the 2010-11 year
Increase the percent of all 3rd grade students at Armuchee Elementary who meet/exceed in Math on the CRCT
Increase the involvement of all Charter School stakeholders in the school's decision-making process
706.236.1855
Unique Accomplishments
Met Goal
Rome, GA 30165-7459
Met Goal
75 Glenwood School Rd NE
Met Goal
Met Goal – 90.2% of all 3rd grade AES students met or exceeded in Math on the spring, 2011 CRCT
Classroom Arrangements
What makes Glenwood Primary School Unique?
Met Goal
Glenwood Primary School
N/A
N/A
Increase the percent of all 3rd grade students at Armuchee Elementary who meet/exceed in Reading/ELA on the CRCT
Met Goal – 97.7% of all 3rd grade students at AES met or exceeded in Reading /ELA on the spring, 2011 CRCT
Dr. John D. Barge, State School Superintendent
Page 95 of 242

5 Year History of CRCT and Student Attendance
Rome, GA 30165-7459
706.236.1855
Glenwood Primary School
75 Glenwood School Rd NE
65.0%
70.0%
75.0%
80.0%
85.0%
90.0%
95.0%
100.0%
2007 2008 2009 2010 2011
CRCT: Mathematics (Percent Passing)
Glenwood Primary School
Floyd County
State of Georgia
65.0%
70.0%
75.0%
80.0%
85.0%
90.0%
95.0%
100.0%
2007 2008 2009 2010 2011
CRCT: Reading (Percent Passing)
Glenwood Primary School
Floyd County
State of Georgia
65.0%
70.0%
75.0%
80.0%
85.0%
90.0%
95.0%
100.0%
2007 2008 2009 2010 2011
CRCT: English Language Arts (Percent Passing)
Glenwood Primary School
Floyd County
State of Georgia
65.0%
70.0%
75.0%
80.0%
85.0%
90.0%
95.0%
100.0%
2007 2008 2009 2010 2011
CRCT: Science (Percent Passing)
Glenwood Primary School
Floyd County
State of Georgia
65.0%
70.0%
75.0%
80.0%
85.0%
90.0%
95.0%
100.0%
2007 2008 2009 2010 2011
CRCT: Social Studies (Percent Passing)
Glenwood Primary School
Floyd County
State of Georgia
65.0%
70.0%
75.0%
80.0%
85.0%
90.0%
95.0%
100.0%
2007 2008 2009 2010 2011
Percent of Students Missing Less than 15 Days of School
Glenwood Primary School
Floyd County
State of Georgia
Dr. John D. Barge, State School Superintendent
Page 96 of 242

Teachers
Administrators
Support Staff
Teacher Attrition Rate
Principal
School Board Chair
Asian Black Hispanic White Multi LEP SWD F/R Lunch
School 1% 7% 3% 87% 2% 1% 14% 50%
District 1% 6% 8% 82% 3% 4% 17% 58%
Does Not
Meet3.9% 5.4% Yes 12.0% Yes 12.1% 23.6% Yes
Meets 56.3% 62.1% No 59.0% No 43.3% 54.2% No
Meets +
Exceeds96.1% 94.6% Yes 88.0% Yes 87.9% 76.4% Yes
2011 Met Did Not Meet Yes 2011 2.9% 8.0% Yes
2010 Met Did Not Meet Yes 2010 7.2% 10.6% Yes
2009 Met Did Not Meet Yes 2009 6.7% 9.6% Yes
2008 Met Did Not Meet Yes 2008 5.2% 9.9% Yes
2007 Met Met Equal 2007 4.2% 8.8% Yes
Charter Initially Approved La Donna Turrentine
DistrictSchool
0%
2011 CRCT
School
Student Demographics
Better
than
District
Better
than
District
Academic Achievements
9.5%
Year
Better
Than
District
90.5%
53.9%
5/10/2010
6/30/2015
Floyd County 35
2591
13%
Key Facts Personnel
Instructional Days
3.63K-5
173
Mission Statement
Dedicated to REACHing every child at his/her ability level, TEACHing every child the highest academic skills, and TOUCHing every child's life in a positive
way.
Year
Adequate Yearly Progress Percent Absent > 15 Days
School District
School
Native American
0%
Better
Than
District
Math Science
Johnson Elementary1839 Morrison Camp Ground Rd NE
Rome, GA 30161-9186
706.236.1830
School
ELA / Reading
Grades
Enrollment
Charter System
District
Better
than
District
District
Jerry Gatlin
District
Current Charter End
Dr. John D. Barge, State School Superintendent
Page 97 of 242

Block Yes Multi-age grouping No Career Academy No
Shortened Day No Student/teacher teams Yes International Baccalaureate Program No
Extended Day Yes Grades subdivided into houses Yes Pre-K No
Extended Week Yes Students remain with teacher 2+ years No After School Programs Yes
Extended Year Yes Single gender classes No Community Service No
•
•
•
Goal 1:
Goal 2:
Target:
Goal 3:
Target:
Goal 4:
Target:
Scheduling Instructional Type/Services Offered
2010-11 Results: Met Goal – 88.7% of Econ. Dis. subgroup students met/exceeded in Math on the spring, 2011 CRCT
Met/Did Not Meet:
2010-11 Results:
Met/Did Not Meet:
Target:
88% of all students
We were able to secure math tutors from Shorter University to come work with our "at risk math" 3rd - 5th grade students. This idea came
from a member of our LSGT.
2010-11 Results: Met Goal – All LSGT members participated in the 4 training sessions provided during the 2010-11 school year
Met/Did Not Meet:
2010-11 Results:
Met/Did Not Meet:
85% of subgroup students
Academic Goals
92% of subgroup students
Increase the involvement of all Charter School stakeholders in the school's decision-making process
Provide 4 training sessions for all Local School Governance Team members during the 2010-11 year
Increase the percent of all students (grades 3, 4, 5) who meet/exceed in Math on the CRCT
Increase the percent of students in subgroups (= to 40) who meet/exceed in Math on the CRCT
706.236.1830
Unique Accomplishments
Met Goal
Rome, GA 30161-9186
Met Goal
1839 Morrison Camp Ground Rd NE
Met Goal
Met Goal – 89.7% of all students met or exceeded in Math on the spring, 2011 CRCT
Classroom Arrangements
What makes Johnson Elementary Unique?
Met Goal
N/A
N/A
Increase the percent of students in subgroups (= to 40) who meet/exceed in Reading/ELA on the CRCT
Met Goal – 93.5% of Econ. Dis. subgroup students met/exceeded in Reading/ELA on the spring, 2011 CRCT
Johnson Elementary
Dr. John D. Barge, State School Superintendent
Page 98 of 242

5 Year History of CRCT and Student Attendance
Rome, GA 30161-9186
706.236.1830
Johnson Elementary1839 Morrison Camp Ground Rd NE
65.0%
70.0%
75.0%
80.0%
85.0%
90.0%
95.0%
100.0%
2007 2008 2009 2010 2011
CRCT: Mathematics (Percent Passing)
Johnson Elementary
Floyd County
State of Georgia
65.0%
70.0%
75.0%
80.0%
85.0%
90.0%
95.0%
100.0%
2007 2008 2009 2010 2011
CRCT: Reading (Percent Passing)
Johnson Elementary
Floyd County
State of Georgia
65.0%
70.0%
75.0%
80.0%
85.0%
90.0%
95.0%
100.0%
2007 2008 2009 2010 2011
CRCT: English Language Arts (Percent Passing)
Johnson Elementary
Floyd County
State of Georgia
65.0%
70.0%
75.0%
80.0%
85.0%
90.0%
95.0%
100.0%
2007 2008 2009 2010 2011
CRCT: Science (Percent Passing)
Johnson Elementary
Floyd County
State of Georgia
65.0%
70.0%
75.0%
80.0%
85.0%
90.0%
95.0%
100.0%
2007 2008 2009 2010 2011
CRCT: Social Studies (Percent Passing)
Johnson Elementary
Floyd County
State of Georgia
65.0%
70.0%
75.0%
80.0%
85.0%
90.0%
95.0%
100.0%
2007 2008 2009 2010 2011
Percent of Students Missing Less than 15 Days of School
Johnson Elementary
Floyd County
State of Georgia
Dr. John D. Barge, State School Superintendent
Page 99 of 242

Teachers
Administrators
Support Staff
Teacher Attrition Rate
Principal
School Board Chair
Asian Black Hispanic White Multi LEP SWD F/R Lunch
School 1% 13% 18% 63% 5% 11% 29% 78%
District 1% 6% 8% 82% 3% 4% 17% 58%
Does Not
Meet12.3% 5.4% No 12.0% No 22.6% 23.6% Yes
Meets 60.7% 62.1% No 59.0% Yes 56.5% 54.2% Yes
Meets +
Exceeds87.7% 94.6% No 88.0% No 77.4% 76.4% Yes
2011 Met Did Not Meet Yes 2011 9.5% 8.0% No
2010 Met Did Not Meet Yes 2010 9.5% 10.6% Yes
2009 Met Did Not Meet Yes 2009 5.7% 9.6% Yes
2008 Met Did Not Meet Yes 2008 10.9% 9.9% No
2007 Met Met Equal 2007 8.9% 8.8% No
Charter Initially Approved Jennifer Cunningham
DistrictSchool
0%
2011 CRCT
School
Student Demographics
Better
than
District
Better
than
District
Academic Achievements
13.1%
Year
Better
Than
District
86.9%
62.3%
5/10/2010
6/30/2015
Floyd County 30.42
1.63306
5%
Key Facts Personnel
Instructional Days
3.98K-3
173
Mission Statement
Learning Today. Sharing Tomorrow. Changing the Future Together.
Year
Adequate Yearly Progress Percent Absent > 15 Days
School District
School
Native American
0%
Better
Than
District
Math Science
McHenry Primary100 McHenry Dr SW
Rome, GA 30161-4823
706.236.1833
School
ELA / Reading
Grades
Enrollment
Charter System
District
Better
than
District
District
Juli Johnson
District
Current Charter End
Dr. John D. Barge, State School Superintendent
Page 100 of 242

Block Yes Multi-age grouping No Career Academy No
Shortened Day No Student/teacher teams Yes International Baccalaureate Program No
Extended Day Yes Grades subdivided into houses Yes Pre-K No
Extended Week Yes Students remain with teacher 2+ years No After School Programs Yes
Extended Year Yes Single gender classes No Community Service No
•
•
•
Goal 1:
Goal 2:
Target:
Goal 3:
Target:
Goal 4:
Target:
Scheduling Instructional Type/Services Offered
2010-11 Results: Met Goal – 4.2% of all students were absent 15 or more days during the 2010-2011 year
Met/Did Not Meet:
2010-11 Results:
Met/Did Not Meet:
Target:
80% of subgroup students
Winning the Pepsi Refresh $10,000 grant! This allowed us to install a playground that is wheelchair accessible so that all kids can play.
2010-11 Results:Met Goal – All LSGT members participated in the 4 training sessions provided during the 2010-11 school year
Met/Did Not Meet:
2010-11 Results:
Met/Did Not Meet:
No more than 5% of students will be absent 15 or more school days during the 2010-2011 year
Academic Goals
80 % of all students
Increase the involvement of all Charter School stakeholders in the school's decision-making process
Provide 4 training sessions for all Local School Governance Team members during the 2010-11 year
Increase the percent of students in subgroups who meet/exceed in Math on the CRCT
Decrease the % of students who are absent 15 or more school days
706.236.1833
Unique Accomplishments
Met Goal
Rome, GA 30161-4823
Met Goal
100 McHenry Dr SW
Met Goal
Met Goal – 88% of Econ. Dis. subgroup students met/exceeded in Math on the spring, 2011 CRCT
Classroom Arrangements
What makes McHenry Primary Unique?
Met Goal
N/A
N/A
Increase the percent of all students (grades 3) who meet/exceed in Math on the CRCT
Met Goal - 90.2% of all students met or exceeded in Math on the spring, 2011 CRCT
McHenry Primary
Dr. John D. Barge, State School Superintendent
Page 101 of 242

5 Year History of CRCT and Student Attendance
Rome, GA 30161-4823
706.236.1833
McHenry Primary100 McHenry Dr SW
65.0%
70.0%
75.0%
80.0%
85.0%
90.0%
95.0%
100.0%
2007 2008 2009 2010 2011
CRCT: Mathematics (Percent Passing)
McHenry Primary
Floyd County
State of Georgia
65.0%
70.0%
75.0%
80.0%
85.0%
90.0%
95.0%
100.0%
2007 2008 2009 2010 2011
CRCT: Reading (Percent Passing)
McHenry Primary
Floyd County
State of Georgia
65.0%
70.0%
75.0%
80.0%
85.0%
90.0%
95.0%
100.0%
2007 2008 2009 2010 2011
CRCT: English Language Arts (Percent Passing)
McHenry Primary
Floyd County
State of Georgia
55.0%
60.0%
65.0%
70.0%
75.0%
80.0%
85.0%
90.0%
95.0%
100.0%
2007 2008 2009 2010 2011
CRCT: Science (Percent Passing)
McHenry Primary
Floyd County
State of Georgia
65.0%
70.0%
75.0%
80.0%
85.0%
90.0%
95.0%
100.0%
2007 2008 2009 2010 2011
CRCT: Social Studies (Percent Passing)
McHenry Primary
Floyd County
State of Georgia
55.0%
60.0%
65.0%
70.0%
75.0%
80.0%
85.0%
90.0%
95.0%
100.0%
2007 2008 2009 2010 2011
Percent of Students Missing Less than 15 Days of School
McHenry Primary
Floyd County
State of Georgia
Dr. John D. Barge, State School Superintendent
Page 102 of 242

Teachers
Administrators
Support Staff
Teacher Attrition Rate
Principal
School Board Chair
Asian Black Hispanic White Multi LEP SWD F/R Lunch
School 1% 1% 3% 92% 3% 2% 19% 68%
District 1% 6% 8% 82% 3% 4% 17% 58%
Does Not
Meet7.1% 5.4% No 12.0% No 20.5% 23.6% Yes
Meets 70.1% 62.1% Yes 59.0% No 69.2% 54.2% Yes
Meets +
Exceeds92.9% 94.6% No 88.0% No 79.5% 76.4% Yes
2011 Met Did Not Meet Yes 2011 6.3% 8.0% Yes
2010 Met Did Not Meet Yes 2010 9.7% 10.6% Yes
2009 Met Did Not Meet Yes 2009 8.3% 9.6% Yes
2008 Met Did Not Meet Yes 2008 9.0% 9.9% Yes
2007 Met Met Equal 2007 11.2% 8.8% No
Current Charter End
District
Better
than
District
District
Midway Primary5 Midway School Rd SE
Silver Creek, GA 30173-2451
706.236.1880
School
ELA / Reading
Grades
Enrollment
Charter System
School
Native American
0%
Better
Than
District
Math Science
District
Adequate Yearly Progress Percent Absent > 15 Days
School District
Mission Statement
Provide a learning environment that will enable students to leave the school prepared for the next level of the educational process.
Year
Key Facts Personnel
Instructional Days
3.49K-5
173
5/10/2010
6/30/2015
Floyd County 26.5
2373
6%
Jennifer Whitaker
Academic Achievements
20.8%
Year
Better
Than
District
79.2%
55.8%
Charter Initially Approved Jeanie Hubbard
DistrictSchool
0%
2011 CRCT
School
Student Demographics
Better
than
District
Better
than
District
Dr. John D. Barge, State School Superintendent
Page 103 of 242

Block Yes Multi-age grouping Yes Career Academy No
Shortened Day No Student/teacher teams Yes International Baccalaureate Program No
Extended Day Yes Grades subdivided into houses Yes Pre-K No
Extended Week Yes Students remain with teacher 2+ years Yes After School Programs Yes
Extended Year No Single gender classes No Community Service No
•
•
•
Goal 1:
Goal 2:
Target:
Goal 3:
Target:
Goal 4:
Target:
Midway Primary made AYP for the 2011 school year.
Local School Governance Team assisted in establishing the Positive Behavior Interventions and Support (PBIS) system.
Increase the percent of students in Econ. Dis. subgroup who meet/exceed in Reading/ELA on the CRCT
Met Goal 89.3% of Econ. Dis. subgroup students met/exceeded in Reading/ELA on the spring, 2011 CRCT
Met Goal
5 Midway School Rd SE
Met Goal
Met Goal – 3.4% of all students were absent 15 or more days during the 2010-2011 year
Classroom Arrangements
What makes Midway Primary Unique?
Met Goal
Silver Creek, GA 30173-2451
Unique Accomplishments
Met Goal
80% of Econ. Dis. subgroup students
Increase the involvement of all Charter School stakeholders in the school's decision-making process
Conduct a minimum of 4 LSGT meetings at the school level during the 2010-11 year
Decrease the % of students who are absent 15 or more school days
Increase the involvement of all Charter School stakeholders in the school's decision-making process
No more than 5% of students will be absent 15 or more school days during the 2010-2011 year
Midway Primary received the Title 1 Distinguished School Award the first year of being Title I.
2010-11 Results: Met Goal – All members of the Midway Primary LSGT were present during the 4 scheduled meetings for the 2010-11 school year
Met/Did Not Meet:
2010-11 Results:
Met/Did Not Meet:
Provide 4 training sessions for all Local School Governance Team members during the 2010-11 year
Academic Goals
2010-11 Results: Met Goal – All LSGT members participated in the 4 training sessions provided during the 2010-11 school year
Met/Did Not Meet:
2010-11 Results:
Met/Did Not Meet:
Target:
Scheduling Instructional Type/Services Offered
Midway Primary
706.236.1880
Dr. John D. Barge, State School Superintendent
Page 104 of 242

5 Midway School Rd SE
5 Year History of CRCT and Student Attendance
Silver Creek, GA 30173-2451
706.236.1880
Midway Primary
65.0%
70.0%
75.0%
80.0%
85.0%
90.0%
95.0%
100.0%
2007 2008 2009 2010 2011
CRCT: Mathematics (Percent Passing)
Midway Primary
Floyd County
State of Georgia
65.0%
70.0%
75.0%
80.0%
85.0%
90.0%
95.0%
100.0%
2007 2008 2009 2010 2011
CRCT: Reading (Percent Passing)
Midway Primary
Floyd County
State of Georgia
65.0%
70.0%
75.0%
80.0%
85.0%
90.0%
95.0%
100.0%
2007 2008 2009 2010 2011
CRCT: English Language Arts (Percent Passing)
Midway Primary
Floyd County
State of Georgia
65.0%
70.0%
75.0%
80.0%
85.0%
90.0%
95.0%
100.0%
2007 2008 2009 2010 2011
CRCT: Science (Percent Passing)
Midway Primary
Floyd County
State of Georgia
60.0%
65.0%
70.0%
75.0%
80.0%
85.0%
90.0%
95.0%
100.0%
2007 2008 2009 2010 2011
CRCT: Social Studies (Percent Passing)
Midway Primary
Floyd County
State of Georgia
65.0%
70.0%
75.0%
80.0%
85.0%
90.0%
95.0%
100.0%
2007 2008 2009 2010 2011
Percent of Students Missing Less than 15 Days of School
Midway Primary
Floyd County
State of Georgia
Dr. John D. Barge, State School Superintendent
Page 105 of 242

Teachers
Administrators
Support Staff
Teacher Attrition Rate
Principal
School Board Chair
Asian Black Hispanic White Multi LEP SWD F/R Lunch
School 0% 3% 4% 92% 1% 2% 17% 61%
District 1% 6% 8% 82% 3% 4% 17% 58%
Does Not
Meet2.5% 5.4% Yes 12.0% Yes 16.0% 23.6% Yes
Meets 63.6% 62.1% Yes 59.0% Yes 55.2% 54.2% Yes
Meets +
Exceeds97.5% 94.6% Yes 88.0% Yes 84.0% 76.4% Yes
2011 Met Did Not Meet Yes 2011 4.1% 8.0% Yes
2010 Met Did Not Meet Yes 2010 7.4% 10.6% Yes
2009 Met Did Not Meet Yes 2009 8.6% 9.6% Yes
2008 Met Did Not Meet Yes 2008 6.4% 9.9% Yes
2007 Met Met Equal 2007 5.7% 8.8% Yes
Current Charter End
District
Better
than
District
District
Model Elementary School3200 Calhoun Rd NE
Rome, GA 30161-1929
706.236.1827
School
ELA / Reading
Grades
Enrollment
Charter System
School
Native American
0%
Better
Than
District
Math Science
District
Adequate Yearly Progress Percent Absent > 15 Days
School District
Mission Statement
Providing a positive learning environment.
Year
Key Facts Personnel
Instructional Days
4K-3
173
5/10/2010
6/30/2015
Floyd County 39
2578
0%
Chad Wheat
Academic Achievements
11.4%
Year
Better
Than
District
88.6%
68.1%
Charter Initially Approved Kyle Jones
DistrictSchool
0%
2011 CRCT
School
Student Demographics
Better
than
District
Better
than
District
Dr. John D. Barge, State School Superintendent
Page 106 of 242

Block Yes Multi-age grouping No Career Academy No
Shortened Day No Student/teacher teams Yes International Baccalaureate Program No
Extended Day Yes Grades subdivided into houses Yes Pre-K No
Extended Week Yes Students remain with teacher 2+ years Yes After School Programs Yes
Extended Year Yes Single gender classes No Community Service No
•
•
•
Goal 1:
Goal 2:
Target:
Goal 3:
Target:
Goal 4:
Target:
Model Elementary received the “Silver Can Award” for collecting almost 14,000 cans during the 2010-2011 can-a –thon.
N/A
Increase the percent of all students (grades 3, 4, 5) who meet/exceed in Reading/ELA on the CRCT
Met Goal – 96.3% of all students met or exceeded in Reading /ELA on the spring, 2011 CRCT
Met Goal
3200 Calhoun Rd NE
Met Goal
Met Goal – 33.8% of all students exceeded in Reading/ELA on the spring, 2011 CRCT
Classroom Arrangements
What makes Model Elementary School Unique?
Met Goal
Rome, GA 30161-1929
Unique Accomplishments
Met Goal
Model Elementary School
0.935
Maintain the percent of students in the SWD subgroup who meet/exceed in Math on the CRCT
0.573
Increase the percent of all students (grades 3, 4, 5) who exceed in Reading/ELA on the CRCT
Increase the percent of all students (grades 3, 4, 5) who meet/exceed in Math on the CRCT
0.29
100% of all resource students passed the CRCT-m, 98% of all grades 3-5 student meet or exceeded the reading portion of the CRCT.
2010-11 Results:Met Goal – 69.8% of all SWD subgroup students met/exceeded in Math on the spring, 2011 CRCT
Met/Did Not Meet:
2010-11 Results:
Met/Did Not Meet:
0.86
Academic Goals
2010-11 Results: Met Goal – 87.4% of all students met or exceeded in Math on the spring, 2011 CRCT
Met/Did Not Meet:
2010-11 Results:
Met/Did Not Meet:
Target:
Scheduling Instructional Type/Services Offered
706.236.1827
Dr. John D. Barge, State School Superintendent
Page 107 of 242

3200 Calhoun Rd NE
5 Year History of CRCT and Student Attendance
Rome, GA 30161-1929
706.236.1827
Model Elementary School
65.0%
70.0%
75.0%
80.0%
85.0%
90.0%
95.0%
100.0%
2007 2008 2009 2010 2011
CRCT: Mathematics (Percent Passing)
Model Elementary School
Floyd County
State of Georgia
65.0%
70.0%
75.0%
80.0%
85.0%
90.0%
95.0%
100.0%
2007 2008 2009 2010 2011
CRCT: Reading (Percent Passing)
Model Elementary School
Floyd County
State of Georgia
65.0%
70.0%
75.0%
80.0%
85.0%
90.0%
95.0%
100.0%
2007 2008 2009 2010 2011
CRCT: English Language Arts (Percent Passing)
Model Elementary School
Floyd County
State of Georgia
65.0%
70.0%
75.0%
80.0%
85.0%
90.0%
95.0%
100.0%
2007 2008 2009 2010 2011
CRCT: Science (Percent Passing)
Model Elementary School
Floyd County
State of Georgia
65.0%
70.0%
75.0%
80.0%
85.0%
90.0%
95.0%
100.0%
2007 2008 2009 2010 2011
CRCT: Social Studies (Percent Passing)
Model Elementary School
Floyd County
State of Georgia
65.0%
70.0%
75.0%
80.0%
85.0%
90.0%
95.0%
100.0%
2007 2008 2009 2010 2011
Percent of Students Missing Less than 15 Days of School
Model Elementary School
Floyd County
State of Georgia
Dr. John D. Barge, State School Superintendent
Page 108 of 242

Teachers
Administrators
Support Staff
Teacher Attrition Rate
Principal
School Board Chair
Asian Black Hispanic White Multi LEP SWD F/R Lunch
School 1% 7% 4% 86% 2% 1% 17% 54%
District 1% 6% 8% 82% 3% 4% 17% 58%
Does Not
Meet2.5% 5.4% Yes 12.0% Yes 19.1% 23.6% Yes
Meets 59.9% 62.1% No 59.0% Yes 62.9% 54.2% Yes
Meets +
Exceeds97.5% 94.6% Yes 88.0% Yes 80.9% 76.4% Yes
2011 Met Did Not Meet Yes 2011 3.6% 8.0% Yes
2010 Met Did Not Meet Yes 2010 5.3% 10.6% Yes
2009 Met Did Not Meet Yes 2009 7.1% 9.6% Yes
2008 Met Did Not Meet Yes 2008 6.8% 9.9% Yes
2007 Met Met Equal 2007 8.3% 8.8% Yes
Charter Initially Approved David Tucker
DistrictSchool
0%
2011 CRCT
School
Student Demographics
Better
than
District
Better
than
District
Academic Achievements
6.1%
Year
Better
Than
District
93.9%
62.6%
5/10/2010
6/30/2015
Floyd County 42
3554
7%
Key Facts Personnel
Instructional Days
36-8
173
Mission Statement
“Preparing Life Long Learners”
Year
Adequate Yearly Progress Percent Absent > 15 Days
School District
School
Native American
0%
Better
Than
District
Math Science
Model Middle School164 Barron Rd NE
Rome, GA 30161-3419
706.290.8150
School
ELA / Reading
Grades
Enrollment
Charter System
District
Better
than
District
District
Steve Cunningham
District
Current Charter End
Dr. John D. Barge, State School Superintendent
Page 109 of 242

Block Yes Multi-age grouping No Career Academy No
Shortened Day No Student/teacher teams Yes International Baccalaureate Program No
Extended Day Yes Grades subdivided into houses Yes Pre-K No
Extended Week Yes Students remain with teacher 2+ years No After School Programs Yes
Extended Year Yes Single gender classes No Community Service No
•
•
•
Goal 1:
Goal 2:
Target:
Goal 3:
Target:
Goal 4:
Target:
Scheduling Instructional Type/Services Offered
Model Middle School
2010-11 Results: Met Goal – 3.6% of all students were absent 15 or more days during the 2010-2011 year
Met/Did Not Meet:
2010-11 Results:
Met/Did Not Meet:
Target:
0.73
Model Middle School ranked number 54 in GA for academic performance out of 472 middle schools according to Schooldigger.com. We had a
total school Math average of 93 and a total school ELA average of 97.6.
2010-11 Results: Met Goal – All LSGT members participated in the 4 training sessions provided during the 2010-11 school year
Met/Did Not Meet:
2010-11 Results:
Met/Did Not Meet:
No more than 5% of students will be absent 15 or more school days during the 2010-2011 year
Academic Goals
0.757
Increase the involvement of all Charter School stakeholders in the school's decision-making process
Provide 4 training sessions for all Local School Governance Team members during the 2010-11 year
Increase the percent of SWD students who meet/exceed in Math on the CRCT
Decrease the % of students who are absent 15 or more school days
706.290.8150
Unique Accomplishments
Met Goal
Rome, GA 30161-3419
Met Goal
164 Barron Rd NE
Met Goal
Met Goal – 76.1% of SWD students met/exceeded in Math on the spring, 2011 CRCT
Classroom Arrangements
What makes Model Middle School Unique?
Met Goal
According to the Salvation Army, Model Middle School has donated more canned food than any other single entity in the Nation. We have
donated over 200,000 cans of food in the last 3 years. We take great pride in knowing we have helped our community through our
contributions.
N/A
Increase the percent of all students who meet/exceed in Math on the CRCT
Met Goal – 91.3% of all students met or exceeded in Math on the spring, 2011 CRCT
Dr. John D. Barge, State School Superintendent
Page 110 of 242

5 Year History of CRCT and Student Attendance
Rome, GA 30161-3419
706.290.8150
Model Middle School164 Barron Rd NE
65.0%
70.0%
75.0%
80.0%
85.0%
90.0%
95.0%
100.0%
2007 2008 2009 2010 2011
CRCT: Mathematics (Percent Passing)
Model Middle School
Floyd County
State of Georgia
65.0%
70.0%
75.0%
80.0%
85.0%
90.0%
95.0%
100.0%
2007 2008 2009 2010 2011
CRCT: Reading (Percent Passing)
Model Middle School
Floyd County
State of Georgia
65.0%
70.0%
75.0%
80.0%
85.0%
90.0%
95.0%
100.0%
2007 2008 2009 2010 2011
CRCT: English Language Arts (Percent Passing)
Model Middle School
Floyd County
State of Georgia
65.0%
70.0%
75.0%
80.0%
85.0%
90.0%
95.0%
100.0%
2007 2008 2009 2010 2011
CRCT: Science (Percent Passing)
Model Middle School
Floyd County
State of Georgia
45.0%
50.0%
55.0%
60.0%
65.0%
70.0%
75.0%
80.0%
85.0%
90.0%
95.0%
100.0%
2007 2008 2009 2010 2011
CRCT: Social Studies (Percent Passing)
Model Middle School
Floyd County
State of Georgia
65.0%
70.0%
75.0%
80.0%
85.0%
90.0%
95.0%
100.0%
2007 2008 2009 2010 2011
Percent of Students Missing Less than 15 Days of School
Model Middle School
Floyd County
State of Georgia
Dr. John D. Barge, State School Superintendent
Page 111 of 242

Teachers
Administrators
Support Staff
Teacher Attrition Rate
Principal
School Board Chair
Asian Black Hispanic White Multi LEP SWD F/ R Lunch
School 0% 7% 4% 87% 2% 1% 16% 47%
District 1% 6% 8% 82% 3% 4% 17% 58%
Does Not
Meet10.7% 9.0% Equal 11.7% Equal 8.6% 6.6% Equal
Meets 39.3% 38.6% Yes 42.3% Yes 32.4% 31.6% Yes
Meets +
Exceeds89.3% 91.1% No 88.3% Yes 91.4% 93.4% No
2011 Did Not Meet Did Not Meet Equal 2011 76.9% 78.4% No
2010 Did Not Meet Did Not Meet Equal 2010 87.1% 81.0% Yes
2009 N/A Did Not Meet N/A 2009 78.5% 78.1% Yes
2008 N/A Did Not Meet N/A 2008 81.3% 78.1% Yes
2007 N/A Met N/A 2007 71.9% 73.1% No
89.2%
45.3%
District
Charter Initially Approved Glenn White
DistrictSchool
0%
2011 GHSGT
Steve Turrentine
Academic Achievements
10.8%
Year
Better
Than
District
School
Student Demographics
Better
than
District
Better
than
District
4K-5
173
5/10/2010
6/30/2015
Floyd County 39.96
3645
16%
Mission Statement
The mission of Model High School, in partnership with parents and community, is to provide a safe environment in which individuals are respected and
have the opportunity to grow, achieve success, and contribute responsibly while becoming life-long learners.
Year
Key Facts Personnel
Instructional Days
Science
Adequate Yearly Progress Graduation Rate
School District
Charter System
School
Native American
0%
Better
Than
District
Math
Model High School3252 Calhoun Rd NE
Rome, GA 30161-1929
706.236.1895
School
ELA
Grades
Enrollment
District
Better
than
District
District
Current Charter End
Dr. John D. Barge, State School Superintendent
Page 112 of 242

Block Yes Multi-age grouping No Career Academy Yes
Shortened Day No Student/teacher teams No International Baccalaureate Program No
Extended Day Yes Grades subdivided into houses Yes Pre-K No
Extended Week Yes Students remain with teacher 2+ years Yes After School Programs Yes
Extended Year Yes Single gender classes No Community Service Yes
•
•
•
Goal 1:
Goal 2:
Target:
Goal 3:
Target:
Goal 4:
Target:
Instructional Type/Services Offered
2010-11 Results:
Met/Did Not Meet:
Target:
2010-11 Results: Met Goal – Members of the Model High LSGT were present during the 4 scheduled meetings for the 2010-11 school year
Met/Did Not Meet:
2010-11 Results:
Met/Did Not Meet:
Provide 4 training sessions for all Local School Governance Team members during the 2010-11 year
2010-11 Results: Met Goal – All LSGT members participated in the 4 training sessions provided during the 2010-11 school year
Met/Did Not Meet:
Academic Goals
81.2% pass rate for all first time test takers
Increase the involvement of all Charter School stakeholders in the school's decision-making process
Conduct a minimum of 4 LSGT meetings at the school level during the 2010-11 year
Increase the involvement of all Charter School stakeholders in the school's decision-making process
706.236.1895
Unique Accomplishments
Met Goal
Met Goal
Rome, GA 30161-1929
Met Goal – 82.5% of all Econ. Dis. subgroup students passed the GHSGT in Math on the spring, 2011 Administration
Classroom Arrangements
What makes Model High School Unique?
Increase the pass rate for all first time test takers in the Econ. Dis. subgroup on the GHSGT in Math
81.2% pass rate for all first time test takers
Model High last year opened the new Model High facility.
Scheduling
We had an Advance Ed SACS visit and all went well. We were the only high school visited in the system.
The LSGT was active in our Christmas fundraising for students.
Increase the pass rate of all first time test takers on the GHSGT in Math
Met Goal – 88.6% of all students passed the GHSGT in Math on the spring, 2011 Administration
Model High School
Met Goal
3252 Calhoun Rd NE
Met Goal
Dr. John D. Barge, State School Superintendent
Page 113 of 242

5 Year History of GHSGT and Graduation Rate
Rome, GA 30161-1929
706.236.1895
Model High School3252 Calhoun Rd NE
65.0%
70.0%
75.0%
80.0%
85.0%
90.0%
95.0%
100.0%
2007 2008 2009 2010 2011
GHSGT: Mathematics (Percent Passing)
Model High
Floyd County
State of Georgia
65.0%
70.0%
75.0%
80.0%
85.0%
90.0%
95.0%
100.0%
2007 2008 2009 2010 2011
GHSGT: English Language Arts (Percent Passing)
Model High
Floyd County
State of Georgia
65.0%
70.0%
75.0%
80.0%
85.0%
90.0%
95.0%
100.0%
2007 2008 2009 2010 2011
GHSGT: Science (Percent Passing)
Model High
Floyd County
State of Georgia
65.0%
70.0%
75.0%
80.0%
85.0%
90.0%
95.0%
100.0%
2007 2008 2009 2010 2011
GHSGT: Social Studies (Percent Passing)
Model High
Floyd County
State of Georgia
65.00%
70.00%
75.00%
80.00%
85.00%
90.00%
95.00%
100.00%
2007 2008 2009 2010 2011
Graduation Rate
Model High
Floyd County
State of Georgia
Dr. John D. Barge, State School Superintendent
Page 114 of 242

Teachers
Administrators
Support Staff
Teacher Attrition Rate
Principal
School Board Chair
Asian Black Hispanic White Multi LEP SWD F/R Lunch
School 0% 1% 5% 93% 1% 4% 17% 67%
District 1% 6% 8% 82% 3% 4% 17% 58%
Does Not
Meet6.5% 5.4% No 12.0% No 17.1% 23.6% Yes
Meets 66.1% 62.1% Yes 59.0% No 60.4% 54.2% Yes
Meets +
Exceeds93.5% 94.6% No 88.0% No 82.9% 76.4% Yes
2011 Did Not Meet Did Not Meet Equal 2011 4.9% 8.0% Yes
2010 Met Did Not Meet Yes 2010 6.3% 10.6% Yes
2009 Met Did Not Meet Yes 2009 4.5% 9.6% Yes
2008 Met Did Not Meet Yes 2008 6.1% 9.9% Yes
2007 Met Met Equal 2007 7.6% 8.8% Yes
Better
than
District
Charter Initially Approved Carmen Jones
DistrictSchool
0%
2011 CRCT
School
Student Demographics
Better
than
District
Amy Anderson
Academic Achievements
30.8%
Year
Better
Than
District
69.2%
45.8%
5K-5
173
5/10/2010
6/30/2015
Floyd County 31
2456
6%
Mission Statement
Pepperell Primary School will provide a quality education in a positive learning environment.
Year
Key Facts Personnel
Instructional Days
Adequate Yearly Progress Percent Absent > 15 Days
School District
Native American
0%
Better
Than
District
Math Science
District
Pepperell Primary1 Dragon Dr SE
Lindale, GA 30147-1252
706.236.1835
School
ELA / Reading
Grades
Enrollment
Charter System
Current Charter End
District
Better
than
District
DistrictSchool
Dr. John D. Barge, State School Superintendent
Page 115 of 242

Block Yes Multi-age grouping No Career Academy No
Shortened Day No Student/teacher teams Yes International Baccalaureate Program No
Extended Day Yes Grades subdivided into houses Yes Pre-K No
Extended Week Yes Students remain with teacher 2+ years No After School Programs Yes
Extended Year Yes Single gender classes No Community Service No
•
•
•
Goal 1:
Goal 2:
Target:
Goal 3:
Target:
Goal 4:
Target:
706.236.1835
Scheduling Instructional Type/Services Offered
Pepperell Primary
2010-11 Results:
Met/Did Not Meet:
Target:
2010-11 Results:Met Goal – All members of the Pepperell Primary LSGT were present during the 4 scheduled meetings for the 2010-11 school
year
Met/Did Not Meet:
2010-11 Results:
Met/Did Not Meet:
Provide 4 training sessions for all Local School Governance Team members during the 2010-11 year
2010-11 Results: Met Goal – All LSGT members participated in the 4 training sessions provided during the 2010-11 school year
Met/Did Not Meet:
Increase the involvement of all Charter School stakeholders in the school's decision-making process
Conduct a minimum of 4 LSGT meetings at the school level during the 2010-11 year
Decrease the % of students who are absent 15 or more school days
Increase the involvement of all Charter School stakeholders in the school's decision-making process
No more than 5% of students will be absent 15 or more school days during the 2010-2011 year
Met Goal
90% of Econ. Dis. subgroup students will meet/exceed
Assessment of Student Needs based on changing demographics. Data is reviewed at each LSGT meeting.Discussion of community resources available to families
included, but was not limited to: Department of Family and Children's Services, Local School Social Worker, Brighter Day Ministries (snack packs for back packs), Rome
Action Ministries (Food Bank), Georgia 211 Resource Networking, Floyd County Mentor Program.
Academic Goals
Lindale, GA 30147-1252
Met Goal – 92.6% of Econ. Dis. students met/exceeded in Reading/ELA on the spring, 2011 CRCT
Met Goal
1 Dragon Dr SE
Met Goal
Met Goal – 3.4% of all students were absent 15 or more days during the 2010-2011 year
Classroom Arrangements
What makes Pepperell Primary Unique?
Met Goal
Unique Accomplishments
AYP Status Update and Review of Student Data: The PPS AYP Report was provided to each LSGT member. The School Improvement Plan was presented with accent
placed on current and future plans for improvement in the area of third grade mathematics. A list of needed resources was compiled and includes: additional technology
for third grade classrooms (Promethean Boards, Scanners, and Computers), Staff development for third grade Math teachers delivered through participation in and
attendance at the 2011 Georgia Teachers of Mathematics Conference. Additional Mathematics Intervention materials to be used in providing interventions to at-risk
students were also discussed. Research-based intervention programs will be explored.
Approval of Activity Schedule for 2011-2012 school year. Schedules were presented and included Parent Involvement activities that have been scheduled for the
upcoming school year. Title One requirements for parent involvement were presented, reviewed and approved.
Increase the percent of students in the Econ. Dis. subgroup who meet/exceed in Reading/ELA on the CRCT
Dr. John D. Barge, State School Superintendent
Page 116 of 242

5 Year History of CRCT and Student Attendance
Lindale, GA 30147-1252
706.236.1835
Pepperell Primary1 Dragon Dr SE
65.0%
70.0%
75.0%
80.0%
85.0%
90.0%
95.0%
100.0%
2007 2008 2009 2010 2011
CRCT: Mathematics (Percent Passing)
Pepperell Primary
Floyd County
State of Georgia
65.0%
70.0%
75.0%
80.0%
85.0%
90.0%
95.0%
100.0%
2007 2008 2009 2010 2011
CRCT: Reading (Percent Passing)
Pepperell Primary
Floyd County
State of Georgia
65.0%
70.0%
75.0%
80.0%
85.0%
90.0%
95.0%
100.0%
2007 2008 2009 2010 2011
CRCT: English Language Arts (Percent Passing)
Pepperell Primary
Floyd County
State of Georgia
65.0%
70.0%
75.0%
80.0%
85.0%
90.0%
95.0%
100.0%
2007 2008 2009 2010 2011
CRCT: Science (Percent Passing)
Pepperell Primary
Floyd County
State of Georgia
65.0%
70.0%
75.0%
80.0%
85.0%
90.0%
95.0%
100.0%
2007 2008 2009 2010 2011
CRCT: Social Studies (Percent Passing)
Pepperell Primary
Floyd County
State of Georgia
65.0%
70.0%
75.0%
80.0%
85.0%
90.0%
95.0%
100.0%
2007 2008 2009 2010 2011
Percent of Students Missing Less than 15 Days of School
Pepperell Primary
Floyd County
State of Georgia
Dr. John D. Barge, State School Superintendent
Page 117 of 242

Teachers
Administrators
Support Staff
Teacher Attrition Rate
Principal
School Board Chair
Asian Black Hispanic White Multi LEP SWD F/R Lunch
School 0% 5% 7% 84% 4% 4% 23% 67%
District 1% 6% 8% 82% 3% 4% 17% 58%
Does Not
Meet7.5% 5.4% No 12.0% No 25.5% 23.6% No
Meets 63.2% 62.1% Yes 59.0% No 49.9% 54.2% No
Meets +
Exceeds92.5% 94.6% No 88.0% No 74.5% 76.4% No
2011 Did Not Meet Did Not Meet Equal 2011 4.3% 8.0% Yes
2010 Met Did Not Meet Yes 2010 8.2% 10.6% Yes
2009 Met Did Not Meet Yes 2009 6.8% 9.6% Yes
2008 Met Did Not Meet Yes 2008 6.2% 9.9% Yes
2007 Met Met Equal 2007 5.1% 8.8% Yes
Charter Initially Approved Laura Timberlake
DistrictSchool
0%
2011 CRCT
School
Student Demographics
Better
than
District
Better
than
District
Angela Knowles
Academic Achievements
15.7%
Year
Better
Than
District
84.3%
51.7%
4.49K-5
173
5/10/2010
6/30/2015
Floyd County 35.49
1469
6%
Mission Statement
Pepperell Primary School will provide a quality education in a positive learning environment.
Year
Key Facts Personnel
Instructional Days
Adequate Yearly Progress Percent Absent > 15 Days
School District
Native American
0%
Better
Than
District
Math Science
District
Pepperell Elementary270 Hughes Dairy Rd SE
Lindale, GA 30147-1416
706.290.8527
School
ELA / Reading
Grades
Enrollment
Charter System
District
Better
than
District
DistrictSchool
Current Charter End
Dr. John D. Barge, State School Superintendent
Page 118 of 242

Block Yes Multi-age grouping No Career Academy No
Shortened Day No Student/teacher teams Yes International Baccalaureate Program No
Extended Day No Grades subdivided into houses Yes Pre-K No
Extended Week Yes Students remain with teacher 2+ years No After School Programs Yes
Extended Year Yes Single gender classes No Community Service No
•
•
•
Goal 1:
Goal 2:
Target:
Goal 3:
Target:
Goal 4:
Target:
Scheduling Instructional Type/Services Offered
Pepperell Elementary
2010-11 Results:
Met/Did Not Meet:
Target:
2010-11 Results: Conduct a minimum of 4 LSGT meetings at the school level during the 2010-11 year
Met/Did Not Meet:
2010-11 Results:
Met/Did Not Meet:
75.7% of Econ. Dis. subgroup students will meet/exceed
2010-11 Results: Met Goal – 83.2% of Econ. Dis. students met/exceeded in Math on the spring, 2011 CRCT
Met/Did Not Meet:
Increase the involvement of all Charter School stakeholders in the school's decision-making process
Provide 4 training sessions for all Local School Governance Team members during the 2010-11 year
Increase the percent of students in the Econ. Dis. subgroup who meet/exceed in Reading/ELA on the CRCT
Increase the percent of students in the Econ. Dis. subgroup who meet/exceed in math on the CRCT
80% of Econ. Dis. subgroup students will meet/exceed
Met Goal
80% of SWD subgroup students will meet/exceed
Grade 4 teacher won $600 from Lowe's. With this money, Lowes built a shade system for our sunny playground, furnishing labor and material.
Made a significant contribution of non-perishable food items to the Salvation Army and 11 Alive News Can-a-Thon.
Academic Goals
Lindale, GA 30147-1416
Classroom Arrangements
What makes Pepperell Elementary Unique?
Met Goal
Unique Accomplishments
706.290.8527
Recognized as a Title I Distinguished School. Increased the number of students meeting and exceeding standards on the CRCT in Reading
and Math.
N/A
Increase the percent of students in the SWD subgroup who meet/exceed in Reading/ELA on the CRCT
Met Goal – 81.2% of SWD students met/exceeded in Reading on the spring, 2011 CRCT
Met Goal
270 Hughes Dairy Rd SE
Met Goal
Met Goal – 90.1% of Econ. Dis. students met/exceeded in Reading/ELA on the spring, 2011 CRCT
Dr. John D. Barge, State School Superintendent
Page 119 of 242

5 Year History of CRCT and Student Attendance
Lindale, GA 30147-1416
706.290.8527
Pepperell Elementary270 Hughes Dairy Rd SE
65.0%
70.0%
75.0%
80.0%
85.0%
90.0%
95.0%
100.0%
2007 2008 2009 2010 2011
CRCT: Mathematics (Percent Passing)
Pepperell Elementary
Floyd County
State of Georgia
65.0%
70.0%
75.0%
80.0%
85.0%
90.0%
95.0%
100.0%
2007 2008 2009 2010 2011
CRCT: Reading (Percent Passing)
Pepperell Elementary
Floyd County
State of Georgia
65.0%
70.0%
75.0%
80.0%
85.0%
90.0%
95.0%
100.0%
2007 2008 2009 2010 2011
CRCT: English Language Arts (Percent Passing)
Pepperell Elementary
Floyd County
State of Georgia
65.0%
70.0%
75.0%
80.0%
85.0%
90.0%
95.0%
100.0%
2007 2008 2009 2010 2011
CRCT: Science (Percent Passing)
Pepperell Elementary
Floyd County
State of Georgia
65.0%
70.0%
75.0%
80.0%
85.0%
90.0%
95.0%
100.0%
2007 2008 2009 2010 2011
CRCT: Social Studies (Percent Passing)
Pepperell Elementary
Floyd County
State of Georgia
65.0%
70.0%
75.0%
80.0%
85.0%
90.0%
95.0%
100.0%
2007 2008 2009 2010 2011
Percent of Students Missing Less than 15 Days of School
Pepperell Elementary
Floyd County
State of Georgia
Dr. John D. Barge, State School Superintendent
Page 120 of 242

Teachers
Administrators
Support Staff
Teacher Attrition Rate
Principal
School Board Chair
Asian Black Hispanic White Multi LEP SWD F/R Lunch
School 1% 6% 8% 83% 3% 1% 18% 64%
District 1% 6% 8% 82% 3% 4% 17% 58%
Does Not
Meet8.0% 5.4% No 12.0% No 32.1% 23.6% No
Meets 63.3% 62.1% Yes 59.0% Yes 55.4% 54.2% Yes
Meets +
Exceeds92.0% 94.6% No 88.0% No 67.9% 76.4% No
2011 Met Did Not Meet Yes 2011 8.7% 8.0% No
2010 Met Did Not Meet Yes 2010 13.6% 10.6% No
2009 Met Did Not Meet Yes 2009 13.0% 9.6% No
2008 Met Did Not Meet Yes 2008 11.1% 9.9% No
2007 Met Met Equal 2007 10.5% 8.8% No
Charter Initially Approved Becky McCoy
DistrictSchool
0%
2011 CRCT
School
Student Demographics
Better
than
District
Better
than
District
Academic Achievements
15.2%
Year
Better
Than
District
84.8%
60.2%
5/10/2010
6/30/2015
Floyd County 51.98
3747
11%
Key Facts Personnel
Instructional Days
26-8
173
Mission Statement
to provide a quality education for all students by using exemplary educational practices which promote their abilities to become successful members of
society.
Year
Adequate Yearly Progress Percent Absent > 15 Days
School District
School
Native American
0%
Better
Than
District
Math Science
Pepperell Middle School200 Hughes Dairy Rd SE
Lindale, GA 30147-1416
706.236.1849
School
ELA / Reading
Grades
Enrollment
Charter System
District
Better
than
District
District
Mr. Jamie McCord
District
Current Charter End
Dr. John D. Barge, State School Superintendent
Page 121 of 242

Block Yes Multi-age grouping No Career Academy No
Shortened Day No Student/teacher teams Yes International Baccalaureate Program No
Extended Day Yes Grades subdivided into houses Yes Pre-K No
Extended Week Yes Students remain with teacher 2+ years No After School Programs Yes
Extended Year Yes Single gender classes No Community Service No
•
•
•
Goal 1:
Goal 2:
Target:
Goal 3:
Target:
Goal 4:
Target:
Scheduling Instructional Type/Services Offered
Pepperell Middle School
2010-11 Results: Met Goal – 84.4% of all students met or exceeded in Math on the spring, 2011 CRCT
Met/Did Not Meet:
2010-11 Results:
Met/Did Not Meet:
Target:
80% of subgroup students
PMS improved attendance rates from previous year from 13.6% to 8.7%. More parents were informed of the importance of attendance
through newsletters, school calls to the home, and open house format.
2010-11 Results:Met Goal – 80.7% of Econ. Dis. subgroup students met/exceeded in Math on the spring, 2011 CRCT
Met/Did Not Meet:
2010-11 Results:
Met/Did Not Meet:
75.5% of all students
Academic Goals
80% of all students
Increase the percent of students in subgroups who meet/exceed in Math on the CRCT
75.5% of Econ. Dis. subgroup students
Increase the percent of students of subgroup students who meet/exceed in Reading/ELA on the CRCT
Increase the percent of all students who meet/exceed in Math on the CRCT
706.236.1849
Unique Accomplishments
Met Goal
Lindale, GA 30147-1416
Met Goal
200 Hughes Dairy Rd SE
Met Goal
Met Goal – 91.2% of Econ. Dis subgroup students met/exceeded in Reading/ELA on the spring, 2011 CRCT
Classroom Arrangements
What makes Pepperell Middle School Unique?
Met Goal
We also improved our SWD math CRCT 13.6% from the previous year.
N/A
Increase the percent of all students who meet/exceed in Reading/ELA on the CRCT
Met Goal – 92.8% of all students met or exceeded in Reading /ELA on the spring, 2011 CRCT
Dr. John D. Barge, State School Superintendent
Page 122 of 242

5 Year History of CRCT and Student Attendance
Lindale, GA 30147-1416
706.236.1849
Pepperell Middle School200 Hughes Dairy Rd SE
65.0%
70.0%
75.0%
80.0%
85.0%
90.0%
95.0%
100.0%
2007 2008 2009 2010 2011
CRCT: Mathematics (Percent Passing)
Pepperell Middle School
Floyd County
State of Georgia
65.0%
70.0%
75.0%
80.0%
85.0%
90.0%
95.0%
100.0%
2007 2008 2009 2010 2011
CRCT: Reading (Percent Passing)
Pepperell Middle School
Floyd County
State of Georgia
65.0%
70.0%
75.0%
80.0%
85.0%
90.0%
95.0%
100.0%
2007 2008 2009 2010 2011
CRCT: English Language Arts (Percent Passing)
Pepperell Middle School
Floyd County
State of Georgia
65.0%
70.0%
75.0%
80.0%
85.0%
90.0%
95.0%
100.0%
2007 2008 2009 2010 2011
CRCT: Science (Percent Passing)
Pepperell Middle School
Floyd County
State of Georgia
50.0%
55.0%
60.0%
65.0%
70.0%
75.0%
80.0%
85.0%
90.0%
95.0%
100.0%
2007 2008 2009 2010 2011
CRCT: Social Studies (Percent Passing)
Pepperell Middle School
Floyd County
State of Georgia
65.0%
70.0%
75.0%
80.0%
85.0%
90.0%
95.0%
100.0%
2007 2008 2009 2010 2011
Percent of Students Missing Less than 15 Days of School
Pepperell Middle School
Floyd County
State of Georgia
Dr. John D. Barge, State School Superintendent
Page 123 of 242

Teachers
Administrators
Support Staff
Teacher Attrition Rate
Principal
School Board Chair
Asian Black Hispanic White Multi LEP SWD F/ R Lunch
School 1% 7% 5% 85% 2% 1% 16% 52%
District 1% 6% 8% 82% 3% 4% 17% 58%
Does Not
Meet8.7% 9.0% Equal 11.7% Equal 6.2% 6.6% Equal
Meets 43.6% 38.6% Yes 42.3% Yes 32.3% 31.6% Yes
Meets +
Exceeds91.3% 91.1% Yes 88.3% Yes 93.9% 93.4% Yes
2011 Did Not Meet Did Not Meet Equal 2011 81.9% 78.4% Yes
2010 Met Did Not Meet Yes 2010 80.2% 81.0% No
2009 Met Did Not Meet Yes 2009 77.0% 78.1% No
2008 Met Did Not Meet Yes 2008 78.3% 78.1% Yes
2007 Met Met Equal 2007 73.6% 73.1% Yes
Current Charter End
District
Better
than
District
District
Pepperell High School3 Dragon Dr SE
Lindale, GA 30147-1252
706.236.1844
School
ELA
Grades
Enrollment
Charter System
School
Native American
0%
Better
Than
District
Math Science
Adequate Yearly Progress Graduation Rate
School District
Mission Statement
To provide a rigorous and relevant education that prepares students to graduate and become productive citizens and life-long learners.
Year
Key Facts Personnel
Instructional Days
5K-5
173
5/10/2010
6/30/2015
Floyd County 56.94
3867
6%
Dan Bevels
Academic Achievements
11.3%
Year
Better
Than
District
88.7%
42.8%
District
Charter Initially Approved Phil Ray
DistrictSchool
0%
2011 GHSGT
School
Student Demographics
Better
than
District
Better
than
District
Dr. John D. Barge, State School Superintendent
Page 124 of 242

Block Yes Multi-age grouping No Career Academy Yes
Shortened Day No Student/teacher teams Yes International Baccalaureate Program No
Extended Day Yes Grades subdivided into houses Yes Pre-K No
Extended Week Yes Students remain with teacher 2+ years Yes After School Programs No
Extended Year Yes Single gender classes No Community Service Yes
•
•
•
Goal 1:
Goal 2:
Target:
Goal 3:
Target:
Goal 4:
Target:
“Summer Bridge” transition program for at-risk students was held during July and 22 students a week of transition to the ninth grade. Over the
past four years, there have been zero dropouts from the students that attended Summer Bridge. Community involvement is a major financial
part of the Summer Bridge program. The following business partners have been major contributors to Summer Bridge success: Georgia
Power, F & P, Suhner, Outback, Santa Fe, and Kiwanis Club.
N/A
Increase the pass rate of all first time test takers on the GHSGT in English Language Arts
Met Goal – 93.2% of all students passed the GHSGT in English Language Arts on the spring, 2011 Administration
Pepperell High School
Met Goal
3 Dragon Dr SE
Met Goal
Met Goal – 88.4% of all students passed the GHSGT in Math on the spring, 2011 Administration
Classroom Arrangements
What makes Pepperell High School Unique?
Met Goal
Lindale, GA 30147-1252
Increase the involvement of all Charter School stakeholders in the school's decision-making process
706.236.1844
Unique Accomplishments
Met Goal
Academic Goals
90.8% pass rate for all first time test takers
Increase the involvement of all Charter School stakeholders in the school's decision-making process
Conduct a minimum of 4 LSGT meetings at the school level during the 2010-11 year
Increase the pass rate of all first time test takers on the GHSGT in Math
81.2% pass rate for all first time test
Freshman Academy promotion rate was 96.8% - only 7 freshmen failed to earn enough credits to be sophomore. The national failure rate for
ninth graders is 25%.
2010-11 Results: Met Goal – Members of the Pepperell High LSGT were present during the 4 scheduled meetings for the 2010-11 school year
Met/Did Not Meet:
2010-11 Results:
Met/Did Not Meet:
Provide 4 training sessions for all Local School Governance Team members during the 2010-11 year
2010-11 Results: Met Goal – All LSGT members participated in the 4 training sessions provided during the 2010-11 school year
Met/Did Not Meet:
2010-11 Results:
Met/Did Not Meet:
Target:
Scheduling Instructional Type/Services Offered
Dr. John D. Barge, State School Superintendent
Page 125 of 242

3 Dragon Dr SE Pepperell High School
5 Year History of GHSGT and Graduation Rate
Lindale, GA 30147-1252
706.236.1844
65.0%
70.0%
75.0%
80.0%
85.0%
90.0%
95.0%
100.0%
2007 2008 2009 2010 2011
GHSGT: Mathematics (Percent Passing)
Pepperell High School
Floyd County
State of Georgia
65.0%
70.0%
75.0%
80.0%
85.0%
90.0%
95.0%
100.0%
2007 2008 2009 2010 2011
GHSGT: English Language Arts (Percent Passing)
Pepperell High School
Floyd County
State of Georgia
65.0%
70.0%
75.0%
80.0%
85.0%
90.0%
95.0%
100.0%
2007 2008 2009 2010 2011
GHSGT: Science (Percent Passing)
Pepperell High School
Floyd County
State of Georgia
65.0%
70.0%
75.0%
80.0%
85.0%
90.0%
95.0%
100.0%
2007 2008 2009 2010 2011
GHSGT: Social Studies (Percent Passing)
Pepperell High School
Floyd County
State of Georgia
65.00%
70.00%
75.00%
80.00%
85.00%
90.00%
95.00%
100.00%
2007 2008 2009 2010 2011
Graduation Rate
Pepperell High School
Floyd County
State of Georgia
Dr. John D. Barge, State School Superintendent
Page 126 of 242

Elementary
Charter Term Middle
High School
Total Schools
2007 2008 2009 2010 2011
Yes Yes Yes No No
2011 8.0% 8.8% Yes 2011 87.3% 80.9% Yes
2010 7.5% 9.7% Yes 2010 81.3% 80.8% Yes
2009 6.9% 8.7% Yes 2009 73.3% 78.9% No
2008 10.4% 9.5% No 2008 77.1% 75.4% Yes
2007 8.2% 10.0% Yes 2007 80.7% 72.3% Yes
12.0% 7.9% No 5.0% 8.3% Yes
62.5% 56.1% Yes 40.6% 37.0% Yes
88.0% 92.1% No 95.0% 91.7% Yes
21.6% 15.3% No 7.5% 15.5% Yes
50.7% 50.7% No 48.3% 37.5% Yes
78.4% 84.7% No 92.5% 84.5% Yes
Number of SchoolsKey Facts
8/1/2008
5
6/12/2008
6/30/2013
Meets + Exceeds
State
508 Oak Street NW
Gainesville, GA 30501-3506
770.536.5275
Better
Than State
Charter End
Better than
State
Better than
State
State
Does Not Meet
Year System StateYear System
Does Not Meet
Meets
Better
Than State
ELA
Meets + Exceeds
State
2011 GHSGT
Meets
5
Graduation Rate
Opened
2
Better
than State
ELA / Reading
2011 CRCT
Percent Absent > 15 Days
Charter Approved
8
Meets + Exceeds
Meets
Meets + Exceeds
Academic Achievements
Math
System
System
1
StateSystem
Gainesville City School System
Adequate Yearly Progress
State
Does Not Meet
Better
than StateSystem
Math
Does Not Meet
Meets
Dr. John D. Barge, State School Superintendent
Page 127 of 242

Asian Black Hispanic White Multi LEP SWD F/ R Lunch
System 3.2% 19.7% 55.5% 19.5% 1.9% 32.6% 9.9% 77.2%
State 3.0% 37.0% 12.0% 44.0% 3.0% 6.0% 10.0% 57.0%
1)
2)
3)
4)
5)
6)
2007 2008 2009 2010 2011
Yes Yes Yes Yes Yes
N/A N/A N/A N/A N/A
Yes Yes Yes Yes Yes
Yes Yes Yes Yes Yes
N/A N/A N/A N/A N/A
Yes Yes Yes Yes Yes
Yes Yes Yes Yes Yes
Yes Yes Yes Yes Yes
Charter System Schools
Charter System Strategic Goals:
Gainesville, GA 30501-3506
Gainesville High School
Gainesville City School System
Gainesville Exploration Academy
Enota Multiple Intelligences Academy
Wood's Mill Academy
508 Oak Street NW
Exhibit essenital life-styles.
Charter System Schools Adequate Yearly Progress
770.536.5275
New Holland Core Knowledge Academy
Gainesville Middle School
Demonstrate academic competency by focusing on instruction.
By expecting and celebrating excellence to be self-reliant individuals.
Exhibit citizenship in a disciplined learning environment.
Demonstrate communication skills while communicating openly and honestly.
0.3%
0.0%
Student Demographics
Native American
To exhibit citizenship and sound character in a dynamic multi-cultural community, state and world.
Fair Street International Baccalaureate World School
Centennial Arts Academy
Dr. John D. Barge, State School Superintendent
Page 128 of 242

Gainesville, GA 30501-3506
5 Year History CRCT
Gainesville City School System508 Oak Street NW
770.536.5275
65.0%
70.0%
75.0%
80.0%
85.0%
90.0%
95.0%
100.0%
2007 2008 2009 2010 2011
CRCT: Math(Percent Passing)
Gainesville City School System
State of Georgia
65.0%
70.0%
75.0%
80.0%
85.0%
90.0%
95.0%
100.0%
2007 2008 2009 2010 2011
CRCT: Reading/ELA(Percent Passing)
Gainesville City School System
State of Georgia
60.0%
65.0%
70.0%
75.0%
80.0%
85.0%
90.0%
95.0%
100.0%
2007 2008 2009 2010 2011
CRCT: Social Studies(Percent Passing)
Gainesville City School System
State of Georgia
60.0%
65.0%
70.0%
75.0%
80.0%
85.0%
90.0%
95.0%
100.0%
2007 2008 2009 2010 2011
CRCT: Science(Percent Passing)
Gainesville City School System
State of Georgia
Dr. John D. Barge, State School Superintendent
Page 129 of 242

Gainesville, GA 30501-3506Gainesville City School System508 Oak Street NW
770.536.5275
5 Year History GHSGT and Graduation Rate
65.0%
70.0%
75.0%
80.0%
85.0%
90.0%
95.0%
100.0%
2007 2008 2009 2010 2011
GHSGT: English Language Arts(Percent Passing)
Gainesville City School System
State of Georgia
65.0%
70.0%
75.0%
80.0%
85.0%
90.0%
95.0%
100.0%
2007 2008 2009 2010 2011
GHSGT: Math(Percent Passing)
Gainesville City School System
State of Georgia
65.0%
70.0%
75.0%
80.0%
85.0%
90.0%
95.0%
100.0%
2007 2008 2009 2010 2011
GHSGT: Science(Percent Passing)
Gainesville City School System
State of Georgia
65.0%
70.0%
75.0%
80.0%
85.0%
90.0%
95.0%
100.0%
2007 2008 2009 2010 2011
GHSGT: Social Studies(Percent Passing)
Gainesville City School System
State of Georgia
65.0%
70.0%
75.0%
80.0%
85.0%
90.0%
95.0%
100.0%
2007 2008 2009 2010 2011
High School Graduation Rate
Gainesville City School System
State of Georgia
Dr. John D. Barge, State School Superintendent
Page 130 of 242

Teachers
Administrators
Support Staff
Teacher Attrition Rate
Principal
School Board Chair
Asian Black Hispanic White Multi LEP SWD F/ R Lunch
School 5% 14% 41% 37% 3% 32% 8% 60%
District 3% 20% 55% 19% 2% 33% 10% 77%
Does Not
Meet5.4% 12.0% Yes 21.6% Yes 21.4% 32.9% Yes
Meets 52.5% 62.5% No 50.7% No 44.7% 46.5% No
Meets +
Exceeds94.6% 88.0% Yes 78.4% Yes 78.6% 67.1% Yes
2011 Met Did Not Meet Yes 2011 9.0% 8.0% No
2010 Met Did Not Meet Yes 2010 5.7% 7.5% Yes
2009 Met Met Equal 2009 5.8% 6.9% Yes
2008 Met Met Equal 2008 5.1% 10.4% Yes
2007 Met Met Equal 2007 4.2% 8.2% Yes
Charter Initially Approved Charlene Williams
DistrictSchool
0%
2011 CRCT
School
Student Demographics
Better
than
District
Better
than
District
Academic Achievements
12.2%
Year
Better
Than
District
87.8%
38.6%
175
6/12/2008
6/30/2013
Gainesville City 55.97
2858
3%
Mission Statement
We will inspire, nurture, challenge, and prepare our students as we educate them to be successful in a 21st Century Global Society.
Year
Key Facts Personnel
Grades
Enrollment
Charter System
Adequate Yearly Progress Percent Absent > 15 Days
School District
School
Native American
0%
Better
Than
District
Math Science
Centennial Arts Academy852 Century Pl
Gainesville, GA 30501-3065
770.287.2044
School
ELA / Reading
Instructional Days
2K-5
District
Better
than
District
District
Shannon Ball
District
Current Charter End
Dr. John D. Barge, State School Superintendent
Page 131 of 242

Block No Multi-age grouping Yes Career Academy No
Shortened Day No Student/teacher teams Yes International Baccalaureate Program No
Extended Day No Grades subdivided into houses Yes Pre-K No
Extended Week No Students remain with teacher 2+ years Yes After School Programs Yes
Extended Year No Single gender classes No Community Service Yes
•
•
•
Goal 1:
Goal 2:
Target:
Goal 3:
Target:
Goal 4:
Target:
Scheduling Instructional Type/Services Offered
Met/Did Not Meet:
2010-11 Results:
Met/Did Not Meet:
Target:
Met/Did Not Meet:
2010-11 Results:
Met/Did Not Meet:
91% will meet or exceed on Grade 3 Reading CRCT
2010-11 Results: 94% met or exceeded on Grade 3 Reading on CRCT
91% will meet or exceed on 4th Grade ELA CRCT
Georgia Title I School of Distinction honrors were earned.
2010-11 Results: 49% exceeded in Grades 3-5 on the Math CRCT
Academic Goals
91% will meet or exceed on CRCT
Increase the percentage of students in grades 3-5 who exceed on the Math CRCT
40% will exceed on the Math CRCT in Grades 3-5
Improve performance on 4th Grade ELA CRCT
Improve Grade 3 Reading scores on CRCT
770.287.2044
Unique Accomplishments
Met Goal
Gainesville, GA 30501-3065
Met Goal
852 Century Pl
Met Goal
94% met or exceeded on 4th Grade ELA CRCT
Classroom Arrangements
What makes Centennial Arts Academy Unique?
Met Goal
Centennial Arts Academy
Centennial was the Univision Channel 34 School Environmental Awareness Award winner.
Students exceeding on the CRCT increased in 2011.
Improve performance on the Grade 3 ELA CRCT
93% met or exceeded on CRCT
Dr. John D. Barge, State School Superintendent
Page 132 of 242
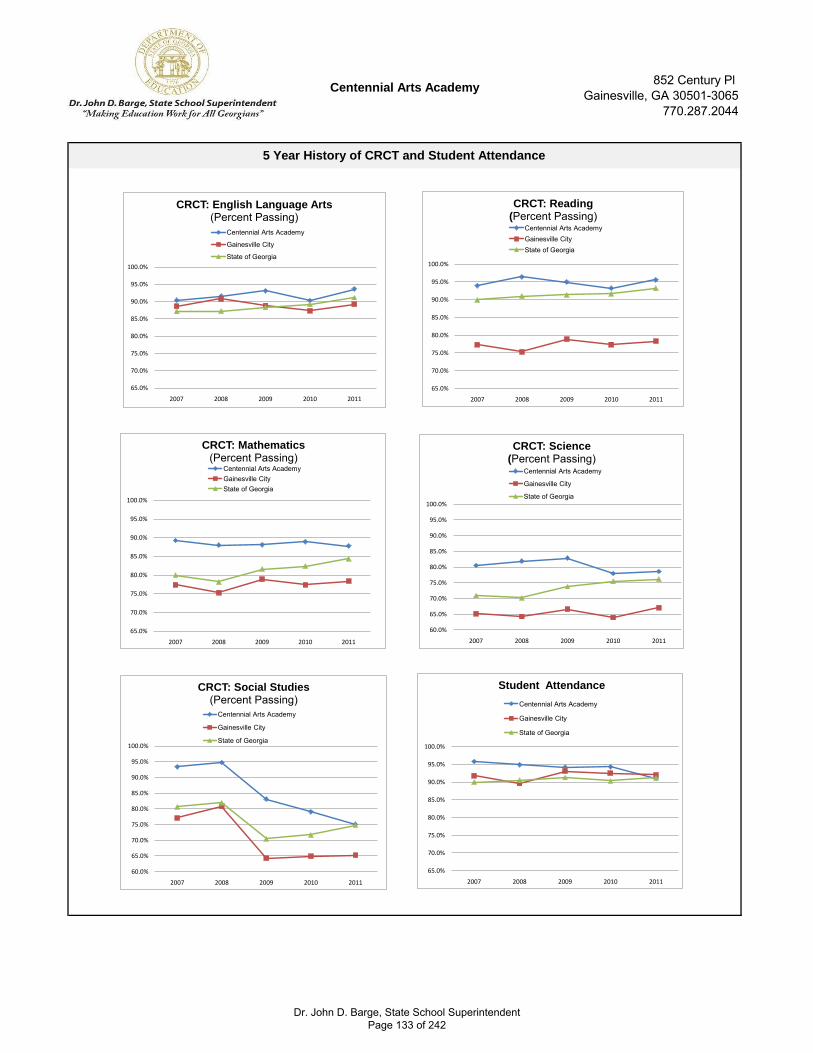
770.287.2044
Gainesville, GA 30501-3065
5 Year History of CRCT and Student Attendance
Centennial Arts Academy852 Century Pl
65.0%
70.0%
75.0%
80.0%
85.0%
90.0%
95.0%
100.0%
2007 2008 2009 2010 2011
CRCT: Mathematics (Percent Passing)
Centennial Arts Academy
Gainesville City
State of Georgia
65.0%
70.0%
75.0%
80.0%
85.0%
90.0%
95.0%
100.0%
2007 2008 2009 2010 2011
CRCT: Reading (Percent Passing)
Centennial Arts Academy
Gainesville City
State of Georgia
65.0%
70.0%
75.0%
80.0%
85.0%
90.0%
95.0%
100.0%
2007 2008 2009 2010 2011
CRCT: English Language Arts (Percent Passing)
Centennial Arts Academy
Gainesville City
State of Georgia
60.0%
65.0%
70.0%
75.0%
80.0%
85.0%
90.0%
95.0%
100.0%
2007 2008 2009 2010 2011
CRCT: Science (Percent Passing)
Centennial Arts Academy
Gainesville City
State of Georgia
60.0%
65.0%
70.0%
75.0%
80.0%
85.0%
90.0%
95.0%
100.0%
2007 2008 2009 2010 2011
CRCT: Social Studies (Percent Passing)
Centennial Arts Academy
Gainesville City
State of Georgia
65.0%
70.0%
75.0%
80.0%
85.0%
90.0%
95.0%
100.0%
2007 2008 2009 2010 2011
Student Attendance
Centennial Arts Academy
Gainesville City
State of Georgia
Dr. John D. Barge, State School Superintendent
Page 133 of 242

Teachers
Administrators
Support Staff
Teacher Attrition Rate
Principal
School Board Chair
Asian Black Hispanic White Multi LEP SWD F/R Lunch
School 3% 21% 39% 35% 2% 26% 8% 67%
District 3% 20% 55% 19% 2% 33% 10% 77%
Does Not
Meet10.7% 12.0% Yes 21.6% Yes 27.2% 32.9% Yes
Meets 59.3% 62.5% No 50.7% Yes 44.0% 46.5% No
Meets +
Exceeds89.3% 88.0% Yes 78.4% Yes 72.8% 67.1% Yes
2011 Met Did Not Meet Yes 2011 6.6% 8.0% Yes
2010 Met Did Not Meet Yes 2010 8.5% 7.5% No
2009 Met Met Equal 2009 5.9% 6.9% Yes
2008 Met Met Equal 2008 6.8% 10.4% Yes
2007 Met Met Equal 2007 7.8% 8.2% Yes
Charter Initially Approved Matt Maynor
DistrictSchool
0%
2011 CRCT
School
Student Demographics
Better
than
District
Better
than
District
19.9%
Year
Better
Than
District
80.1%
51.4%
3K-5
175
6/12/2008
6/30/2013
Gainesville City 49.99
2794
2%
Mission Statement
The mission of Enota Multiple Intelligences Academy is to contribute to the quality of our future through diversified learning for our students. We strive teo
thrive in our partnership with our community, and employ a highly qualified staff, faculty, and administration.
Year
Key Facts Personnel
Instructional Days
Adequate Yearly Progress Percent Absent > 15 Days
School District
School
Native American
0%
Better
Than
District
Math Science
Enota Multiple Intelligences Academy1340 Enota Ave NE
Gainesville, GA 30501-1918
770.532.7711
School
ELA / Reading
Grades
Enrollment
Charter System
District
Better
than
District
District District
Current Charter End N/A
Academic Achievements
Dr. John D. Barge, State School Superintendent
Page 134 of 242
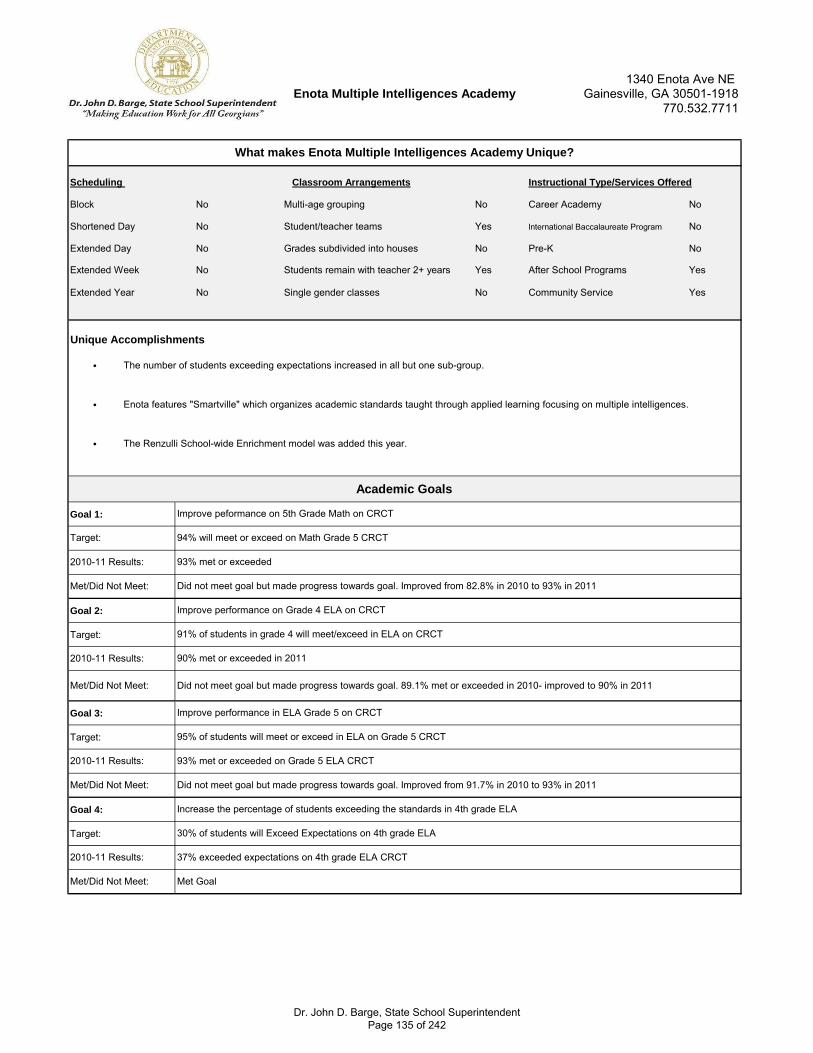
Block No Multi-age grouping No Career Academy No
Shortened Day No Student/teacher teams Yes International Baccalaureate Program No
Extended Day No Grades subdivided into houses No Pre-K No
Extended Week No Students remain with teacher 2+ years Yes After School Programs Yes
Extended Year No Single gender classes No Community Service Yes
•
•
•
Goal 1:
Goal 2:
Target:
Goal 3:
Target:
Goal 4:
Target:
Scheduling Instructional Type/Services Offered
Enota Multiple Intelligences Academy
2010-11 Results:
Met/Did Not Meet:
Target:
2010-11 Results: 37% exceeded expectations on 4th grade ELA CRCT
Met/Did Not Meet:
2010-11 Results:
Met/Did Not Meet:
95% of students will meet or exceed in ELA on Grade 5 CRCT
2010-11 Results: 93% met or exceeded on Grade 5 ELA CRCT
Met/Did Not Meet:
Increase the percentage of students exceeding the standards in 4th grade ELA
30% of students will Exceed Expectations on 4th grade ELA
Improve performance on Grade 4 ELA on CRCT
91% of students in grade 4 will meet/exceed in ELA on CRCT
The number of students exceeding expectations increased in all but one sub-group.
Improve performance in ELA Grade 5 on CRCT
770.532.7711
Unique Accomplishments
Did not meet goal but made progress towards goal. Improved from 82.8% in 2010 to 93% in 2011
Gainesville, GA 30501-1918
Met Goal
1340 Enota Ave NE
Did not meet goal but made progress towards goal. Improved from 91.7% in 2010 to 93% in 2011
90% met or exceeded in 2011
Classroom Arrangements
What makes Enota Multiple Intelligences Academy Unique?
Did not meet goal but made progress towards goal. 89.1% met or exceeded in 2010- improved to 90% in 2011
Enota features "Smartville" which organizes academic standards taught through applied learning focusing on multiple intelligences.
The Renzulli School-wide Enrichment model was added this year.
Improve peformance on 5th Grade Math on CRCT
93% met or exceeded
Academic Goals
94% will meet or exceed on Math Grade 5 CRCT
Dr. John D. Barge, State School Superintendent
Page 135 of 242

5 Year History of CRCT and Student Attendance
Gainesville, GA 30501-1918
770.532.7711
Enota Multiple Intelligences Academy
1340 Enota Ave NE
65.0%
70.0%
75.0%
80.0%
85.0%
90.0%
95.0%
100.0%
2007 2008 2009 2010 2011
CRCT: Mathematics (Percent Passing) Enota Multiple Intelligences Academy
Gainesville City
State of Georgia
65.0%
70.0%
75.0%
80.0%
85.0%
90.0%
95.0%
100.0%
2007 2008 2009 2010 2011
CRCT: Reading (Percent Passing)Enota Multiple Intelligences Academy
Gainesville City
State of Georgia
65.0%
70.0%
75.0%
80.0%
85.0%
90.0%
95.0%
100.0%
2007 2008 2009 2010 2011
CRCT: English Language Arts (Percent Passing)
Enota Multiple Intelligences Academy
Gainesville City
State of Georgia
60.0%
65.0%
70.0%
75.0%
80.0%
85.0%
90.0%
95.0%
100.0%
2007 2008 2009 2010 2011
CRCT: Science (Percent Passing)
Enota Multiple Intelligences Academy
Gainesville City
State of Georgia
60.0%
65.0%
70.0%
75.0%
80.0%
85.0%
90.0%
95.0%
100.0%
2007 2008 2009 2010 2011
CRCT: Social Studies (Percent Passing)Enota Multiple Intelligences Academy
Gainesville City
State of Georgia
65.0%
70.0%
75.0%
80.0%
85.0%
90.0%
95.0%
100.0%
2007 2008 2009 2010 2011
Percent of Students Missing Less than 15 Days of School
Enota Multiple Intelligences Academy
Gainesville City
State of Georgia
Dr. John D. Barge, State School Superintendent
Page 136 of 242

Teachers
Administrators
Support Staff
Teacher Attrition Rate
Principal
School Board Chair
Asian Black Hispanic White Multi LEP SWD F/R Lunch
School 4% 11% 77% 6% 2% 59% 7% 87%
District 3% 20% 55% 19% 2% 33% 10% 77%
Does Not
Meet12.7% 12.0% No 21.6% No 39.0% 32.9% No
Meets 69.9% 62.5% Yes 50.7% No 48.0% 46.5% Yes
Meets +
Exceeds87.3% 88.0% No 78.4% No 61.0% 67.1% No
2011 Met Did Not Meet Yes 2011 6.1% 8.0% Yes
2010 Met Did Not Meet Yes 2010 7.4% 7.5% Yes
2009 Met Met Equal 2009 2.9% 6.9% Yes
2008 Met Met Equal 2008 7.0% 10.4% Yes
2007 Met Met Equal 2007 6.7% 8.2% Yes
District
Current Charter End
District
Better
than
District
District
Gainesville Exploration Academy1145 McEver Rd
Gainesville, GA 30504-3933
770.287.1223
School
ELA / Reading
Grades
Enrollment
Charter System
School
Native American
0%
Better
Than
District
Math Science
Adequate Yearly Progress Percent Absent > 15 Days
School District
Mission Statement
At Gainesville Exploration, we will inspire, nurture, challenge, and prepare our students as we educate them to be successful in a 21st Century global
society.
Year
Key Facts Personnel
Instructional Days
26-8
175
6/12/2008
6/30/2013
Gainesville City 56.5
2950
1%
Kerri Palmer
Academic Achievements
22.4%
Year
Better
Than
District
77.6%
48.1%
Charter Initially Approved Priscilla Collins
DistrictSchool
0%
2011 CRCT
School
Student Demographics
Better
than
District
Better
than
District
Dr. John D. Barge, State School Superintendent
Page 137 of 242

Block No Multi-age grouping Yes Career Academy No
Shortened Day No Student/teacher teams Yes International Baccalaureate Program No
Extended Day No Grades subdivided into houses Yes Pre-K No
Extended Week No Students remain with teacher 2+ years Yes After School Programs Yes
Extended Year No Single gender classes No Community Service Yes
•
•
•
Goal 1:
Goal 2:
Target:
Goal 3:
Target:
Goal 4:
Target:
The number of students exceeding expectations on the CRCT increased in all but two sub-groups.
N/A
Improve performance on the 5th grade ELA CRCT
98% met or exceeded on the ELA CRCT
Met Goal
1145 McEver Rd
Met Goal
99% met or exceeded on the Math CRCT in grade 5
Classroom Arrangements
What makes Gainesville Exploration Academy Unique?
Met Goal
Gainesville, GA 30504-3933
Improve 3rd Grade performance in Reading on CRCT
770.287.1223
Unique Accomplishments
Met Goal
Academic Goals
95% of students will meet or exceed on the ELA CRCT
Increase the number of 5th grade students exceeding in Math on CRCT
30% of grade 5 students will exceed on Math CRCT
Improve performance on the 5th grade Math CRCT
94% of 5th grade students will meet or exceed on the Math CRCT
Gainesville Exploration recieved Honorable Mention in 2010 as a High Flying School by the National Youth-at-Risk Council.
2010-11 Results: 44% of grade 5 students exceeded expectations on Math CRCT
Met/Did Not Meet:
2010-11 Results:
Met/Did Not Meet:
91% of students will meet or exceed on Reading CRCT in grade 3
2010-11 Results: 98% met or exceeded on Reading CRCT in grade 3
Met/Did Not Meet:
2010-11 Results:
Met/Did Not Meet:
Target:
Scheduling Instructional Type/Services Offered
Gainesville Exploration Academy
Dr. John D. Barge, State School Superintendent
Page 138 of 242

5 Year History of CRCT and Student Attendance
Gainesville, GA 30504-3933
770.287.1223
Gainesville Exploration Academy
1145 McEver Rd
65.0%
70.0%
75.0%
80.0%
85.0%
90.0%
95.0%
100.0%
2007 2008 2009 2010 2011
CRCT: Mathematics (Percent Passing)
Gainesville Exploration Academy
Gainesville City
State of Georgia
65.0%
70.0%
75.0%
80.0%
85.0%
90.0%
95.0%
100.0%
2007 2008 2009 2010 2011
CRCT: Reading (Percent Passing)Gainesville Exploration Academy
Gainesville City
State of Georgia
65.0%
70.0%
75.0%
80.0%
85.0%
90.0%
95.0%
100.0%
2007 2008 2009 2010 2011
CRCT: English Language Arts (Percent Passing)
Gainesville Exploration Academy
Gainesville City
State of Georgia
50.0%
55.0%
60.0%
65.0%
70.0%
75.0%
80.0%
85.0%
90.0%
95.0%
100.0%
2007 2008 2009 2010 2011
CRCT: Science (Percent Passing)
Gainesville Exploration Academy
Gainesville City
State of Georgia
50.0%
55.0%
60.0%
65.0%
70.0%
75.0%
80.0%
85.0%
90.0%
95.0%
100.0%
2007 2008 2009 2010 2011
CRCT: Social Studies (Percent Passing)Gainesville Exploration Academy
Gainesville City
State of Georgia
65.0%
70.0%
75.0%
80.0%
85.0%
90.0%
95.0%
100.0%
2007 2008 2009 2010 2011
Percent of Students Missing Less than 15 Days of School
Gainesville Exploration Academy
Gainesville City
State of Georgia
Dr. John D. Barge, State School Superintendent
Page 139 of 242

Teachers
Administrators
Support Staff
Teacher Attrition Rate
Principal
School Board Chair
Asian Black Hispanic White Multi LEP SWD F/R Lunch
School 1% 29% 66% 4% 1% 50% 11% 96%
District 3% 20% 55% 19% 2% 33% 10% 77%
Does Not
Meet21.5% 12.0% No 21.6% No 54.1% 32.9% No
Meets 66.2% 62.5% Yes 50.7% No 38.9% 46.5% No
Meets +
Exceeds78.5% 88.0% No 78.4% No 45.9% 67.1% No
2011 Met Did Not Meet Yes 2011 7.5% 8.0% Yes
2010 Met Did Not Meet Yes 2010 7.1% 7.5% Yes
2009 Met Met Equal 2009 7.8% 6.9% No
2008 Met Met Equal 2008 4.4% 10.4% Yes
2007 Met Met Equal 2007 4.0% 8.2% Yes
Fair Street International Baccalaureate World School695 Fair St
Gainesville, GA 30501-4699
770.536.5295
0%
Kelly Fuchs
District
Better
than
District
District
Current Charter End
School
ELA / Reading
DistrictSchool
Native American
0%
Better
Than
District
Math Science
Better
than
District
Better
than
District
Adequate Yearly Progress Percent Absent > 15 Days
School District
Enrollment
Charter System
Mission Statement
Fair Street strives to become internationally minded each and every day in all that we do and learn.
Year
Key Facts Personnel
Instructional Days
Academic Achievements
41.3%
Year
Gainesville City 47.98
2658
Grades
Charter Initially Approved William Campbell
DistrictSchool
0%
3K-5
175
6/12/2008
6/30/2013
2011 CRCT
School
Student Demographics
58.7%
45.4%
Better
Than
District
Dr. John D. Barge, State School Superintendent
Page 140 of 242

Block No Multi-age grouping Yes Career Academy No
Shortened Day No Student/teacher teams Yes International Baccalaureate Program Yes
Extended Day No Grades subdivided into houses No Pre-K No
Extended Week No Students remain with teacher 2+ years Yes After School Programs Yes
Extended Year No Single gender classes No Community Service Yes
•
•
•
Goal 1:
Goal 2:
Target:
Goal 3:
Target:
Goal 4:
Target:
Fair Street International Baccalaureate World School
Met Goal
695 Fair St Gainesville, GA 30501-4699
770.536.5295
Did not meet goal but made progress towards goal. Improved from 74% in 2010 to 85% in 2011
76% of students met or exceeded in ELA Grade 3
There was an increase in the number of students exceedinge expectations in all areas of the CRCT in 2011.
N/A
Improve Reading Achievement on the Grade 3 CRCT
Classroom Arrangements
What makes Fair Street International Baccalaureate World School Unique?
Did not meet goal but made progress towards goal.Increased from 64% in 2010 to 76% in 2011- number of ELL students
increased
87% met or exceeded in Grade 3 Reading
Fair Street achieved AYP for ten consecutive years. The school is one of twenty-two authorized IB Primary Years Programs in the state. Fair
Street operates as a full-service Community School and Professional Development School for Brenau University.
Unique Accomplishments
Did not meet goal but made progress towards goal. Increased from 83% in 2010 to 87% in 2011
Academic Goals
Increase the number of students in grades 3-5 who exceed expectations ont he ELA CRCT
Increase by 5%
Improve ELA in Grade 3 on the CRCT
83% of students will meet or exceed in ELA Grade 3
91% will meet or exceed in Grade 3 Reading
20% of students exceeded expectations in ELA Grade 5
Improve performance on Grade 5 Reading CRCT
Met/Did Not Meet:
2010-11 Results:
Met/Did Not Meet:
94% of students will meet or exceed
2010-11 Results: 85% met or exceeded
Met/Did Not Meet:
2010-11 Results:
2010-11 Results:
Met/Did Not Meet:
Target:
Scheduling Instructional Type/Services Offered
Dr. John D. Barge, State School Superintendent
Page 141 of 242

Fair Street International Baccalaureate World School
695 Fair St
5 Year History of CRCT and Student Attendance
Gainesville, GA 30501-4699
770.536.5295
50.0%
55.0%
60.0%
65.0%
70.0%
75.0%
80.0%
85.0%
90.0%
95.0%
100.0%
2007 2008 2009 2010 2011
CRCT: Mathematics (Percent Passing)
Fair Street International Baccalaureate World School
Gainesville City
State of Georgia
65.0%
70.0%
75.0%
80.0%
85.0%
90.0%
95.0%
100.0%
2007 2008 2009 2010 2011
CRCT: Reading (Percent Passing)
Fair Street International Baccalaureate World School
Gainesville City
State of Georgia
65.0%
70.0%
75.0%
80.0%
85.0%
90.0%
95.0%
100.0%
2007 2008 2009 2010 2011
CRCT: English Language Arts (Percent Passing)
Fair Street International Baccalaureate World School
Gainesville City
State of Georgia
40.0%
45.0%
50.0%
55.0%
60.0%
65.0%
70.0%
75.0%
80.0%
85.0%
90.0%
95.0%
100.0%
2007 2008 2009 2010 2011
CRCT: Science (Percent Passing)
Fair Street International Baccalaureate World School
Gainesville City
State of Georgia
40.0%
45.0%
50.0%
55.0%
60.0%
65.0%
70.0%
75.0%
80.0%
85.0%
90.0%
95.0%
100.0%
2007 2008 2009 2010 2011
CRCT: Social Studies (Percent Passing)
Fair Street International Baccalaureate World School
Gainesville City
State of Georgia
65.0%
70.0%
75.0%
80.0%
85.0%
90.0%
95.0%
100.0%
2007 2008 2009 2010 2011
Percent of Students Missing Less than 15 Days of School
Fair Street International Baccalaureate World School
Gainesville City
State of Georgia
Dr. John D. Barge, State School Superintendent
Page 142 of 242

Teachers
Administrators
Support Staff
Teacher Attrition Rate
Principal
School Board Chair
Asian Black Hispanic White Multi LEP SWD F/R Lunch
School 3% 22% 53% 20% 2% 21% 11% 78%
District 3% 20% 55% 19% 2% 33% 10% 77%
Does Not
Meet12.4% 12.0% No 21.6% No 33.2% 32.9% No
Meets 62.1% 62.5% No 50.7% Yes 47.9% 46.5% Yes
Meets +
Exceeds87.6% 88.0% No 78.4% No 66.8% 67.1% No
2011 Did Not Meet Did Not Meet Equal 2011 9.6% 8.0% No
2010 Met Did Not Meet Yes 2010 7.4% 7.5% Yes
2009 Did Not Meet Met No 2009 1.9% 6.9% Yes
2008 N/A Met N/A 2008 N/A 10.4% N/A
2007 N/A Met N/A 2007 N/A 8.2% N/A
District
Current Charter End
District
Better
than
District
District
Gainesville Middle School1581 Community Way
Gainesville, GA 30501
770.534.4237
School
ELA / Reading
Grades
Enrollment
Charter System
School
Native American
0%
Better
Than
District
Math Science
Adequate Yearly Progress Percent Absent > 15 Days
School District
Mission Statement
The mission of Gainesville Middle School is to promote diversified learning for all students and to create life-long learning and responsibility. Gainesville
Middle will provide a rigorous curriculum in a nurturing learning environment while encouraging unity among diverse cultures and involving all stakeholders
in the achievement of school goals.
Year
Key Facts Personnel
Instructional Days
46-8
175
6/12/2008
6/30/2013
Gainesville City 87.75
31396
7%
Sheryl Whitson
Academic Achievements
22.1%
Year
Better
Than
District
77.9%
55.8%
Charter Initially Approved Kenneth Edward Martin
DistrictSchool
0%
2011 CRCT
School
Student Demographics
Better
than
District
Better
than
District
Dr. John D. Barge, State School Superintendent
Page 143 of 242

Block No Multi-age grouping Yes Career Academy No
Shortened Day No Student/teacher teams Yes International Baccalaureate Program No
Extended Day No Grades subdivided into houses Yes Pre-K No
Extended Week No Students remain with teacher 2+ years Yes After School Programs Yes
Extended Year No Single gender classes Yes Community Service Yes
•
•
•
Goal 1:
Goal 2:
Target:
Goal 3:
Target:
Goal 4:
Target:
Thirty four students participated in the Duke TIP Program with 6 State Honorees and 1 Grand Recognition by Duke University.
N/A
Improve performance on Grade 8 Reading on CRCT
92% of students met or exceeded on Grade 8 Reading CRCT
Met Goal
1581 Community Way
Did not meet goal but made progress towards goal. Improved by 5%- 2010 62% met or exceeded; in 2011 67% met or exceeded
90% met or exceeded on Grade 6 Reading CRCT
Classroom Arrangements
What makes Gainesville Middle School Unique?
Did not meet goal but made progress towards goal. Did Not Meet: Improved from 85% meeting and exceeding in 2010 to 91% in
2011
Gainesville, GA 30501
Improve performance on Grade 6 Science CRCT
770.534.4237
Unique Accomplishments
Met Goal
Academic Goals
91% of Grade 8 students will meet or exceed on Reading CRCT
Improve the number of Students with Disabilities who exceed on the Math CRCT
5% of SWD students in Grades 6-8 will exceed on the Math CRCT
Improve performance on Grade 6 Reading on CRCT
91% will meet or exceed on Grade 6 Reading CRCT
One hundred percent of students taking English I for high school credit passed the End of Course Assessments.
2010-11 Results: 7% of students in Grades 6-8 exceeded on the Math CRCT
Met/Did Not Meet:
2010-11 Results:
Met/Did Not Meet:
76% will meet or exceed on Grade 6 Science CRCT
2010-11 Results: 67% met or exceeded on grade 6 Science CRCT
Met/Did Not Meet:
2010-11 Results:
Met/Did Not Meet:
Target:
Scheduling Instructional Type/Services Offered
Gainesville Middle School
Dr. John D. Barge, State School Superintendent
Page 144 of 242

5 Year History of CRCT and Student Attendance
Gainesville, GA 30501
770.534.4237
Gainesville Middle School
1581 Community Way
65.0%
70.0%
75.0%
80.0%
85.0%
90.0%
95.0%
100.0%
2007 2008 2009 2010 2011
CRCT: Mathematics (Percent Passing)
Gainesville Middle School
Gainesville City
State of Georgia
65.0%
70.0%
75.0%
80.0%
85.0%
90.0%
95.0%
100.0%
2007 2008 2009 2010 2011
CRCT: Reading (Percent Passing)
Gainesville Middle School
Gainesville City
State of Georgia
65.0%
70.0%
75.0%
80.0%
85.0%
90.0%
95.0%
100.0%
2007 2008 2009 2010 2011
CRCT: English Language Arts (Percent Passing)
Gainesville Middle School
Gainesville City
State of Georgia
55.0%
60.0%
65.0%
70.0%
75.0%
80.0%
85.0%
90.0%
95.0%
100.0%
2007 2008 2009 2010 2011
CRCT: Science (Percent Passing)
Gainesville Middle School
Gainesville City
State of Georgia
60.0%
65.0%
70.0%
75.0%
80.0%
85.0%
90.0%
95.0%
100.0%
2007 2008 2009 2010 2011
CRCT: Social Studies (Percent Passing)
Gainesville Middle School
Gainesville City
State of Georgia
65.0%
70.0%
75.0%
80.0%
85.0%
90.0%
95.0%
100.0%
2007 2008 2009 2010 2011
Percent of Students Missing Less than 15 Days of School
Gainesville Middle School
Gainesville City
State of Georgia
Dr. John D. Barge, State School Superintendent
Page 145 of 242

Teachers
Administrators
Support Staff
Teacher Attrition Rate
Principal
School Board Chair
Asian Black Hispanic White Multi LEP SWD F/R Lunch
School 4% 21% 49% 24% 2% 16% 9% 68%
District 3% 20% 55% 19% 2% 33% 10% 77%
Does Not
Meet3.3% 5.0% Equal 7.5% Equal 3.0% 4.1% Equal
Meets 38.2% 40.6% No 48.3% No 38.6% 40.6% No
Meets +
Exceeds96.7% 95.0% Yes 92.5% Yes 97.0% 95.9% Yes
2011 Met Did Not Meet Yes 2011 87.3% 84.5% Yes
2010 Met Did Not Meet Yes 2010 81.3% 81.3% Equal
2009 Met Met Equal 2009 73.3% 73.3% Equal
2008 Met Met Equal 2008 77.1% 77.1% Equal
2007 Met Met Equal 2007 80.7% 80.7% Equal
School
0%
2011 GHSGT
School
Student Demographics
Better
than
District
Better
than
District
Academic Achievements
5.6%
Year
Better
Than
District
94.4%
46.9%
District
Gainesville City 91.98
6.721401
15%
Jimmy Hernandez
Chris Mance
Instructional Days
6K-5
175
6/12/2008
6/30/2013
Charter Initially Approved
Mission Statement
The mission of Gainesville High School is to promote life-long learning, citizenship, and responsibility by providing challenging programs and study and
activities in a nurturing environment while encouraging unity among diverse cultures and involving all stakeholders in the achievement of school goals.
Year
Key Facts Personnel
Science
Adequate Yearly Progress Graduation Rate
School District
Charter System
School
Native American
0%
Better
Than
District
Math
Gainesville High School830 Century Pl
Gainesville, GA 30501-3002
770.536.4441
School
ELA
Grades
Enrollment
District
Better
than
District
District
District
Current Charter End
Dr. John D. Barge, State School Superintendent
Page 146 of 242

Block Yes Multi-age grouping Yes Career Academy Yes
Shortened Day No Student/teacher teams Yes International Baccalaureate Program No
Extended Day Yes Grades subdivided into houses Yes Pre-K No
Extended Week No Students remain with teacher 2+ years No After School Programs Yes
Extended Year No Single gender classes No Community Service Yes
•
•
•
Goal 1:
Goal 2:
Target:
Goal 3:
Target:
Goal 4:
Target:
Gainesville High School
Scheduling Instructional Type/Services Offered
Met/Did Not Meet:
2010-11 Results:
Met/Did Not Meet:
Target:
2010-11 Results: 87.3 % of students met the graduation cohort rule
Met/Did Not Meet:
2010-11 Results:
Met/Did Not Meet:
98% of students will meet or exceed on the GHSGT in ELA
2010-11 Results: 96% of students met or exceeded on the GHSGT in ELA
Academic Goals
90% of students will meet or exceed on the GHSGT in Science
Improve the graduation rate- (cohort completion rate)
85% of students will meet the graduation cohort rule
Improve the performance on the GHSGT in ELA
770.536.4441
Unique Accomplishments
Met Goal
Met Goal
Gainesville, GA 30501-3002
92% met or exceeded on the GHSGT in Social Studies
Classroom Arrangements
What makes Gainesville High School Unique?
Improve performance on the GHSGT in Social Studies
92% of students will meet or exceed on the GHSGT in Social Studies
Gainesville High School was named a 2010 National Blue Ribbon School.
Of the class of 2011, 83% of graduates went on the universities, college, or techical colleges.
N/A
Improve the performance on the Georgia High School Graduation Test in Science
96% of students met or exceeded on the GHSGT in Science
Met Goal
830 Century Pl
Did not meet goal but made progress towards goal. Did Not Meet: Increased by 4% the number of students meeting and
exceeding from 2010 to 2011
Dr. John D. Barge, State School Superintendent
Page 147 of 242

Gainesville High School
5 Year History of GHSGT and Graduation Rate
Gainesville, GA 30501-3002
770.536.4441
830 Century Pl
65.0%
70.0%
75.0%
80.0%
85.0%
90.0%
95.0%
100.0%
2007 2008 2009 2010 2011
GHSGT: Mathematics (Percent Passing)
Gainesville High School
Gainesville City
State of Georgia
65.0%
70.0%
75.0%
80.0%
85.0%
90.0%
95.0%
100.0%
2007 2008 2009 2010 2011
GHSGT: English Language Arts (Percent Passing)
Gainesville High School
Gainesville City
State of Georgia
65.0%
70.0%
75.0%
80.0%
85.0%
90.0%
95.0%
100.0%
2007 2008 2009 2010 2011
GHSGT: Science (Percent Passing)
Gainesville High School
Gainesville City
State of Georgia
65.0%
70.0%
75.0%
80.0%
85.0%
90.0%
95.0%
100.0%
2007 2008 2009 2010 2011
GHSGT: Social Studies (Percent Passing)
Gainesville High School
Gainesville City
State of Georgia
65.00%
70.00%
75.00%
80.00%
85.00%
90.00%
95.00%
100.00%
2007 2008 2009 2010 2011
Graduation RateGainesville High School
Gainesville City
State of Georgia
Dr. John D. Barge, State School Superintendent
Page 148 of 242

Teachers
Administrators
Support Staff
Teacher Attrition Rate
Principal
School Board Chair
Asian Black Hispanic White Multi LEP SWD F/R Lunch
School 1% 22% 69% 6% 1% 42% 16% 84%
District 3% 20% 55% 19% 2% 33% 10% 77%
Does Not
Meet11.3% 12.0% Yes 21.6% Yes 27.4% 32.9% Yes
Meets 70.5% 62.5% Yes 50.7% Yes 51.3% 46.5% Yes
Meets +
Exceeds88.7% 88.0% Yes 78.4% Yes 72.6% 67.1% Yes
2011 Met Did Not Meet Yes 2011 7.7% 8.0% Yes
2010 Did Not Meet Did Not Meet Equal 2010 6.5% 7.5% Yes
2009 Met Met Equal 2009 6.0% 6.9% Yes
2008 Met Met Equal 2008 3.9% 10.4% Yes
2007 Met Met Equal 2007 5.0% 8.2% Yes
170 Barn St
Gainesville, GA 30501-8945
770.287.1095
4%
Sara Ogden
District
43.5
Current Charter End
District School
ELA / Reading
School
Native American
0%
Better
Than
District
Math Science
Better
than
District
District
Adequate Yearly Progress Percent Absent > 15 Days
School District
Personnel
Instructional Days
Grades
Enrollment
Charter System Gainesville City
704
Mission Statement
Our mission at New Holland Core Knowledge Academy is to provide rigorous curriculum and targeted instruction so that every student will master the
Georgia Performance Standards and the Core Curriculum Standards.
Better
than
District
Better
than
District
36-8
175
Key Facts
Academic Achievements
15.4%
Year
Better
Than
District
New Holland Core Knowledge Academy
Charter Initially Approved Pam Wood
DistrictSchool
0%
2011 CRCT
6/12/2008
6/30/2013
2
School
Student Demographics
84.6%
53.1%
Year
Dr. John D. Barge, State School Superintendent
Page 149 of 242

Block No Multi-age grouping No Career Academy No
Shortened Day No Student/teacher teams Yes International Baccalaureate Program No
Extended Day No Grades subdivided into houses No Pre-K No
Extended Week No Students remain with teacher 2+ years Yes After School Programs Yes
Extended Year No Single gender classes No Community Service Yes
•
•
•
Goal 1:
Goal 2:
Target:
Goal 3:
Target:
Goal 4:
Target:
170 Barn St Gainesville, GA 30501-8945
770.287.1095
Academic scores showed improvement in all areas, particularly in grade 5 Science.
N/A
Improve Performance on Grade 3 Reading on CRCT
95% met or exceeded
Met Goal
Met Goal
91% met or exceeded
Classroom Arrangements
What makes New Holland Core Knowledge Academy Unique?
Met Goal
New Holland was selected as a Core Knowledge demonstration site.
Met Goal
Academic Goals
Improve performance on Grade 4 ELA on CRCT
91% will meet or exceed
Unique Accomplishments
2010-11 Results:
91% of third grade will meet and exceed
Improve performance on CRCT Math Grade 5
94% will meet or exceed on CRCT on Math Grade 5
2010-11 Results: 95% met or exceeded on CRCT Math Grade 5
Met/Did Not Meet:
2010-11 Results: 28% of 5th graders exceeded standards in math
Increase the number of 5th grade exceeding standards in math
Increase by 10 percent the number exceeding standards in math
Scheduling Instructional Type/Services Offered
Met/Did Not Meet:
Target:
New Holland Core Knowledge Academy
Met/Did Not Meet:
2010-11 Results:
Met/Did Not Meet:
Dr. John D. Barge, State School Superintendent
Page 150 of 242

170 Barn St
5 Year History of CRCT and Student Attendance
Gainesville, GA 30501-8945
770.287.1095
New Holland Core Knowledge Academy
65.0%
70.0%
75.0%
80.0%
85.0%
90.0%
95.0%
100.0%
2007 2008 2009 2010 2011
CRCT: Mathematics (Percent Passing)
New Holland Core Knowledge Academy
Gainesville City
State of Georgia
65.0%
70.0%
75.0%
80.0%
85.0%
90.0%
95.0%
100.0%
2007 2008 2009 2010 2011
CRCT: Reading (Percent Passing)
New Holland Core Knowledge Academy
Gainesville City
State of Georgia
65.0%
70.0%
75.0%
80.0%
85.0%
90.0%
95.0%
100.0%
2007 2008 2009 2010 2011
CRCT: English Language Arts (Percent Passing)
New Holland Core Knowledge Academy
Gainesville City
State of Georgia
55.0%
60.0%
65.0%
70.0%
75.0%
80.0%
85.0%
90.0%
95.0%
100.0%
2007 2008 2009 2010 2011
CRCT: Science (Percent Passing)
New Holland Core Knowledge Academy
Gainesville City
State of Georgia
50.0%
55.0%
60.0%
65.0%
70.0%
75.0%
80.0%
85.0%
90.0%
95.0%
100.0%
2007 2008 2009 2010 2011
CRCT: Social Studies (Percent Passing)
New Holland Core Knowledge Academy
Gainesville City
State of Georgia
65.0%
70.0%
75.0%
80.0%
85.0%
90.0%
95.0%
100.0%
2007 2008 2009 2010 2011
Percent of Students Missing Less than 15 Days of School
New Holland Core Knowledge Academy
Gainesville City
State of Georgia
Dr. John D. Barge, State School Superintendent
Page 151 of 242

Teachers
Administrators
Support Staff
Teacher Attrition Rate
Principal
School Board Chair
Asian Black Hispanic White Multi LEP SWD F/ R Lunch
School 3% 23% 61% 11% 1% 14% 8% 70%
District 3% 20% 55% 19% 2% 33% 10% 77%
Does Not
Meet17.1% 5.0% Equal 7.5% Equal 11.9% 4.1% Equal
Meets 58.5% 40.6% Yes 48.3% Yes 54.8% 40.6% Yes
Meets +
Exceeds82.9% 95.0% No 92.5% No 88.1% 95.9% No
2011 Did Not Meet Did Not Meet Equal 2011 2.8% 8.0% Yes
2010 N/A Did Not Meet N/A 2010 N/A 7.5% N/A
2009 N/A Met N/A 2009 N/A 6.9% N/A
2008 N/A Met N/A 2008 N/A 10.4% N/A
2007 N/A Met N/A 2007 N/A 8.2% N/A
DistrictSchool
0%
2011 GHSGT
School
Student Demographics
Better
than
District
Better
than
District
Academic Achievements
20.9%
Year
Better
Than
District
79.1%
58.1%
District
Gainesville City 3
0.49132
60%
Diana Perez
Linda Youngblood
Instructional Days
0K-5
175
6/12/2008
6/30/2013
Charter Initially Approved
Mission Statement
When you know what you're worth, you get what you're worth.
Year
Key Facts Personnel
Adequate Yearly Progress Percent Absent > 15 Days
School District
School
Native American
0%
Better
Than
District
Math Science
Wood's Mill Non-Traditional High School715 Woodsmill Rd
Gainesville, GA 30501-3020
770.287.2021
School
ELA
Grades
Enrollment
Charter System
District
Better
than
District
District
Current Charter End
Dr. John D. Barge, State School Superintendent
Page 152 of 242

Block No Multi-age grouping Yes Career Academy No
Shortened Day Yes Student/teacher teams Yes International Baccalaureate Program No
Extended Day No Grades subdivided into houses Yes Pre-K No
Extended Week No Students remain with teacher 2+ years Yes After School Programs No
Extended Year No Single gender classes No Community Service Yes
•
•
•
Goal 1:
Goal 2:
Target:
Goal 3:
Target:
Goal 4:
Target:
Scheduling Instructional Type/Services Offered
Met/Did Not Meet:
2010-11 Results:
Met/Did Not Meet:
Target:
2010-11 Results: 25 seniors met graduation requirements.
Met/Did Not Meet:
2010-11 Results:
Met/Did Not Meet:
System Charter set at 97% meeting or exceeding
2010-11 Results: 77% met or exceeded in Math on GHSGT in Math
Graduate 100% of senior class
25 seniors will earn graduation requirements.
Performance on GHSGT in Science
System target goal set in Charter 90% of students meeting or exceeding
Wood's Mill completed its first year as a non-traditional, blended-learning campus for grades 6-12.
Unique Accomplishments
Did not meet goal but made progress towards goal. In first year of operation, students taking GHSGT would not have been
enrolled in school other than the WMA campus.
Academic Goals
System goal in charter was set at 98%
Gainesville, GA 30501-3020
Did not meet goal
86% met or exceeded expectations
Classroom Arrangements
What makes Wood's Mill Non-Traditional High School Unique?
Did not meet goal but made progress towards goal. Good progress for baseline year of new non-traditional school
Performance on GHSGT in Math
770.287.2021
Wood's Mill Non-Traditional High School
The school graduated 21 seniors in the first year.
N/A
Performance on GHSGT in ELA
81% met or exceeded on GHSGT in ELA
Met Goal
715 Woodsmill Rd
Dr. John D. Barge, State School Superintendent
Page 153 of 242

5 Year History of GHSGT and Student Attendance
Gainesville, GA 30501-3020
770.287.2021
Wood's Mill Non-Traditional High School715 Woodsmill Rd
65.0%
70.0%
75.0%
80.0%
85.0%
90.0%
95.0%
100.0%
2007 2008 2009 2010 2011
GHSGT: Mathematics (Percent Passing) Wood's Mill Non-Traditional High School
Gainesville City
State of Georgia
65.0%
70.0%
75.0%
80.0%
85.0%
90.0%
95.0%
100.0%
2007 2008 2009 2010 2011
GHSGT: English Language Arts (Percent Passing)
Wood's Mill Non-Traditional High School
Gainesville City
State of Georgia
65.0%
70.0%
75.0%
80.0%
85.0%
90.0%
95.0%
100.0%
2007 2008 2009 2010 2011
GHSGT: Science (Percent Passing)
Wood's Mill Non-Traditional High School
Gainesville City
State of Georgia
65.0%
70.0%
75.0%
80.0%
85.0%
90.0%
95.0%
100.0%
2007 2008 2009 2010 2011
GHSGT: Social Studies (Percent Passing)
Wood's Mill Non-Traditional High School
Gainesville City
State of Georgia
65.00%
70.00%
75.00%
80.00%
85.00%
90.00%
95.00%
100.00%
2007 2008 2009 2010 2011
Student Attendance: Students Missing Less Than 15 Days
Wood's Mill Non-Traditional High School
Gainesville City
State of Georgia
Dr. John D. Barge, State School Superintendent
Page 154 of 242

Elementary
Charter Term Middle
High School
Total Schools
2007 2008 2009 2010 2011
Yes No Yes Yes No
2011 9.0% 8.8% No 2011 85.8% 80.9% Yes
2010 8.7% 9.7% Yes 2010 80.3% 80.8% No
2009 8.1% 8.7% Yes 2009 83.6% 78.9% Yes
2008 10.0% 9.5% No 2008 77.6% 75.4% Yes
2007 9.8% 10.0% Yes 2007 78.8% 72.3% Yes
8.3% 7.9% No 7.3% 8.3% Yes
59.5% 56.1% Yes 42.2% 37.0% Yes
91.7% 92.1% No 92.7% 91.7% Yes
16.5% 15.3% No 10.0% 15.5% Yes
54.0% 50.7% Yes 35.3% 37.5% No
83.5% 84.7% No 90.0% 84.5% Yes
Does Not Meet
Number of Schools
8/1/2008
5
6/12/2008
6/30/2013
Key Facts
Meets + Exceeds
Marietta City Schools
Adequate Yearly Progress
Meets + Exceeds
Meets
2
StateSystem
Charter Approved
14
Better
than State
Meets
9
Graduation Rate
Opened
3
Better
than State
Charter End
System
Meets + Exceeds
State
Math
System
System
2011 GHSGT
ELA / Reading
2011 CRCT
Math
Does Not Meet
Meets
State
Percent Absent > 15 Days
Better
Than State
ELA
Meets + Exceeds
State Year System StateYear System
250 Howard Street
Marietta, GA 30060
770.422.3500
Better
Than State
Academic Achievements
Better than
State
Better than
State
State
Does Not Meet
Does Not Meet
Meets
Dr. John D. Barge, State School Superintendent
Page 155 of 242

Asian Black Hispanic White Multi LEP SWD F/ R Lunch
System 2.7% 45.6% 29.6% 19.0% 2.6% 16.4% 11.8% 75.3%
State 3.0% 37.0% 12.0% 44.0% 3.0% 6.0% 10.0% 57.0%
1)
2)
3)
4)
5)
2007 2008 2009 2010 2011
Yes Yes Yes Yes Yes
Yes Yes Yes Yes Yes
Yes Yes Yes Yes Yes
Yes Yes Yes Yes Yes
Yes Yes Yes Yes Yes
Yes Yes Yes Yes Yes
Yes Yes Yes Yes Yes
Yes Yes Yes Yes Yes
Yes Yes Yes Yes Yes
Yes Yes Yes Yes Yes
Charter System Strategic Goals:
Charter System Schools
Marietta Middle School
Charter System Schools Adequate Yearly Progress
0.0%
Student Demographics
Native American
0.5%
Marietta High School
Marietta Center for Advanced Academics
To provide challenging, relevant, engaging educational experiences to facilitiate the greatest achievement and development for every student.
To recruit and retain the best and brightest cadre of highly qualified teachers, administrators, and staff to create a positive, engaging, and consistent
learning environment for all students.
To foster a cooperative, safe, learning environment.
To effectively and consistently engage stakeholders to raise public awareness about MCS excellence, improve community support of public
education, and enhance parental involvement.
N/A
Dunleith Elementary School
Hickory Hills Elementary School
Burruss Elementary School
Marietta City Schools250 Howard Street
Marietta, GA 30060
770.422.3500
Lockheed Elementary School
Marietta 6th Grade School
Park Street Elementary School
West Side Elementary School
Dr. John D. Barge, State School Superintendent
Page 156 of 242

5 Year History CRCT
Marietta City Schools250 Howard Street
Marietta, GA 30060
770.422.3500
65.0%
70.0%
75.0%
80.0%
85.0%
90.0%
95.0%
100.0%
2007 2008 2009 2010 2011
CRCT: Math (Percent Passing)
Marietta City Schools
State of Georgia
65.0%
70.0%
75.0%
80.0%
85.0%
90.0%
95.0%
100.0%
2007 2008 2009 2010 2011
CRCT: Reading/ELA (Percent Passing)
Marietta City Schools
State of Georgia
60.0%
65.0%
70.0%
75.0%
80.0%
85.0%
90.0%
95.0%
100.0%
2007 2008 2009 2010 2011
CRCT: Social Studies (Percent Passing)
Marietta City Schools
State of Georgia
60.0%
65.0%
70.0%
75.0%
80.0%
85.0%
90.0%
95.0%
100.0%
2007 2008 2009 2010 2011
CRCT: Science (Percent Passing)
Marietta City Schools
State of Georgia
Dr. John D. Barge, State School Superintendent
Page 157 of 242

5 Year History GHSGT and Graduation Rate
Marietta City Schools250 Howard Street
Marietta, GA 30060
770.422.3500
65.0%
70.0%
75.0%
80.0%
85.0%
90.0%
95.0%
100.0%
2007 2008 2009 2010 2011
GHSGT: ELA (Percent Passing)
Marietta City Schools
State of Georgia
65.0%
70.0%
75.0%
80.0%
85.0%
90.0%
95.0%
100.0%
2007 2008 2009 2010 2011
GHSGT: Math (Percent Passing)
Marietta City Schools
State of Georgia
65.0%
70.0%
75.0%
80.0%
85.0%
90.0%
95.0%
100.0%
2007 2008 2009 2010 2011
GHSGT: Science (Percent Passing)
Marietta City Schools
State of Georgia
65.0%
70.0%
75.0%
80.0%
85.0%
90.0%
95.0%
100.0%
2007 2008 2009 2010 2011
GHSGT: Social Studies (Percent Passing)
Marietta City Schools
State of Georgia
65.0%
70.0%
75.0%
80.0%
85.0%
90.0%
95.0%
100.0%
2007 2008 2009 2010 2011
High School Graduation Rate
Marietta City Schools
State of Georgia
Dr. John D. Barge, State School Superintendent
Page 158 of 242

Teachers
Administrators
Support Staff
Teacher Attrition Rate
Principal
School Board Chair
Asian Black Hispanic White Multi LEP SWD F/ R Lunch
School 3% 49% 30% 15% 3% 12% 11% 73%
District 3% 46% 30% 19% 3% 16% 12% 75%
Does Not
Meet4.2% 8.3% Yes 16.5% No 18.4% 23.1% Yes
Meets 63.3% 59.5% Yes 54.0% Yes 65.8% 48.8% Yes
Meets +
Exceeds95.8% 91.7% Yes 83.5% No 81.6% 76.9% Yes
2011 Met Did Not Meet Yes 2011 6.0% 9.0% Yes
2010 Met Met Equal 2010 7.5% 8.7% Yes
2009 Met Met Equal 2009 6.7% 8.1% Yes
2008 Did Not Meet Did Not Meet Equal 2008 7.9% 10.0% Yes
2007 Met Met Equal 2007 6.6% 9.8% Yes
Current Charter End
District
Better
than
District
District
Marietta 6th Grade School340 Aviation Rd SE
Marietta, GA 30060-2464
770.429.3115
School
ELA / Reading
Grades
Enrollment
Charter System
School
Native American
0%
Better
Than
District
Math Science
Adequate Yearly Progress Percent Absent > 15 Days
School District
Mission Statement
Our mission at the Marietta Sixth Grade Academy is to provide a safe, nurturing, and challenging environment where all students will be successful.
Year
Key Facts Personnel
Instructional Days
56th
178
6/12/2008
6/30/2013
Marietta City 44.63
2598
6%
Dayton HIbbs
Academic Achievements
20.2%
Year
Better
Than
District
79.8%
59.9%
District
Charter Initially Approved Gabe Carmona
DistrictSchool
0%
2011 CRCT
School
Student Demographics
Better
than
District
Better
than
District
Dr. John D. Barge, State School Superintendent
Page 159 of 242

Block No Multi-age grouping No Career Academy No
Shortened Day Yes Student/teacher teams Yes International Baccalaureate Program Yes
Extended Day Yes Grades subdivided into houses Yes Pre-K No
Extended Week No Students remain with teacher 2+ years No After School Programs Yes
Extended Year No Single gender classes No Community Service Yes
•
•
•
Goal 1:
Goal 2:
Target:
Goal 3:
Target:
Goal 4:
Target:
Designated as a finalist for the Lighthouse Schools to Watch program
Strengthened STEM education for students through a continued partnership with Lockheed Martin Corporation.
Increase the number of all students exceeding standards on the Reading CRCT
38% of all students exceeded standards on the 2010-2011 Reading CRCT
Met Goal
340 Aviation Rd SE
Did not meet goal
19.83% of all students exceeded standards on the 2010-2011 Mathematics CRCT
Classroom Arrangements
What makes Marietta 6th Grade School Unique?
Did not meet goal but made progress towards goal. Increased .69% from 2010
Marietta, GA 30060-2464
Increase the number of all students exceeding standards on the Science CRCT
770.429.3115
Unique Accomplishments
Met Goal
Academic Goals
24% of all students will exceed standards on the 2010-2011 Reading CRCT
Reduce the percentage of students not meeting standards on the Reading CRCT.
Students not meeting standards on the 2010-2011 Reading CRCT will not surpass 7% of the population tested
Increase the number of all students exceeding standards on the Mathematics CRCT
20% of all students will exceed standards on the 2010-2011 Mathematics CRCT
Achieved AYP for 3 consecutive years; Surpassed the state CRCT performance averages for the % of students meeting & exceeding
standards in all 5 tested subject areas.
2010-11 Results: 3.78% of the population tested did not meet standards on the 2010-2011 Reading CRCT.
Met/Did Not Meet:
2010-11 Results:
Met/Did Not Meet:
19% of all students will exceed standards on the 2010-2011 Science CRCT
2010-11 Results: 16% of all students exceeded standards on the 2010-2011 Science CRCT
Met/Did Not Meet:
2010-11 Results:
Met/Did Not Meet:
Target:
Scheduling Instructional Type/Services Offered
Marietta 6th Grade School
Dr. John D. Barge, State School Superintendent
Page 160 of 242

340 Aviation Rd SE
5 Year History of CRCT and Student Attendance
Marietta, GA 30060-2464
770.429.3115
Marietta 6th Grade School
55.0%
60.0%
65.0%
70.0%
75.0%
80.0%
85.0%
90.0%
95.0%
100.0%
2007 2008 2009 2010 2011
CRCT: Mathematics (Percent Passing)
Marietta 6th Grade School
Marietta City
State of Georgia
65.0%
70.0%
75.0%
80.0%
85.0%
90.0%
95.0%
100.0%
2007 2008 2009 2010 2011
CRCT: Reading (Percent Passing)
Marietta 6th Grade School
Marietta City
State of Georgia
65.0%
70.0%
75.0%
80.0%
85.0%
90.0%
95.0%
100.0%
2007 2008 2009 2010 2011
CRCT: English Language Arts (Percent Passing)
Marietta 6th Grade School
Marietta City
State of Georgia
55.0%
60.0%
65.0%
70.0%
75.0%
80.0%
85.0%
90.0%
95.0%
100.0%
2007 2008 2009 2010 2011
CRCT: Science (Percent Passing)
Marietta 6th Grade School
Marietta City
State of Georgia
65.00%
70.00%
75.00%
80.00%
85.00%
90.00%
95.00%
100.00%
2007 2008 2009 2010 2011
CRCT: Social Studies (Percent Passing)
Marietta 6th Grade School
Marietta City
State of Georgia
65.0%
70.0%
75.0%
80.0%
85.0%
90.0%
95.0%
100.0%
2007 2008 2009 2010 2011
Percent of Students Missing Less than 15 Days of School
Marietta 6th Grade School
Marietta City
State of Georgia
Dr. John D. Barge, State School Superintendent
Page 161 of 242

Teachers
Administrators
Support Staff
Teacher Attrition Rate
Principal
School Board Chair
Asian Black Hispanic White Multi LEP SWD F/R Lunch
School 2% 48% 10% 35% 5% 6% 10% 57%
District 3% 46% 30% 19% 3% 16% 12% 75%
Does Not
Meet9.1% 8.3% No 16.5% Yes 21.1% 23.1% Yes
Meets 51.8% 59.5% No 54.0% No 44.6% 48.8% No
Meets +
Exceeds90.9% 91.7% No 83.5% Yes 78.9% 76.9% Yes
2011 Met Did Not Meet Yes 2011 4.1% 9.0% Yes
2010 Met Met Equal 2010 5.1% 8.7% Yes
2009 Met Met Equal 2009 2.9% 8.1% Yes
2008 Met Did Not Meet Yes 2008 2.8% 10.0% Yes
2007 Met Met Equal 2007 2.4% 9.8% Yes
Charter Initially Approved Julie King
DistrictSchool
0%
2011 CRCT
School
Student Demographics
Better
than
District
Better
than
District
13.5%
Year
Better
Than
District
86.5%
38.7%
3K-5
178
6/12/2008
6/30/2013
Marietta City 31.3
2382
3%
Mission Statement
Develop every child as an educated responsible citizen
Year
Key Facts Personnel
Instructional Days
Adequate Yearly Progress Percent Absent > 15 Days
School District
School
Native American
0%
Better
Than
District
Math Science
Burruss Elementary School325 Manning Rd SW
Marietta, GA 30064-3044
770.429.3144
School
ELA / Reading
Grades
Enrollment
Charter System
District
Better
than
District
District District
Current Charter End N/A
Academic Achievements
Dr. John D. Barge, State School Superintendent
Page 162 of 242

Block No Multi-age grouping No Career Academy No
Shortened Day No Student/teacher teams No International Baccalaureate Program No
Extended Day Yes Grades subdivided into houses No Pre-K No
Extended Week No Students remain with teacher 2+ years No After School Programs Yes
Extended Year No Single gender classes No Community Service No
•
•
•
Goal 1:
Goal 2:
Target:
Goal 3:
Target:
Goal 4:
Target:
Scheduling Instructional Type/Services Offered
Burruss Elementary School
2010-11 Results:
Met/Did Not Meet:
Target:
2010-11 Results: 11.59% of all students DNM standards on teh 2010-2011 Reading CRCT.
Met/Did Not Meet:
2010-11 Results:
Met/Did Not Meet:
28.67% of all students will exceed standards on the 2010-2011 Science CRCT
2010-11 Results: 34.34% of all students exceeded on the 2010-2011 Science CRCT
Met/Did Not Meet:
The district will reduce the percentage of studetns that do not meet standrad on the Reading CRCT
No more than 16.33% of all students will not meet standards on the 2010-2011 Reading CRCT.
Increase the number of all students who exceed standards on the Mathematics CRCT
33.67% of all students will exceed standards on the 2010-2011 Mathematics CRCT
28% more 3rd grade students exceeded in 2011 than in 2010 on the reading CRCT. 24% more 5th grade students exceeded in 2011 than in
2010 on the math CRCT. 26% more 5th grade students exceeded in 2011 than in 2010 on the social studies CRCT.
Increase the number of all students who exceed standards on the Science CRCT
770.429.3144
Unique Accomplishments
Met Goal
Marietta, GA 30064-3044
Met Goal
325 Manning Rd SW
Met Goal
48.98% of all students exceeded standards on the 2010-2011 Mathematics CRCT
Classroom Arrangements
What makes Burruss Elementary School Unique?
Met Goal
United Way teamed with Marietta City Schools to develop Transition Teams and provide a KinderCamp to acclimate incoming kindergarteners
and their parents to their schools.
The school's first Grandparents Dad observance led to the formation of the Grandmother's Club which will work to keep the school facility
inviting and attractive.
Increase the number of all students who exceed standards on the Reading CRCT
42.18% of all students exceeded standards on the 2010-2011 Reading CRCT
Academic Goals
35.67% of all students will exceed standards on the 2010-2011 Reading CRCT
Dr. John D. Barge, State School Superintendent
Page 163 of 242

5 Year History of CRCT and Student Attendance
Marietta, GA 30064-3044
770.429.3144
Burruss Elementary School325 Manning Rd SW
65.0%
70.0%
75.0%
80.0%
85.0%
90.0%
95.0%
100.0%
2007 2008 2009 2010 2011
CRCT: Mathematics (Percent Passing) Burruss Elementary School
Marietta City
State of Georgia
65.0%
70.0%
75.0%
80.0%
85.0%
90.0%
95.0%
100.0%
2007 2008 2009 2010 2011
CRCT: Reading (Percent Passing)
Burruss Elementary School
Marietta City
State of Georgia
65.0%
70.0%
75.0%
80.0%
85.0%
90.0%
95.0%
100.0%
2007 2008 2009 2010 2011
CRCT: English Language Arts (Percent Passing)
Burruss Elementary School
Marietta City
State of Georgia
60.0%
65.0%
70.0%
75.0%
80.0%
85.0%
90.0%
95.0%
100.0%
2007 2008 2009 2010 2011
CRCT: Science (Percent Passing)
Burruss Elementary School
Marietta City
State of Georgia
65.0%
70.0%
75.0%
80.0%
85.0%
90.0%
95.0%
100.0%
2007 2008 2009 2010 2011
CRCT: Social Studies (Percent Passing)
Burruss Elementary School
Marietta City
State of Georgia
65.0%
70.0%
75.0%
80.0%
85.0%
90.0%
95.0%
100.0%
2007 2008 2009 2010 2011
Percent of Students Missing Less than 15 Days of School
Burruss Elementary School
Marietta City
State of Georgia
Dr. John D. Barge, State School Superintendent
Page 164 of 242

Teachers
Administrators
Support Staff
Teacher Attrition Rate
Principal
School Board Chair
Asian Black Hispanic White Multi LEP SWD F/R Lunch
School 1% 59% 32% 4% 3% 25% 14% 100%
District 3% 46% 30% 19% 3% 16% 12% 75%
Does Not
Meet11.3% 8.3% No 16.5% No 29.4% 23.1% No
Meets 68.0% 59.5% Yes 54.0% Yes 46.0% 48.8% No
Meets +
Exceeds88.7% 91.7% No 83.5% No 70.6% 76.9% No
2011 Met Did Not Meet Yes 2011 7.1% 9.0% Yes
2010 Met Met Equal 2010 6.9% 8.7% Yes
2009 Met Met Equal 2009 4.5% 8.1% Yes
2008 Met Did Not Meet Yes 2008 5.3% 10.0% Yes
2007 Met Met Equal 2007 4.8% 9.8% Yes
Current Charter End
District
Better
than
District
District
Dunleith Elementary School120 Saine Dr SW
Marietta, GA 30008-3878
770.429.3190
School
ELA / Reading
Grades
Enrollment
Charter System
School
Native American
0%
Better
Than
District
Math Science
Adequate Yearly Progress Percent Absent > 15 Days
School District
Mission Statement
We work collaboratively with colleagues, parents and the community to maximize student achievement.
Year
Key Facts Personnel
Instructional Days
4.5K-5
178
6/12/2008
6/30/2013
Marietta City 40.8
2578
13%
Tiffany Pollock
Academic Achievements
22.7%
Year
Better
Than
District
77.3%
54.5%
District
Charter Initially Approved Sarah Towler
DistrictSchool
0%
2011 CRCT
School
Student Demographics
Better
than
District
Better
than
District
Dr. John D. Barge, State School Superintendent
Page 165 of 242

Block No Multi-age grouping No Career Academy No
Shortened Day Yes Student/teacher teams No International Baccalaureate Program No
Extended Day Yes Grades subdivided into houses No Pre-K No
Extended Week No Students remain with teacher 2+ years No After School Programs Yes
Extended Year Yes Single gender classes No Community Service Yes
•
•
•
Goal 1:
Goal 2:
Target:
Goal 3:
Target:
Goal 4:
Target:
Students scored significantly higher on AYP in the area of reading.
The school was named a Title I Distinguished school.
Increase the number of all students exceeding standards on the Reading CRCT
22.94% of all students exceeded standards on the 2010-2011 Reading CRCT
Met Goal
120 Saine Dr SW
Met Goal
22.75% of all students exceeded standards on the 2010-2011 Mathematics CRCT
Classroom Arrangements
What makes Dunleith Elementary School Unique?
Met Goal
Marietta, GA 30008-3878
Increase the number of all students exceeding standards on the 2010-2011 Science CRCT
770.429.3190
Unique Accomplishments
Met Goal
Academic Goals
12.67% of all studnts will exceed standards on the 2010-2011 Reading CRCT
Reduce the percentage of students not meeting standards on the Reading CRCT
Students not meeting standards on the 2010-2011 REading CRCT will not surpass 15.33% of the population tested.
Increase the number of all students exceeding standards on the Mathematics CRCT
17.67% of all students will exceed standards on the 2010-2011 Mathematics CRCT
Many new partnerships were formed including Walton Communities, Communities in School, United Way Transition Camp, and State Bank.
2010-11 Results: 12.55% of the population tested did not meet standards on the 2010-2011 Reading CRCT.
Met/Did Not Meet:
2010-11 Results:
Met/Did Not Meet:
7.33% of all students will exceed standsrds on the 2010-2011 Science CRCT
2010-11 Results: 24.68% of all students exceeded standards on the 2010-2011 Science CRCT
Met/Did Not Meet:
2010-11 Results:
Met/Did Not Meet:
Target:
Scheduling Instructional Type/Services Offered
Dunleith Elementary School
Dr. John D. Barge, State School Superintendent
Page 166 of 242

120 Saine Dr SW
5 Year History of CRCT and Student Attendance
Marietta, GA 30008-3878
770.429.3190
Dunleith Elementary School
65.0%
70.0%
75.0%
80.0%
85.0%
90.0%
95.0%
100.0%
2007 2008 2009 2010 2011
CRCT: Mathematics (Percent Passing)
Dunleith Elementary School
Marietta City
State of Georgia
65.0%
70.0%
75.0%
80.0%
85.0%
90.0%
95.0%
100.0%
2007 2008 2009 2010 2011
CRCT: Reading (Percent Passing)
Dunleith Elementary School
Marietta City
State of Georgia
65.0%
70.0%
75.0%
80.0%
85.0%
90.0%
95.0%
100.0%
2007 2008 2009 2010 2011
CRCT: English Language Arts (Percent Passing)
Dunleith Elementary School
Marietta City
State of Georgia
45.0%
50.0%
55.0%
60.0%
65.0%
70.0%
75.0%
80.0%
85.0%
90.0%
95.0%
100.0%
2007 2008 2009 2010 2011
CRCT: Science (Percent Passing)
Dunleith Elementary School
Marietta City
State of Georgia
60.0%
65.0%
70.0%
75.0%
80.0%
85.0%
90.0%
95.0%
100.0%
2007 2008 2009 2010 2011
CRCT: Social Studies (Percent Passing)
Dunleith Elementary School
Marietta City
State of Georgia
65.0%
70.0%
75.0%
80.0%
85.0%
90.0%
95.0%
100.0%
2007 2008 2009 2010 2011
Percent of Students Missing Less than 15 Days of School
Dunleith Elementary School
Marietta City
State of Georgia
Dr. John D. Barge, State School Superintendent
Page 167 of 242

Teachers
Administrators
Support Staff
Teacher Attrition Rate
Principal
School Board Chair
Asian Black Hispanic White Multi LEP SWD F/R Lunch
School 2% 43% 42% 10% 1% 31% 15% 100%
District 3% 46% 30% 19% 3% 16% 12% 75%
Does Not
Meet16.5% 8.3% No 16.5% No 36.0% 23.1% No
Meets 65.9% 59.5% Yes 54.0% No 52.3% 48.8% Yes
Meets +
Exceeds83.5% 91.7% No 83.5% No 64.0% 76.9% No
2011 Met Did Not Meet Yes 2011 5.9% 9.0% Yes
2010 Met Met Equal 2010 9.4% 8.7% No
2009 Met Met Equal 2009 5.4% 8.1% Yes
2008 Met Did Not Meet Yes 2008 4.2% 10.0% Yes
2007 Met Met Equal 2007 4.9% 9.8% Yes
Charter Initially Approved Diana Mills
DistrictSchool
0%
2011 CRCT
School
Student Demographics
Better
than
District
Better
than
District
N/A
Academic Achievements
25.0%
Year
Better
Than
District
75.0%
50.0%
District
4.63K-5
178
6/12/2008
6/30/2013
Marietta City 35.49
2423
0%
Mission Statement
We are committed to integrating the arts into our curriculum and empowering our students to succeed academically, socially and artistically.
Year
Key Facts Personnel
Instructional Days
Adequate Yearly Progress Percent Absent > 15 Days
School District
School
Native American
0%
Better
Than
District
Math Science
Hickory Hills Elementary School500 Redwood Dr SW
Marietta, GA 30064-3615
770.429.3125
School
ELA / Reading
Grades
Enrollment
Charter System
District
Better
than
District
District
Current Charter End
Dr. John D. Barge, State School Superintendent
Page 168 of 242

Block No Multi-age grouping No Career Academy No
Shortened Day Yes Student/teacher teams Yes International Baccalaureate Program No
Extended Day Yes Grades subdivided into houses No Pre-K No
Extended Week No Students remain with teacher 2+ years Yes After School Programs Yes
Extended Year No Single gender classes Yes Community Service No
•
•
•
Goal 1:
Goal 2:
Target:
Goal 3:
Target:
Goal 4:
Target:
Scheduling Instructional Type/Services Offered
2010-11 Results:
Met/Did Not Meet:
Target:
2010-11 Results: 21.05% of the population did not meet standards on the 2010-2011 Reading CRCT
Met/Did Not Meet:
2010-11 Results:
Met/Did Not Meet:
5.67% all students exceed standards on the Science 2010-2011 Science CRCT
2010-11 Results: 11.56% of all students exceeded standards on the 2010-2011 Science CRCt
Met/Did Not Meet:
Reduce the % of students not meeting standards on the Reading CRCT
Students not meeting standards on the 2010-2011 Reading CRCT will not surpass 18.67% of the population tested.
Increase the number of all students exceeding standards on the Mathematics CRCT
16.67% all students will exceed standards on the 2010-2011 Mathematics CRCT
Addition of third grade to Music-In-Education Consortium action research and digital portfolio. Students participated in Corporate Art Project
with presentation at the office of Tomorrows Ventures. Hickory Hills's student recognized at state level Reflections Contest.
Unique Accomplishments
Met Goal
Academic Goals
10% of all students will exceed standards on the 2010-2011 Reading CRCT
Marietta, GA 30064-3615
Met Goal
24.86% of all students exceeded standards on CRCT
Classroom Arrangements
What makes Hickory Hills Elementary School Unique?
Met Goal
Increase the number of all students exceeding standards on the Science CRCT
770.429.3125
Hickory Hills was highlighted in PAGE article: The Art(s) of Teaching and Learning. Hickory Hills serves as a teaching and learning site for
administrators and teachers throughout the United States. Hickory Hills hosts entire 2011 Leadership Cobb class on Education Day to learn
about integrated arts program.
Mrs. Nathan Deal and Mayor Tumlin visit Hickory Hills for story time and AR recognition. Marietta-Cobb Museum of Art serves as auction site
for the 1st annual HHartPTA fundraiser.
Increase the number of all students exceeding standards on the Reading CRCT.
19.88% of all students exceeded standards on the 2010-2011 Reading CRCT
Hickory Hills Elementary School
Met Goal
500 Redwood Dr SW
Dr. John D. Barge, State School Superintendent
Page 169 of 242

5 Year History of CRCT and Student Attendance
Marietta, GA 30064-3615
770.429.3125
500 Redwood Dr SW Hickory Hills Elementary School
65.0%
70.0%
75.0%
80.0%
85.0%
90.0%
95.0%
100.0%
2007 2008 2009 2010 2011
CRCT: Mathematics (Percent Passing)
Hickory Hills Elementary School
Marietta City
State of Georgia
65.0%
70.0%
75.0%
80.0%
85.0%
90.0%
95.0%
100.0%
2007 2008 2009 2010 2011
CRCT: Reading (Percent Passing)Hickory Hills Elementary School
Marietta City
State of Georgia
65.0%
70.0%
75.0%
80.0%
85.0%
90.0%
95.0%
100.0%
2007 2008 2009 2010 2011
CRCT: English Language Arts (Percent Passing)
Hickory Hills Elementary School
Marietta City
State of Georgia
55.0%
60.0%
65.0%
70.0%
75.0%
80.0%
85.0%
90.0%
95.0%
100.0%
2007 2008 2009 2010 2011
CRCT: Science (Percent Passing)Hickory Hills Elementary School
Marietta City
State of Georgia
55.0%
60.0%
65.0%
70.0%
75.0%
80.0%
85.0%
90.0%
95.0%
100.0%
2007 2008 2009 2010 2011
CRCT: Social Studies (Percent Passing)Hickory Hills Elementary School
Marietta City
State of Georgia
65.0%
70.0%
75.0%
80.0%
85.0%
90.0%
95.0%
100.0%
2007 2008 2009 2010 2011
Percent of Students Missing Less than 15 Days of School
Hickory Hills Elementary School
Marietta City
State of Georgia
Dr. John D. Barge, State School Superintendent
Page 170 of 242

Teachers
Administrators
Support Staff
Teacher Attrition Rate
Principal
School Board Chair
Asian Black Hispanic White Multi LEP SWD F/R Lunch
School 2% 48% 40% 6% 2% 27% 11% 100%
District 3% 46% 30% 19% 3% 16% 12% 75%
Does Not
Meet8.9% 8.3% No 16.5% No 22.1% 23.1% Yes
Meets 68.6% 59.5% Yes 54.0% Yes 51.8% 48.8% Yes
Meets +
Exceeds91.1% 91.7% No 83.5% No 77.9% 76.9% Yes
2011 Met Did Not Meet Yes 2011 3.9% 9.0% Yes
2010 Met Met Equal 2010 5.4% 8.7% Yes
2009 Met Met Equal 2009 3.9% 8.1% Yes
2008 Met Did Not Meet Yes 2008 4.1% 10.0% Yes
2007 Met Met Equal 2007 5.0% 9.8% Yes
District
Current Charter End
District
Better
than
District
District
Lockheed Elementary School1205 Merritt Rd
Marietta, GA 30062-3251
770.429.3196
School
ELA / Reading
Grades
Enrollment
Charter System
School
Native American
1%
Better
Than
District
Math Science
Adequate Yearly Progress Percent Absent > 15 Days
School District
Mission Statement
To develop leaders with good charater one child at a time.
Year
Key Facts Personnel
Instructional Days
6K-5
178
6/12/2008
6/30/2013
Marietta City 57.5
2.5811
6%
Gabe Carmona
Academic Achievements
19.5%
Year
Better
Than
District
80.5%
54.4%
Charter Initially Approved Devonne Harper
DistrictSchool
0%
2011 CRCT
School
Student Demographics
Better
than
District
Better
than
District
Dr. John D. Barge, State School Superintendent
Page 171 of 242

Block No Multi-age grouping No Career Academy No
Shortened Day Yes Student/teacher teams No International Baccalaureate Program No
Extended Day Yes Grades subdivided into houses No Pre-K No
Extended Week No Students remain with teacher 2+ years No After School Programs Yes
Extended Year No Single gender classes No Community Service No
•
•
•
Goal 1:
Goal 2:
Target:
Goal 3:
Target:
Goal 4:
Target:
These unique science experiences have led to steady gains in the number of 3rd-5th grade students exceeding standards on the science CRCT. The percentage of 3rd
grade students exceeding standards has increased from 16% in 2009 to 27% in 2011. Fourth grade students who exceeded standards increased from 23% to 27%, and
fifth graders made the most dramatic gain, from 10% exceeding standards to 24%.
N/A
Increase the number of all students exceeding standards on the Reading CRCT
24.57% of all students exceeded standards on the 2010-2011 Reading CRCT
Met Goal
1205 Merritt Rd
Did not meet goal but made progress towards goal. Increased exceeding 5.20% from 2010
26.06% of all students exceeded standards on the 2010-2011 Mathematics CRCT
Classroom Arrangements
What makes Lockheed Elementary School Unique?
Did not meet goal but made progress towards goal. ncreased exceeding .90% from 2010
Marietta, GA 30062-3251
Increase the number of all students exceeding standards on the Science CRCT
770.429.3196
Unique Accomplishments
Met Goal
Academic Goals
20.33% of all students will exceed standards on the 2010-2011 Reading CRCT
Reduce the percentage of students not meeting standards on the Reading CRCT.
Students not meeting standards on the 2010-2011 Reading CRCT will not surpass 13.67% of the population tested.
Increase the number of all students exceeding standards on the Mathematics CRCT
26.33% of all students will exceed standards on the 2010-2011 Mathematics CRCT
Lockheed Elementary School has a long-time partnership with Lockheed Martin Aeronautics. Through this partnership, we have been provided with funding to equip a
science lab that is used by all students. A full-time science teacher creates lessons and hands-on experiences for K-5 students. In addition, volunteers from Lockheed
Martin work with selected 4th and 5th grade students in a science program called LM SMART. These students participate in a number of exploratory science projects
throughout the year. At the end of the year, the students are given a tour of the Lockheed Martin facility.
2010-11 Results: 8.86% of the population tested did not meet standards on the 2010-2011 Reading CRCT.
Met/Did Not Meet:
2010-11 Results:
Met/Did Not Meet:
27.67% of all students will exceed standards on the 2010-2011 Science CRCT
2010-11 Results: 26.06% of all students exceeded standards on the 2010-2011 Science CRCT
Met/Did Not Meet:
2010-11 Results:
Met/Did Not Meet:
Target:
Scheduling Instructional Type/Services Offered
Lockheed Elementary School
Dr. John D. Barge, State School Superintendent
Page 172 of 242

1205 Merritt Rd Lockheed Elementary School
5 Year History of CRCT and Student Attendance
Marietta, GA 30062-3251
770.429.3196
65.0%
70.0%
75.0%
80.0%
85.0%
90.0%
95.0%
100.0%
2007 2008 2009 2010 2011
CRCT: Mathematics (Percent Passing)
Lockheed Elementary School
Marietta City
State of Georgia
65.0%
70.0%
75.0%
80.0%
85.0%
90.0%
95.0%
100.0%
2007 2008 2009 2010 2011
CRCT: Reading (Percent Passing)
Lockheed Elementary School
Marietta City
State of Georgia
65.0%
70.0%
75.0%
80.0%
85.0%
90.0%
95.0%
100.0%
2007 2008 2009 2010 2011
CRCT: English Language Arts (Percent Passing)
Lockheed Elementary School
Marietta City
State of Georgia
55.0%
60.0%
65.0%
70.0%
75.0%
80.0%
85.0%
90.0%
95.0%
100.0%
2007 2008 2009 2010 2011
CRCT: Science (Percent Passing)Lockheed Elementary School
Marietta City
State of Georgia
60.0%
65.0%
70.0%
75.0%
80.0%
85.0%
90.0%
95.0%
100.0%
2007 2008 2009 2010 2011
CRCT: Social Studies (Percent Passing)
Lockheed Elementary School
Marietta City
State of Georgia
65.0%
70.0%
75.0%
80.0%
85.0%
90.0%
95.0%
100.0%
2007 2008 2009 2010 2011
Percent of Students Missing Less than 15 Days of School
Lockheed Elementary School
Marietta City
State of Georgia
Dr. John D. Barge, State School Superintendent
Page 173 of 242

Teachers
Administrators
Support Staff
Teacher Attrition Rate
Principal
School Board Chair
Asian Black Hispanic White Multi LEP SWD F/R Lunch
School 14% 31% 11% 40% 4% 0% 3% 28%
District 3% 46% 30% 19% 3% 16% 12% 75%
Does Not
Meet0.2% 8.3% Yes 16.5% Yes 0.0% 23.1% Yes
Meets 17.6% 59.5% No 54.0% No 14.4% 48.8% No
Meets +
Exceeds99.8% 91.7% Yes 83.5% Yes 100.0% 76.9% Yes
2011 Met Did Not Meet Yes 2011 0.4% 9.0% Yes
2010 Met Met Equal 2010 1.1% 8.7% Yes
2009 Met Met Equal 2009 0.8% 8.1% Yes
2008 Met Did Not Meet Yes 2008 1.2% 10.0% Yes
2007 Met Met Equal 2007 0.8% 9.8% Yes
DistrictSchool
0%
2011 CRCT
School
Student Demographics
Better
than
District
Better
than
District
Academic Achievements
1.2%
Year
Better
Than
District
98.8%
20.6%
District
Marietta City 15.45
2257
N/A
N/A
Jennifer Hernandez
Instructional Days
1.5K-5
N/A
6/12/2008
6/30/2013
Charter Initially Approved
Mission Statement
To provide students an advanced academic experience with an emphasis on science, technology, engineering and mathematics (STEM).
Year
Key Facts Personnel
Adequate Yearly Progress Percent Absent > 15 Days
School District
School
Native American
0%
Better
Than
District
Math Science
Marietta Center for Advanced Academics311 Aviation Rd SE
Marietta, GA 30060-2463
770.420.0822
School
ELA / Reading
Grades
Enrollment
Charter System
District
Better
than
District
District
Current Charter End
Dr. John D. Barge, State School Superintendent
Page 174 of 242

Block N/A Multi-age grouping N/A Career Academy N/A
Shortened Day N/A Student/teacher teams N/A International Baccalaureate Program N/A
Extended Day N/A Grades subdivided into houses N/A Pre-K N/A
Extended Week N/A Students remain with teacher 2+ years N/A After School Programs N/A
Extended Year N/A Single gender classes N/A Community Service N/A
•
•
•
Goal 1:
Goal 2:
Target:
Goal 3:
Target:
Goal 4:
Target:
Scheduling Instructional Type/Services Offered
Met/Did Not Meet:
2010-11 Results:
Met/Did Not Meet:
Target:
2010-11 Results: N/A
Met/Did Not Meet:
2010-11 Results:
Met/Did Not Meet:
N/A
2010-11 Results: N/A
N/A
N/A
N/A
N/A
Marietta Center for Advanced Academics did not submit an Annual Report.
Unique Accomplishments
N/A
Academic Goals
N/A
Marietta, GA 30060-2463
N/A
N/A
Classroom Arrangements
What makes Marietta Center for Advanced Academics Unique?
N/A
N/A
770.420.0822
Marietta Center for Advanced Academics
N/A
N/A
N/A
N/A
N/A
311 Aviation Rd SE
Dr. John D. Barge, State School Superintendent
Page 175 of 242

5 Year History of CRCT and Student Attendance
Marietta, GA 30060-2463
770.420.0822
Marietta Center for Advanced Academics311 Aviation Rd SE
65.0%
70.0%
75.0%
80.0%
85.0%
90.0%
95.0%
100.0%
2007 2008 2009 2010 2011
CRCT: Mathematics (Percent Passing)
Marietta Center for Advanced Academics
Marietta City
State of Georgia
65.0%
70.0%
75.0%
80.0%
85.0%
90.0%
95.0%
100.0%
2007 2008 2009 2010 2011
CRCT: Reading (Percent Passing)Marietta Center for Advanced Academics
Marietta City
State of Georgia
65.0%
70.0%
75.0%
80.0%
85.0%
90.0%
95.0%
100.0%
2007 2008 2009 2010 2011
CRCT: English Language Arts (Percent Passing)
Marietta Center for Advanced Academics
Marietta City
State of Georgia
60.0%
65.0%
70.0%
75.0%
80.0%
85.0%
90.0%
95.0%
100.0%
2007 2008 2009 2010 2011
CRCT: Science (Percent Passing)
Marietta Center for Advanced Academics
Marietta City
State of Georgia
65.0%
70.0%
75.0%
80.0%
85.0%
90.0%
95.0%
100.0%
2007 2008 2009 2010 2011
CRCT: Social Studies (Percent Passing)Marietta Center for Advanced Academics
Marietta City
State of Georgia
65.0%
70.0%
75.0%
80.0%
85.0%
90.0%
95.0%
100.0%
2007 2008 2009 2010 2011
Percent of Students Missing Less Than 15 Days
Marietta Center for Advanced Academics
Marietta City
State of Georgia
Dr. John D. Barge, State School Superintendent
Page 176 of 242

Teachers
Administrators
Support Staff
Teacher Attrition Rate
Principal
School Board Chair
Asian Black Hispanic White Multi LEP SWD F/R Lunch
School 3% 49% 21% 24% 2% 6% 11% 58%
District 3% 46% 30% 19% 3% 16% 12% 75%
Does Not
Meet7.3% 7.3% Equal 10.0% Equal 7.2% 7.2% Equal
Meets 41.9% 42.2% No 35.3% No 38.5% 38.6% No
Meets +
Exceeds92.7% 92.7% No 90.0% Yes 92.8% 92.8% No
2011 Met Did Not Meet Yes 2011 85.8% 85.5% Yes
2010 Met Met Equal 2010 80.5% 80.3% Yes
2009 Met Met Equal 2009 83.7% 83.6% Yes
2008 Did Not Meet Did Not Meet Equal 2008 77.8% 77.8% Equal
2007 Met Met Equal 2007 78.8% 78.8% Equal
Better
than
District
District
District
Marietta High School 1171 Whitlock Ave SW
Marietta, GA 30064-1932
770.428.2631
School
ELA
Grades
Enrollment
District
Charter System
School
Native American
1%
Better
Than
District
Math
Adequate Yearly Progress Graduation Rate
School District
Mission Statement
The mission of Marietta City Schools is to prepare each of our students through academic achievement for life success.
Year
Key Facts Personnel
Science
Instructional Days
9.5K-5
178
6/12/2008
6/30/2013
Charter Initially Approved
Current Charter End
Marietta City 132.28
81893
0%
N/A
Leigh Colburn
Student Demographics
Better
than
District
Better
than
District
Academic Achievements
9.8%
Year
Better
Than
District
90.2%
35.2%
School
0%
2011 GHSGT
School District
Dr. John D. Barge, State School Superintendent
Page 177 of 242

Block Yes Multi-age grouping Yes Career Academy No
Shortened Day Yes Student/teacher teams No International Baccalaureate Program Yes
Extended Day Yes Grades subdivided into houses No Pre-K No
Extended Week No Students remain with teacher 2+ years Yes After School Programs No
Extended Year Yes Single gender classes No Community Service Yes
•
•
•
Goal 1:
Goal 2:
Target:
Goal 3:
Target:
Goal 4:
Target:
Increase the percentage of high school students passing the English Language Arts section of the Georgia High School
Graduation Test (GHSGT).
93.6% of students passed the ELA section of the GHSGT.
Met Goal
1171 Whitlock Ave SW
Met Goal
Classroom Arrangements
What makes Marietta High School Unique?
Decrease the percentage of students that do not pass the English Language Arts section of the GHSGT.
Less than 9.2% of students
Marietta High School was named by the GaDOE as an AP Access and Support School, 2010; US News and World Report lists Marietta High
School as one of “America’s Best High Schools”, 2010; Newsweek ranks Marietta High School in top 5% of high schools in the USA, 2010;
Washington Post ranks Marietta High School as one of America’s top high schools in the National High School Challenge Index, 2011 (45th in
Georgia)
Marietta High School makes AYP – Graduation rate increased from 80% to 85%, African-American graduation rate increases from 76% to
88%, Economically Disadvantaged increases 74% to 83%, 2011
Marietta High School sustains its status as an IB World School, 2011; Marietta High School ACT scores outpace state and national averages,
2011; Marietta High School SAT scores outpace state averages, 2011
Marietta, GA 30064-1932
Increase the percentage of students that pass the mathematics section of the GHSGT.
770.428.2631
Unique Accomplishments
Met Goal
Academic Goals
90.8% of students will pass the English Language Arts section of the GHSGT.
Increase the graduation rate.
At least, 85% of students will graduate on time.
Met Goal
2010-11 Results: Prior to the addition of summer graduates, the MHS graduation rate is 85.1%
Met/Did Not Meet:
2010-11 Results:
Met/Did Not Meet:
81.2% of students will pass the Mathematics section of the GHSGT.
2010-11 Results: 86.3% of students passed the GHSGT in mathematics.
6.4% did not pass the GHSGT ELA
2010-11 Results:
Met/Did Not Meet:
Target:
Marietta High School
Scheduling Instructional Type/Services Offered
Met/Did Not Meet:
Dr. John D. Barge, State School Superintendent
Page 178 of 242

1171 Whitlock Ave SW
5 Year History of GHSGT and Graduation Rate
Marietta, GA 30064-1932
770.428.2631
Marietta High School
65.0%
70.0%
75.0%
80.0%
85.0%
90.0%
95.0%
100.0%
2007 2008 2009 2010 2011
GHSGT: Mathematics (Percent Passing)
Marietta High School
Marietta City
State of Georgia
65.0%
70.0%
75.0%
80.0%
85.0%
90.0%
95.0%
100.0%
2007 2008 2009 2010 2011
GHSGT: English Language Arts (Percent Passing)
Marietta High School
Marietta City
State of Georgia
65.0%
70.0%
75.0%
80.0%
85.0%
90.0%
95.0%
100.0%
2007 2008 2009 2010 2011
GHSGT: Science (Percent Passing)
Marietta High School
Marietta City
State of Georgia
65.0%
70.0%
75.0%
80.0%
85.0%
90.0%
95.0%
100.0%
2007 2008 2009 2010 2011
GHSGT: Social Studies (Percent Passing)
Marietta High School
Marietta City
State of Georgia
65.00%
70.00%
75.00%
80.00%
85.00%
90.00%
95.00%
100.00%
2007 2008 2009 2010 2011
Graduation RateMarietta High School
Marietta City
State of Georgia
Dr. John D. Barge, State School Superintendent
Page 179 of 242

Teachers
Administrators
Support Staff
Teacher Attrition Rate
Principal
School Board Chair
Asian Black Hispanic White Multi LEP SWD F/R Lunch
School 3% 50% 28% 16% 3% 7% 11% 70%
District 3% 46% 30% 19% 3% 16% 12% 75%
Does Not
Meet8.9% 8.3% No 16.5% No 29.3% 23.1% No
Meets 63.5% 59.5% Yes 54.0% Yes 49.1% 48.8% Yes
Meets +
Exceeds91.1% 91.7% No 83.5% No 70.7% 76.9% No
2011 Did Not Meet Did Not Meet Equal 2011 12.2% 9.0% No
2010 Met Met Equal 2010 9.0% 8.7% No
2009 Met Met Equal 2009 9.9% 8.1% No
2008 Did Not Meet Did Not Meet Equal 2008 12.2% 10.0% No
2007 Met Met Equal 2007 13.8% 9.8% No
Charter Initially Approved Tim Jones
DistrictSchool
0%
2011 CRCT
School
Student Demographics
Better
than
District
Better
than
District
N/A
Academic Achievements
16.5%
Year
Better
Than
District
83.5%
63.4%
District
5.5K-5
178
6/12/2008
6/30/2013
Marietta City 77.75
41117
5%
Mission Statement
The mission of Marietta Middle School is to: M-make learning a priority everyday, M-meet and exceed expectations, S-successfully transition students to
high school and beyond.
Year
Key Facts Personnel
Instructional Days
Adequate Yearly Progress Percent Absent > 15 Days
School District
School
Native American
0%
Better
Than
District
Math Science
Marietta Middle School 121 Winn St NW
Marietta, GA 30064-2255
770.422.0311
School
ELA / Reading
Grades
Enrollment
Charter System
District
Better
than
District
District
Current Charter End
Dr. John D. Barge, State School Superintendent
Page 180 of 242

Block Yes Multi-age grouping Yes Career Academy No
Shortened Day No Student/teacher teams No International Baccalaureate Program Yes
Extended Day Yes Grades subdivided into houses No Pre-K No
Extended Week No Students remain with teacher 2+ years No After School Programs Yes
Extended Year No Single gender classes No Community Service Yes
•
•
•
Goal 1:
Goal 2:
Target:
Goal 3:
Target:
Goal 4:
Target:
Scheduling Instructional Type/Services Offered
2010-11 Results:
Met/Did Not Meet:
Target:
2010-11 Results: 8.77% of the population tested did not meet standards on the 2010-2011 Reading CRCT
Met/Did Not Meet:
2010-11 Results:
Met/Did Not Meet:
24% of all students will exceed standards on the 2010-2011 Science CRCT
2010-11 Results: 21.68% of all students exceeded standards on the 2010-2011 Science CRCT
Met/Did Not Meet:
Reduce the percentage of students not meeting standards on the Reading CRCT
Students not meeting standards on the 2010-2011 Reading CRCT will not surpass 12% of the population tested.
Increase the percent of all students exceeding standards on the Mathematics CRCT
23.50% of all students will exceed standards on the 2010-2011 Mathematics CRCT
Signed partnerships with Chick-fil-A and Dave and Busters and held community functions at both; Sponsored a brunch for local realtors; Hosted astronomers from
Georgia Tech, who spoke to students in STEM magnet; Honored with district customer Service Award
Unique Accomplishments
Met Goal
Academic Goals
21% of all students will exceed standards on the 2010-2011 Reading CRCT
Marietta, GA 30064-2255
Did not meet goal
20.07% of all students exceed standards on the 2010-2011 Mathematics
Classroom Arrangements
What makes Marietta Middle School Unique?
Did not meet goal
Increase the percent of all students exceeding standards on the Science CRCT
770.422.0311
Increased efforts for smooth high school transition, including visits from high school principal, figuring GPA, and reviewing course offerings; Took “high-priority” 8th graders
to high school to spend a day; Instituted a “flex” period in which students received tutoring, extended learning, and enrichments during the school day; Provided
mandatory math preview or review after the CRCT; Offered summer extension program for math support during the summer; Hosted a math family night; Began after-
school extended learning for students to complete missing assignments and receive tutoring; Created Spanish class for native Spanish speakers; Rewarded high-
achieving students with incentives, including Atlanta Hawks tickets; Participated in regional math competition
Met as collaborative teacher teams to revise curriculum maps and plan common assessments; Revised advisement program to emphasize goal setting and use of School
Fusion; Provided release time for teachers to observe each other’s classrooms and to visit other schools
Increase the percent of all students exceeding standards on the Reading CRCT
23.18% of all students exceeded standards on the 2010-2011 Reading CRCT
Marietta Middle School
Met Goal
121 Winn St NW
Dr. John D. Barge, State School Superintendent
Page 181 of 242

5 Year History of CRCT and Student Attendance
Marietta, GA 30064-2255
770.422.0311
121 Winn St NWMarietta Middle School
65.0%
70.0%
75.0%
80.0%
85.0%
90.0%
95.0%
100.0%
2007 2008 2009 2010 2011
CRCT: Mathematics (Percent Passing)
Marietta Middle School
Marietta City
State of Georgia
65.0%
70.0%
75.0%
80.0%
85.0%
90.0%
95.0%
100.0%
2007 2008 2009 2010 2011
CRCT: Reading (Percent Passing)
Marietta Middle School
Marietta City
State of Georgia
65.0%
70.0%
75.0%
80.0%
85.0%
90.0%
95.0%
100.0%
2007 2008 2009 2010 2011
CRCT: English Language Arts (Percent Passing)
Marietta Middle School
Marietta City
State of Georgia
60.0%
65.0%
70.0%
75.0%
80.0%
85.0%
90.0%
95.0%
100.0%
2007 2008 2009 2010 2011
CRCT: Science (Percent Passing)
Marietta Middle School
Marietta City
State of Georgia
40.0%
45.0%
50.0%
55.0%
60.0%
65.0%
70.0%
75.0%
80.0%
85.0%
90.0%
95.0%
100.0%
2007 2008 2009 2010 2011
CRCT: Social Studies (Percent Passing)
Marietta Middle School
Marietta City
State of Georgia
65.0%
70.0%
75.0%
80.0%
85.0%
90.0%
95.0%
100.0%
2007 2008 2009 2010 2011
Percent of Students Missing Less than 15 Days of School
Marietta Middle School
Marietta City
State of Georgia
Dr. John D. Barge, State School Superintendent
Page 182 of 242

Teachers
Administrators
Support Staff
Teacher Attrition Rate
Principal
School Board Chair
Asian Black Hispanic White Multi LEP SWD F/R Lunch
School 0% 34% 61% 3% 2% 46% 13% 100%
District 3% 46% 30% 19% 3% 16% 12% 75%
Does Not
Meet17.1% 8.3% No 16.5% No 27.7% 23.1% No
Meets 63.9% 59.5% Yes 54.0% Yes 53.5% 48.8% Yes
Meets +
Exceeds82.9% 91.7% No 83.5% No 72.3% 76.9% No
2011 Met Did Not Meet Yes 2011 4.8% 9.0% Yes
2010 Met Met Equal 2010 4.5% 8.7% Yes
2009 Met Met Equal 2009 4.3% 8.1% Yes
2008 Met Did Not Meet Yes 2008 4.3% 10.0% Yes
2007 Met Met Equal 2007 5.8% 9.8% Yes
Charter Initially Approved Corey Lawson
DistrictSchool
0%
2011 CRCT
School
Student Demographics
Better
than
District
Better
than
District
N/A
Academic Achievements
17.9%
Year
Better
Than
District
82.1%
55.6%
3K-5
178
6/12/2008
6/30/2013
Marietta City 46
2538
5%
Mission Statement
The stakeholders of Park Street are empowered to maximize the development of civic-minded individuals through open channels of communication that
foster relevant, engaging, and rigorous instruction with opportunities to serve their communities.
Year
Key Facts Personnel
Instructional Days
Adequate Yearly Progress Percent Absent > 15 Days
School District
School
Native American
0%
Better
Than
District
Math Science
Park Street Elementary School105 Park St SE
Marietta, GA 30060-2324
770.429.3180
School
ELA / Reading
Grades
Enrollment
Charter System
District
Current Charter End
District
Better
than
District
District
Dr. John D. Barge, State School Superintendent
Page 183 of 242

Block No Multi-age grouping No Career Academy No
Shortened Day Yes Student/teacher teams No International Baccalaureate Program No
Extended Day Yes Grades subdivided into houses No Pre-K No
Extended Week No Students remain with teacher 2+ years Yes After School Programs Yes
Extended Year No Single gender classes No Community Service No
•
•
•
Goal 1:
Goal 2:
Target:
Goal 3:
Target:
Goal 4:
Target:
Scheduling Instructional Type/Services Offered
Park Street Elementary School
2010-11 Results:
Met/Did Not Meet:
Target:
2010-11 Results: 19.05% of the population tested did not meet standards on the 2010-2011 Reading CRCT.
Met/Did Not Meet:
2010-11 Results:
Met/Did Not Meet:
19.67% of all students will exceed standards on the 2010-2011 Science CRCT
2010-11 Results: 18.75% of all students exceeded standards on the 2010-2011 Science CRCT
Met/Did Not Meet:
Reduce the percentage of students not meeting standards on the Reading CRCT.
Students not meeting standards on the 2010-2011 Reading CRCT will not surpass 12.67% of the population tested.
Increase the number of all students exceeding standards on the Mathematics CRCT
19.00% of all students will exceed standards on the 2010-2011 Mathematics CRCT
Park Street earned Distinguished Title I honors for 2010-11 from the Georgia Department of Education for making AYP eight (8) consecutive years. All AYP subgroups
met or exceeded the annual measureable objectives in reading, English Language Arts, and mathematics. The 2010-11 3rd and 4th grade students had a sharp increase
of students that exceeded standards in math. In grades, 3, 4 & 5, there average 12% point increases of students who exceeded standards in science.
Unique Accomplishments
Met Goal
Academic Goals
13.00% of all students will exceed standards on the 2010-2011 Reading CRCT
Marietta, GA 30060-2324
Did not meet goal
105 Park St SE
Did not meet goal but made progress towards goal. Missed target by .92%
26.59% of all students exceeded standards on the 2010-2011 Mathematics CRCT
Classroom Arrangements
What makes Park Street Elementary School Unique?
Met Goal
Increase the number of all students exceeding standards on the Science CRCT
PSE earned Gold Green Status as a county Green school with 75% of all of teachers having taught at least 5 challenging and beneficial academic green lesson during
the year.
In collaboration with our district and the state food nutrition offices, PSE received the Fresh, Fruit and Vegetable grant. The grant delivered locally grown fresh produce
daily for every child with no cost associated to the school. PSE was also chosen by Center for Prevention & Health Promotion Cobb & Douglas Public Health Department
and received state merit vaccines for all students in grades K-5. This preventative measure provided all students an opportunity to receive free vaccinations.
Increase the number of all students exceeding standards on the Reading CRCT
20.63% of all students exceeded standards on the 2010-2011 Reading CRCT
770.429.3180
Dr. John D. Barge, State School Superintendent
Page 184 of 242

5 Year History of CRCT and Student Attendance
Marietta, GA 30060-2324
770.429.3180
105 Park St SE Park Street Elementary School
65.0%
70.0%
75.0%
80.0%
85.0%
90.0%
95.0%
100.0%
2007 2008 2009 2010 2011
CRCT: Mathematics (Percent Passing) Park Street Elementary School
Marietta City
State of Georgia
65.0%
70.0%
75.0%
80.0%
85.0%
90.0%
95.0%
100.0%
2007 2008 2009 2010 2011
CRCT: Reading (Percent Passing)
Park Street Elementary School
Marietta City
State of Georgia
65.0%
70.0%
75.0%
80.0%
85.0%
90.0%
95.0%
100.0%
2007 2008 2009 2010 2011
CRCT: English Language Arts (Percent Passing)
Park Street Elementary School
Marietta City
State of Georgia
45.0%
50.0%
55.0%
60.0%
65.0%
70.0%
75.0%
80.0%
85.0%
90.0%
95.0%
100.0%
2007 2008 2009 2010 2011
CRCT: Science (Percent Passing)
Park Street Elementary School
Marietta City
State of Georgia
55.0%
60.0%
65.0%
70.0%
75.0%
80.0%
85.0%
90.0%
95.0%
100.0%
2007 2008 2009 2010 2011
CRCT: Social Studies (Percent Passing)
Park Street Elementary School
Marietta City
State of Georgia
65.0%
70.0%
75.0%
80.0%
85.0%
90.0%
95.0%
100.0%
2007 2008 2009 2010 2011
Percent of Students Missing Less than 15 Days of School
Park Street Elementary School
Marietta City
State of Georgia
Dr. John D. Barge, State School Superintendent
Page 185 of 242

Teachers
Administrators
Support Staff
Teacher Attrition Rate
Principal
School Board Chair
Asian Black Hispanic White Multi LEP SWD F/R Lunch
School 2% 24% 7% 64% 3% 3% 13% 33%
District 3% 46% 30% 19% 3% 16% 12% 75%
Does Not
Meet5.5% 8.3% Yes 16.5% Yes 10.3% 23.1% Yes
Meets 34.0% 59.5% No 54.0% No 28.9% 48.8% No
Meets +
Exceeds94.5% 91.7% Yes 83.5% Yes 89.7% 76.9% Yes
2011 Met Did Not Meet Yes 2011 4.6% 9.0% Yes
2010 Met Met Equal 2010 4.7% 8.7% Yes
2009 Met Met Equal 2009 2.4% 8.1% Yes
2008 Met Did Not Meet Yes 2008 4.0% 10.0% Yes
2007 Met Met Equal 2007 3.6% 9.8% Yes
District
Current Charter End
District
Better
than
District
District
West Side Elementary School344 Polk St NW
Marietta, GA 30064-2308
770.429.3172
School
ELA / Reading
Grades
Enrollment
Charter System
School
Native American
0%
Better
Than
District
Math Science
Adequate Yearly Progress Percent Absent > 15 Days
School District
Mission Statement
Imagine a school...Where all children are recognized for their gifts and talents. Where all children build on their strengths and achieve at high levels through enrichment experiences,
independent research, scientific experiments, writing, music, art, and problem-solving. Where members of the school community collaborate to achieve that vision. Where ideas begin.
Year
Key Facts Personnel
Instructional Days
3K-5
178
6/12/2008
6/30/2013
Marietta City 37.48
2473
3%
Jennifer Lawson
Academic Achievements
9.3%
Year
Better
Than
District
90.7%
29.4%
Charter Initially Approved Karen Smits
DistrictSchool
0%
2011 CRCT
School
Student Demographics
Better
than
District
Better
than
District
Dr. John D. Barge, State School Superintendent
Page 186 of 242

Block No Multi-age grouping No Career Academy No
Shortened Day No Student/teacher teams No International Baccalaureate Program No
Extended Day Yes Grades subdivided into houses No Pre-K No
Extended Week No Students remain with teacher 2+ years No After School Programs Yes
Extended Year Yes Single gender classes No Community Service No
•
•
•
Goal 1:
Goal 2:
Target:
Goal 3:
Target:
Goal 4:
Target:
Achievement - significant increases in percentages of students exceeding standards for grades 3-5. 100% of fifth grade students met or
exceeded on the Fifth Grade Writing Assessment.
N/A
Increase the number of students who exceeded standards on the 2010-11 Reading CRCT
64% of all students exceeded standards on the 2010-11 Reading CRCT
Did not meet goal
344 Polk St NW
Met Goal
61.27% of all students exceeded standards on the 2010-11 Mathematics CRCT
Classroom Arrangements
What makes West Side Elementary School Unique?
Met Goal
Marietta, GA 30064-2308
Increase the number of all students who exceed standards on the Science CRCT
770.429.3172
Unique Accomplishments
Met Goal
Academic Goals
33% of all students will exceed standards on the 2010-11 Reading CRCT
Reduce the percentage of students that do not meet standards on the Reading CRCT
No moer than 3.33% of all students will not meet standards on the 2010-11 Reading CRCT
Increase the number of all students who exceed standards on the Mathematics CRCT
32.67% of all students will exceed standards on the 2010-11 Mathematics CRCT
Increased focus on integrating technology across the curriculum (addition of two laptop carts) and use of Web 2.0 tools. Start of morning news
production hosted by students.
2010-11 Results: 6% of all students DNM standards on the 2010-11 Reading CRCT
Met/Did Not Meet:
2010-11 Results:
Met/Did Not Meet:
26.33% of all students will exceed standards on the 2010-11 Science CRCT
2010-11 Results: 60.78% of all students exceeded standards on the 2010-11 Science CRCT
Met/Did Not Meet:
2010-11 Results:
Met/Did Not Meet:
Target:
Scheduling Instructional Type/Services Offered
West Side Elementary School
Dr. John D. Barge, State School Superintendent
Page 187 of 242

5 Year History of CRCT and Student Attendance
Marietta, GA 30064-2308
770.429.3172
West Side Elementary School344 Polk St NW
65.0%
70.0%
75.0%
80.0%
85.0%
90.0%
95.0%
100.0%
2007 2008 2009 2010 2011
CRCT: Mathematics (Percent Passing)
West Side Elementary School
Marietta City
State of Georgia
65.0%
70.0%
75.0%
80.0%
85.0%
90.0%
95.0%
100.0%
2007 2008 2009 2010 2011
CRCT: Reading (Percent Passing)
West Side Elementary School
Marietta City
State of Georgia
65.0%
70.0%
75.0%
80.0%
85.0%
90.0%
95.0%
100.0%
2007 2008 2009 2010 2011
CRCT: English Language Arts (Percent Passing)
West Side Elementary School
Marietta City
State of Georgia
60.0%
65.0%
70.0%
75.0%
80.0%
85.0%
90.0%
95.0%
100.0%
2007 2008 2009 2010 2011
CRCT: Science (Percent Passing)West Side Elementary School
Marietta City
State of Georgia
65.0%
70.0%
75.0%
80.0%
85.0%
90.0%
95.0%
100.0%
2007 2008 2009 2010 2011
CRCT: Social Studies (Percent Passing)
West Side Elementary School
Marietta City
State of Georgia
65.0%
70.0%
75.0%
80.0%
85.0%
90.0%
95.0%
100.0%
2007 2008 2009 2010 2011
Percent of Students Missing Less than 15 Days of School
West Side Elementary School
Marietta City
State of Georgia
Dr. John D. Barge, State School Superintendent
Page 188 of 242

Charter Term
High School
Total Schools
2007 2008 2009 2010 2011
No No Yes No No
2011 12.4% 8.8% No 2011 75.1% 80.9% No
2010 20.8% 9.7% No 2010 72.3% 80.8% No
2009 9.0% 8.7% No 2009 75.0% 78.9% No
2008 10.1% 9.5% No 2008 69.5% 75.4% No
2007 10.1% 10.0% No 2007 63.8% 72.3% No
7.2% 7.9% Yes 10.5% 8.3% No
62.7% 56.1% Yes 55.3% 37.0% Yes
92.8% 92.1% Yes 89.5% 91.7% No
15.9% 15.3% No 12.4% 15.5% Yes
56.6% 50.7% Yes 43.8% 37.5% Yes
84.1% 84.7% No 87.6% 84.5% Yes
706.485.5381
Number of Schools
Does Not Meet
Key Facts
Putnam County Charter System
Adequate Yearly Progress
158 Old Glenwood Springs Rd
Eatonton, GA 31024
Elementary
Math
15
Academic Achievements
Graduation Rate
System
5/10/2010
6/30/2015
Charter Approved
4Charter End
State
2Opened
1
8/10/2010
Middle
Percent Absent > 15 Days
Better
Than State
Does Not Meet
StateBetter
Than StateYear System
Does Not Meet
Meets
System State
Meets + Exceeds
Year
Better
than State
Does Not Meet
ELA
System State
Better
than State
Math
System
2011 CRCT
ELA / Reading
Meets + Exceeds
State
Meets
Meets + Exceeds
2011 GHSGT
Meets
Meets
Better than
State
Meets + Exceeds
StateBetter than
StateSystem
Dr. John D. Barge, State School Superintendent
Page 189 of 242

Asian Black Hispanic White Multi LEP SWD F/ R Lunch
System 0.5% 42.3% 8.3% 45.8% 3.1% 3.5% 17.7% 72.6%
State 3.0% 37.0% 12.0% 44.0% 3.0% 6.0% 10.0% 57.0%
1)
2)
3)
4)
5)
2007 2008 2009 2010 2011
No No No No No
Yes Yes Yes Yes Yes
No No No No No
Charter System Strategic Goals:
Charter System Schools
Charter System Schools Adequate Yearly Progress
0.0%
0.0%
Native American
Putnam County Middle School
Putnam County Elementary School
Actively engage parents and community in the educational process.
Putnam County High School
Provide educationally appropriate facilities, nutrition program, and transportation system supportive of learning.
706.485.5381
To ensure high levels of performance for all students in Putnam County.
Align financial expenditures and human resources with improved student performance.
Develop leadership capacity in all staff.
Student Demographics
Putnam County Charter System158 Old Glenwood Springs Rd
Eatonton, GA 31024
Dr. John D. Barge, State School Superintendent
Page 190 of 242

5 Year History CRCT
Putnam County Charter System Eatonton, GA 31024
706.485.5381
158 Old Glenwood Springs Rd
65.0%
70.0%
75.0%
80.0%
85.0%
90.0%
95.0%
100.0%
2007 2008 2009 2010 2011
CRCT: Math(Percent Passing)
Putnam County Charter System
State of Georgia
65.0%
70.0%
75.0%
80.0%
85.0%
90.0%
95.0%
100.0%
2007 2008 2009 2010 2011
CRCT: Reading/ELA(Percent Passing)
Putnam County Charter System
State of Georgia
65.0%
70.0%
75.0%
80.0%
85.0%
90.0%
95.0%
100.0%
2007 2008 2009 2010 2011
CRCT: Social Studies(Percent Passing)
Putnam County Charter System
State of Georgia
65.0%
70.0%
75.0%
80.0%
85.0%
90.0%
95.0%
100.0%
2007 2008 2009 2010 2011
CRCT: Science(Percent Passing)
Putnam County Charter System
State of Georgia
Dr. John D. Barge, State School Superintendent
Page 191 of 242

5 Year History GHSGT and Graduation Rate
Putnam County Charter System158 Old Glenwood Springs Rd
Eatonton, GA 31024
706.485.5381
65.0%
70.0%
75.0%
80.0%
85.0%
90.0%
95.0%
100.0%
2007 2008 2009 2010 2011
GHSGT: English Language Arts(Percent Passing)
Putnam County Charter System
State of Georgia
65.0%
70.0%
75.0%
80.0%
85.0%
90.0%
95.0%
100.0%
2007 2008 2009 2010 2011
GHSGT: Math(Percent Passing)
Putnam County Charter System
State of Georgia
65.0%
70.0%
75.0%
80.0%
85.0%
90.0%
95.0%
100.0%
2007 2008 2009 2010 2011
GHSGT: Science(Percent Passing)
Putnam County Charter System
State of Georgia
65.0%
70.0%
75.0%
80.0%
85.0%
90.0%
95.0%
100.0%
2007 2008 2009 2010 2011
GHSGT: Social Studies(Percent Passing)
Putnam County Charter System
State of Georgia
55.0%
60.0%
65.0%
70.0%
75.0%
80.0%
85.0%
90.0%
95.0%
100.0%
2007 2008 2009 2010 2011
High School Graduation Rate
Putnam County Charter System
State of Georgia
Dr. John D. Barge, State School Superintendent
Page 192 of 242

Teachers
Administrators
Support Staff
Teacher Attrition Rate
Principal
School Board Chair
Asian Black Hispanic White Multi LEP SWD F/R Lunch
School 0% 38% 8% 49% 4% 6% 16% 76%
District 0% 42% 8% 46% 3% 4% 18% 73%
Does Not
MeetN/A 7.2% N/A 15.9% N/A N/A 24.6% N/A
Meets N/A 62.7% N/A 56.6% N/A N/A 50.0% N/A
Meets +
ExceedsN/A 92.8% N/A 84.1% N/A N/A 75.4% N/A
2011 Did Not Meet Did Not Meet Equal 2011 5.9% 12.4% Yes
2010 Met Did Not Meet Yes 2010 7.5% 20.8% Yes
2009 Met Met Equal 2009 5.1% 9.0% Yes
2008 N/A Did Not Meet N/A 2008 N/A 10.1% N/A
2007 N/A Did Not Meet N/A 2007 N/A 10.1% N/A
Charter Initially Approved Fernando Aker
DistrictSchool
0%
2011 CRCT
School
Student Demographics
Better
than
District
Better
than
District
Fanicia Harris
Academic Achievements
N/A
Year
Better
Than
District
N/A
N/A
56-8
177
5/10/2010
6/30/2015
Putnam County 63
4758
1%
Mission Statement
To develop a strong, well-rounded foundation that will lead to an enriched and successful life for out students.
Year
Key Facts Personnel
Instructional Days
Adequate Yearly Progress Percent Absent > 15 Days
School District
Native American
0%
Better
Than
District
Math Science
District
Putnam County Primary School162 Old Glenwood Springs Rd
Eatonton, GA 31024-6525
706.485.5141
School
ELA / Reading
Grades
Enrollment
Charter System
District
Better
than
District
DistrictSchool
Current Charter End
Dr. John D. Barge, State School Superintendent
Page 193 of 242

Block Yes Multi-age grouping Yes Career Academy No
Shortened Day No Student/teacher teams Yes International Baccalaureate Program No
Extended Day Yes Grades subdivided into houses Yes Pre-K No
Extended Week No Students remain with teacher 2+ years No After School Programs Yes
Extended Year No Single gender classes No Community Service Yes
•
•
•
Goal 1:
Goal 2:
Target:
Goal 3:
Target:
Goal 4:
Target:
Scheduling Instructional Type/Services Offered
706.485.5141
2010-11 Results:
Met/Did Not Meet:
Target:
2010-11 Results: No Results - The PPVT was removed as a measure because it was outdated and did not yield usable data.
Met/Did Not Meet:
2010-11 Results:
Met/Did Not Meet:
Exceed the state average by 5% for all subgroups
2010-11 Results: No Results - CRCT was not available for 1st and 2nd graders in 2010-2011
Met/Did Not Meet:
Every kindergartener going to 1st grade will have an ending Peabody Picture Vocabulary Test (PPV) score at or above the 75th
percentile.
Every kindergartener will have a PPV score at 7th percentile or above
Reduce the gap between all subgroups in 1st and 2nd grade by 5% each year with the ultimate goal of all subgroups meeting the
NCLB annual measurable objectives.
Exceed the state average by 5% in all subgroups in 1st and 2nd grade in math and reading/ELA
Close the gap between subgroups by 5% each year
Did not meet goal but made progress towards goal. CRCT not available for 1st and 2nd grade
Putnam County Primary School
Increased the number of students that score exceeds by 10%
Putnam Primary School implemented a character program to foster positive behavior and interaction involving our students. Students were
recognized weekly for the exemplary character and behavior.
Eatonton, GA 31024-6525
Classroom Arrangements
What makes Putnam County Primary School Unique?
Did not meet goal but made progress towards goal. CRCT not available for 1st and 2nd grade
Unique Accomplishments
Academic Goals
Putnam County Primary established a Parent Teacher Organization to improve parental and community involvement. Our school experienced
an increase in parental participation in school events and activities.
Student attendance improved for the 2011 school year for Putnam Primary School. The number of the students with 15 or more absences
decreased by 2% from the previous year.
Increase the number of students who exceed by 10% in 1st and 2nd grade in reading, ELA and math while decreasing the DNM to
meet the NCLB Annual Measurable Objective
No Results - CRCT was not available for 1st and 2nd graders in 2010-2011
Did not meet goal but made progress towards goal. No data available
162 Old Glenwood Springs Rd
Did not meet goal but made progress towards goal. CRCT not available for 1st and 2nd grade
No Results - CRCT was not available for 1st and 2nd graders in 2010-2011
Dr. John D. Barge, State School Superintendent
Page 194 of 242

5 Year History of CRCT and Student Attendance
Eatonton, GA 31024-6525
706.485.5141
Putnam County Primary School162 Old Glenwood Springs Rd
65.0%
70.0%
75.0%
80.0%
85.0%
90.0%
95.0%
100.0%
2007 2008 2009 2010 2011
CRCT: Mathematics (Percent Passing)
Putnam County Primary School
Putnam County
State of Georgia
65.0%
70.0%
75.0%
80.0%
85.0%
90.0%
95.0%
100.0%
2007 2008 2009 2010 2011
CRCT: Reading (Percent Passing)
Putnam County Primary School
Putnam County
State of Georgia
65.0%
70.0%
75.0%
80.0%
85.0%
90.0%
95.0%
100.0%
2007 2008 2009 2010 2011
CRCT: English Language Arts (Percent Passing)
Putnam County Primary School
Putnam County
State of Georgia
65.0%
70.0%
75.0%
80.0%
85.0%
90.0%
95.0%
100.0%
2007 2008 2009 2010 2011
CRCT: Science (Percent Passing)
Putnam County Primary School
Putnam County
State of Georgia
65.0%
70.0%
75.0%
80.0%
85.0%
90.0%
95.0%
100.0%
2007 2008 2009 2010 2011
CRCT: Social Studies (Percent Passing)
Putnam County Primary School
Putnam County
State of Georgia
65.0%
70.0%
75.0%
80.0%
85.0%
90.0%
95.0%
100.0%
2007 2008 2009 2010 2011
Percent of Students Missing Less than 15 Days of School
Putnam County Primary School
Putnam County
State of Georgia
Dr. John D. Barge, State School Superintendent
Page 195 of 242

Teachers
Administrators
Support Staff
Teacher Attrition Rate
Principal
School Board Chair
Asian Black Hispanic White Multi LEP SWD F/R Lunch
School 1% 39% 9% 48% 3% 5% 22% 75%
District 0% 42% 8% 46% 3% 4% 18% 73%
Does Not
Meet7.3% 7.2% No 15.9% Yes 17.6% 24.6% Yes
Meets 60.6% 62.7% No 56.6% No 50.7% 50.0% Yes
Meets +
Exceeds92.7% 92.8% No 84.1% Yes 82.4% 75.4% Yes
2011 Did Not Meet Did Not Meet Equal 2011 3.8% 12.4% Yes
2010 Met Did Not Meet Yes 2010 6.1% 20.8% Yes
2009 N/A Met N/A 2009 N/A 9.0% N/A
2008 N/A Did Not Meet N/A 2008 N/A 10.1% N/A
2007 N/A Did Not Meet N/A 2007 N/A 10.1% N/A
Charter Initially Approved Raymond Braziel
DistrictSchool
0%
2011 CRCT
School
Student Demographics
Better
than
District
Better
than
District
14.0%
Year
Better
Than
District
86.0%
52.1%
2K-5
176
5/10/2010
6/30/2015
Putnam County 46.5
4665
9%
Mission Statement
The mission of the Putnam Elementary is to educate and inspire all to be successful lifelong learners.
Year
Key Facts Personnel
Instructional Days
Adequate Yearly Progress Percent Absent > 15 Days
School District
School
Native American
0%
Better
Than
District
Math Science
Putnam County Elementary School314 S Washington Ave
Eatonton, GA 31024-1126
706.485.5312
School
ELA / Reading
Grades
Enrollment
Charter System
District
Better
than
District
District District
Current Charter End Al Mead
Academic Achievements
Dr. John D. Barge, State School Superintendent
Page 196 of 242

Block Yes Multi-age grouping No Career Academy No
Shortened Day No Student/teacher teams Yes International Baccalaureate Program No
Extended Day No Grades subdivided into houses Yes Pre-K No
Extended Week No Students remain with teacher 2+ years No After School Programs Yes
Extended Year No Single gender classes No Community Service Yes
•
•
•
Goal 1:
Goal 2:
Target:
Goal 3:
Target:
Goal 4:
Target:
Scheduling Instructional Type/Services Offered
Putnam County Elementary School
2010-11 Results:
Met/Did Not Meet:
Target:
2010-11 Results: Met goal in all grades
Met/Did Not Meet:
2010-11 Results:
Met/Did Not Meet:
10% increase on exceeds on CRCT in ELA
2010-11 Results: Met the goal in 3rd, did not meet in 4th and 5th
Met/Did Not Meet:
Increase the number of students who exceed by 10% in Science
10% increase on exceeds on CRCT in Science
Increase the number of student who exceed by 10% in math
10% increase on exceeds on CRCT in math
PCES implemented the following programs for the 2010-11 school term: Watch Dogs Program (Dads for Great Students)the program
encourages fathers or father figures to volunteer in our schoool daily.
Increase the number of students who exceed by 10% in ELA
706.485.5312
Unique Accomplishments
Did not meet goal but made progress towards goal. Met the goal in 3rd and 4th, did not meet in 4th
Eatonton, GA 31024-1126
Met Goal
314 S Washington Ave
Did not meet goal but made progress towards goal. Met the goal in 3rd, did not meet in 4th and 5th
Met the goal in 4th, did not meet in 3rd and 5th
Classroom Arrangements
What makes Putnam County Elementary School Unique?
Did not meet goal but made progress towards goal. Met the goal in 4th, did not meet in 3rd and 5th
PCES was featured on YouTube for our Garden Club and the support that our school receives fromthe community. The master Gardners of
Eatonton donates countless hours to this program.
Student of the Month Program helps to encourage good citizenship among our students and boosts parent involvement in our school
Increase the number of students who exceed by 10% in reading
Met the goal in 3rd and 4th, did not meet in 4th
Academic Goals
10% increase on exceeds on CRCT in Reading
Dr. John D. Barge, State School Superintendent
Page 197 of 242

5 Year History of CRCT and Student Attendance
Eatonton, GA 31024-1126
706.485.5312
Putnam County Elementary School314 S Washington Ave
65.0%
70.0%
75.0%
80.0%
85.0%
90.0%
95.0%
100.0%
2007 2008 2009 2010 2011
CRCT: Mathematics (Percent Passing)
Putnam County Elementary School
Putnam County
State of Georgia
65.0%
70.0%
75.0%
80.0%
85.0%
90.0%
95.0%
100.0%
2007 2008 2009 2010 2011
CRCT: Reading (Percent Passing)Putnam County Elementary School
Putnam County
State of Georgia
65.0%
70.0%
75.0%
80.0%
85.0%
90.0%
95.0%
100.0%
2007 2008 2009 2010 2011
CRCT: English Language Arts (Percent Passing)
Putnam County Elementary School
Putnam County
State of Georgia
65.0%
70.0%
75.0%
80.0%
85.0%
90.0%
95.0%
100.0%
2007 2008 2009 2010 2011
CRCT: Science (Percent Passing)Putnam County Elementary School
Putnam County
State of Georgia
65.0%
70.0%
75.0%
80.0%
85.0%
90.0%
95.0%
100.0%
2007 2008 2009 2010 2011
CRCT: Social Studies (Percent Passing)
Putnam County Elementary School
Putnam County
State of Georgia
65.0%
70.0%
75.0%
80.0%
85.0%
90.0%
95.0%
100.0%
2007 2008 2009 2010 2011
Percent of Students Missing Less than 15 Days of SchoolPutnam County Elementary School
Putnam County
State of Georgia
Dr. John D. Barge, State School Superintendent
Page 198 of 242

Teachers
Administrators
Support Staff
Teacher Attrition Rate
Principal
School Board Chair
Asian Black Hispanic White Multi LEP SWD F/R Lunch
School 0% 46% 8% 42% 3% 2% 18% 76%
District 0% 42% 8% 46% 3% 4% 18% 73%
Does Not
Meet7.1% 7.2% Yes 15.9% No 32.1% 24.6% No
Meets 64.9% 62.7% Yes 56.6% Yes 49.3% 50.0% No
Meets +
Exceeds92.9% 92.8% Yes 84.1% No 67.9% 75.4% No
2011 Did Not Meet Did Not Meet Equal 2011 9.9% 12.4% Yes
2010 Met Did Not Meet Yes 2010 13.7% 20.8% Yes
2009 Met Met Equal 2009 6.9% 9.0% Yes
2008 N/A Did Not Meet N/A 2008 N/A 10.1% N/A
2007 N/A Did Not Meet N/A 2007 N/A 10.1% N/A
Current Charter End
District
Better
than
District
District
Putnam County Middle School140 Sparta Hwy
Eatonton, GA 31024-8493
706.485.8547
School
ELA / Reading
Grades
Enrollment
Charter System
School
Native American
0%
Better
Than
District
Math Science
District
Adequate Yearly Progress Percent Absent > 15 Days
School District
Mission Statement
Ensuring a high level of learning for every student.
Year
Key Facts Personnel
Instructional Days
3.56-8
177
5/10/2010
6/30/2015
Putnam County 43.68
4624
7%
Amy Powers
Academic Achievements
18.0%
Year
Better
Than
District
82.0%
61.3%
Charter Initially Approved Susan Usry
DistrictSchool
0%
2011 CRCT
School
Student Demographics
Better
than
District
Better
than
District
Dr. John D. Barge, State School Superintendent
Page 199 of 242

Block No Multi-age grouping No Career Academy No
Shortened Day No Student/teacher teams No International Baccalaureate Program No
Extended Day Yes Grades subdivided into houses No Pre-K No
Extended Week No Students remain with teacher 2+ years No After School Programs Yes
Extended Year No Single gender classes No Community Service No
•
•
•
Goal 1:
Goal 2:
Target:
Goal 3:
Target:
Goal 4:
Target:
The school has seen dramatic improvement in the academic performance among 7th grade students. In ELA, math, science, and social studies, the percentage of
students exceeding the standard increased a minimum of 10% and in one case (Social Studies) doubled from 28.8% to 57.2%. Also in 7th grade, the percentage of
students not meeting the standard decreased in all areas, reducing the percentages by half or more in every case.
Last year also represented the first time we offered high school credit for computer classes, assisting 8th grade students in starting high school already possessing
Carnegie units.
Increase the number of students who exceed by 10% in 6th, 7th, and 8th grade in Reading, ELA, Math, and Science while
decreasing the DNM to meet the NCLB AMO.
6th grade EXC/DNM: R – 26.10%/6.10%; M – 19.2%/24%; ELA – 26.8%/9.5%; Science – 13.4%/32% 7th grade EXC/DNM: R –
18.4%/9.5; M – 31.8%/8.5%; ELA – 42.8%/6%; Science – 30.3%/15.9%8th grade EXC/DNM: R – 21.5%/6.7%; M – 8.5%/37.6%;
ELA – 32.10%/8.9%; Science – 11.9%/50.6%
Did not meet goal
140 Sparta Hwy
Did not meet goal but made progress towards goal. Unknown at this time due to state average not released.
ELA/Reading in grades 6th, 7th, and 8th – gaps in all subgroups increased between FY 10 and FY 11. Math – gaps in all
subgroups decreased by >10% except the gap between All Students and Economically Disadvantaged.
Classroom Arrangements
What makes Putnam County Middle School Unique?
Did not meet goal but made progress towards goal. Gaps decreased in some areas but increased in others.
Eatonton, GA 31024-8493
Unique Accomplishments
Did not meet goal but made progress towards goal. In some areas we did decrease the percentage not meeting the standard but
didn’t always increase the percentage exceeding the standard. This was inconsistent across grade levels and subjects. Some
areas did make progress and others did not. Overall, we did not meet the goal.
Putnam County Middle School
10% increase in EXC, any decrease in percentage DNM
10% increase each year of 8th graders reading at or above Lexile score for 8th grade based on Scholastic Reading Inventory
10% increase
Close the gap between all subgroups in 6th, 7th, and 8th grade by 10% each year with the ultimate goal of all subgroups meeting
the NCLB AMO.
Exceed the state average by 5% in all subgroups in 6th, 7th, and 8th grades in math and reading/ELA
10% reduction
PCMS was awarded Title I Distinguished School status. Our band received the highest ratings they have ever received at the State Band Festival. We excelled at local
and state competitions for our Beta Club, Math Club, and National History Day entries. The majority of our 4-H students placed in state competitions with their DPA
projects. All students belong to a club last year and participated in many local community based events.
2010-11 Results: FY 10 = 60% and FY 11 = 59%
Met/Did Not Meet:
2010-11 Results:
Met/Did Not Meet:
5% increase in performance over state averages
Academic Goals
2010-11 Results: Unable to calculate at the time due to no state averages being released.
Met/Did Not Meet:
2010-11 Results:
Met/Did Not Meet:
Target:
Scheduling Instructional Type/Services Offered
706.485.8547
Dr. John D. Barge, State School Superintendent
Page 200 of 242

140 Sparta Hwy
5 Year History of CRCT and Student Attendance
Eatonton, GA 31024-8493
706.485.8547
Putnam County Middle School
65.0%
70.0%
75.0%
80.0%
85.0%
90.0%
95.0%
100.0%
2007 2008 2009 2010 2011
CRCT: Mathematics (Percent Passing)
Putnam County Middle School
Putnam County
State of Georgia
65.0%
70.0%
75.0%
80.0%
85.0%
90.0%
95.0%
100.0%
2007 2008 2009 2010 2011
CRCT: Reading (Percent Passing)
Putnam County Middle School
Putnam County
State of Georgia
65.0%
70.0%
75.0%
80.0%
85.0%
90.0%
95.0%
100.0%
2007 2008 2009 2010 2011
CRCT: English Language Arts (Percent Passing)
Putnam County Middle School
Putnam County
State of Georgia
60.0%
65.0%
70.0%
75.0%
80.0%
85.0%
90.0%
95.0%
100.0%
2007 2008 2009 2010 2011
CRCT: Science (Percent Passing)
Putnam County Middle School
Putnam County
State of Georgia
55.0%
60.0%
65.0%
70.0%
75.0%
80.0%
85.0%
90.0%
95.0%
100.0%
2007 2008 2009 2010 2011
CRCT: Social Studies (Percent Passing)Putnam County Middle School
Putnam County
State of Georgia
65.0%
70.0%
75.0%
80.0%
85.0%
90.0%
95.0%
100.0%
2007 2008 2009 2010 2011
Percent of Students Missing Less than 15 Days of School
Putnam County Middle School
Putnam County
State of Georgia
Dr. John D. Barge, State School Superintendent
Page 201 of 242

Teachers
Administrators
Support Staff
Teacher Attrition Rate
Principal
School Board Chair
Asian Black Hispanic White Multi LEP SWD F/ R Lunch
School 0% 46% 8% 43% 2% 1% 15% 64%
District 0% 42% 8% 46% 3% 4% 18% 73%
Does Not
Meet10.5% 10.5% Equal 12.4% Equal 8.6% 8.6% Equal
Meets 55.3% 55.3% Equal 43.8% Equal 38.4% 38.4% Equal
Meets +
Exceeds89.5% 89.5% Equal 87.6% Equal 91.4% 91.4% Equal
2011 Did Not Meet Did Not Meet Equal 2011 75.1% 75.1% Equal
2010 Did Not Meet Did Not Meet Equal 2010 72.3% 72.3% Equal
2009 Met Met Equal 2009 75.0% 75.0% Equal
2008 N/A Did Not Meet N/A 2008 N/A 69.5% N/A
2007 N/A Did Not Meet N/A 2007 N/A 63.8% N/A
School
0%
2011 GHSGT
School District
Student Demographics
Better
than
District
Better
than
District
Academic Achievements
12.4%
Year
Better
Than
District
87.6%
43.8%
Putnam County 50.9
2.9714
9%
Donna Silva
Barry Lollis
Instructional Days
4.5K-5
177
5/10/2010
6/30/2015
Charter Initially Approved
Mission Statement
Assisting all students in acquiring knowledge, fostering aspirations, and developing life skills
that will empower them to become self-directing, productive and contributing members of a global society.
Year
Key Facts Personnel
ScienceMath
Adequate Yearly Progress Graduation Rate
School District
Current Charter End
Charter System
School
Native American
0%
Better
Than
District
District
Putnam County High School300 War Eagle Rd
Eatonton, GA 31024-2304
706.485.9971
School
ELA
Grades
Enrollment
District
Better
than
District
District
Dr. John D. Barge, State School Superintendent
Page 202 of 242
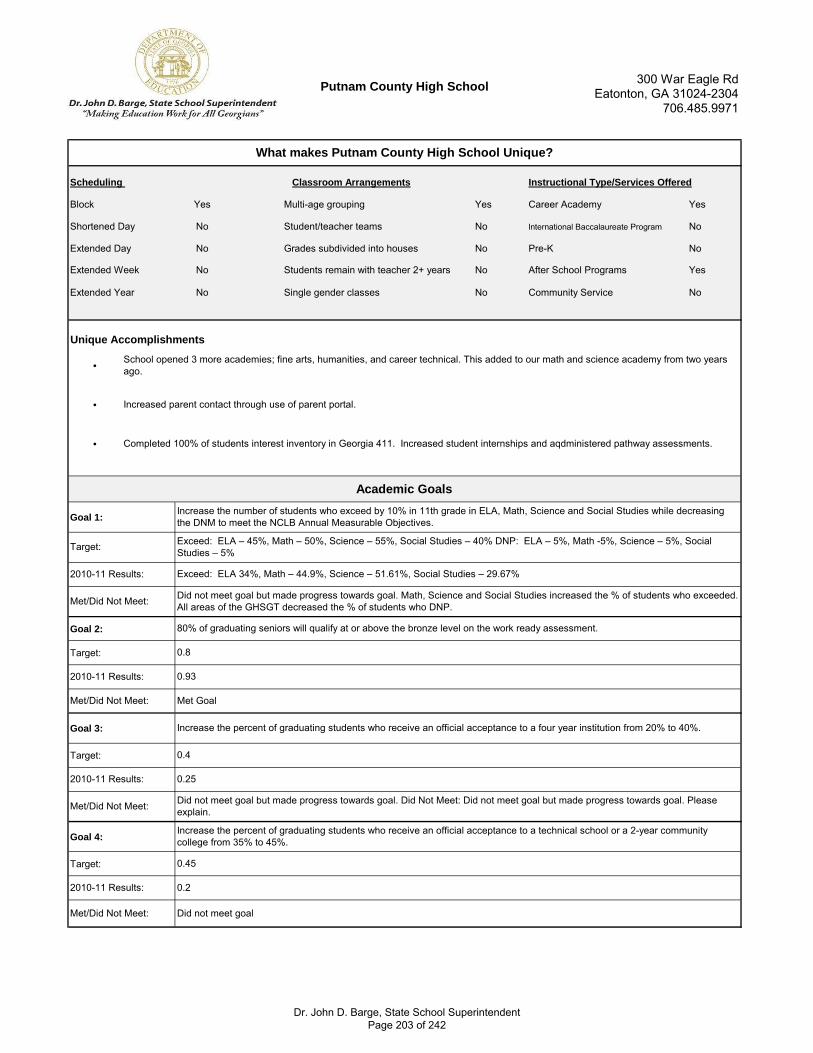
Block Yes Multi-age grouping Yes Career Academy Yes
Shortened Day No Student/teacher teams No International Baccalaureate Program No
Extended Day No Grades subdivided into houses No Pre-K No
Extended Week No Students remain with teacher 2+ years No After School Programs Yes
Extended Year No Single gender classes No Community Service No
•
•
•
Goal 1:
Goal 2:
Target:
Goal 3:
Target:
Goal 4:
Target:
Scheduling Instructional Type/Services Offered
2010-11 Results:
Met/Did Not Meet:
Target:
2010-11 Results: 0.2
Met/Did Not Meet:
2010-11 Results:
Met/Did Not Meet:
0.4
2010-11 Results: 0.25
Met/Did Not Meet:
Academic Goals
Exceed: ELA – 45%, Math – 50%, Science – 55%, Social Studies – 40% DNP: ELA – 5%, Math -5%, Science – 5%, Social
Studies – 5%
Increase the percent of graduating students who receive an official acceptance to a technical school or a 2-year community
college from 35% to 45%.
0.45
Increase the percent of graduating students who receive an official acceptance to a four year institution from 20% to 40%.
706.485.9971
Unique Accomplishments
Did not meet goal but made progress towards goal. Math, Science and Social Studies increased the % of students who exceeded.
All areas of the GHSGT decreased the % of students who DNP.
Eatonton, GA 31024-2304
Did not meet goal
0.93
Classroom Arrangements
What makes Putnam County High School Unique?
80% of graduating seniors will qualify at or above the bronze level on the work ready assessment.
0.8
300 War Eagle Rd
Did not meet goal but made progress towards goal. Did Not Meet: Did not meet goal but made progress towards goal. Please
explain.
Increased parent contact through use of parent portal.
Completed 100% of students interest inventory in Georgia 411. Increased student internships and aqdministered pathway assessments.
Increase the number of students who exceed by 10% in 11th grade in ELA, Math, Science and Social Studies while decreasing
the DNM to meet the NCLB Annual Measurable Objectives.
Exceed: ELA 34%, Math – 44.9%, Science – 51.61%, Social Studies – 29.67%
School opened 3 more academies; fine arts, humanities, and career technical. This added to our math and science academy from two years
ago.
Met Goal
Putnam County High School
Dr. John D. Barge, State School Superintendent
Page 203 of 242

5 Year History of GHSGT and Graduation Rate
Eatonton, GA 31024-2304
706.485.9971
Putnam County High School300 War Eagle Rd
65.0%
70.0%
75.0%
80.0%
85.0%
90.0%
95.0%
100.0%
2007 2008 2009 2010 2011
GHSGT: Mathematics (Percent Passing)
Putnam County High School
Putnam County
State of Georgia
65.0%
70.0%
75.0%
80.0%
85.0%
90.0%
95.0%
100.0%
2007 2008 2009 2010 2011
GHSGT: English Language Arts (Percent Passing)
Putnam County High School
Putnam County
State of Georgia
65.0%
70.0%
75.0%
80.0%
85.0%
90.0%
95.0%
100.0%
2007 2008 2009 2010 2011
GHSGT: Science (Percent Passing)
Putnam County High School
Putnam County
State of Georgia
65.0%
70.0%
75.0%
80.0%
85.0%
90.0%
95.0%
100.0%
2007 2008 2009 2010 2011
GHSGT: Social Studies (Percent Passing)
Putnam County High School
Putnam County
State of Georgia
60.00%
65.00%
70.00%
75.00%
80.00%
85.00%
90.00%
95.00%
100.00%
2007 2008 2009 2010 2011
Graduation Rate
Putnam County High School
Putnam County
State of Georgia
Dr. John D. Barge, State School Superintendent
Page 204 of 242

Elementary
Charter Term Middle
High School
Total Schools
2007 2008 2009 2010 2011
No No No No No
2011 14.6% 8.8% No 2011 70.2% 80.9% No
2010 11.6% 9.7% No 2010 75.5% 80.8% No
2009 10.2% 8.7% No 2009 68.0% 78.9% No
2008 5.1% 9.5% Yes 2008 70.1% 75.4% No
2007 5.2% 10.0% Yes 2007 56.0% 72.3% No
14.5% 7.9% No 9.3% 8.3% No
71.2% 56.1% Yes 62.8% 37.0% Yes
85.5% 92.1% No 90.7% 91.7% No
27.8% 15.3% No 11.6% 15.5% Yes
60.6% 50.7% Yes 60.5% 37.5% Yes
72.2% 84.7% No 88.4% 84.5% Yes
107 Academy St.
Warrenton, GA 30828
706.465.3383
Better
than State
Math
2011 GHSGT
Meets
Year System
Does Not Meet
Meets
ELA / Reading
System
2011 CRCT
Year System StateBetter
Than State
Does Not Meet
Better
than State
Graduation Rate
System
System State
Percent Absent > 15 Days
Better
Than State
ELA
Meets + Exceeds
State
State
Meets + Exceeds
State
Math
System
Better than
State
Better than
State
Does Not Meet
Meets
18/1/2008
5
6/12/2008
6/30/2013
Opened
1
Meets + Exceeds
Academic Achievements
1
State
Charter Approved
3Charter End
Warren County Schools
Adequate Yearly Progress
Meets + Exceeds
Key Facts Number of Schools
Does Not Meet
Meets
Dr. John D. Barge, State School Superintendent
Page 205 of 242

Asian Black Hispanic White Multi LEP SWD F/ R Lunch
System 0.3% 91.5% 0.1% 6.7% 1.3% 0.0% 14.4% 100.0%
State 3.0% 37.0% 12.0% 44.0% 3.0% 6.0% 10.0% 57.0%
1)
2)
3)
4)
5)
2007 2008 2009 2010 2011
Yes Yes Yes Yes Yes
No No No No No
Yes Yes Yes Yes Yes
Warren County Schools107 Academy St.
Warrenton, GA 30828
Freeman Elementary School
706.465.3383
Teachers, staff, parents, and students and community members will value students and share in the responsibility for providing a supportive learning
environment within our schools.
Teachers will be lifelong learners to support the chief priority of our school - student learning.
Students will be taught using multiple instructional strategies targeting unique learning styles and a variety of assessments of and for learning will be
used to demonstrate mastery of content and deficient areas.
A viable, challenging, prioritized, aligned and paced curriculum will be provided for all content areas and courses at each grade level thereby
graduating productive citizens.
Warren County Middle School
Warren County High School
The school system will be the catalyst in Warren County to promote acceptance, respect, and understanding by embracing and celebrating the
cultural diversity within the school and community to promote school and unity.
Native American
0.0%
0.0%
Student Demographics
Charter System Schools Adequate Yearly Progress
Charter System Strategic Goals:
Charter System Schools
Dr. John D. Barge, State School Superintendent
Page 206 of 242
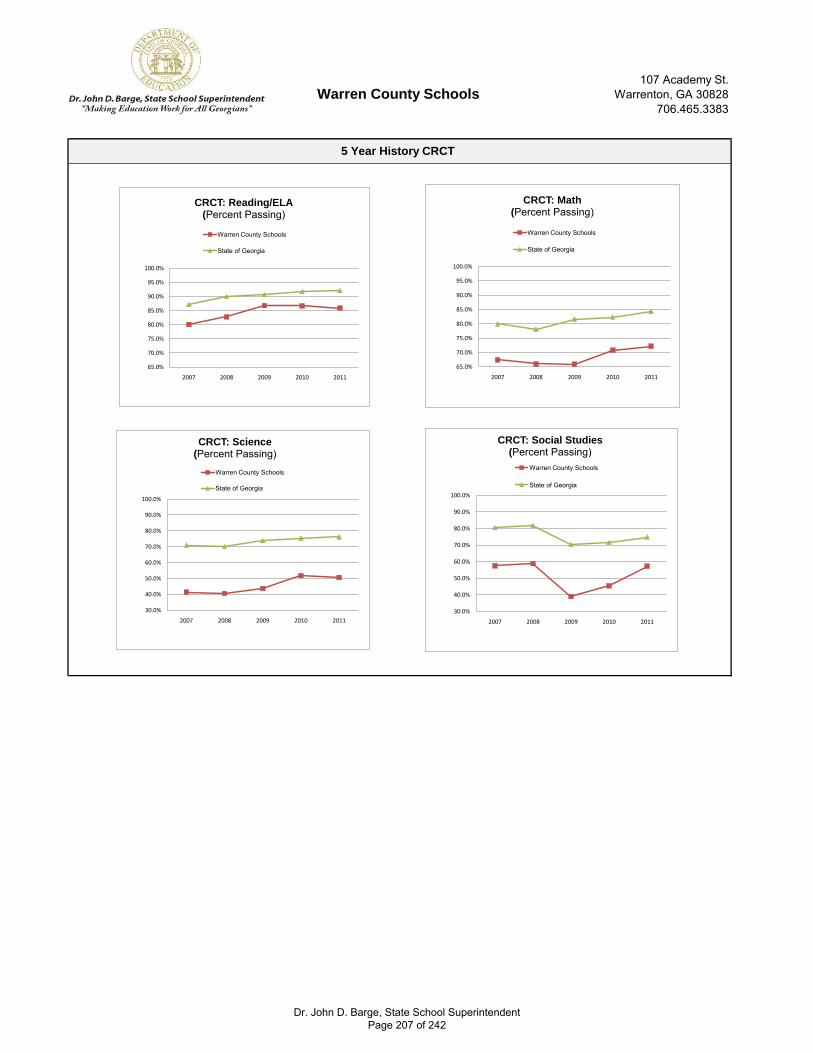
Warren County Schools107 Academy St.
Warrenton, GA 30828
706.465.3383
5 Year History CRCT
65.0%
70.0%
75.0%
80.0%
85.0%
90.0%
95.0%
100.0%
2007 2008 2009 2010 2011
CRCT: Math(Percent Passing)
Warren County Schools
State of Georgia
65.0%
70.0%
75.0%
80.0%
85.0%
90.0%
95.0%
100.0%
2007 2008 2009 2010 2011
CRCT: Reading/ELA(Percent Passing)
Warren County Schools
State of Georgia
30.0%
40.0%
50.0%
60.0%
70.0%
80.0%
90.0%
100.0%
2007 2008 2009 2010 2011
CRCT: Social Studies(Percent Passing)
Warren County Schools
State of Georgia
30.0%
40.0%
50.0%
60.0%
70.0%
80.0%
90.0%
100.0%
2007 2008 2009 2010 2011
CRCT: Science(Percent Passing)
Warren County Schools
State of Georgia
Dr. John D. Barge, State School Superintendent
Page 207 of 242

Warren County Schools
5 Year History GHSGT and Graduation Rate
107 Academy St.
Warrenton, GA 30828
706.465.3383
65.0%
70.0%
75.0%
80.0%
85.0%
90.0%
95.0%
100.0%
2007 2008 2009 2010 2011
GHSGT: English Language Arts(Percent Passing)
Warren County Schools
State of Georgia
65.0%
70.0%
75.0%
80.0%
85.0%
90.0%
95.0%
100.0%
2007 2008 2009 2010 2011
GHSGT: Math(Percent Passing)
Warren County Schools
State of Georgia
40.0%
50.0%
60.0%
70.0%
80.0%
90.0%
100.0%
2007 2008 2009 2010 2011
GHSGT: Science(Percent Passing)
Warren County Schools
State of Georgia
65.0%
70.0%
75.0%
80.0%
85.0%
90.0%
95.0%
100.0%
2007 2008 2009 2010 2011
GHSGT: Social Studies(Percent Passing)
Warren County Schools
State of Georgia
55.0%
60.0%
65.0%
70.0%
75.0%
80.0%
85.0%
90.0%
95.0%
100.0%
2007 2008 2009 2010 2011
High School Graduation Rate
Warren County Schools
State of Georgia
Dr. John D. Barge, State School Superintendent
Page 208 of 242

Teachers
Administrators
Support Staff
Teacher Attrition Rate
Principal
School Board Chair
Asian Black Hispanic White Multi LEP SWD F/R Lunch
School 0% 88% 0% 9% 2% 0% 20% 100%
District 0% 92% 0% 7% 1% 0% 14% 100%
Does Not
Meet19.1% 14.5% No 27.8% No 44.2% 49.3% Yes
Meets 68.8% 71.2% No 60.6% No 44.2% 40.1% Yes
Meets +
Exceeds80.9% 85.5% No 72.2% No 55.8% 50.7% Yes
2011 Did Not Meet Did Not Meet Equal 2011 18.2% 14.6% No
2010 Met Did Not Meet Yes 2010 13.2% 11.6% No
2009 Met Did Not Meet Yes 2009 13.1% 10.2% No
2008 Met Did Not Meet Yes 2008 5.0% 5.1% Yes
2007 Met Did Not Meet Yes 2007 3.7% 5.2% Yes
Charter Initially Approved Antonio Hill
DistrictSchool
0%
2011 CRCT
School
Student Demographics
Better
than
District
Better
than
District
32.7%
Year
Better
Than
District
67.3%
53.9%
1.37K-5
176
6/12/2008
6/30/2013
Warren County 25
2417
N/A
Mission Statement
"Committed to Putting Students First" is the mission of Mildred E. Freeman Elementary.
Year
Key Facts Personnel
Instructional Days
Adequate Yearly Progress Percent Absent > 15 Days
School District
School
Native American
0%
Better
Than
District
Math Science
Freeman Elementary School93 Hopgood St
Warrenton, GA 30828-7958
706.465.3342
School
ELA / Reading
Grades
Enrollment
Charter System
District
Better
than
District
District District
Current Charter End N/A
Academic Achievements
Dr. John D. Barge, State School Superintendent
Page 209 of 242

Block No Multi-age grouping No Career Academy No
Shortened Day No Student/teacher teams No International Baccalaureate Program No
Extended Day Yes Grades subdivided into houses No Pre-K No
Extended Week No Students remain with teacher 2+ years Yes After School Programs Yes
Extended Year No Single gender classes No Community Service Yes
•
•
•
Goal 1:
Goal 2:
Target:
Goal 3:
Target:
Goal 4:
Target:
Scheduling Instructional Type/Services Offered
Freeman Elementary School
2010-11 Results:
Met/Did Not Meet:
Target:
2010-11 Results: We were able to have a quorum for 4 governing concil meetings
Met/Did Not Meet:
2010-11 Results:
Met/Did Not Meet:
0.2
2010-11 Results: Our results 15%, 15% and 15% respectivley
Met/Did Not Meet:
Continue to maximize local governance by having a quorum for 4 governing council meetings.
An increase in participation of parents, community members and other stakeholders.
The percent of students exceeding the standards in reading, ELA, and math for 5th grade will increase from 3%,10%, and 0%
respectively to 20%
0.2
Our new community partnerships and activities consists of The Champs Program for student safety, Therapy Dogs for reading, A summer tutorial program to decrease
the the loss of student knowledge for primary students during summer months. We also have the Summer Bridge Program in a joing effort with Augusta State University.
We also worked with Jeffreson Energy to assist our school with providing funds for new playground equipment. We were also involved in an air quality study with Georgia
Health Sciences University. We instituted no referral parties for students along with "Happy Hour" where students had an opportunity to bring thier favorite electronic
device as a result of good conduct.
Will increase percent of students exceeding standards in reading, ELA and math in 3rd grade to 20% respectively.
706.465.3342
Unique Accomplishments
Did not meet goal but made progress towards goal. Our school performance was the same in 2010-2011 as it was in 2009-2010.
We did not make AYP in Math During 2010-11 because the AMO increased from 67% to 75%.
Warrenton, GA 30828-7958
Met Goal
93 Hopgood St
Did not meet goal but made progress towards goal. We were close in all three subject areas with 15% in each area.
9%, 12%, and 17% respectively
Classroom Arrangements
What makes Freeman Elementary School Unique?
Did not meet goal but made progress towards goal. M.E. Freeman made strong progress toward meeting the goal of 20% of
students exceeding standards in reading, ELA, and Math. Our math score in exceeds increased to 17% from 0%. We had an
increase in students exceeding in reading and ELA also.
We had the Ugandan Thunder Choir from Africa and we were able to provide our students with a personal cultural experience by having those students in class with our
students discussing thier customs and traditions.
M.E. Freeman also saw a dramatic increase in math performance at the fifth grade. Nearly 80% of our math students passed the test on the first try.
Continue making AYP each year through 2012-2013
Did Not meet AYP in Math
Academic Goals
To reach current Annual Measurable Objectives
Dr. John D. Barge, State School Superintendent
Page 210 of 242

5 Year History of CRCT and Student Attendance
Warrenton, GA 30828-7958
706.465.3342
Freeman Elementary School93 Hopgood St
60.0%
65.0%
70.0%
75.0%
80.0%
85.0%
90.0%
95.0%
100.0%
2007 2008 2009 2010 2011
CRCT: Mathematics (Percent Passing)
Freeman Elementary School
Warren County
State of Georgia
65.0%
70.0%
75.0%
80.0%
85.0%
90.0%
95.0%
100.0%
2007 2008 2009 2010 2011
CRCT: Reading (Percent Passing)
Freeman Elementary School
Warren County
State of Georgia
65.0%
70.0%
75.0%
80.0%
85.0%
90.0%
95.0%
100.0%
2007 2008 2009 2010 2011
CRCT: English Language Arts (Percent Passing)Freeman Elementary School
Warren County
State of Georgia
40.0%
45.0%
50.0%
55.0%
60.0%
65.0%
70.0%
75.0%
80.0%
85.0%
90.0%
95.0%
100.0%
2007 2008 2009 2010 2011
CRCT: Science (Percent Passing)
Freeman Elementary School
Warren County
State of Georgia
30.0%
40.0%
50.0%
60.0%
70.0%
80.0%
90.0%
100.0%
2007 2008 2009 2010 2011
CRCT: Social Studies (Percent Passing)
Freeman Elementary School
Warren County
State of Georgia
65.0%
70.0%
75.0%
80.0%
85.0%
90.0%
95.0%
100.0%
2007 2008 2009 2010 2011
Percent of Students Missing Less than 15 Days of School
Freeman Elementary School
Warren County
State of Georgia
Dr. John D. Barge, State School Superintendent
Page 211 of 242

Teachers
Administrators
Support Staff
Teacher Attrition Rate
Principal
School Board Chair
Asian Black Hispanic White Multi LEP SWD F/R Lunch
School 1% 94% 1% 5% 0% 0% 8% 100%
District 0% 92% 0% 7% 1% 0% 14% 100%
Does Not
Meet9.1% 14.5% Yes 27.8% Yes 55.5% 49.3% No
Meets 74.2% 71.2% Yes 60.6% Yes 35.0% 40.1% No
Meets +
Exceeds90.9% 85.5% Yes 72.2% Yes 44.5% 50.7% No
2011 Met Did Not Meet Yes 2011 13.7% 14.6% Yes
2010 Met Did Not Meet Yes 2010 5.1% 11.6% Yes
2009 Met Did Not Meet Yes 2009 8.9% 10.2% Yes
2008 Met Did Not Meet Yes 2008 8.5% 5.1% No
2007 Met Did Not Meet Yes 2007 8.2% 5.2% No
Charter Initially Approved Truett Abbott
DistrictSchool
0%
2011 CRCT
School
Student Demographics
Better
than
District
Better
than
District
21.9%
Year
Better
Than
District
78.1%
68.6%
0.56-8
176
6/12/2008
6/30/2013
Warren County 7.66
1143
14%
Mission Statement
Warren County Middle School is committed to providing an environment where learning is valued, excellence is sought, and students are prepared to
become contributing members of a global society.
Year
Key Facts Personnel
Instructional Days
Adequate Yearly Progress Percent Absent > 15 Days
School District
School
Native American
0%
Better
Than
District
Math Science
Warren County Middle School1253 Atlanta Hwy
Warrenton, GA 30828-9114
706.465.3742
School
ELA / Reading
Grades
Enrollment
Charter System
District
Better
than
District
District District
Current Charter End N/A
Academic Achievements
Dr. John D. Barge, State School Superintendent
Page 212 of 242

Block No Multi-age grouping No Career Academy No
Shortened Day No Student/teacher teams Yes International Baccalaureate Program No
Extended Day Yes Grades subdivided into houses No Pre-K No
Extended Week No Students remain with teacher 2+ years No After School Programs Yes
Extended Year No Single gender classes Yes Community Service No
•
•
•
Goal 1:
Goal 2:
Target:
Goal 3:
Target:
Goal 4:
Target:
Scheduling Instructional Type/Services Offered
Warren County Middle School
2010-11 Results:
Met/Did Not Meet:
Target:
2010-11 Results: The school analyzed and used data in all ways listed above and a lot more.
Met/Did Not Meet:
2010-11 Results:
Met/Did Not Meet:
Have Governing Council suggest and approve changes and be involved in selecting teachers. Meet 4 times in the year.
2010-11 Results: The Governing Council met five times and was very involved in every aspect of school management and improvement.
Met/Did Not Meet:
Effectively use data to improve instruction. Use data room and post CRCT results. Use the Balanced Scorecard to evaluate the
school's progress.
Teachers do domain data analysis and set goals/strategies for the year. Data is posted in Data Workroom, posted on the school
website, and summarized in the local newspaper.
8th grade Exceeds Standards to rise from 5 in Reading, 17 in ELA, and 7 in Math.
All three to be at or above 20% in 2011.
WCMS again made AYP for the 2010-11 year and will again be a Title I Distinguished School. WCMS is the only Georgia Higher Poverty Title
I middle school to have made AYP 10 years in a row.
Maximize the use of the Governing Council.
706.465.3742
Unique Accomplishments
Met Goal
Warrenton, GA 30828-9114
Met Goal
1253 Atlanta Hwy
Met Goal
R-10%; ELA-23%; and Math-10%.
Classroom Arrangements
What makes Warren County Middle School Unique?
Did not meet goal but made progress towards goal. We improved in all three Exceeds catagories and met the target in ELA.
In 2011 96% of eighth grade students passed the CRCT in ELA, 92% passed Reading, and 90% passed the Math CRCT after summer
retakes. We have purchased Acuity Science web based learning program for the 11-12 year to continue to improve our academic
achievement in Science.
The school has two parent dinners each year to review goals, plans, Title I activities, etc. We have a close relationship with Kiwanis.
WCMS will continue to make AYP.
Made AYP with whole school score on ELA/Reading at 92% passing and score on Math at 78.5% passing.
Academic Goals
Make AYP.
Dr. John D. Barge, State School Superintendent
Page 213 of 242

5 Year History of CRCT and Student Attendance
Warrenton, GA 30828-9114
706.465.3742
Warren County Middle School1253 Atlanta Hwy
60.0%
65.0%
70.0%
75.0%
80.0%
85.0%
90.0%
95.0%
100.0%
2007 2008 2009 2010 2011
CRCT: Mathematics (Percent Passing)
Warren County Middle School
Warren County
State of Georgia
65.0%
70.0%
75.0%
80.0%
85.0%
90.0%
95.0%
100.0%
2007 2008 2009 2010 2011
CRCT: Reading (Percent Passing)
Warren County Middle School
Warren County
State of Georgia
65.0%
70.0%
75.0%
80.0%
85.0%
90.0%
95.0%
100.0%
2007 2008 2009 2010 2011
CRCT: English Language Arts (Percent Passing)
Warren County Middle School
Warren County
State of Georgia
30.0%
40.0%
50.0%
60.0%
70.0%
80.0%
90.0%
100.0%
2007 2008 2009 2010 2011
CRCT: Science (Percent Passing)
Warren County Middle School
Warren County
State of Georgia
10.0%
20.0%
30.0%
40.0%
50.0%
60.0%
70.0%
80.0%
90.0%
100.0%
2007 2008 2009 2010 2011
CRCT: Social Studies (Percent Passing)
Warren County Middle School
Warren County
State of Georgia
65.0%
70.0%
75.0%
80.0%
85.0%
90.0%
95.0%
100.0%
2007 2008 2009 2010 2011
Percent of Students Missing Less than 15 Days of School
Warren County Middle School
Warren County
State of Georgia
Dr. John D. Barge, State School Superintendent
Page 214 of 242

Teachers
Administrators
Support Staff
Teacher Attrition Rate
Principal
School Board Chair
Asian Black Hispanic White Multi LEP SWD F/R Lunch
School 0% 96% 0% 3% 1% 0% 8% 100%
District 0% 92% 0% 7% 1% 0% 14% 100%
Does Not
Meet9.3% 9.3% Equal 11.6% Equal 2.3% 2.3% Equal
Meets 62.8% 62.8% Equal 60.5% Equal 74.4% 74.4% Equal
Meets +
Exceeds90.7% 90.7% Equal 88.4% Equal 97.7% 97.7% Equal
2011 Did Not Meet Did Not Meet Equal 2011 70.2% 70.2% Equal
2010 Did Not Meet Did Not Meet Equal 2010 75.5% 75.5% Equal
2009 Did Not Meet Did Not Meet Equal 2009 68.0% 68.0% Equal
2008 Did Not Meet Did Not Meet Equal 2008 70.1% 70.1% Equal
2007 Did Not Meet Did Not Meet Equal 2007 56.0% 56.0% Equal
Academic Achievements
11.6%
District
Better
than
District
District
Warren County High School1253 Atlanta Hwy
Warrenton, GA 30828-9114
706.465.3742
School
ELA
Grades
Enrollment
Charter System
School
Native American
0%
Better
Than
District
Math Science
District
Adequate Yearly Progress Graduation Rate
School District
Mission Statement
Warren County High School Always Values Education that produces well-rounded students by equipping them with the knowledge and skills that lead to
post-secondary success.
Year
Key Facts Personnel
Instructional Days
1.5K-5
176
6/12/2008
6/30/2013Current Charter End
Warren County 18.24
1.3196
0%
N/A
School
Student Demographics
Year
Better
Than
District
88.4%
Better
than
District
Better
than
District
60.5%
Charter Initially Approved Kaveous Preston
DistrictSchool
0%
2011 GHSGT
Dr. John D. Barge, State School Superintendent
Page 215 of 242

Block Yes Multi-age grouping Yes Career Academy Yes
Shortened Day No Student/teacher teams No International Baccalaureate Program No
Extended Day Yes Grades subdivided into houses No Pre-K No
Extended Week No Students remain with teacher 2+ years No After School Programs Yes
Extended Year No Single gender classes No Community Service Yes
•
•
•
Goal 1:
Goal 2:
Target:
Goal 3:
Target:
Goal 4:
Target:
An unbelievable 95% of our current juniors passed the science portion of the Ga. High School Graduation Test this year. Finally, 98% of our
students (93% of all eleventh graders) passed the Ga. High School Writing test on the first round this year.
Warren County High School will raise the graduation rate to AYP Status.
The graduation rate was 66.7%. Warren County High School did not make AYP due to not attaining this goal.
Academic Goals
Graduation Rate 90%
Met Goal
1253 Atlanta Hwy
Did not meet goal but made progress towards goal. Warren County High School made AYP in English by way of Safe Harbor.
This means that there was a 10% gain in student passing the English portion of the GHSGT from school year 2009-2010 to 2010-
2011.
76.7% of Warren County High School Students passed the Math portion of the GHSGT.
Classroom Arrangements
What makes Warren County High School Unique?
Met Goal
Warrenton, GA 30828-9114
Unique Accomplishments
Did not meet goal
The high school made Adequate Yearly Progress in the areas of math and reading/language arts this year—even before the summer retests.
Also, 83% of our students passed the English/language arts section and 80% passed the math section of the test.
Warren County High School will raise the Social Studies GHSGT scores.
Social Studies Rate 62%
Warren County High School will raise the Math GHSGT scores to AYP Status.
Math Rate 76%
For the 2010-2011 School year WCHS saw a significant increase in student achievement. For the 2010-2011 school year Social studies was
the biggest change with a 21% increase in the passing rate for the social studies portion of the GHSGT bringing our passing rate on the first
round to 73%.
Warren County High School will raise the English GHSGT scores to AYP Status.
2010-11 Results:73% of Warren County High School Students passed the Social Studies portion of the GHSGT in school year 2010-2011. In
school year 2009-2010 52% passed. This was a 21% increase.
Met/Did Not Meet:
2010-11 Results:
Met/Did Not Meet:
English Rate 90%
2010-11 Results: 83.7% of Warren County High School Students passed the English portion of the GHSGT.
Met/Did Not Meet:
2010-11 Results:
Met/Did Not Meet:
Target:
Scheduling Instructional Type/Services Offered
706.465.3742
Warren County High School
Dr. John D. Barge, State School Superintendent
Page 216 of 242

5 Year History of GHSGT and Graduation Rate
Warrenton, GA 30828-9114
706.465.3742
Warren County High School1253 Atlanta Hwy
65.0%
70.0%
75.0%
80.0%
85.0%
90.0%
95.0%
100.0%
2007 2008 2009 2010 2011
GHSGT: Mathematics (Percent Passing)
Warren County High School
Warren County
State of Georgia
65.0%
70.0%
75.0%
80.0%
85.0%
90.0%
95.0%
100.0%
2007 2008 2009 2010 2011
GHSGT: English Language Arts (Percent Passing)
Warren County High School
Warren County
State of Georgia
40.0%
45.0%
50.0%
55.0%
60.0%
65.0%
70.0%
75.0%
80.0%
85.0%
90.0%
95.0%
100.0%
2007 2008 2009 2010 2011
GHSGT: Science (Percent Passing)Warren County High School
Warren County
State of Georgia
65.0%
70.0%
75.0%
80.0%
85.0%
90.0%
95.0%
100.0%
2007 2008 2009 2010 2011
GHSGT: Social Studies (Percent Passing)
Warren County High School
Warren County
State of Georgia
55.00%
60.00%
65.00%
70.00%
75.00%
80.00%
85.00%
90.00%
95.00%
100.00%
2007 2008 2009 2010 2011
Graduation Rate
Warren County High School
Warren County
State of Georgia
Dr. John D. Barge, State School Superintendent
Page 217 of 242

Elementary
Charter Term Middle
High School
Total Schools
2007 2008 2009 2010 2011
Yes No Yes Yes No
2011 7.5% 8.8% Yes 2011 90.8% 80.9% Yes
2010 9.8% 9.7% No 2010 94.1% 80.8% Yes
2009 9.9% 8.7% No 2009 89.7% 78.9% Yes
2008 11.0% 9.5% No 2008 84.6% 75.4% Yes
2007 8.6% 10.0% Yes 2007 80.4% 72.3% Yes
3.6% 7.9% Yes 8.5% 8.3% No
56.1% 56.1% Yes 43.2% 37.0% Yes
96.4% 92.1% Yes 91.5% 91.7% No
8.3% 15.3% Yes 10.4% 15.5% Yes
50.1% 50.7% No 47.4% 37.5% Yes
91.7% 84.7% Yes 89.6% 84.5% Yes
Math Math
113 North Brooks St.
Cleveland, GA 30528
(706) 865-2315
Better
than State
State
Meets
State
Meets + Exceeds
State
Better
than State
Year System
Does Not Meet
Meets
Reading/ELA
2011 CRCT
System
Does Not Meet
System State
Percent Absent > 15 Days
Better
Than State
ELA
Meets + Exceeds
StateBetter
Than State
System
Better than
State
Better than
State
Does Not Meet
Meets
4
Graduation Rate
System
Year System
2011 GHSGT
8/1/2010
5
6/10/2010
6/30/2015
Opened
2
Meets + Exceeds
Academic Achievements
1
State
Charter Approved
7Charter End
White County Schools
Adequate Yearly Progress
Meets + Exceeds
Meets
Number of SchoolsKey Facts
Does Not Meet
Dr. John D. Barge, State School Superintendent
Page 218 of 242

Asian Black Hispanic White Multi LEP SWD F/ R Lunch
System 0.8% 1.5% 3.4% 90.9% 3.3% 1.3% 14.8% 54.5%
State 3.0% 37.0% 12.0% 44.0% 3.0% 6.0% 10.0% 57.0%
1)
2)
3)
4)
5)
6)
7)
8)
2007 2008 2009 2010 2011
Yes Yes Yes Yes Yes
Yes Yes Yes Yes Yes
Yes Yes Yes Yes Yes
N/A N/A N/A N/A N/A
Yes Yes Yes Yes Yes
Yes Yes Yes Yes Yes
Yes Yes Yes Yes Yes
Mossy CreeK Elemetary School
Jack P Nix Primary
Demonstrate improvement by concentrating on differentiated instruction, mastery of learning, and standards based classrooms.
Continue to investigate formal methods of gathering data in all areas with the feedback leading to the further investigation of all practices.
Prepare students for an active role in their community/society.
Utilize assessment data to drive instructional practices and professional learning.
Establish several forums for dialogue and planning for all aspects of the scholl system programs, facilities, sevices, and curriculum.
White County Middle School
White County Schools113 North Brooks St.
Cleveland, GA 30528
White County High School
7068652315
Create a system that meets the educational needs of the individual child.
Develop initiatives for the charter focus on specific instructional and curriculum changes to positively affect student growth and achievement.
Native American
White Co. Intermediate
Mount Yonah Elementary School
Involve all stakeholders, (students, parents, community members, and teachers), which continues to be a focus for growth and the basis for future
initiatives.
0.1%
0.0%
Student Demographics
White County 9th Grade Academy
Charter System Schools Adequate Yearly Progress
Charter System Schools
Charter System Strategic Goals:
Dr. John D. Barge, State School Superintendent
Page 219 of 242

White County Schools113 North Brooks St.
Cleveland, GA 30528
7068652315
5 Year History CRCT
65.0%
70.0%
75.0%
80.0%
85.0%
90.0%
95.0%
100.0%
2007 2008 2009 2010 2011
CRCT: Math(Percent Passing)
White County Schools
State of Georgia
65.0%
70.0%
75.0%
80.0%
85.0%
90.0%
95.0%
100.0%
2007 2008 2009 2010 2011
CRCT: Reading/ELA(Percent Passing)
White County Schools
State of Georgia
65.0%
70.0%
75.0%
80.0%
85.0%
90.0%
95.0%
100.0%
2007 2008 2009 2010 2011
CRCT: Social Studies(Percent Passing)
White County Schools
State of Georgia
65.0%
70.0%
75.0%
80.0%
85.0%
90.0%
95.0%
100.0%
2007 2008 2009 2010 2011
CRCT: Science(Percent Passing)
White County Schools
State of Georgia
Dr. John D. Barge, State School Superintendent
Page 220 of 242

113 North Brooks St.
Cleveland, GA 30528
7068652315
5 Year History GHSGT and Graduation Rate
White County Schools
65.0%
70.0%
75.0%
80.0%
85.0%
90.0%
95.0%
100.0%
2007 2008 2009 2010 2011
GHSGT: English Language Arts(Percent Passing)
White County Schools
State of Georgia
65.0%
70.0%
75.0%
80.0%
85.0%
90.0%
95.0%
100.0%
2007 2008 2009 2010 2011
GHSGT: Math(Percent Passing)
White County Schools
State of Georgia
65.0%
70.0%
75.0%
80.0%
85.0%
90.0%
95.0%
100.0%
2007 2008 2009 2010 2011
GHSGT: Science(Percent Passing)
White County Schools
State of Georgia
65.0%
70.0%
75.0%
80.0%
85.0%
90.0%
95.0%
100.0%
2007 2008 2009 2010 2011
GHSGT: Social Studies(Percent Passing)
White County Schools
State of Georgia
65.0%
70.0%
75.0%
80.0%
85.0%
90.0%
95.0%
100.0%
2007 2008 2009 2010 2011
High School Graduation Rate
White County Schools
State of Georgia
Dr. John D. Barge, State School Superintendent
Page 221 of 242

Teachers
Administrators
Support Staff
Teacher Attrition Rate
Principal
School Board Chair
Asian Black Hispanic White Multi LEP SWD F/R Lunch
School 1% 2% 2% 91% 5% 0% 14% 46%
District 1% 1% 3% 91% 3% 1% 15% 55%
Does Not
Meet6.0% 6.0% Equal 12.0% Equal 6.0% 6.0% Equal
Meets 52.0% 52.0% Equal 51.0% Equal 22.0% 22.0% Equal
Meets +
Exceeds42.0% 42.0% Equal 37.0% Equal 73.0% 73.0% Equal
2011 Met Did Not Meet Yes 2011 3.4% 7.5% Yes
2010 Met Met Equal 2010 4.5% 9.8% Yes
2009 Met Met Equal 2009 4.0% 9.9% Yes
2008 Met Did Not Meet Yes 2008 8.7% 11.0% Yes
2007 Met Met Equal 2007 7.6% 8.6% Yes
District
Better
than
District
District
White County 9th Grade Academy328 Old Blairsville Rd
Cleveland, GA 30528-1134
706.865.0727
School
9th Grade Lit
Grades
Enrollment
Charter System
0%
Better
Than
District
Math I Physical Science
Adequate Yearly Progress Percent Absent > 15 Days
School District
Mission Statement
To “increase student achievement through academic and organizational innovation” by encouraging stakeholder participation in public education, creating additional opportunities for
effective school system management, adding flexibility to utilize innovative methods to ensure the success of all children, and increasing the opportunity for a broader curriculum.
Year
Key Facts Personnel
Instructional Days
2K-5
176
6/10/2010
6/30/2015
Charter Initially Approved
Current Charter End
District
White County 19.4
1.75252
8%
Kelly Williams
Stephen Gill
School
Native American
Year
Better
Than
District
37.0%
51.0%
DistrictSchool
0%
2011 EOCT
School
Student Demographics
Better
than
District
Better
than
District
Academic Achievements
12.0%
Dr. John D. Barge, State School Superintendent
Page 222 of 242

Block No Multi-age grouping No Career Academy No
Shortened Day No Student/teacher teams No International Baccalaureate Program No
Extended Day No Grades subdivided into houses Yes Pre-K No
Extended Week No Students remain with teacher 2+ years No After School Programs No
Extended Year No Single gender classes No Community Service No
•
•
•
Goal 1:
Goal 2:
Target:
Goal 3:
Target:
Goal 4:
Target:
Target 1.1 and 1.2 - A 7 Year Plan for career awareness and exploration was developed and was aligned with the Bridge Bill, CTAE career units, and the
Ga411 website activities. Additional Targets: *The number of students eligible to receive a high school pathway industry credential was increased from a
2009-2010 baseline of 0 to a 2010-2011 total of 63. *The number of seniors who completed the work ready assessment to receive a work ready certificate
was increased from a 2009-2010 baseline of 60 to a 2010-2011 total of 76. *The number of Peach State Pathways available was increased from a 2009-
2010 baseline of 3 to a 2010-2011 total of 6.
White County 9th Grade Academy
Met Goal
328 Old Blairsville Rd
Met Goal
WCHS Goal: Increase student achievement in English/language arts Target: 94.4% Meet 2010-2011 Results: 87% meet Goal: Increase student
achievement in mathematics Target: 81.2% Meet 2010-2011 Results: 80% Meet As of the 2011-2012 school year, Target 2.2 will be adjusted to read as
follows: Target 2.2 – 100% of all high school students will meet or exceed academic standards on the GHSGT or EOCT – English/Language Arts and
Mathematics. This change in the target is due to the change in the state graduation policy - IHF(6) and the change in the testing policy where students may
now count their EOCT test scores and be exempt from sections of the GHSGT. White County School System has rewritten the local graduation policy to
reflect this change and the White County Board of Education has approved the policy.
Classroom Arrangements
What makes White County 9th Grade Academy Unique?
Did not meet goal
Establish a system governance framework.
706.865.0727Cleveland, GA 30528-1134
Met Goal
Academic Goals
Target 1.1- Establish timeline for development and implementation. Target 1.2 – Implement K-12 integrated career curriculum. Additional Targets- *Target
for increasing the number of students eligible to receive a high school pathway industry credential from a 2009-2010 baseline of 0 to a 2010-2011 total of
10. *Target for increasing the number of seniors who complete the work ready assessment to receive a work ready certificate from a 2009-2010 baseline
of 60 to a 2010-2011 total of 70. *Target for increasing the number of Peach State Pathways available from a 2009-2010 baseline of 3 to a 2010-2011 total
of 6.
Provided opportunity for every student to travel to our Washington D.C.to gain firsthand experience in how our government operates.
Partner with local Rotary Club in Laws of Life Essay Contest; Partnered with largest local restaurant in providing recognition for students and other student’s clubs and
activities
Increase student awareness of career opportunities.
Increase opportunities for enrollment in virtual learning.
Target 4.1 - Establish advisement procedures. Target 4.2 – Identify facilitators. Target 4.3 – Provide training on virtual learning. Target 4.4 – Increase the
opportunities for virtual learning. Additional Targets: *In FY 11, WCSS virtual enrollment will increase by 100% (8 enrollments). The base line in 2009 was
4 which was set to increase to 8 in 2010-2011.
All students will meet high academic standards by 2013-2014.
Target 2.1 – 100% of all Grade 1-8 students will meet or exceed academic standards on the CRCT - Reading and Math. Target 2.2- 100% of all high
school students will meet or exceed academic standards on the GHSGT-English/Language Arts and Math. Target 2.3 – Increase the percentage of
students who exceed academic standards on the CRCT – Reading and Mathematics.
Highest EOCT scores in Pioneer RESA for 9th grade English, Math 1, and Physical Science.
Unique Accomplishments
2010-11 Results:Advisement procedures and facilitators were established. Professional learning was provided on Georgia Virtual School and teachers are now interested
in the on-line teaching endorsement. A teacher at the Ninth Grade Academy also created and delivered an online course in civics. The opportunity for
virtual learning was increased from the FY 10 enrollment of 4 to an enrollment of 14 in FY11.
Met/Did Not Meet:
2010-11 Results:
Met/Did Not Meet:
Target 3.1- Establish governance at the school and system levels with mandatory initial training. Target 3.2- Offer a minimum of 3 professional learning
training sessions yearly to 100% of the governing council members to sustain an effective governance framework and to provide members with knowledge
should they decide to seek office at the local Board of Education level.
2010-11 Results:
Target 3.1 – Bylaws for the governance framework were written and approved. Members were elected or appointed to the multiple governing bodies
according to the charter application and in accordance with the White County School System Charter Bylaws. 100% of the Governing Council Members
received initial Training. Target 3.2- In addition to the four initial training sessions offered, there were three additional professional learning opportunities
during the year – System SPLOST, Millage, and Financial Information, Personnel Operations, and School Level Finance and Budget.
Met/Did Not Meet:
2010-11 Results:
Met/Did Not Meet:
Target:
Scheduling Instructional Type/Services Offered
Dr. John D. Barge, State School Superintendent
Page 223 of 242

328 Old Blairsville Rd White County 9th Grade Academy
5 Year History of EOCT and Student Attendance
Cleveland, GA 30528-1134
706.865.0727
60.0%
65.0%
70.0%
75.0%
80.0%
85.0%
90.0%
95.0%
100.0%
2007 2008 2009 2010 2011
EOCT: Mathematics I (Percent Passing) White County 9th Grade Academy
White County
State of Georgia
65.0%
70.0%
75.0%
80.0%
85.0%
90.0%
95.0%
100.0%
2007 2008 2009 2010 2011
EOCT: 9th Grade Literature(Percent Passing)
White County 9th Grade Academy
White County
State of Georgia
55.0%
60.0%
65.0%
70.0%
75.0%
80.0%
85.0%
90.0%
95.0%
100.0%
2007 2008 2009 2010 2011
EOCT: Physical Science (Percent Passing)
White County 9th Grade Academy
White County
State of Georgia
65.0%
70.0%
75.0%
80.0%
85.0%
90.0%
95.0%
100.0%
2007 2008 2009 2010 2011
Student Attendance: Students Missing Less Than 15 Days
White County 9th Grade Academy
White County
State of Georgia
Dr. John D. Barge, State School Superintendent
Page 224 of 242

Teachers
Administrators
Support Staff
Teacher Attrition Rate
Principal
School Board Chair
Asian Black Hispanic White Multi LEP SWD F/R Lunch
School 0% 2% 5% 91% 2% 3% 20% 56%
District 1% 1% 3% 91% 3% 1% 15% 55%
Does Not
MeetN/A 3.6% N/A 8.3% N/A N/A 12.1% N/A
Meets N/A 56.1% N/A 50.1% N/A N/A 48.1% N/A
Meets +
ExceedsN/A 96.4% N/A 91.7% N/A N/A 87.9% N/A
2011 Met Did Not Meet Yes 2011 6.4% 7.5% Yes
2010 Met Met Equal 2010 10.7% 9.8% No
2009 Met Met Equal 2009 7.2% 9.9% Yes
2008 Met Did Not Meet Yes 2008 6.5% 11.0% Yes
2007 Met Met Equal 2007 7.3% 8.6% Yes
Charter Initially Approved Jennifer W. King
DistrictSchool
0%
2011 CRCT
School
Student Demographics
Better
than
District
Better
than
District
Connie Webster
Academic Achievements
N/A
Year
Better
Than
District
N/A
N/A
District
46-8
176
6/10/2010
6/30/2015
White County 33.19
2454
15%
Mission Statement
To “increase student achievement through academic and organizational innovation” by encouraging stakeholder participation in public education, creating additional opportunities for
effective school system management, adding flexibility to utilize innovative methods to ensure the success of all children, and increasing the opportunity for a broader curriculum.
Year
Key Facts Personnel
Instructional Days
Science
Adequate Yearly Progress Percent Absent > 15 Days
School District
Charter System
School
Native American
0%
Better
Than
District
Math
Jack P Nix Primary342 W Kytle St
Cleveland, GA 30528-1334
706.865.6935
School
ELA / Reading
Grades
Enrollment
District
Better
than
District
District
Current Charter End
Dr. John D. Barge, State School Superintendent
Page 225 of 242

Block No Multi-age grouping No Career Academy No
Shortened Day No Student/teacher teams No International Baccalaureate Program No
Extended Day No Grades subdivided into houses No Pre-K No
Extended Week No Students remain with teacher 2+ years No After School Programs Yes
Extended Year No Single gender classes No Community Service No
•
•
•
Goal 1:
Goal 2:
Target:
Goal 3:
Target:
Goal 4:
Target:
Scheduling Instructional Type/Services Offered
2010-11 Results:
Met/Did Not Meet:
Target:
2010-11 Results: During the 2010-2011 school year, Jack P. Nix Primary piloted the SALSA program. Planning is in progress as indicated in the charter contract timeline.
Met/Did Not Meet:
2010-11 Results:
Met/Did Not Meet:
Target 3.1- Establish governance at the school and system levels with mandatory initial training. Target 3.2- Offer a minimum of 3 professional learning
training sessions yearly to 100% of the governing council members to sustain an effective governance framework and to provide members with knowledge
should they decide to seek office at the local Board of Education level.
2010-11 Results:
Target 3.1 – Bylaws for the governance framework were written and approved. Members were elected or appointed to the multiple governing bodies
according to the charter application and in accordance with the White County School System Charter Bylaws. 100% of the Governing Council Members
received initial Training. Target 3.2- In addition to the four initial training sessions offered, there were three additional professional learning opportunities
during the year – System SPLOST, Millage, and Financial Information, Personnel Operations, and School Level Finance and Budget.
Met/Did Not Meet:
Academic Goals
Target 1.1- Establish timeline for development and implementation. Target 1.2 – Implement K-12 integrated career curriculum.
Increase the availability of foreign language prior to high school.
Target 5.1- Develop the scope and sequence for implementing a foreign language program K-12. Target 5.2 – Increase the availability of foreign language
for cultural exposure prior to high school. Target 5.4 – Integrate foreign language into the elementary grade levels.
Establish a system governance framework.
706.865.6935
Unique Accomplishments
Did not meet goal but made progress towards goal. Did Not Meet: Timeline for development and implementation is in progress for Grades K-2 which was
non-existent in 2009-2010.
Did not meet goal
Cleveland, GA 30528-1334
The GaDOE was unable to provide CRCT testing for Grades 1 and 2. JPN Goal: Increase student achievement in 1st grade reading Target: 99% Meet,
54% Exceed 2010-2011 Results: Not Tested Goal: Increase student achievement in 2nd grade reading Target: 98% Meet, 56% Exceed 2010-2011
Results:Not Tested Goal: Increase student achievement in 1st grade math Target: 97% Meet, 40% Exceed 2010-2011 Results: Not Tested Goal:
Increase student achievement in 2nd grade math Target: 97% Meet, 36% Exceed 2010-2011 Results:Not Tested No CRCT Test in Grades 1 and 2.
Classroom Arrangements
What makes Jack P Nix Primary Unique?
All students will meet high academic standards by 2013-2014.
Target 2.1 – 100% of all Grade 1-8 students will meet or exceed academic standards on the CRCT - Reading and Math. Target 2.3 – Increase the
percentage of students who exceed academic standards on the CRCT – Reading and Mathematics.
Students in 1st and 2nd grade performed well on the Instructional Assessment administered in the spring of 2011. More than 90% of students met or exceeded standards
in the areas of reading (94%), ELA (90%) and mathematics (94%).
The number of students missing 15 or more days decreased last year. This improvement in attendance could have been a result of participation in the Fuel Up to Play 60
program sponsored by the Southeastern Dairy Association and the Atlanta Falcons. The grant provided funds to furnish our Dino Diner for nutrition lessons and healthy
snack samples. The Fuel Up to Play 60 program also provided incentives to students for increasing their physical activity.
JPN provided exposure to a foreign language, Spanish, by providing a short lesson to a large portion of the student population 2 days each week.
Increase student awareness of career opportunities.
Target 1.1 – In Progress Target 1.2 – Not yet implemented in Grades K-2
Jack P Nix Primary
Met Goal
342 W Kytle St
Met Goal
Dr. John D. Barge, State School Superintendent
Page 226 of 242

5 Year History of CRCT and Student Attendance
Cleveland, GA 30528-1334
706.865.6935
Jack P Nix Primary342 W Kytle St
65.0%
70.0%
75.0%
80.0%
85.0%
90.0%
95.0%
100.0%
2007 2008 2009 2010 2011
CRCT: Mathematics (Percent Passing)
Jack P Nix Primary
White County
State of Georgia
65.0%
70.0%
75.0%
80.0%
85.0%
90.0%
95.0%
100.0%
2007 2008 2009 2010 2011
CRCT: Reading (Percent Passing)
Jack P Nix Primary
White County
State of Georgia
65.0%
70.0%
75.0%
80.0%
85.0%
90.0%
95.0%
100.0%
2007 2008 2009 2010 2011
CRCT: English Language Arts (Percent Passing)
Jack P Nix Primary
White County
State of Georgia
65.0%
70.0%
75.0%
80.0%
85.0%
90.0%
95.0%
100.0%
2007 2008 2009 2010 2011
CRCT: Science (Percent Passing)
Jack P Nix Primary
White County
State of Georgia
65.0%
70.0%
75.0%
80.0%
85.0%
90.0%
95.0%
100.0%
2007 2008 2009 2010 2011
CRCT: Social Studies (Percent Passing)
Jack P Nix Primary
White County
State of Georgia
65.0%
70.0%
75.0%
80.0%
85.0%
90.0%
95.0%
100.0%
2007 2008 2009 2010 2011
Percent of Students Missing Less than 15 Days of School
Jack P Nix Primary
White County
State of Georgia
Dr. John D. Barge, State School Superintendent
Page 227 of 242

Teachers
Administrators
Support Staff
Teacher Attrition Rate
Principal
School Board Chair
Asian Black Hispanic White Multi LEP SWD F/R Lunch
School 0% 1% 3% 92% 4% 2% 16% 62%
District 1% 1% 3% 91% 3% 1% 15% 55%
Does Not
Meet7.3% 3.6% No 8.3% No 17.7% 12.1% No
Meets 59.7% 56.1% Yes 50.1% Yes 51.8% 48.1% Yes
Meets +
Exceeds92.7% 96.4% No 91.7% No 82.3% 87.9% No
2011 Did Not Meet Did Not Meet Equal 2011 5.5% 7.5% Yes
2010 Met Met Equal 2010 8.3% 9.8% Yes
2009 Met Met Equal 2009 9.5% 9.9% Yes
2008 N/A Did Not Meet N/A 2008 N/A 11.0% N/A
2007 N/A Met N/A 2007 N/A 8.6% N/A
DistrictSchool
0%
2011 CRCT
School
Student Demographics
Better
than
District
Better
than
District
Academic Achievements
18.5%
Year
Better
Than
District
81.5%
53.1%
District
White County 39.98
3529
10%
Valerie Williams
Roger Fitzpatrick
Instructional Days
7K-5
176
6/10/2010
6/30/2015
Charter Initially Approved
Mission Statement
To “increase student achievement through academic and organizational innovation” by encouraging stakeholder participation in public education, creating additional opportunities for
effective school system management, adding flexibility to utilize innovative methods to ensure the success of all children, and increasing the opportunity for a broader curriculum.
Year
Key Facts Personnel
Adequate Yearly Progress Percent Absent > 15 Days
School District
School
Native American
0%
Better
Than
District
Math Science
Mossy Creek Elementary School128 Horace Fitzpatrick Dr
Cleveland, GA 30528-5833
706.865.5000
School
ELA / Reading
Grades
Enrollment
Charter System
District
Better
than
District
District
Current Charter End
Dr. John D. Barge, State School Superintendent
Page 228 of 242

Block No Multi-age grouping No Career Academy No
Shortened Day No Student/teacher teams Yes International Baccalaureate Program No
Extended Day No Grades subdivided into houses No Pre-K No
Extended Week No Students remain with teacher 2+ years No After School Programs Yes
Extended Year No Single gender classes No Community Service No
•
•
•
Goal 1:
Goal 2:
Target:
Goal 3:
Target:
Goal 4:
Target:
Scheduling Instructional Type/Services Offered
Met/Did Not Meet:
2010-11 Results:
Met/Did Not Meet:
Target:
2010-11 Results:In FY 11, WCSS planned and reviewed the budget as specified in the contract timeline. A Spanish teacher was hired at the high school with plans to
move this staff member to serve other grades levels in the following years.
Met/Did Not Meet:
2010-11 Results:
Met/Did Not Meet:
Target 3.1- Establish governance at the school and system levels with mandatory initial training. Target 3.2- Offer a minimum of 3 professional learning
training sessions yearly to 100% of the governing council members to sustain an effective governance framework and to provide members with knowledge
should they decide to seek office at the local Board of Education level.
2010-11 Results:
Target 3.1 – Bylaws for the governance framework were written and approved. Members were elected or appointed to the multiple governing bodies
according to the charter application and in accordance with the White County School System Charter Bylaws. 100% of the Governing Council Members
received initial Training. Target 3.2- In addition to the four initial training sessions offered, there were three additional professional learning opportunities
during the year – System SPLOST, Millage, and Financial Information, Personnel Operations, and School Level Finance and Budget.
Increase the availability of foreign language prior to high school.
Target 5.1- Develop the scope and sequence for implementing a foreign language program K-12. Target 5.2 – Increase the availability of foreign language
for cultural exposure prior to high school. Target 5.4 – Integrate foreign language into the elementary grade levels. Additional Targets: In FY 11, WCSS will
be planning and budgeting for offering foreign language.
All students will meet high academic standards by 2013-2014.
Target 2.1 – 100% of all Grade 1-8 students will meet or exceed academic standards on the CRCT - Reading and Math. Target 2.3 – Increase the
percentage of students who exceed academic standards on the CRCT – Reading and Mathematics.
N/A
Unique Accomplishments
Did not meet goal but made progress towards goal. Did Not Meet: Met Target 1.1 for Grades 6-12 and K-5 is in progress.
Academic Goals
Target 1.1- Establish timeline for development and implementation. Target 1.2 – Implement K-12 integrated career curriculum.
Cleveland, GA 30528-5833
Met Goal
C) 2010-11 Results: MCES Goal: Increase student achievement in 1st grade reading Target: 95% Meet, 53% Exceed 2010-2011 Results: Not Tested
Goal: Increase student achievement in 2nd grade reading Target: 95% Meet, 43% Exceed 2010-2011 Results: Not Tested Goal: Increase student
achievement in 3rd grade reading Target: 92% Meet, 31% Exceed 2010-2011 Results: 93% Meet, 32% Exceed Goal: Increase student achievement in
4th grade reading Target: 96% Meet, 36% Exceed 2010-2011 Results: 92% Meet, 30% Exceed Goal: Increase student achievement in 5th grade reading
Target: 99% Meet, 26% Exceed 2010-2011 Results: 91% Meet, 33% Exceed Goal: Increase student achievement in 6th grade reading Target: 99%
Meet, 50% Exceed 2010-2011 Results: 95% Meet, 40% Exceed Goal: Increase student achievement in 1st grade math Target: 93% Meet, 46% Exceed
2010-2011 Results: Not Tested Goal: Increase student achievement in 2nd grade math Target: 95% Meet, 35% Exceed 2010-2011 Results: Not Tested
Goal: Increase student achievement in 3rd grade math Target: 84% Meet, 30% Exceed 2010-2011 Results: 78% Meet, 41% Exceed Goal: Increase
student achievement in 4th grade math Target: 88% Meet, 19% Exceed 2010-2011 Results: 83% Meet, 36% Exceed Goal: Increase student
achievement In 5th grade math Target: 82% Meet, 26% Exceed 2010-2011 Results: 85% Meet, 30% Exceed Goal: Increase student achievement in 6th
grade math Target: 92% Meet, 16% Exceed 2010-2011 Results: 74% Meet, 7% Exceed No CRCT Test in Grades 1 and 2.
Classroom Arrangements
What makes Mossy Creek Elementary School Unique?
Did not meet goal but made progress towards goal. Did Not Meet: Reading: Grade 5 EXCEEDING increased from 17% in FY10 to 33% in FY11, Math:
Grade 3 MEETING increased from from 77% in FY10 to 83% in FY 11 and EXCEEDING increased from 27% to 40%, Grade 4 MEETING increased from
77% in FY10 to 78% in FY 11 and EXCEEDING increased from 34% to 36%, Grade 5 MEETING increased from 74% in FY10 to 85% in FY 11 and
EXCEEDING increased from 16% to 30%.
Establish a system governance framework.
706.865.5000
N/A
N/A
Increase student awareness of career opportunities.
Target 1.1 – In progress for Grade K-5. A 7 Year Plan for career awareness and exploration was developed and was aligned with the Bridge Bill, CTAE
career units, and the Ga411 website activities.
Mossy Creek Elementary School
Met Goal
128 Horace Fitzpatrick Dr
Dr. John D. Barge, State School Superintendent
Page 229 of 242

5 Year History of CRCT and Student Attendance
Cleveland, GA 30528-5833
706.865.5000
128 Horace Fitzpatrick DrMossy Creek Elementary School
65.0%
70.0%
75.0%
80.0%
85.0%
90.0%
95.0%
100.0%
2007 2008 2009 2010 2011
CRCT: Mathematics (Percent Passing)
Mossy Creek Elementary School
White County
State of Georgia
65.0%
70.0%
75.0%
80.0%
85.0%
90.0%
95.0%
100.0%
2007 2008 2009 2010 2011
CRCT: Reading (Percent Passing)
Mossy Creek Elementary School
White County
State of Georgia
65.0%
70.0%
75.0%
80.0%
85.0%
90.0%
95.0%
100.0%
2007 2008 2009 2010 2011
CRCT: English Language Arts (Percent Passing)Mossy Creek Elementary School
White County
State of Georgia
65.0%
70.0%
75.0%
80.0%
85.0%
90.0%
95.0%
100.0%
2007 2008 2009 2010 2011
CRCT: Science (Percent Passing)
Mossy Creek Elementary School
White County
State of Georgia
65.0%
70.0%
75.0%
80.0%
85.0%
90.0%
95.0%
100.0%
2007 2008 2009 2010 2011
CRCT: Social Studies (Percent Passing)Mossy Creek Elementary School
White County
State of Georgia
65.0%
70.0%
75.0%
80.0%
85.0%
90.0%
95.0%
100.0%
2007 2008 2009 2010 2011
Percent of Students Missing Less than 15 Days of SchoolMossy Creek Elementary School
White County
State of Georgia
Dr. John D. Barge, State School Superintendent
Page 230 of 242

Teachers
Administrators
Support Staff
Teacher Attrition Rate
Principal
School Board Chair
Asian Black Hispanic White Multi LEP SWD F/R Lunch
School 2% 1% 3% 92% 1% 2% 11% 49%
District 1% 1% 3% 91% 3% 1% 15% 55%
Does Not
Meet2.5% 3.6% Yes 8.3% Yes 8.6% 12.1% Yes
Meets 50.2% 56.1% No 50.1% No 45.7% 48.1% No
Meets +
Exceeds97.5% 96.4% Yes 91.7% Yes 91.4% 87.9% Yes
2011 Met Did Not Meet Yes 2011 4.5% 7.5% Yes
2010 Met Met Equal 2010 8.3% 9.8% Yes
2009 Met Met Equal 2009 7.3% 9.9% Yes
2008 Met Did Not Meet Yes 2008 5.9% 11.0% Yes
2007 Met Met Equal 2007 7.2% 8.6% Yes
DistrictSchool
0%
2011 CRCT
School
Student Demographics
Better
than
District
Better
than
District
Academic Achievements
4.9%
Year
Better
Than
District
95.1%
45.1%
District
White County 38
3551
5%
Patrick Ballington
Dana Magill
Instructional Days
5K-5
176
6/10/2010
6/30/2015
Charter Initially Approved
Mission Statement
To “increase student achievement through academic and organizational innovation” by encouraging stakeholder participation in public education, creating additional opportunities for
effective school system management, adding flexibility to utilize innovative methods to ensure the success of all children, and increasing the opportunity for a broader curriculum.
Year
Key Facts Personnel
Adequate Yearly Progress Percent Absent > 15 Days
School District
School
Native American
0%
Better
Than
District
Math Science
Mount Yonah Elementary School1161 Duncan Bridge Rd
Sautee Nacoochee, GA 30571-3608
706.865.3514
School
ELA / Reading
Grades
Enrollment
Charter System
District
Better
than
District
District
Current Charter End
Dr. John D. Barge, State School Superintendent
Page 231 of 242

Block No Multi-age grouping No Career Academy No
Shortened Day No Student/teacher teams No International Baccalaureate Program No
Extended Day No Grades subdivided into houses No Pre-K No
Extended Week No Students remain with teacher 2+ years Yes After School Programs No
Extended Year No Single gender classes No Community Service No
•
•
•
Goal 1:
Goal 2:
Target:
Goal 3:
Target:
Goal 4:
Target:
Scheduling Instructional Type/Services Offered
Met/Did Not Meet:
2010-11 Results:
Met/Did Not Meet:
Target:
2010-11 Results:In FY 11, WCSS planned and reviewed the budget as specified in the contract timeline. A Spanish teacher was hired at the high school with plans to
move this staff member to serve other grades levels in the following years.
Met/Did Not Meet:
2010-11 Results:
Met/Did Not Meet:
Target 3.1- Establish governance at the school and system levels with mandatory initial training. Target 3.2- Offer a minimum of 3 professional learning
training sessions yearly to 100% of the governing council members to sustain an effective governance framework and to provide members with knowledge
should they decide to seek office at the local Board of Education level.
2010-11 Results:
Target 3.1 – Bylaws for the governance framework were written and approved. Members were elected or appointed to the multiple governing bodies
according to the charter application and in accordance with the White County School System Charter Bylaws. 100% of the Governing Council Members
received initial Training. Target 3.2- In addition to the four initial training sessions offered, there were three additional professional learning opportunities
during the year – System SPLOST, Millage, and Financial Information, Personnel Operations, and School Level Finance and Budget.
Increase the availability of foreign language prior to high school.
Target 5.1- Develop the scope and sequence for implementing a foreign language program K-12. Target 5.2 – Increase the availability of foreign language
for cultural exposure prior to high school. Target 5.4 – Integrate foreign language into the elementary grade levels. Additional Targets: In FY 11, WCSS will
be planning and budgeting for offering foreign language.
All students will meet high academic standards by 2013-2014.
Target 2.1 – 100% of all Grade 1-8 students will meet or exceed academic standards on the CRCT - Reading and Math. Target 2.3 – Increase the
percentage of students who exceed academic standards on the CRCT – Reading and Mathematics.
Successfully shipped 7,000 teacher and student books to sister school Madioli School in Kenya to set upa library and provide for student and teacher materials/
YMCA/MYES Swim Program for 3rd grade students.
Unique Accomplishments
Did not meet goal but made progress towards goal. Did Not Meet: Met Target 1.1 for Grades 6-12 and K-5 is in progress.
Academic Goals
Target 1.2 – Implement K-12 integrated career curriculum.
Sautee Nacoochee, GA 30571-3608
Met Goal
MYES Goal: Increase student achievement in 1st grade reading Target: 98% Meet, 45% Exceed 2010-2011 Results: Not Tested Goal: Increase student
achievement in 2nd grade reading Target: 100% Meet, 52% Exceed 2010-2011 Results: Not Tested Goal: Increase student achievement in 3rd grade
reading Target: 95% Meet, 41% Exceed 2010-2011 Results: 97% Meet, 46% Exceed Goal: Increase student achievement in 4th grade reading Target:
97% Meet, 51% Exceed 2010-2011 Results: 93% Meet, 43%Exceed Goal: Increase student achievement in 5th grade reading Target: 94% Meet, 25%
Exceed 2010-2011 Results: 93% Meet, 41% Exceed Goal: Increase student achievement in 6th grade reading Target: 95% Meet, 44% Exceed 2010-
2011 Results: 100% Meet, 48% Exceed Goal: Increase student achievement in 1st grade math Target: 97% Meeet, 43% Exceed 2010-2011 Results: Not
Tested Goal: Increase student achievement in 2nd grade math Target: 100% Meet, 36% Exceed 2010-2011 Results: Not Tested Goal: Increase student
achievement in 3rd grade math Target: 95% Meet, 55% Exceed 2010-2011 Results: 96% Meet, 60% Exceed Goal: Increase student achievement in 4th
grade math Target: 92% Meet, 47% Exceed 2010-2011 Results: 89% Meet, 57% Exceed Goal: Increase student achievement In 5th grade math Target:
84% Meet, 33% Exceed 2010-2011 Results: 94% Meet, 46% Exceed Goal: Increase student achievement in 6th grade math Target: 92% Meet, 25%
Exceed 2010-2011 Results: 95% Meet, 39% Exceed No CRCT Test in Grades 1 and 2.
Classroom Arrangements
What makes Mount Yonah Elementary School Unique?
Did not meet goal but made progress towards goal. Did Not Meet: Reading: Grade 6 EXCEEDING increased from 40% in FY10 to 48% in FY11, Math:
Grade 3 MEETING increased from 91% in FY10 to 96% in FY 11, Grade 4 EXCEEDING increased from 50%in FY10 to 57% in FY11, Grade 5 MEETING
increased from 87% in FY10 to 94% in FY11, Grade 6 MEETING increased from 82% in FY10 to 95% in FY11 and EXCEEDING increased from 19% in
FY10 to 39% in FY11.
Establish a system governance framework.
706.865.3514
Nominated for National Blue Ribbon Award for leading the state in closing the achievement gap; 100% pass rate on CRCT in reading in 5th and 6th grade and a 99%
pass rate in math 5th grade; 98% pass rate in 5th grade writing test; Significantly increased percentage of special education students meeting CRCT standards.
Established a sub-committee on Movement in Learning.
Increase student awareness of career opportunities.
Target 1.1 – In progress for Grade K-5. A 7 Year Plan for career awareness and exploration was developed and was aligned with the Bridge Bill, CTAE
career units, and the Ga411 website activities.
Mount Yonah Elementary School
Met Goal
1161 Duncan Bridge Rd
Dr. John D. Barge, State School Superintendent
Page 232 of 242

5 Year History of CRCT and Student Attendance
Sautee Nacoochee, GA 30571-3608
706.865.3514
1161 Duncan Bridge Rd Mount Yonah Elementary School
65.0%
70.0%
75.0%
80.0%
85.0%
90.0%
95.0%
100.0%
2007 2008 2009 2010 2011
CRCT: Mathematics (Percent Passing)
Mount Yonah Elementary School
White County
State of Georgia
65.0%
70.0%
75.0%
80.0%
85.0%
90.0%
95.0%
100.0%
2007 2008 2009 2010 2011
CRCT: Reading (Percent Passing)
Mount Yonah Elementary School
White County
State of Georgia
65.0%
70.0%
75.0%
80.0%
85.0%
90.0%
95.0%
100.0%
2007 2008 2009 2010 2011
CRCT: English Language Arts (Percent Passing)
Mount Yonah Elementary School
White County
State of Georgia
65.0%
70.0%
75.0%
80.0%
85.0%
90.0%
95.0%
100.0%
2007 2008 2009 2010 2011
CRCT: Science (Percent Passing)
Mount Yonah Elementary School
White County
State of Georgia
65.0%
70.0%
75.0%
80.0%
85.0%
90.0%
95.0%
100.0%
2007 2008 2009 2010 2011
CRCT: Social Studies (Percent Passing)
Mount Yonah Elementary School
White County
State of Georgia
65.0%
70.0%
75.0%
80.0%
85.0%
90.0%
95.0%
100.0%
2007 2008 2009 2010 2011
Percent of Students Missing Less than 15 Days of School
Mount Yonah Elementary School
White County
State of Georgia
Dr. John D. Barge, State School Superintendent
Page 233 of 242

Teachers
Administrators
Support Staff
Teacher Attrition Rate
Principal
School Board Chair
Asian Black Hispanic White Multi LEP SWD F/R Lunch
School 1% 1% 4% 89% 4% 2% 17% 62%
District 1% 1% 3% 91% 3% 1% 15% 55%
Does Not
Meet3.4% 3.6% Yes 8.3% No 8.9% 12.1% Yes
Meets 54.4% 56.1% No 50.1% No 46.8% 48.1% No
Meets +
Exceeds96.6% 96.4% Yes 91.7% No 91.1% 87.9% Yes
2011 Met Did Not Meet Yes 2011 4.2% 7.5% Yes
2010 Met Met Equal 2010 7.3% 9.8% Yes
2009 Met Met Equal 2009 7.0% 9.9% Yes
2008 Met Did Not Meet Yes 2008 6.7% 11.0% Yes
2007 Met Met Equal 2007 4.6% 8.6% Yes
Charter Initially Approved Shann Cash
DistrictSchool
0%
2011 CRCT
School
Student Demographics
Better
than
District
Better
than
District
Bonnie Petras
Academic Achievements
10.7%
Year
Better
Than
District
89.3%
45.5%
District
46-8
176
6/10/2010
6/30/2015
White County 40
2.49576
5%
Mission Statement
To “increase student achievement through academic and organizational innovation” by encouraging stakeholder participation in public education, creating additional opportunities for
effective school system management, adding flexibility to utilize innovative methods to ensure the success of all children, and increasing the opportunity for a broader curriculum.
Year
Key Facts Personnel
Instructional Days
Adequate Yearly Progress Percent Absent > 15 Days
School District
School
Native American
0%
Better
Than
District
Math Science
White County Intermediate School2696 Tesnatee Gap Valley Rd
Cleveland, GA 30528-3888
706.865.1037
School
ELA / Reading
Grades
Enrollment
Charter System
District
Better
than
District
District
Current Charter End
Dr. John D. Barge, State School Superintendent
Page 234 of 242

Block No Multi-age grouping No Career Academy No
Shortened Day No Student/teacher teams No International Baccalaureate Program No
Extended Day No Grades subdivided into houses No Pre-K No
Extended Week No Students remain with teacher 2+ years No After School Programs Yes
Extended Year No Single gender classes No Community Service No
•
•
•
Goal 1:
Goal 2:
Target:
Goal 3:
Target:
Goal 4:
Target:
Scheduling Instructional Type/Services Offered
2010-11 Results:
Met/Did Not Meet:
Target:
2010-11 Results:In FY 11, WCSS planned and reviewed the budget as specified in the contract timeline. A Spanish teacher was hired at the high school with plans to
move this staff member to serve other grades levels in the following years.
Met/Did Not Meet:
2010-11 Results:
Met/Did Not Meet:
Target 3.1- Establish governance at the school and system levels with mandatory initial training. Target 3.2- Offer a minimum of 3 professional learning
training sessions yearly to 100% of the governing council members to sustain an effective governance framework and to provide members with knowledge
should they decide to seek office at the local Board of Education level.
2010-11 Results:
Target 3.1 – Bylaws for the governance framework were written and approved. Members were elected or appointed to the multiple governing bodies
according to the charter application and in accordance with the White County School System Charter Bylaws. 100% of the Governing Council Members
received initial Training. Target 3.2- In addition to the four initial training sessions offered, there were three additional professional learning opportunities
during the year – System SPLOST, Millage, and Financial Information, Personnel Operations, and School Level Finance and Budget.
Met/Did Not Meet:
Increase the availability of foreign language prior to high school.
Target 5.1- Develop the scope and sequence for implementing a foreign language program K-12. Target 5.2 – Increase the availability of foreign language
for cultural exposure prior to high school. Target 5.4 – Integrate foreign language into the elementary grade levels. Additional Targets: In FY 11, WCSS will
be planning and budgeting for offering foreign language.
All students will meet high academic standards by 2013-2014.
Target 2.1 – 100% of all Grade 1-8 students will meet or exceed academic standards on the CRCT - Reading and Math. Target 2.3 – Increase the
percentage of students who exceed academic standards on the CRCT – Reading and Mathematics.
Whole school: 44% of our students exceeds in reading, math, & science.
Unique Accomplishments
Did not meet goal but made progress towards goal. Met Target 1.1 for Grades 6-12 and K-5 is in progress.
Academic Goals
Target 1.1- Establish timeline for development and implementation. Target 1.2 – Implement K-12 integrated career curriculum.
Cleveland, GA 30528-38882696 Tesnatee Gap Valley Rd
Met Goal
Target 2.1 – 100% of all Grade 1-8 students will meet or exceed academic standards on the CRCT - Reading and Math. Target 2.3 – Increase the
percentage of students who exceed academic standards on the CRCT – Reading and Mathematics.
Classroom Arrangements
Did not meet goal but made progress towards goal. Grade 4 MEETING increased from 95% in FY10 to 97% in FY11 and EXCEEDING increased from
31% in FY10 to 45% in FY11, Grade 5 EXCEEDING increased from 42% in FY10 to 47% in FY11, Grade 6 MEETING increased from 95% in FY10 to
98% in FY11 and EXCEEDING increased from 38% in FY10 to 40% in FY11, Math: Grade 3 MEETING increased from 87% in FY10 to 91% in FY 11 and
EXCEEDING increased from 39% to 50%, Grade 4 MEETING increased from 84% in FY10 to 88% in FY 11 and EXCEEDING increased from 38% to
51%, Grade 5 EXCEEDING increased from 49% in FY10 to 50% in FY11, Grade 6 MEETING increased from from 83% in FY10 to 87% in FY 11 and
EXCEEDING increased from 18% to 26%
Establish a system governance framework.
706.865.1037
HOPS Sport Grant in PE (Interactive Youth Physical Education Training System); HEMC (Habersham Electric Membership Cooperation)
Grant to assist in 6th grade fieldtrip cost
Bookbag Buddies; WCIS Chorus performed at America Sings (Stone Mountain, GA)
Increase student awareness of career opportunities.
Target 1.1 – In progress for Grade K-5. A 7 Year Plan for career awareness and exploration was developed and was aligned with the Bridge Bill, CTAE
career units, and the Ga411 website activities.
White County Intermediate School
What makes White County Intermediate School Unique?
Met Goal
Dr. John D. Barge, State School Superintendent
Page 235 of 242

5 Year History of CRCT and Student Attendance
Cleveland, GA 30528-3888
706.865.1037
2696 Tesnatee Gap Valley Rd White County Intermediate School
65.0%
70.0%
75.0%
80.0%
85.0%
90.0%
95.0%
100.0%
2007 2008 2009 2010 2011
CRCT: Mathematics (Percent Passing)
White Co. Intermediate
White County
State of Georgia
65.0%
70.0%
75.0%
80.0%
85.0%
90.0%
95.0%
100.0%
2007 2008 2009 2010 2011
CRCT: Reading (Percent Passing)
White Co. Intermediate
White County
State of Georgia
65.0%
70.0%
75.0%
80.0%
85.0%
90.0%
95.0%
100.0%
2007 2008 2009 2010 2011
CRCT: English Language Arts (Percent Passing)
White Co. Intermediate
White County
State of Georgia
65.0%
70.0%
75.0%
80.0%
85.0%
90.0%
95.0%
100.0%
2007 2008 2009 2010 2011
CRCT: Science (Percent Passing)
White Co. Intermediate
White County
State of Georgia
65.0%
70.0%
75.0%
80.0%
85.0%
90.0%
95.0%
100.0%
2007 2008 2009 2010 2011
CRCT: Social Studies (Percent Passing)
White Co. Intermediate
White County
State of Georgia
65.0%
70.0%
75.0%
80.0%
85.0%
90.0%
95.0%
100.0%
2007 2008 2009 2010 2011
Percent of Students Missing Less than 15 Days of School
White Co. Intermediate
White County
State of Georgia
Dr. John D. Barge, State School Superintendent
Page 236 of 242

Teachers
Administrators
Support Staff
Teacher Attrition Rate
Principal
School Board Chair
Asian Black Hispanic White Multi LEP SWD F/R Lunch
School 1% 2% 3% 91% 4% 1% 14% 56%
District 1% 1% 3% 91% 3% 1% 15% 55%
Does Not
Meet2.5% 3.6% Yes 8.3% Yes 14.4% 12.1% No
Meets 59.4% 56.1% Yes 50.1% Yes 48.9% 48.1% Yes
Meets +
Exceeds97.5% 96.4% Yes 91.7% Yes 85.6% 87.9% No
2011 Met Did Not Meet Yes 2011 8.0% 7.5% No
2010 Met Met Equal 2010 9.6% 9.8% Yes
2009 Met Met Equal 2009 7.0% 9.9% Yes
2008 Met Did Not Meet Yes 2008 9.3% 11.0% Yes
2007 Met Met Equal 2007 9.5% 8.6% No
Charter Initially Approved Kristi Smith
DistrictSchool
0%
2011 CRCT
School
Student Demographics
Better
than
District
Better
than
District
2.5%
Year
Better
Than
District
97.5%
56.2%
66-8
176
6/10/2010
6/30/2015
White County 47.25
2594
4%
Mission Statement
To “increase student achievement through academic and organizational innovation” by encouraging stakeholder participation in public education, creating additional opportunities for
effective school system management, adding flexibility to utilize innovative methods to ensure the success of all children, and increasing the opportunity for a broader curriculum.
Year
Key Facts Personnel
Instructional Days
Adequate Yearly Progress Percent Absent > 15 Days
School District
School
Native American
0%
Better
Than
District
Math Science
White County Middle School283 Old Blairsville Rd
Cleveland, GA 30528-1133
706.865.4060
School
ELA / Reading
Grades
Enrollment
Charter System
District
Better
than
District
District District
Current Charter End Tracey Barton
Academic Achievements
Dr. John D. Barge, State School Superintendent
Page 237 of 242

Block No Multi-age grouping No Career Academy No
Shortened Day No Student/teacher teams Yes International Baccalaureate Program No
Extended Day No Grades subdivided into houses No Pre-K No
Extended Week No Students remain with teacher 2+ years No After School Programs Yes
Extended Year No Single gender classes No Community Service No
•
•
•
Goal 1:
Goal 2:
Target:
Goal 3:
Target:
Goal 4:
Target:
Scheduling Instructional Type/Services Offered
White County Middle School
2010-11 Results:
Met/Did Not Meet:
Target:
2010-11 Results:In FY 11, WCSS planned and reviewed the budget as specified in the contract timeline. A Spanish teacher was hired at the high school with plans to
move this staff member to serve other grades levels in the following years.
Met/Did Not Meet:
2010-11 Results:
Met/Did Not Meet:
Target 3.1- Establish governance at the school and system levels with mandatory initial training. Target 3.2- Offer a minimum of 3 professional learning
training sessions yearly to 100% of the governing council members to sustain an effective governance framework and to provide members with knowledge
should they decide to seek office at the local Board of Education level.
2010-11 Results:
Target 3.1 – Bylaws for the governance framework were written and approved. Members were elected or appointed to the multiple governing bodies
according to the charter application and in accordance with the White County School System Charter Bylaws. 100% of the Governing Council Members
received initial Training. Target 3.2- In addition to the four initial training sessions offered, there were three additional professional learning opportunities
during the year – System SPLOST, Millage, and Financial Information, Personnel Operations, and School Level Finance and Budget.
Met/Did Not Meet:
Increase the availability of foreign language prior to high school.
Target 5.1- Develop the scope and sequence for implementing a foreign language program K-12. Target 5.2 – Increase the availability of foreign language
for cultural exposure prior to high school. Target 5.4 – Integrate foreign language into the elementary grade levels. Additional Targets: In FY 11, WCSS will
be planning and budgeting for offering foreign language.
All students will meet high academic standards by 2013-2014.
Target 2.1 – 100% of all Grade 1-8 students will meet or exceed academic standards on the CRCT - Reading and Math. Target 2.3 – Increase the
percentage of students who exceed academic standards on the CRCT – Reading and Mathematics.
WCMS saw academic increases in the following areas for all students: ELA/Reading Meets/Exceeds, ELA/Reading Exceeds, Math Meets/Exceeds, Math Exceeds, ELA
Exceeds, Science Meets/Exceeds, Science Exceeds, Social Studies Meets/Exceeds, Social Studies Exceeds and Eighth Grade Writing Assessment. Attendance Rate –
there was a decrease in the number of students who missed 15 or more days of school.
Establish a system governance framework.
706.865.4060
Unique Accomplishments
Met Goal
Cleveland, GA 30528-1133
Met Goal
283 Old Blairsville Rd
Met Goal
WCMS Goal: Increase student achievement in 7th grade reading Target: 95% Meet, 26% Exceed 2010-2011 Results: 98% Meet, 24% Exceed Goal:
Increase student achievement in 8th grade reading Target: 98% Meet, 36% Exceed 2010-2011 Results: 98% Meet, 40% Exceed Goal:Increase student
achievement in7th grade math Target: 94% Meet, 37% Exceed 2010-2011 Results: 98% Meet, 44% Exceed Goal: Increase student achievement in 8th
grade math Target: 91% Meet, 29% Exceed 2010-2011 Results: 94% meet, 39% Exceed
Classroom Arrangements
What makes White County Middle School Unique?
Did not meet goal but made progress towards goal. Did Not Meet: Reading: Grade 7 MEETING increased from 96% in FY10 to 98% in FY11, Grade 8
MEETING increased from 96% in FY10 to 98% in FY11 and EXCEEDING increased from 35% in FY10 to 40% in FY11, Math: Grade 7 MEETING
increased from 94% in FY10 to 98% in FY 11 and EXCEEDING increased from 43% to 44%, Grade 8 MEETING increased from 82% in FY10 to 91% in
FY 11 and EXCEEDING increased from 25% to 39%.
WCMS saw academic increases in the following areas for students with disabilities: ELA/Reading Meets/Exceeds with an increase of 8%; Math Meets/Exceeds with an
increase of 20%; and Math Exceeds with an increase of 11%; Science Meets with an increase of 6%; and Eighth Grade Writing Assessment.
Academic increases occurred for the subgroup of economically disadvantaged students; ELA Exceeds with an increase of 9%; Reading Exceeds with an increase of 5%;
Math Meets/Exceeds with an increase of 8%; Math Exceeds with an increase of 10%; Science Meets/Exceeds with an increase of 5%; Science Exceeds with an increase
of 8%; Social Studies Meets/Exceeds with an increase of 9%; Social Studies Exceeds with an increase of 4%;
Increase student awareness of career opportunities.
Target 1.1 and 1.2 - A 7 Year Plan for career awareness and exploration was developed and was aligned with the Bridge Bill, CTAE career units, and the
Ga411 website activities.
Academic Goals
Target 1.1- Establish timeline for development and implementation. Target 1.2 – Implement K-12 integrated career curriculum.
Dr. John D. Barge, State School Superintendent
Page 238 of 242

5 Year History of CRCT and Student Attendance
Cleveland, GA 30528-1133
706.865.4060
White County Middle School283 Old Blairsville Rd
65.0%
70.0%
75.0%
80.0%
85.0%
90.0%
95.0%
100.0%
2007 2008 2009 2010 2011
CRCT: Mathematics (Percent Passing)
White County Middle School
White County
State of Georgia
65.0%
70.0%
75.0%
80.0%
85.0%
90.0%
95.0%
100.0%
2007 2008 2009 2010 2011
CRCT: Reading (Percent Passing)
White County Middle School
White County
State of Georgia
65.0%
70.0%
75.0%
80.0%
85.0%
90.0%
95.0%
100.0%
2007 2008 2009 2010 2011
CRCT: English Language Arts (Percent Passing)
White County Middle School
White County
State of Georgia
65.0%
70.0%
75.0%
80.0%
85.0%
90.0%
95.0%
100.0%
2007 2008 2009 2010 2011
CRCT: Science (Percent Passing)
White County Middle School
White County
State of Georgia
65.0%
70.0%
75.0%
80.0%
85.0%
90.0%
95.0%
100.0%
2007 2008 2009 2010 2011
CRCT: Social Studies (Percent Passing)
White County Middle School
White County
State of Georgia
65.0%
70.0%
75.0%
80.0%
85.0%
90.0%
95.0%
100.0%
2007 2008 2009 2010 2011
Percent of Students Missing Less than 15 Days of School
White County Middle School
White County
State of Georgia
Dr. John D. Barge, State School Superintendent
Page 239 of 242

Teachers
Administrators
Support Staff
Teacher Attrition Rate
Principal
School Board Chair
Asian Black Hispanic White Multi LEP SWD F/R Lunch
School 1% 1% 3% 91% 4% 0% 12% 43%
District 1% 1% 3% 91% 3% 1% 15% 55%
Does Not
Meet8.5% 8.5% Equal 10.4% Equal 4.8% 4.8% Equal
Meets 43.2% 43.2% Equal 47.4% Equal 29.4% 29.4% Equal
Meets +
Exceeds91.5% 91.5% Equal 89.6% Equal 95.2% 95.2% Equal
2011 Met Did Not Meet Yes 2011 90.8% 90.8% Equal
2010 Met Met Equal 2010 94.1% 94.1% Equal
2009 Met Met Equal 2009 90.8% 89.7% Yes
2008 Did Not Meet Did Not Meet Equal 2008 85.9% 84.6% Yes
2007 Met Met Equal 2007 80.4% 80.4% Equal
District
Better
than
District
District
White County High School2600 Highway 129 N
Cleveland, GA 30528-2710
706.865.2312
School
ELA
Grades
Enrollment
Charter System
Native American
0%
Better
Than
District
Math Science
Adequate Yearly Progress Graduation Rate
School District
Mission Statement
To “increase student achievement through academic and organizational innovation” by encouraging stakeholder participation in public education, creating additional opportunities for
effective school system management, adding flexibility to utilize innovative methods to ensure the success of all children, and increasing the opportunity for a broader curriculum.
Year
Key Facts Personnel
Instructional Days
3K-5
176
6/10/2010
6/30/2015
Charter Initially Approved
Current Charter End
White County 54.75
4.3816
18%
Gail Greear
John Osborne
Better
Than
District
89.6%
47.4%
District
District
School
School
0%
2011 GHSGT
School
Student Demographics
Better
than
District
Better
than
District
Academic Achievements
10.4%
Year
Dr. John D. Barge, State School Superintendent
Page 240 of 242

Block Yes Multi-age grouping Yes Career Academy No
Shortened Day No Student/teacher teams No International Baccalaureate Program No
Extended Day No Grades subdivided into houses No Pre-K No
Extended Week No Students remain with teacher 2+ years No After School Programs No
Extended Year No Single gender classes No Community Service No
•
•
•
Goal 1:
Goal 2:
Target:
Goal 3:
Target:
Goal 4:
Target:
Increase student awareness of career opportunities.
Targets: *The number of students eligible to receive a high school pathway industry credential was increased from a 2009-2010 baseline of 0 to a 2010-
2011 total of 63. *The number of seniors who completed the work ready assessment to receive a work ready certificate was increased from a 2009-2010
baseline of 60 to a 2010-2011 total of 76. *The number of Peach State Pathways available was increased from a 2009-2010 baseline of 3 to a 2010-2011
total of 6.
White County High School
Met Goal
2600 Highway 129 N
Met Goal
2010-2011 ELA Results :87% Met; 2010-2011 Math Results: 80% Met
Classroom Arrangements
What makes White County High School Unique?
Did not meet goal
Establish a system governance framework.
706.865.2312Cleveland, GA 30528-2710
Met Goal
Academic Goals
Targets : *Target for increasing the number of students eligible to receive a high school pathway industry credential from a 2009-2010 baseline of 0 to a
2010-2011 total of 10. *Target for increasing the number of seniors who complete the work ready assessment to receive a work ready certificate from a
2009-2010 baseline of 60 to a 2010-2011 total of 70. *Target for increasing the number of Peach State Pathways available from a 2009-2010 baseline of 3
to a 2010-2011 total of 6.
Introduced a senior picnic involving community; Hosted two community pep rally's to build interest in high school
Implemented Whiteco TV – a student led and operated internet broadcasting television station (www.whiteco.tv )
Increase opportunities for enrollment in virtual learning.
In FY 11, WCSS virtual enrollment will increase by 100% (8 enrollments). The base line in 2009 was 4 which was set to increase to 8 in 2010-2011.
All students will meet high academic standards by 2013-2014.
ELA: 94.4%; Math: 81.2%
Increased AP participation from 28 to 294; Maintained extremely high grad rate of 90+%
Unique Accomplishments
2010-11 Results: The opportunity for virtual learning was increased from the FY 10 enrollment of 4 to an enrollment of 14 in FY11.
Met/Did Not Meet:
2010-11 Results:
Met/Did Not Meet:
Target 3.1- Establish governance at the school and system levels with mandatory initial training. Target 3.2- Offer a minimum of 3 professional learning
training sessions yearly to 100% of the governing council members to sustain an effective governance framework and to provide members with knowledge
should they decide to seek office at the local Board of Education level.
2010-11 Results:
Target 3.1 – Bylaws for the governance framework were written and approved. Members were elected or appointed to the multiple governing bodies
according to the charter application and in accordance with the White County School System Charter Bylaws. 100% of the Governing Council Members
received initial Training. Target 3.2- In addition to the four initial training sessions offered, there were three additional professional learning opportunities
during the year – System SPLOST, Millage, and Financial Information, Personnel Operations, and School Level Finance and Budget.
Met/Did Not Meet:
2010-11 Results:
Met/Did Not Meet:
Target:
Scheduling Instructional Type/Services Offered
Dr. John D. Barge, State School Superintendent
Page 241 of 242

2600 Highway 129 NWhite County High School
5 Year History of GHSGT and Graduation Rate
Cleveland, GA 30528-2710
706.865.2312
65.0%
70.0%
75.0%
80.0%
85.0%
90.0%
95.0%
100.0%
2007 2008 2009 2010 2011
GHSGT: Mathematics (Percent Passing)
White County High School
White County
State of Georgia
65.0%
70.0%
75.0%
80.0%
85.0%
90.0%
95.0%
100.0%
2007 2008 2009 2010 2011
GHSGT: English Language Arts (Percent Passing)
White County High School
White County
State of Georgia
65.0%
70.0%
75.0%
80.0%
85.0%
90.0%
95.0%
100.0%
2007 2008 2009 2010 2011
GHSGT: Science (Percent Passing)
White County High School
White County
State of Georgia
65.0%
70.0%
75.0%
80.0%
85.0%
90.0%
95.0%
100.0%
2007 2008 2009 2010 2011
GHSGT: Social Studies (Percent Passing)
White County High School
White County
State of Georgia
65.00%
70.00%
75.00%
80.00%
85.00%
90.00%
95.00%
100.00%
2007 2008 2009 2010 2011
Graduation Rate
White County High School
White County
State of Georgia
Dr. John D. Barge, State School Superintendent
Page 242 of 242