Embed Size (px)
Citation preview

Georgia Capital PLC 2nd half and full year 2018 preliminary results
Georgia Capital PLC 2nd half and full year 2018 preliminary results
Name of authorised official of issuer responsible for making notification:
Nino Rekhviashvili, Head of Investor Relations and Funding
www.georgiacapital.ge

2
About Georgia Capital PLC
Georgia Capital PLC (“Georgia Capital” or “the Group” – LSE: CGEO LN) is a UK listed holding company of a
diversified group of companies focused on investing in businesses in Georgia with holdings in industries that
are expected to benefit from the continued strong growth and diversification of the Georgian economy. The
Group seeks to create value by driving the development of high growth potential businesses in Georgia, aiming
to consolidate fragmented or underdeveloped markets. We either acquire our businesses during their early
development stage or establish them on a greenfield basis.
Georgia Capital currently has six private company holdings: (i) a water utility business, owned through GGU,
(ii) a renewable energy business, owned through GGU; (iii) a housing development business, owned through
m2 (iv) a hospitality and commercial real estate business, owned through m2; (v) a property and casualty
insurance business, owned through Aldagi and (vi) a beverages business, owned through Georgia Beverages,
and two public company holdings (London Stock Exchange premium-listed Georgian companies): (i) Georgia
Healthcare Group PLC (“GHG”), (57% equity stake), a UK incorporated holding company of the largest
healthcare services provider in Georgia, which is also the largest pharmaceuticals retailer and wholesaler in the
country; and (ii) Bank of Georgia Group PLC (“BoG”), (19.9% equity stake), a leading universal bank in Georgia.
Georgia Capital aims to deliver total shareholder returns of 10-times over 10-years1 10x = 10y
1 29 May 2018, Georgia Capital’s listing date on the London Stock Exchange is the starting point for 10-year return calculation.
Vineyards in Kakheti,
Georgia’s wine region
Geo
rgia
Cap
ital
PLC
| 2
H1
8 &
FY
18
resu
lts
3
Content
FORWARD LOOKING STATEMENTS
This announcement contains forward-looking statements, including, but not limited to, statements concerning expectations,
projections, objectives, targets, goals, strategies, future events, future revenues or performance, capital expenditures,
financing needs, plans or intentions relating to acquisitions, competitive strengths and weaknesses, plans or goals relating
to financial position and future operations and development. Although Georgia Capital PLC believes that the expectations
and opinions reflected in such forward-looking statements are reasonable, no assurance can be given that such expectations
and opinions will prove to have been correct. By their nature, these forward-looking statements are subject to a number of
known and unknown risks, uncertainties and contingencies, and actual results and events could differ materially from those
currently being anticipated as reflected in such statements. Important factors that could cause actual results to differ
materially from those expressed or implied in forward-looking statements, certain of which are beyond our control, include,
among other things: currency fluctuations, including depreciation of the Georgian Lari, and macroeconomic risk; regional
tensions and instability; regulatory risk across a wide range of industries; investment strategy risk; investment risk and
liquidity risk and other key factors that indicated could adversely affect our business and financial performance, which are
contained elsewhere in this document and in our past and future filings and reports and also the 'Principal Risks and
Uncertainties' included in Georgia Capital PLC’s 1H18 results announcement and in BGEO Group PLC's Annual Report and
Accounts 2017. No part of this document constitutes, or shall be taken to constitute, an invitation or inducement to invest
in Georgia Capital PLC or any other entity, and must not be relied upon in any way in connection with any investment
decision. Georgia Capital PLC and other entities undertake no obligation to update any forward-looking statements, whether
as a result of new information, future events or otherwise, except to the extent legally required. Nothing in this document
should be construed as a profit forecast.
4 2H18 and FY18 results conference call details
5 Financial highlights
7 Chairman and CEO statement
10 Discussion of results
12 Net Asset Value statement
15 Income statement
19 Capital allocation
22 Discussion of portfolio company results
22 Water utility business
24 Housing development business
26 Property & casualty insurance business
28 Renewable energy business
30 Hospitality & commercial real estate business
32 Beverages business
34 Georgia Healthcare Group
36 Reconciliation of adjusted IFRS measures to IFRS figures
30 Detailed financial information
52 Appendices
54 Company information
Geo
rgia
Cap
ital
PLC
| 2
H1
8 &
FY
18
resu
lts
Geo
rgia
Cap
ital
PLC
| 2
H1
8 &
FY
18
resu
lts

4
Georgia Capital PLC announces the Group’s second half 2018 and full year 2018 financial results.
Throughout this document, “Georgia Capital” and the “Group” refer to Georgia Capital PLC and its portfolio
companies as a whole, while “GCAP” refers to the aggregation of stand-alone Georgia Capital PLC and stand-
alone JSC Georgia Capital accounts2. This announcement contains financial results presented on two different
bases: under International Financial Reporting Standards (“IFRS”) as adopted by the European Union and under
an adjusted IFRS methodology3. The financial results are unaudited and derived from management accounts.
The information in this Announcement in respect of full year 2018 preliminary results, which was approved by
the Board of Directors on 20 February 2019, does not constitute the Group’s full financial statements. The
financial statements for the year ended 31 December 2018 will be included in the Annual Report and Accounts
to be published in April 2019 and filed with the Registrar of Companies in due course.
An investor/analyst conference call, organised by the Group, will be held on 21 February 2019, at 15:00 UK /
16:00 CET / 10:00 U.S Eastern Time. The duration of the call will be 60 minutes and will consist of a 15-minute
update and a 45-minute Q&A session.
2 Georgia Capital PLC is our UK holding company whose principal subsidiary is JSC Georgia Capital, Georgian holding company for our operating businesses. 3The Group operates as a holding company of a diversified group of companies focused on investing in businesses in Georgia and its strategy is to acquire and
develop and then exit portfolio companies - it is not in the business of managing or owning portfolio companies indefinitely. As such, and in order to provide
transparency in our results in the most relevant and useful way for our investors, we have elected to also provide a set of management accounts that adjust the
IFRS results to present Georgia Capital on a holding company basis (“management accounts”). Our discussion, therefore, focuses on the management accounts.
Whereas, at each portfolio company level we present IFRS financial statements and our discussion focuses on IFRS results. A reconciliation of our holding
company basis management accounts to the IFRS statements is provided on pages 36-38. The management accounts are an alternative performance measure
(“APM”); the basis for their preparation is described on pages 10-18; they have not been audited or reviewed.
Dial-in numbers: 30-Day replay:
Pass code for replays/Conference ID: 4559448 Pass code for replays / Conference ID: 4559448
International Dial In: +44 (0) 2071 928000 UK Freephone Dial In: 08082380667
UK Freephone Dial In: 08003767922 UK Local Dial In: 08445718951
UK Local Dial In: 08445718892 International Dial In: +44 (0) 3333009785
US: 18669661396 US: 1 (866) 331-1332
Austria: 0800111950
Belgium: 080048740
Canada: 18669926802
Czech Republic: 800700917
Denmark: 80718097
Finland: 0800773496
France: 0805103028
Germany: 08007234866
Greece: 8008481044
Hungary: 0680015520
Ireland: 1800936148
Italy: 800682772
Luxembourg: 80024782
Norway: 80051874
Spain: 800098826
Sweden: 0200125581
Switzerland: 0800740377

5
FINANCIAL HIGHLIGHTS Double-digit revenue growth coupled with strong operating cash flow generation
GEORGIA CAPITAL HIGHLIGHTS (MANAGEMENT ACCOUNTS4) (GEL’000)
Georgia Capital performance 2H18 2H17 Change 1H18 Change FY18 FY17 Change
GCAP net operating income 26,968 6,961 NMF 21,722 24.2% 48,690 13,603 NMF
Total attributable income of portfolio companies 111,074 39,830 NMF 76,791 44.6% 187,865 93,909 NMF
of which, income from listed businesses 56,795 9,067 NMF 55,774 1.8% 112,569 20,889 NMF
of which, income from private businesses 54,279 30,763 76.4% 21,017 NMF 75,296 73,020 3.1%
Net income 99,349 27,252 NMF 65,058 52.7% 164,407 70,473 NMF
Georgia Capital NAV overview Dec-18 Dec-17 Change
Total portfolio value 1,883,374 1,850,861 1.8%
Net Asset Value (NAV) 1,688,221 1,840,447 -8.3%
Listed portfolio companies 977,827 933,481 4.8%
Private portfolio companies 905,547 917,380 -1.3%
Liquid assets & loans issued 605,130 264,546 NMF
Net debt (196,915) (7,733) NMF
NAV per share, GEL 47.13 46.73 0.9%
NAV per share, GBP 13.88 13.35 4.0%
PERFORMANCE HIGHLIGHTS (IFRS) (GEL’000)
Group consolidated 2H18 2H17 Change 1H18 Change FY18 FY17 Change
Revenue 666,699 586,256 13.7% 616,167 8.2% 1,282,866 1,127,170 13.8%
Gross profit 260,543 221,229 17.8% 226,132 15.2% 486,675 431,461 12.8%
Private, late stage, portfolio performance
Revenue, Water Utility 79,295 74,419 6.6% 69,832 13.6% 149,127 135,000 10.5%
EBITDA5, Water Utility 46,127 41,474 11.2% 37,232 23.9% 83,359 72,573 14.9%
Gross real estate profit, Housing Development 7,341 6,114 20.1% 7,594 -3.3% 14,935 8,313 79.7%
EBITDA, Housing Development 3,714 1,207 NMF 5,163 -28.1% 8,877 21,970 -59.6%
Earned premiums, net, P&C 36,039 33,284 8.3% 31,451 14.6% 67,490 62,770 7.5%
Adjusted net income, P&C6 9,429 8,710 8.3% 8,305 13.5% 17,734 16,300 8.8%
Private, early stage, portfolio performance
EBITDA, Renewable Energy (367) (729) 49.7% (403) 8.9% (770) (1,733) 55.6%
NOI, Hospitality & Commercial Real Estate 29,690 2,036 NMF 1,851 NMF 31,541 3,369 NMF
EBITDA, Beverages (354) 1,763 NMF (6,087) 94.2% (6,441) 856 NMF
Listed portfolio performance
EBITDA, GHG 69,643 56,994 22.2% 62,631 11.2% 132,274 108,148 22.3%
Adjusted net income, BoG6 236,248 201,060 17.5% 222,022 6.4% 458,270 373,822 22.6%
KEY POINTS ▪ Fair value NAV at GEL 1.7 billion vs book value NAV of GEL 1.5 billion, an uplift of 14%7
▪ Total portfolio value up 1.8% to GEL 1.9 billion and NAV per share up 0.9% to GEL 47.1 on the back of the
contribution of the Bank of Georgia shares as part of the demerger (GEL 457 million addition)
▪ Absent the Bank of Georgia addition, NAV was down as emerging and frontier markets experienced
valuation pressure
▪ GEL 188 million attributable income from portfolio companies for FY18
▪ GCAP stand-alone cash inflow of GEL 100 million in 2018 driven by GEL 72 million dividends received
▪ GEL 605 million dry powder available for deployment subject to 360⁰ opportunity analysis
▪ GEL 25.8 million value created in Hospitality & Commercial from hotel revaluation
▪ Housing Development paid first-ever dividends of GEL 10 million
▪ BoG declared an annual dividend for 2018 of GEL 2.55 per share subject to AGM approval, representing a
30% payout ratio and a 4.5% increase over 2017 dividend per share
4 Please see the pages 10-18 where we describe the preparation methodology of our management accounts, thereby defining each management account
highlight presented in the Georgia Capital highlights table above. 5 EBITDA is an alternative performance measure (APM) and is defined on page 53 in the glossary. 6 IFRS net incomes for P&C Insurance and BoG are adjusted to exclude the impact of non-recurring items and non-recurring deferred tax remeasurement
charges. 7 Please see page 41, where we provide our book value NAV comparison with Fair value NAV.
Geo
rgia
Cap
ital
PLC
| 2
H1
8 &
FY
18
resu
lts
6
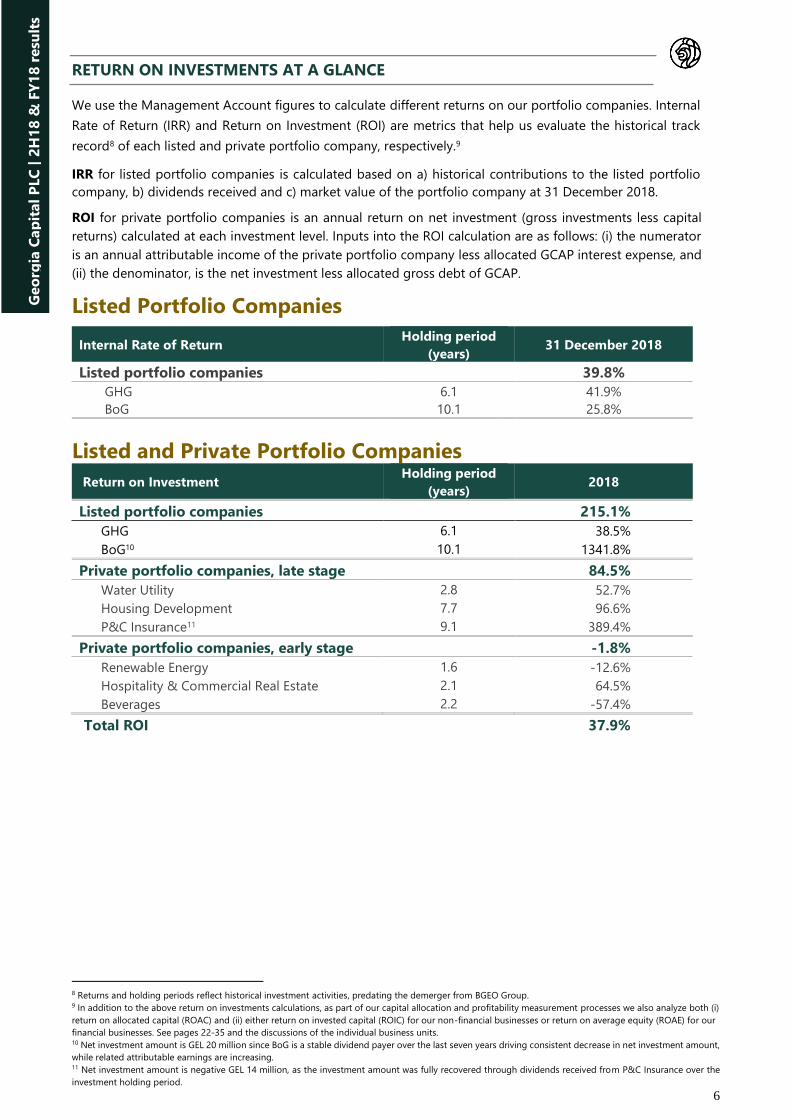
RETURN ON INVESTMENTS AT A GLANCE
We use the Management Account figures to calculate different returns on our portfolio companies. Internal
Rate of Return (IRR) and Return on Investment (ROI) are metrics that help us evaluate the historical track
record8 of each listed and private portfolio company, respectively.9
IRR for listed portfolio companies is calculated based on a) historical contributions to the listed portfolio
company, b) dividends received and c) market value of the portfolio company at 31 December 2018.
ROI for private portfolio companies is an annual return on net investment (gross investments less capital
returns) calculated at each investment level. Inputs into the ROI calculation are as follows: (i) the numerator
is an annual attributable income of the private portfolio company less allocated GCAP interest expense, and
(ii) the denominator, is the net investment less allocated gross debt of GCAP.
Listed Portfolio Companies
Internal Rate of Return Holding period
(years) 31 December 2018
Listed portfolio companies 39.8%
GHG 6.1 41.9%
BoG 10.1 25.8%
Listed and Private Portfolio Companies
Return on Investment Holding period
(years) 2018
Listed portfolio companies 215.1%
GHG 6.1 38.5%
BoG10 10.1 1341.8%
Private portfolio companies, late stage 84.5%
Water Utility 2.8 52.7%
Housing Development 7.7 96.6%
P&C Insurance11 9.1 389.4%
Private portfolio companies, early stage -1.8%
Renewable Energy 1.6 -12.6%
Hospitality & Commercial Real Estate 2.1 64.5%
Beverages 2.2 -57.4%
Total ROI 37.9%
8 Returns and holding periods reflect historical investment activities, predating the demerger from BGEO Group. 9 In addition to the above return on investments calculations, as part of our capital allocation and profitability measurement processes we also analyze both (i)
return on allocated capital (ROAC) and (ii) either return on invested capital (ROIC) for our non-financial businesses or return on average equity (ROAE) for our
financial businesses. See pages 22-35 and the discussions of the individual business units. 10 Net investment amount is GEL 20 million since BoG is a stable dividend payer over the last seven years driving consistent decrease in net investment amount,
while related attributable earnings are increasing. 11 Net investment amount is negative GEL 14 million, as the investment amount was fully recovered through dividends received from P&C Insurance over the
investment holding period.
Geo
rgia
Cap
ital
PLC
| 2
H1
8 &
FY
18
resu
lts
Geo
rgia
Cap
ital
PLC
| 2
H1
8 &
FY
18
resu
lts

Georgia Capital PLC Half-year 2018 results
7
CHAIRMAN AND CEO’S STATEMENT
2018 was the first year for Georgia Capital as an independent premium listed company on the London Stock
Exchange, following the completion of our demerger from BGEO Group PLC on 29 May 2018. During 2018 we
remained focused on developing and instutionalising our diverse set of businesses in Georgia, while also
building on our 3C foundations by improving access to capital, focusing on cash generation and developing C
level talent. As discussed in our last trading update, we are now introducing management estimated fair values
of our private portfolio businesses. These fair values, which form an integral part of our FY18 management NAV
statement, have been estimated based on the valuation multiples of carefully selected listed peer companies in
comparable frontier and emerging market countries.
Portfolio Valuation and Performance
Following the introduction of these fair values for our private portfolio companies, our portfolio value reached
GEL 2 billion at 31 December 2018, a 1.8% y-o-y increase. NAV per share increased by 0.9% to GEL 47.1, while
NAV stood at GEL 1.7 billion, down 8.3% y-o-y. Given negative stock market conditions during 4Q18, valuations
of our listed and unlisted companies were unfavourably affected; however, the underlying business
performances were outstanding with double-digit revenue growth and strong operating cash flow generation
supporting increased earnings. This leads us to be confident that the intrinsic values of our portfolio companies
have increased at a much higher level than their underlying valuations at 31 December 2018.
Turning to the management income statement, I am pleased to see the Group delivered GEL 164 million net
income in 2018 reflecting strong performances across our portfolio companies. GCAP net operating income was
GEL 49 million, driven by dividend receipts from portfolio companies and interest income from liquid funds and
issued loans, part of which was offset by operating expenses. During our first incomplete year of operations, we
collected GEL 100 million cash at the stand-alone GCAP level, of which GEL 72 million were dividends from
portfolio companies and GEL 28 million were interest receipts.
Our portfolio companies continued to deliver strong results as attributable income from the listed portfolio
companies increased to GEL 113 million, while attributable income from the private portfolio companies
increased to GEL 75 million. At the same time, consolidated revenues of portfolio companies increased by 13.8%
to GEL 1.3 billion in 2018. Let me touch on the performance of each portfolio company in more detail:
Georgia Healthcare Group successfully completed its substantial three-year business investment programme
during 2018. This resulted in a record full-year EBITDA of GEL 132 million, an increase of 22.3% y-o-y. At the
same time, revenues increased by 14% and management increased positive operating cash flow generation by
71% y-o-y. We are delighted with GHG’s progress; their focus on generating significant free cash flow over the
next few years; and their intention to gradually reduce business leverage and further improve returns on invested
capital in the coming years.
Bank of Georgia’s 2018 adjusted net income and adjusted ROAE were record-high at GEL 458 million and
26.1%, respectively, in 2018. We like BOG’s focus on profitability, while also maintaining strong liquidity, high
NPL coverage and improving cost to income ratios. We are also pleased with the Bank’s improved capital
adequacy ratios and increased dividend per share. In addition, we expect that BOG’s strong franchise will allow
its new CEO to successfully take advantage of significant growth opportunities in Georgia.
The water utility business, our largest private portfolio business, delivered GEL 83 million EBITDA, up 14.9% y-
o-y, in 2018. The double-digit increase was driven by higher revenues from water sales and continued efficiency
improvements, which were offset by lower than expected revenues from electricity sales. Record-low water
intakes at Zhinvali reservoir resulted in lower electricity generation, which in turn led to a GEL 6 million revenue
shortfall against management’s expectations. The business management team continues to be well positioned
to successfully deliver on their strategy to complete the existing capex programme and extract further
efficiencies.
The housing development business continued its successful project execution and apartment sales reached
87% of on-going projects. Gross real estate profit was up 79.7% to GEL 14.9 million, excluding revaluation gains.
Strong sales allowed the business to make its first-ever GEL 10 million dividend payment. The business has also
recently received an approval from Tbilisi City Hall to develop its largest ever in-house affordable housing project
in Digomi, Tbilisi, which will add around 168,000 sq.m. residential area to Housing Development’s portfolio. The
project will be developed in three stages, where phase I has already added 22,000 sq.m. to the company’s
inventory in 1Q19, a threefold increase over the 31 December 2018 level. Pre-sales started at the beginning of
Geo
rgia
Cap
ital
PLC
| 2
H1
8 &
FY
18
resu
lts

8
February 2019 and, to date 6,614 sq.m. has either been sold or reserved, at an average price of US$
1,025 per sq.m..
The property & casualty insurance business’ net underwriting profit increased by 12.8% to GEL 32.2 million in
2018, supported by the introduction of compulsory border third-party liability insurance and implementation of
efficient risk management practices. Recurring adjusted ROAE stood at 34.4%, which allowed the business to
increase dividend payments by 43% y-o-y to GEL 10 million.
Within our early stage private businesses, the renewable energy business continued the construction of
Mestiachala HPPs, which remains within its original budget and is on track to be commissioned in 1H19. We
estimate approximately GEL 12-15 million EBITDA from Mestiachala HPPs in 2019. The business is also on track
to launch the development of c. 100 MWs of wind power plants and c. 46 MWs of HPPs in 2019.
The hospitality & commercial real estate business is also delivering on its strategy and has targeted 1,000
operational rooms by the end of 2021. The business continued strong project execution and created GEL 27.6
million additional value in 4Q18, of which GEL 25.8 million was from revaluation of hotels and GEL 1.8 million
from revaluation of commercial properties. The business also secured US$ 30 million funding for the
development of pipeline hotels by tapping the local debt capital market in December 2018.
Finally, the beverages business underwent significant transformation in 2018 whilst achieving 36.8% y-o-y
revenue growth. On one hand, the wine business significantly expanded its vineyard base by acquiring 350
hectares through the acquisition of the Kindzmarauli business and developed additional export markets, which
resulted in a 31.8% increase in EBITDA to GEL 7.2 million. On the other hand, the beer business was adversely
affected by delays in launching Heineken beer brands which contributed to an EBITDA loss of GEL 13.8 million.
However, our state-of-the-art brewery successfully passed the latest on-site operational audit from Heineken in
January 2019 and we remain on track for the commercial launch of Amstel in April, followed by the Heineken
launch by the end of 1H19.
Capital allocation
During 2018 we allocated GEL 85 million of capital across our portfolio companies in order to make progress
towards established business goals. We allocated GEL 5 million to our renewable energy business and GEL 32.9
million to the hospitality business for development of pipeline projects, while GEL 40.6 million went to Beverages
for bolt-on acquisitions to increase its scale. We also added the Education business to our pipeline by investing
GEL 6 million in land for high school development, where we expect to build a portfolio of affordable high
schools to capitalise on our scale advantage in what is currently a very fragmented, private high school education
market. We target investing GEL 140 million equity capital in Education and aim to reach 30,000 pupils by the
end of 2025.
Our capital allocation decisions are aimed at maximising real economic benefits. Given that market price
significantly undervalued the Group’s economic value during 2018, we invested in the Georgia Capital portfolio
through share buybacks. Since the launch of the buyback programme on 14 June 2018, we have bought back
1,251,829 shares and utilised US$ 17.9 million of our US$ 45 million buyback programme.
We manage our capital needs such that we do not depend on potentially premature liquidation of our listed
portfolio companies. Our ability to capitalise on the benefits of better capital allocation constitutes a pathway
towards improving returns and therefore we constantly look for favourable investment opportunities in Georgia,
preferably within capital light service industries. The proceeds from the placement of our inaugural international
US$ 300 million 6.125% corporate bonds due 2024 allow us to remain well-funded for our expected capital
allocation outlook through 2022 and potential acquisitions at attractive valuations. Based on our capital
allocation outlook through the end of 2022, as described on page 19, we currently plan to invest approximately
GEL 413 million and expect to receive dividends of GEL 400 million, leading to net capital outflows of GEL 13
million. This investment need will be comfortably funded through the existing liquidity of Georgia Capital, which
stood at GEL 605 million at 31 December 2018.
Macroeconomic environment
The Georgian economy continues to perform strongly as real GDP growth was an estimated 4.8% in 2018 on
the back of strong external demand driven by double-digit growth in exports, remittances and tourism revenues.
Inflation was well-contained at 2.6% in 2018, close to the targeted 3% level, while the Georgian Lari remained
resilient to regional turbulence in Turkey and Russia and showed only 3.3% depreciation against the US Dollar
in 2018. The current account deficit continued to shrink in 2018 and for the first time in Georgia’s history, we
had a current account surplus in 3Q18. The fiscal deficit is also expected to decrease to 2.3% of GDP in 2018

9
from 2.9% in 2017. As upward risks to inflation neutralised, the National Bank of Georgia started a
gradual exit from its moderately tightened monetary policy and decreased its refinancing rate by 25 basis points
in July 2018 and then again in January 2019 to 6.75%. The National Bank of Georgia also signaled that the
refinancing rate will likely return to its neutral level of 5.5% to 6% over the next two years. We expect this trend
to lead to lower local currency cost of funding and higher economic activity for our portfolio companies in the
medium-term.
Outlook
Economic activity in Georgia continues to grow and our outlook remains positive for 2019. Asset prices have
improved since the end of 2018, thereby increasing the value of our listed portfolio companies and NAV per
share to GEL 1.1 billion and GEL 51.5 per share (an equivalent of GBP 15.0), respectively, as of the close of
business on 20 February 2019. We expect continued strong cash flow generation across our late stage
businesses, while within the early state portfolio we are on track to commission our first hydro power plant,
open two new hotels in the Gudauri and Svaneti regions, fully launch our brewery and open all periodic vehicle
inspection centres. We remain well positioned to take advantage of attractive opportunities with clear discipline,
and to create sustainable long-term value for our shareholders.
Irakli Gilauri,
Chairman and CEO
20 February 2019
10
DISCUSSION OF RESULTS Management Accounts
Management monitors the Group’s performance on a regular basis based on developments in a management
account income statement and statement of Net Asset Value (NAV) prepared under the adjusted IFRS
methodologies described in the relevant section below. The management accounts are an alternative performance
measure (“APM”); they have not been audited or reviewed. A reconciliation of our management accounts to the
IFRS statements is provided on pages 36-38.
Net Asset Value (NAV) Statement
Our Management Accounts include a Net Asset Value (NAV) statement which breaks down NAV into its
components and follows the changes therein, providing management with a snapshot of the Group’s financial
position at any given time. NAV statement provides a value of Georgia Capital that management uses as a tool
for measuring its investment performance. Georgia Capital management closely monitors NAV in connection with
capital allocation decisions. The following methodology underlies the presentation of the NAV for period end dates:
• NAV is calculated at stand-alone GCAP level, which represents the aggregation of the stand-alone assets and
liabilities of Georgia Capital PLC and JSC Georgia Capital
• Holdings in listed and private portfolio companies are valued for the purposes of NAV according to the
following methodology:
o Listed portfolio companies are carried at the period-end market values based on closing share prices
on respective reputable stock exchanges
o Private businesses are carried at fair value based on a valuation technique believed to be most
appropriate to that investment as described below
▪ NAV per share represents total NAV divided by the number of outstanding shares at the end of the period
under IFRS, i.e. issued shares less treasury shares. Treasury shares for these purposes are the sum of shares
repurchased under our $45 million buyback programme and shares held by the management trust
(unawarded and/or unvested).
In addition to the investment return calculations, described above in this document, we also measure total return
of each portfolio investment in numeric terms as follows: we aggregate a) change in beginning and ending fair
values, b) gains from realized sales (if any) and c) dividend income during period. We then adjust the net result to
remove capital injections (if any) to arrive at the total investment return.
Private portfolio valuation overview
Prior to 31 December 2018, management NAV reflected private businesses at their IFRS book values, however,
starting from FY18 results announcement we are disclosing NAV based on management’s estimated fair values
for the private businesses. While the estimated fair values do not necessarily reflect management’s view of their
intrinsic values, we believe they provide valuable insights based on how the stock markets value similar businesses.
We estimate the fair values of our different private businesses as follows:
• For businesses, where values are typically derived based on valuation multiples in public stock markets, we
use different measures depending on the type of business and circumstances. In each case we apply multiples
for relevant peers.
o For businesses in non-financial industries, estimated fair values are generally based on Enterprise
Value (EV)/EBITDA multiples (in exceptional cases, where EBITDA is negative and if deemed
reasonable, an EV/Sales multiple is applied).
o For businesses in the financial sector, estimated fair values are based on price to earnings (P/E)
multiples.
The Group identifies peer group for each private portfolio company by taking into account similarities in
aspects such as industry, business model, company size, economic and regulatory factors, growth prospects
and risk profiles. Peers are selected from frontier and emerging market economies. When estimating the

11
applicable multiple, certain peers can be more heavily weighted when their characteristics are
closer to those of the portfolio company being valued than others. We generally focus on recurring last
twelve months (LTM) earnings when evaluating the performance of our companies. From the estimated
EV, period end net debt is deducted, and the remaining equity value is apportioned to Georgia Capital
based on its ownership stake in the company. We use discounted cash flow (DCF) analysis to validate fair
values derived by applying listed peer group multiples (in case of Water Utility, EV/EBITDA less
maintenance capex multiple is also used for validation).
• For businesses where values are derived primarily from the underlying value of the assets, and such assets are
carried at fair value (usually determined by independent international valuation companies) on their books
and records, we consider the book value of the equity investment to be its fair value at the reporting date.
• For greenfield businesses, where the business operations have not been fully launched, we also believe that
book value is an appropriate estimate of fair value.
• Finally, acquisitions within the previous 12 months are valued at the original investment amount adjusted for
earnings or losses recorded following the acquisition.
The table below summarizes fair valuation of our holdings in private portfolio companies excluding pipeline as at
31 December 2018:
Business Valuation method Fair value,
GEL thousands
Multiple
applied
Late stage portfolio 628,326
Water Utility EV/EBITDA (Based on LTM EBITDA) 431,017 8.8
Housing Development NAV at reporting date 66,785 N/A
P&C Insurance P/E (Based on LTM Net income) 130,524 7.4
Early stage portfolio 271,288
Renewable Energy At book value until power plant is operational. EV/
EBITDA (LTM) following the launch 61,182 N/A
Hospitality & Commercial
Real Estate NAV at reporting date 149,079 N/A
Beverages – wine EV/EBITDA (Based on LTM EBITDA) 56,771 9.1
Beverages – beer EV/Sales (Based on LTM sales) due to negative
EBITDA 4,256 2.2
12
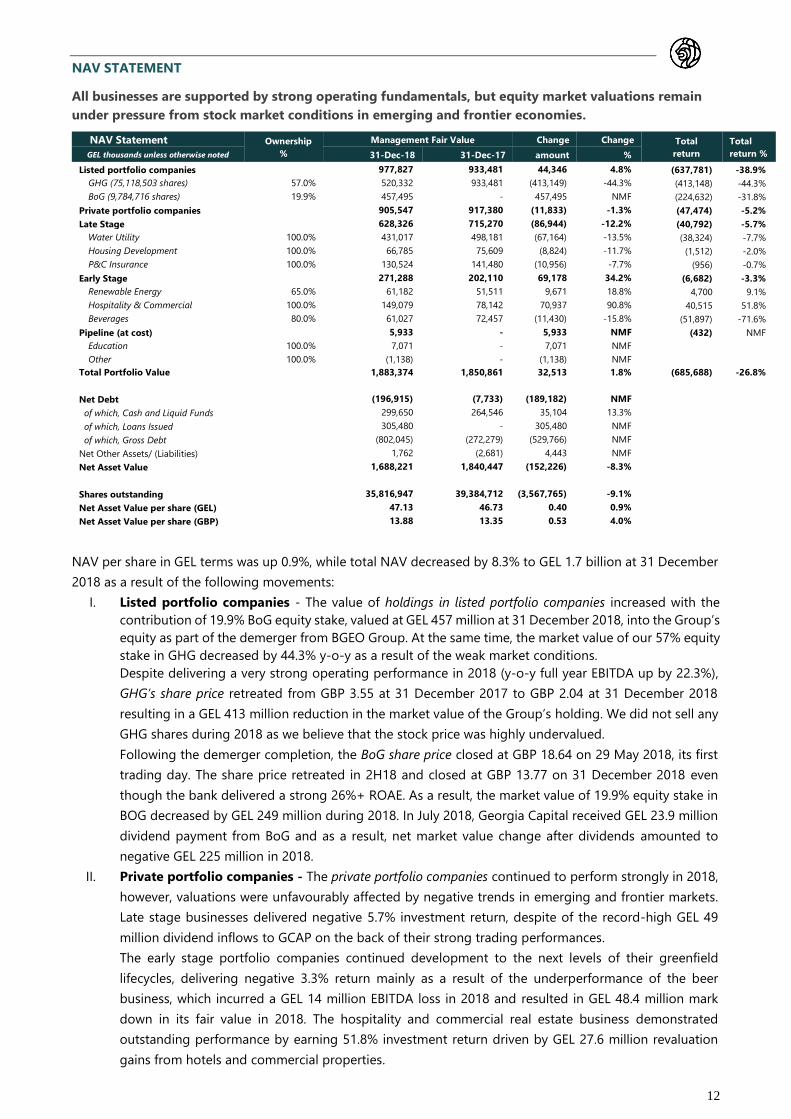
NAV STATEMENT
All businesses are supported by strong operating fundamentals, but equity market valuations remain
under pressure from stock market conditions in emerging and frontier economies.
NAV Statement Ownership
%
Management Fair Value Change Change Total
return
Total
return % GEL thousands unless otherwise noted 31-Dec-18 31-Dec-17 amount %
Listed portfolio companies 977,827 933,481 44,346 4.8% (637,781) -38.9%
GHG (75,118,503 shares) 57.0% 520,332 933,481 (413,149) -44.3% (413,148) -44.3%
BoG (9,784,716 shares) 19.9% 457,495 - 457,495 NMF (224,632) -31.8%
Private portfolio companies 905,547 917,380 (11,833) -1.3% (47,474) -5.2%
Late Stage 628,326 715,270 (86,944) -12.2% (40,792) -5.7%
Water Utility 100.0% 431,017 498,181 (67,164) -13.5% (38,324) -7.7%
Housing Development 100.0% 66,785 75,609 (8,824) -11.7% (1,512) -2.0%
P&C Insurance 100.0% 130,524 141,480 (10,956) -7.7% (956) -0.7%
Early Stage 271,288 202,110 69,178 34.2% (6,682) -3.3%
Renewable Energy 65.0% 61,182 51,511 9,671 18.8% 4,700 9.1%
Hospitality & Commercial 100.0% 149,079 78,142 70,937 90.8% 40,515 51.8%
Beverages 80.0% 61,027 72,457 (11,430) -15.8% (51,897) -71.6%
Pipeline (at cost) 5,933 - 5,933 NMF (432) NMF
Education 100.0% 7,071 - 7,071 NMF Other 100.0% (1,138) - (1,138) NMF
Total Portfolio Value 1,883,374 1,850,861 32,513 1.8% (685,688) -26.8%
Net Debt (196,915) (7,733) (189,182) NMF of which, Cash and Liquid Funds 299,650 264,546 35,104 13.3% of which, Loans Issued 305,480 - 305,480 NMF of which, Gross Debt (802,045) (272,279) (529,766) NMF Net Other Assets/ (Liabilities) 1,762 (2,681) 4,443 NMF Net Asset Value 1,688,221 1,840,447 (152,226) -8.3%
Shares outstanding 35,816,947 39,384,712 (3,567,765) -9.1% Net Asset Value per share (GEL) 47.13 46.73 0.40 0.9% Net Asset Value per share (GBP) 13.88 13.35 0.53 4.0%
NAV per share in GEL terms was up 0.9%, while total NAV decreased by 8.3% to GEL 1.7 billion at 31 December
2018 as a result of the following movements:
I. Listed portfolio companies - The value of holdings in listed portfolio companies increased with the
contribution of 19.9% BoG equity stake, valued at GEL 457 million at 31 December 2018, into the Group’s
equity as part of the demerger from BGEO Group. At the same time, the market value of our 57% equity
stake in GHG decreased by 44.3% y-o-y as a result of the weak market conditions.
Despite delivering a very strong operating performance in 2018 (y-o-y full year EBITDA up by 22.3%),
GHG’s share price retreated from GBP 3.55 at 31 December 2017 to GBP 2.04 at 31 December 2018
resulting in a GEL 413 million reduction in the market value of the Group’s holding. We did not sell any
GHG shares during 2018 as we believe that the stock price was highly undervalued.
Following the demerger completion, the BoG share price closed at GBP 18.64 on 29 May 2018, its first
trading day. The share price retreated in 2H18 and closed at GBP 13.77 on 31 December 2018 even
though the bank delivered a strong 26%+ ROAE. As a result, the market value of 19.9% equity stake in
BOG decreased by GEL 249 million during 2018. In July 2018, Georgia Capital received GEL 23.9 million
dividend payment from BoG and as a result, net market value change after dividends amounted to
negative GEL 225 million in 2018.
II. Private portfolio companies - The private portfolio companies continued to perform strongly in 2018,
however, valuations were unfavourably affected by negative trends in emerging and frontier markets.
Late stage businesses delivered negative 5.7% investment return, despite of the record-high GEL 49
million dividend inflows to GCAP on the back of their strong trading performances.
The early stage portfolio companies continued development to the next levels of their greenfield
lifecycles, delivering negative 3.3% return mainly as a result of the underperformance of the beer
business, which incurred a GEL 14 million EBITDA loss in 2018 and resulted in GEL 48.4 million mark
down in its fair value in 2018. The hospitality and commercial real estate business demonstrated
outstanding performance by earning 51.8% investment return driven by GEL 27.6 million revaluation
gains from hotels and commercial properties.

13
The table below summarizes total returns across our listed and private portfolio companies:
a) The 15% increase in Water Utility’s EBITDA created approximately GEL 102 million value, however, this
was more than offset by multiple contraction from 9.4 to 8.8 (GEL 48 million decrease) and net debt
widening of GEL 121 million. As a result, fair value decreased by GEL 67 million in 2018.
b) Housing Development’s fair value was down by GEL 8.8 million mainly on the back of net capital
distribution of GEL 7.3 million. FY18 net profit was at break-even level, amounting to GEL 0.4 million,
due to slow down in sales momentum driven by low levels of inventory.
c) For P&C Insurance the 8.8% increase in net income adjusted for demerger related non-recurring items
created a GEL 12 million value, however it was offset by multiple contraction from 8.7 to 7.4 (GEL 23
million decrease), leading to an overall fair value decrease by GEL 11 million.
d) The GEL 9.7 million increase in the fair value for Renewable Energy was mainly driven by GEL 5 million
capital allocation from Georgia Capital and by positive impact from exchange rate movements, as the
company assets are denominated in US Dollars.
e) Fair value of Hospitality & Commercial increased by GEL 70.9 million on the back of GEL 27.6 million
revaluation gains recorded on hotels and commercial properties and GEL 32.9 million capital allocation
from Georgia Capital in 2018.
f) Fair value decrease of GEL 11.4 million of Beverages was largely driven by beer business
underperformance, where GEL 14 million EBITDA loss in 2018 triggered a mark down of the beverage
business value by GEL 48.4 million. The decrease in value was partially offset by the wine business, where
the GEL 25.8 million increase in fair value was related to the capital allocations from Georgia Capital for
the acquisition of Kindzmarauli.
III. Net debt – The GEL 189.2 million increase in net debt resulted from:
a. Increase of GEL 529.8 million in Gross Debt (debt securities issued and borrowings). Georgia Capital
issued US$ 300 million 6.125% six-year Eurobonds due 2024 in March 2018 and raised US$ 291 million
(GEL 716 million) net proceeds, of which GEL 270 million was used to repay borrowing from the Group’s
previous parent company, BGEO Group. The outstanding balance of debt securities issued at 31
December 2018 was GEL 802 million.
12 Pro-forma beginning balance of BoG represents the contribution of BoG’s 19.9% equity stake, valued at GEL 706 million at the date of the contribution, into
Georgia Capital’s equity by its former parent company BGEO as part of the demerger. BGEO Group PLC is the predecessor of BoG. 13 GEL 2.5 million capital reallocation from the hospitality & commercial real estate business to the housing development business.
Business 31-Dec-17
Fair value
Fair value
change
31-Dec-18
Fair value
Capital
allocations
Inter-business
capital
reallocation12
Dividend
inflows Total return
Comment on
Fair value
Listed portfolio
companies 1,639,483 (661,656) 977,827 - - 23,875 (637,781)
GHG 933,481 (413,149) 520,332 - - - (413,149)
BoG12 706,002 (248,507) 457,495 - - 23,875 (224,632)
Private portfolio
companies 917,380 (17,766) 899,614 (78,338) - 48,629 (47,475)
Late stage 715,270 (86,944) 628,326 - (2,477) 48,629 (40,792)
Water Utility 498,181 (67,164) 431,017 - - 28,840 (38,324) Note a
Housing Development13 75,609 (8,824) 66,785 - (2,477) 9,789 (1,512) Note b
P&C Insurance 141,480 (10,956) 130,524 - - 10,000 (956) Note c
Early stage 202,110 69,178 271,288 (78,338) 2,477 - (6,683)
Renewable Energy 51,511 9,671 61,182 (4,971) - - 4,700 Note d
Hospitality & Commercial13 78,142 70,937 149,079 (32,899) 2,477 - 40,515 Note e
Beverages 72,457 (11,430) 61,027 (40,468) - - (51,898) Note f
of which, wine 34,520 22,251 56,771 (25,754) - - (3,503)
of which, beer 37,937 (33,681) 4,256 (14,714) - - (48,395)
Pipeline - 5,933 5,933 (6,365) - - (432)
Total 2,556,863 (673,489) 1,883,374 (84,703) - 72,504 (685,688)

14
b. Loans issued in the amount of GEL 305 million during 2018, primarily relate to three
facilities: (i) a GEL 104.6 million (US$ 39.1 million) loan to the hospitality & commercial real estate
business for on-going development, construction and growth of the hotel pipeline (ii) a GEL 46.1 million
(US$ 17.2 million) to the housing development business to refinance some of the existing borrowings
and (iii) a GEL 133.8 million (US$ 50 million) loan issued to the BoG holding company as part of the
demerger, maturing in March 2020. The loans are issued at market terms and interest income from
loans issued amounted to GEL 24.6 million in 2018, significantly up from GEL 0.2 million in 2017.
c. The increase of GEL 35 million in cash and liquid funds, amounting to GEL 299.7 million at 31
December 2018, is primarily driven by the proceeds from the milestone US$ 300 million 6-year bond
issuance. In line with its risk management practices, the Group actively monitors the allocation of its
liquid resources and its commitment to maintain at least US$ 50 million liquid funds. At 31 December
2018, cash and liquid funds were allocated as follows:
31 December 2018 31 December 2017 Change
Cash at bank 142,284 219,400 -35.1%
Internationally listed debt securities 129,295 24,136 NMF
Locally listed debt securities 28,071 21,010 33.6%
Total Cash and liquid funds 299,650 264,546 13.3%
Internationally listed debt securities include Eurobonds issued by Georgian corporates (GEL 102 million)
and sovereign Georgian Eurobonds (GEL 27 million). Locally listed debt securities are local bonds issued
by Georgian corporates, which are listed and traded on the Georgian Stock Exchange. Interest income
from cash and liquid funds amounted to GEL 15.0 million in 2018, up from GEL 1.2 million in 2017.
d. During 2018 Georgia Capital deployed cash for share buybacks of GEL 87.4 million, of which
management trust purchases were GEL 42.6 million and GEL 44.8 million was bought back as part of
the US$45 million share buyback programme.
15
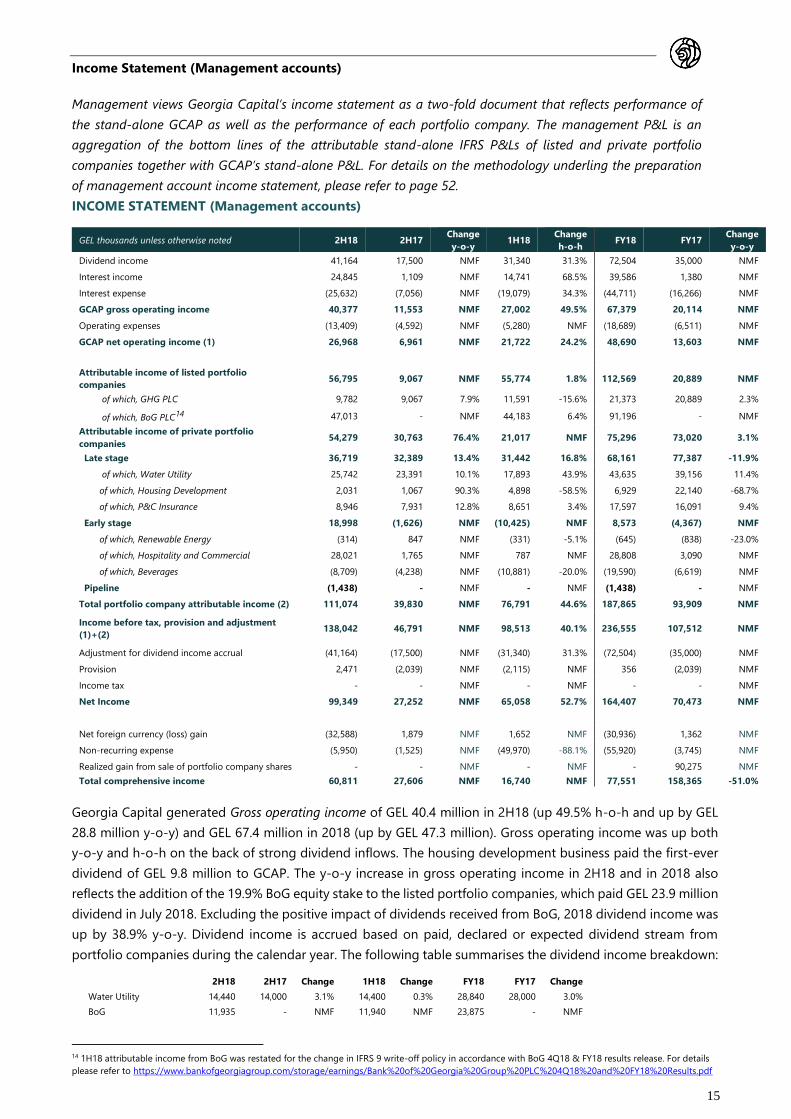
Income Statement (Management accounts)
Management views Georgia Capital’s income statement as a two-fold document that reflects performance of
the stand-alone GCAP as well as the performance of each portfolio company. The management P&L is an
aggregation of the bottom lines of the attributable stand-alone IFRS P&Ls of listed and private portfolio
companies together with GCAP’s stand-alone P&L. For details on the methodology underling the preparation
of management account income statement, please refer to page 52.
INCOME STATEMENT (Management accounts)
GEL thousands unless otherwise noted 2H18 2H17 Change
y-o-y 1H18
Change
h-o-h FY18 FY17
Change
y-o-y
Dividend income 41,164 17,500 NMF 31,340 31.3% 72,504 35,000 NMF
Interest income 24,845 1,109 NMF 14,741 68.5% 39,586 1,380 NMF
Interest expense (25,632) (7,056) NMF (19,079) 34.3% (44,711) (16,266) NMF
GCAP gross operating income 40,377 11,553 NMF 27,002 49.5% 67,379 20,114 NMF
Operating expenses (13,409) (4,592) NMF (5,280) NMF (18,689) (6,511) NMF
GCAP net operating income (1) 26,968 6,961 NMF 21,722 24.2% 48,690 13,603 NMF
Attributable income of listed portfolio
companies 56,795 9,067 NMF 55,774 1.8% 112,569 20,889 NMF
of which, GHG PLC 9,782 9,067 7.9% 11,591 -15.6% 21,373 20,889 2.3%
of which, BoG PLC14 47,013 - NMF 44,183 6.4% 91,196 - NMF
Attributable income of private portfolio
companies 54,279 30,763 76.4% 21,017 NMF 75,296 73,020 3.1%
Late stage 36,719 32,389 13.4% 31,442 16.8% 68,161 77,387 -11.9%
of which, Water Utility 25,742 23,391 10.1% 17,893 43.9% 43,635 39,156 11.4%
of which, Housing Development 2,031 1,067 90.3% 4,898 -58.5% 6,929 22,140 -68.7%
of which, P&C Insurance 8,946 7,931 12.8% 8,651 3.4% 17,597 16,091 9.4%
Early stage 18,998 (1,626) NMF (10,425) NMF 8,573 (4,367) NMF
of which, Renewable Energy (314) 847 NMF (331) -5.1% (645) (838) -23.0%
of which, Hospitality and Commercial 28,021 1,765 NMF 787 NMF 28,808 3,090 NMF
of which, Beverages (8,709) (4,238) NMF (10,881) -20.0% (19,590) (6,619) NMF
Pipeline (1,438) - NMF - NMF (1,438) - NMF
Total portfolio company attributable income (2) 111,074 39,830 NMF 76,791 44.6% 187,865 93,909 NMF
Income before tax, provision and adjustment
(1)+(2) 138,042 46,791 NMF 98,513 40.1% 236,555 107,512 NMF
Adjustment for dividend income accrual (41,164) (17,500) NMF (31,340) 31.3% (72,504) (35,000) NMF
Provision 2,471 (2,039) NMF (2,115) NMF 356 (2,039) NMF
Income tax - - NMF - NMF - - NMF
Net Income 99,349 27,252 NMF 65,058 52.7% 164,407 70,473 NMF
Net foreign currency (loss) gain (32,588) 1,879 NMF 1,652 NMF (30,936) 1,362 NMF
Non-recurring expense (5,950) (1,525) NMF (49,970) -88.1% (55,920) (3,745) NMF
Realized gain from sale of portfolio company shares - - NMF - NMF - 90,275 NMF
Total comprehensive income 60,811 27,606 NMF 16,740 NMF 77,551 158,365 -51.0%
Georgia Capital generated Gross operating income of GEL 40.4 million in 2H18 (up 49.5% h-o-h and up by GEL
28.8 million y-o-y) and GEL 67.4 million in 2018 (up by GEL 47.3 million). Gross operating income was up both
y-o-y and h-o-h on the back of strong dividend inflows. The housing development business paid the first-ever
dividend of GEL 9.8 million to GCAP. The y-o-y increase in gross operating income in 2H18 and in 2018 also
reflects the addition of the 19.9% BoG equity stake to the listed portfolio companies, which paid GEL 23.9 million
dividend in July 2018. Excluding the positive impact of dividends received from BoG, 2018 dividend income was
up by 38.9% y-o-y. Dividend income is accrued based on paid, declared or expected dividend stream from
portfolio companies during the calendar year. The following table summarises the dividend income breakdown:
2H18 2H17 Change 1H18 Change FY18 FY17 Change
Water Utility 14,440 14,000 3.1% 14,400 0.3% 28,840 28,000 3.0%
BoG 11,935 - NMF 11,940 NMF 23,875 - NMF
14 1H18 attributable income from BoG was restated for the change in IFRS 9 write-off policy in accordance with BoG 4Q18 & FY18 results release. For details
please refer to https://www.bankofgeorgiagroup.com/storage/earnings/Bank%20of%20Georgia%20Group%20PLC%204Q18%20and%20FY18%20Results.pdf

16
P&C Insurance 5,000 3,500 42.9% 5,000 NMF 10,000 7,000 42.9%
Housing Development 9,789 - NMF - NMF 9,789 - NMF
Total dividend income 41,164 17,500 NMF 31,340 31.3% 72,504 35,000 NMF
The significant increase in both Interest income and Interest expense in 2H18 and 2018 was driven by the issuance
of the inaugural US$ 300 million bonds and investment of related proceeds into investment securities and loans
issued. Georgia Capital earned an average yield of 7.7% on the liquid assets and issued loans, of which 9.8%
was earned on the loans issued and 5.1% on the liquid funds. The coupon on the $300 million bond is 6.125%.
The components of GCAP’s Operating expenses for both 2H18 and in 2018, are presented in the table below:
Following the demerger from the BGEO Group, administrative and management expenses are now fully borne
by the Group, while prior to the demerger (before 29 May 2018) only a portion of the expenses were allocated
to the Group. As a result, operating expenses are not directly comparable h-o-h and y-o-y. GCAP operating
expenses have a targeted cap of 2% of Georgia Capital’s market capitalisation. 2018 operating expenses were
only 1.4% of market capitalisation at 31 December 2018 given the start-up year effect.
Total portfolio company attributable income increased from GEL 39.8 million in 2H17 to 76.8 million in 1H18 and
to GEL 111.1 million in 2H18, while it doubled y-o-y from GEL 93.9 million to GEL 187.9 million in 2018. However,
2017 and 2018 are not directly comparable since BoG’s attributable income is not reflected in 2017, while it
added GEL 47.0 million in 2H18 and GEL 91.2 million in 2018. Excluding BoG attributable profit, portfolio company
attributable income was up 60.8% y-o-y in 2H18. The 60.8% (GEL 24 million) y-o-y increase in 2H18 in total
portfolio company attributable income excluding BoG was mainly driven by GEL 27.6 million revaluation gains
from the hospitality & commercial real estate business, which were partly offset by different developments in the
other private portfolio businesses discussed below. In addition, 1H17 was positively affected by a similar
revaluation gain, and as a result, total portfolio company attributable income excluding BoG was up only 2.9%
y-o-y in 2018.
GHG’s attributable income was up 7.9% y-o-y in 2H18 and up 2.3% y-o-y in 2018. The 2.3% y-o-y growth in 2018
reflects the impact of the sell down of a 7% equity stake by Georgia Capital in May 2017, which reduced the
portion of attributable net income on y-o-y basis. Had we not reduced our stake in GHG, related attributable
income would have increased by 8.3%. GHG’s attributable income decreased by 15.6% h-o-h in 2H18 due to net
foreign currency losses, while GHG continued to deliver on its strategic priorities leading to 22.2% y-o-y and 11.2%
h-o-h growth in EBITDA to GEL 69.6 million during the second half of 2018. GHG achieved a record full year
EBITDA of GEL 132.3 million (up 22.3% y-o-y), as GHG has started to capture benefits from major investments
in 2016 and 2017. GHG’s strong performance also resulted in 13.9% adjusted ROIC for roll-outs in 2018 (up
110bps y-o-y). The performance of GHG, in which we continue to hold a 57% stake, is discussed in more details
on pages 34 to 35.
Attributable income of BoG was GEL 47.0 million during the second half of 2018 and GEL 91.2 million on a full-
year basis driven by its strong performance across corporate and retail businesses as business momentum
continues to accelerate in Georgia, while cost of risk remained well-contained at 1.6% in 2018 down from 2.2%
in 2017. BoG successfully delivered on its strategy, with adjusted ROAE of 26.1% in 2018, well above the targeted
through-the-cycle ROAE of 20%+. On 9 July 2018, BoG declared a dividend in respect of 2017 year of GEL 2.44
per ordinary share (c.30% payout ratio), which was paid to its ordinary shareholders on 31 July 2018. The Group
received a GBP 7.4 million (GEL 23.9 million) dividend payment from BoG. In 4Q18 & FY18 earnings release BoG
15Includes expenses such as external audit fees, legal counsel, corporate secretary and other similar administrative costs. 16Cash-based management expenses are cash salary and cash bonuses paid/accrued for staff and management compensation. 17Share-based management expenses are share salary and share bonus expenses of management.
2H18 2H17 Change 1H18 Change FY18 FY17 Change
Administrative expenses15 (4,854) (861) NMF (862) NMF (5,717) (1,056) NMF
Management expenses - cash-based16 (3,555) (35) NMF (1,777) NMF (5,331) (76) NMF
Management expenses - share-based17 (5,000) (3,696) 35.3% (2,641) 89.3% (7,641) (5,379) 42.1%
Total operating expenses (13,409) (4,592) NMF (5,280) NMF (18,689) (6,511) NMF

17
recommended an annual dividend for 2018 of GEL 2.55 per share subject to shareholders approval.
This represents a payout ratio of 30% and a 4.5% increase over last year’s dividend. GCAP is expected to receive
a GEL 25 million dividend inflow from BoG in 2019. Please refer to Bank of Georgia Group’s 4Q18 & FY18 earnings
release for further details at http://bankofgeorgiagroup.com/.
Attributable income from private portfolio companies in 2H18 increased significantly both y-o-y and h-o-h, while
it increased by a more modest 3.1% y-o-y to GEL 75.3 million in 2018.
Late stage portfolio companies demonstrated positive performance in their recurring businesses in 2018. In the
housing development business, excluding the GEL 21 million commercial property revaluation gains in 1H17
attributable income was up in 2018, even though the overall sales momentum in 2018 was hurt by low inventory
levels due to the delay in the process of receiving new construction permits; Attributable income from the water
utility business was up by double digits despite extraordinarily lower precipitation related water inflows to
Zhinvali HPP. P&C insurance made steady progress. The 11.9% y-o-y decline in the attributable income from
private late stage businesses in 2018 is entirely attributable to the absence of the revaluation gains in Housing
Development.
Early stage businesses continued development to the next levels of their greenfield lifecycle and related
attributable income was GEL 19.0 million in 2H18 (up from negative GEL 1.6 million in 2H17 and up from negative
GEL 10.4 million in 1H18) and GEL 8.6 million in 2018, which was driven by GEL 27.6 million revaluation gain
booked in 2H18 on two under construction and one operational hotel and on rent-generating assets within the
hospitality & commercial real estate business. The revaluation gain was partially offset by the beverages business,
which recorded GEL 19.2 million loss in 2H18 and GEL 29.2 million loss on stand-alone basis in 2018 due to the
delays in introduction of branded beers from the Heineken portfolio.
The performance of each private portfolio company is discussed on pages 22 to 35.
Net income of GEL 99.3 million in 2H18 and GEL 164.4 million in 2018 reflects the elimination of the dividend
accrual from the GCAP attributable income of portfolio companies to avoid double-counting and a provision on
our mezzanine loans to portfolio companies.
The Group’s total comprehensive income is then driven by net foreign currency loss/(gain), non-recurring expense
and realized gains from the sale of portfolio company shares. Other comprehensive income decreased from GEL
87.9 million in 2017 to GEL 86.9 million loss in 2018. The following table summarises the breakdown of other
comprehensive income components: 2H18 2H17 Change 1H18 Change FY18 FY17 Change
Net foreign currency (loss) gain (32,588) 1,879 NMF 1,652 NMF (30,936) 1,362 NMF
Non-recurring expense (5,950) (1,525) NMF (49,970) -88.1% (55,920) (3,745) NMF
Realized gain from sale portfolio company shares - - NMF - NMF - 90,275 NMF
Other comprehensive income (38,538) 354 NMF (48,318) -20.2% (86,856) 87,892 NMF
The Group incurred net foreign currency loss of GEL 30.9 million in 2018 from USD/GEL and EUR/GEL exchange
rate volatility at GCAP level and across its Water Utility and Beverages businesses. GCAP’s GEL 24.8 million net
foreign currency loss in 2018 was mostly related to USD/GEL exchange rate volatility, since GCAP has accounting
short foreign currency position in US Dollars amounting to c. US$ 97.5 million (GEL 261 million) at 31 December
2018.
Non-recurring expenses in 2018 of GEL 55.9 million are not comparable to the GEL 3.7 million figure in 2017.
2018 Non-recurring expenses largely relate to the demerger from BGEO Group, which triggered recognition of
fees for services received in connection with the demerger and acceleration of share-based compensation
expenses for accounting purposes. GCAP’s GEL 23.4 million non-recurring expense was entirely related to the
demerger. The following table summarises the breakdown of non-recurring expenses:
2H18 2H17 Change 1H18 Change FY18 FY17 Change
GCAP 119 - NMF (23,568) NMF (23,449) - NMF
Listed portfolio companies (2,362) (884) NMF (14,760) -84.0% (17,122) (2,995) NMF
Private portfolio companies (3,708) (641) NMF (11,641) -68.1% (15,349) (750) NMF
Total non-recurring expenses (5,950) (1,525) NMF (49,970) -88.1% (55,920) (3,745) NMF
18
The realised gain from sale of portfolio company shares of GEL 90 million in 1H17 resulted from the
sale of 9.5 million shares of GHG (7.2%) by Georgia Capital in May 2017 for US$ 40 million cash proceeds, which
decreased its stake in GHG to 57%. Georgia Capital did not sell any shares of its portfolio companies during
2018.
In line with the European Securities and Markets Authority (“ESMA”) guidelines about the use of
alternative performance measures (APMs) in the preliminary announcement, we discuss below the
reconciliation of net income under management accounts with IFRS consolidated results.
FY18 net income under IFRS consolidated income statement was GEL 16.9 million as compared to net income
under management accounts of GEL 164.4 million. The following items explain the drivers of differences between
the two metrics:
a) BOG attributable income – IFRS consolidated financial statements include dividends declared and paid
by BOG of GEL 23.9 million, while net income under management accounts include consolidation of
attributable 19.9% of BOG’s net profit of GEL 91 million, adjusted to exclude the impact of non-
recurring items.
b) Revaluation of Hotels - revaluation gain of GEL 25.8 million is recorded within Hospitality & Commercial
Real Estate business net income within management accounts, while under IFRS consolidated income
statement hotels are carried at cost and no revaluation gains or losses are recognized.
c) Non-recurring items and FX gains and losses - GEL 31 million loss from foreign currency movements
and GEL 56 million non-recurring expenses are reflected under IFRS consolidated income statement
before arriving to net income, while under management accounts they are included below net income
line and within other comprehensive income.
Apart from the items noted above, the income statement under management accounts mainly mirrors IFRS
consolidated income statement and the performance of the underlying businesses as described above. IFRS
results of each portfolio business together with management commentary are discussed on pages 22 to 35. A
detailed reconciliation of our management income statement to the IFRS consolidated income statement is
provided on page 36.
19
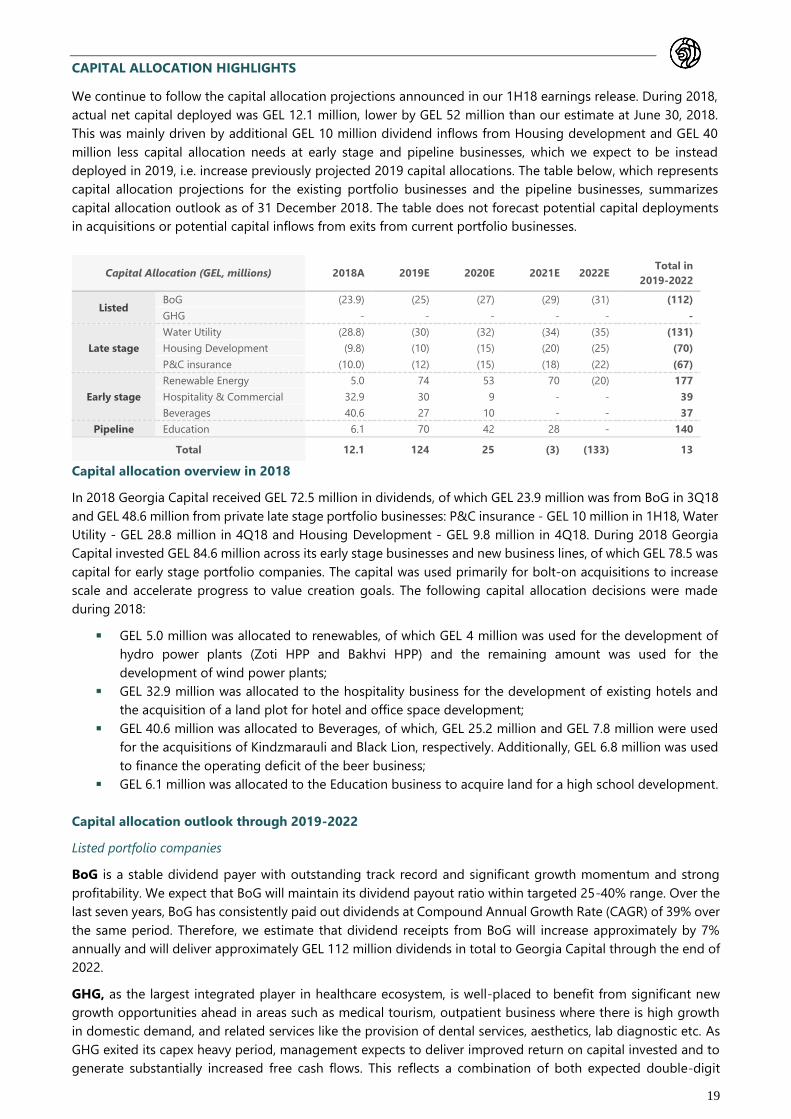
CAPITAL ALLOCATION HIGHLIGHTS
We continue to follow the capital allocation projections announced in our 1H18 earnings release. During 2018,
actual net capital deployed was GEL 12.1 million, lower by GEL 52 million than our estimate at June 30, 2018.
This was mainly driven by additional GEL 10 million dividend inflows from Housing development and GEL 40
million less capital allocation needs at early stage and pipeline businesses, which we expect to be instead
deployed in 2019, i.e. increase previously projected 2019 capital allocations. The table below, which represents
capital allocation projections for the existing portfolio businesses and the pipeline businesses, summarizes
capital allocation outlook as of 31 December 2018. The table does not forecast potential capital deployments
in acquisitions or potential capital inflows from exits from current portfolio businesses.
Capital allocation overview in 2018
In 2018 Georgia Capital received GEL 72.5 million in dividends, of which GEL 23.9 million was from BoG in 3Q18
and GEL 48.6 million from private late stage portfolio businesses: P&C insurance - GEL 10 million in 1H18, Water
Utility - GEL 28.8 million in 4Q18 and Housing Development - GEL 9.8 million in 4Q18. During 2018 Georgia
Capital invested GEL 84.6 million across its early stage businesses and new business lines, of which GEL 78.5 was
capital for early stage portfolio companies. The capital was used primarily for bolt-on acquisitions to increase
scale and accelerate progress to value creation goals. The following capital allocation decisions were made
during 2018:
▪ GEL 5.0 million was allocated to renewables, of which GEL 4 million was used for the development of
hydro power plants (Zoti HPP and Bakhvi HPP) and the remaining amount was used for the
development of wind power plants;
▪ GEL 32.9 million was allocated to the hospitality business for the development of existing hotels and
the acquisition of a land plot for hotel and office space development;
▪ GEL 40.6 million was allocated to Beverages, of which, GEL 25.2 million and GEL 7.8 million were used
for the acquisitions of Kindzmarauli and Black Lion, respectively. Additionally, GEL 6.8 million was used
to finance the operating deficit of the beer business;
▪ GEL 6.1 million was allocated to the Education business to acquire land for a high school development.
Capital allocation outlook through 2019-2022
Listed portfolio companies
BoG is a stable dividend payer with outstanding track record and significant growth momentum and strong
profitability. We expect that BoG will maintain its dividend payout ratio within targeted 25-40% range. Over the
last seven years, BoG has consistently paid out dividends at Compound Annual Growth Rate (CAGR) of 39% over
the same period. Therefore, we estimate that dividend receipts from BoG will increase approximately by 7%
annually and will deliver approximately GEL 112 million dividends in total to Georgia Capital through the end of
2022.
GHG, as the largest integrated player in healthcare ecosystem, is well-placed to benefit from significant new
growth opportunities ahead in areas such as medical tourism, outpatient business where there is high growth
in domestic demand, and related services like the provision of dental services, aesthetics, lab diagnostic etc. As
GHG exited its capex heavy period, management expects to deliver improved return on capital invested and to
generate substantially increased free cash flows. This reflects a combination of both expected double-digit
Capital Allocation (GEL, millions) 2018A 2019E 2020E 2021E 2022E Total in
2019-2022
Listed BoG (23.9) (25) (27) (29) (31) (112)
GHG - - - - - -
Late stage
Water Utility (28.8) (30) (32) (34) (35) (131)
Housing Development (9.8) (10) (15) (20) (25) (70)
P&C insurance (10.0) (12) (15) (18) (22) (67)
Early stage
Renewable Energy 5.0 74 53 70 (20) 177
Hospitality & Commercial 32.9 30 9 - - 39
Beverages 40.6 27 10 - - 37
Pipeline Education 6.1 70 42 28 - 140
Total 12.1 124 25 (3) (133) 13

20
compound annual growth in revenues and reduced investment requirements over the next few years.
As GHG continues to mature, we expect it to adopt a capital return policy. Until GHG adopts such policy, we
conservatively estimate no dividend income from GHG through the end of 2022.
Private portfolio companies: Late Stage
Water Utility is a stable dividend paying business with no additional equity capital or material debt capital
needs. The water utility business paid GEL 29 million dividend in 2018 and we forecast approximately 5% CAGR
in the water utility business dividend growth through the end of 2022 driven by higher energy efficiency, a key
driver of future dividend growth potential, and overall growth in water consumption as the economy continues
to grow. We estimate GEL 131 million dividend cash flow from Water Utility through the end of 2022.
Housing Development paid its first dividend of GEL 10 million in 2018 on the back of previously accumulated
cash flows from successfully executed residential projects and confirmed outlook as a result of construction
permits received at year-end. We had not estimated dividend inflows from Housing Development in 2018. As
the business matures and continues transition into a real estate asset manager business model, we expect it to
continue returning money through a combination of dividends and capital returns. Given the strong platform
and brand name, Housing Development is well-placed to benefit from the continued growth in demand for
private housing as the country’s wealth grows. The housing development business does not have any additional
equity capital needs through the end of 2022 as it has developed a leading real estate developer platform in
Georgia. Housing Development mostly finances its projects through pre-sales. Debt capital needs are specific
to individual projects and could appear for short-term periods only. Given the Housing Development’s strong
project pipeline and outstanding project execution skills, we estimate dividend inflow to remain at the same
level of GEL 10 million in 2019, followed by an annual payout increase of GEL 5 million going forward, or GEL 70
million through the end of 2022.
Property & Casualty Insurance is yet another business with strong dividend payout track record and potential
for growth as the insurance market remains highly underpenetrated in Georgia. Aldagi paid a GEL 7 million
dividend in 2017, which grew by 43% to GEL 10 million in 2018 on the back of a strong growth in the bottom
line. Given the business’ strong track record and high growth potential we have estimated GEL 12 million
dividend payout in 2019, which is expected to grow to GEL 22 million in 2022. Property & Casualty Insurance
does not have needs for any additional equity capital or debt capital.
Private portfolio companies: Early Stage
Renewable Energy (65% ownership) has a medium-term target of 500MW operating power generation
capacity, including the existing 152MW HPP of the water utility business. Energy consumption is forecasted to
increase at least by 5% CAGR over the next fifteen years, driven by economic growth. The business currently has
a 410MW pipeline in place, where it estimates GEL 177 million equity capital needs from Georgia Capital (i.e.
65% of the total equity capital needs) and GEL 968 million debt capital needs through 2022 based on the
targeted average 70%:30% debt to equity leverage ratio.
Hospitality & Commercial Real Estate capital needs are estimated based on the 1,000 hotel room target on
the back of projected double-digit growth in tourist inflows over the coming years. The business currently has
152 operational hotel rooms and 969 hotel rooms in its pipeline. In order to reach 1,000 fully operational hotel
rooms within three years, the hospitality business needs a further GEL 39 million equity capital injection and GEL
186 million in debt capital. We target a 70%:30% debt to equity leverage ratio at hotels.
Beverages. The wine business is targeting 1,000 hectares of vineyards from the current 436 hectares to support
the growing demand from export markets for Georgian wine. The beer business has launched the beer factory
and is in process of launching additional beer brands to increase the product offering to tap the expected growth
in low beer consumption levels of 27.5 liters per capita. As a result, the beverages business requires
approximately GEL 37 million equity capital and GEL 67 million debt capital to finance its planned growth
through 2020 and beyond.
Private portfolio companies: Pipeline Stage
Education. We have identified education as an attractive fragmented service industry with high growth potential
driven by increased demand for quality education and low government spending. We expect to deploy GEL 140
million in equity capital, while the business will raise GEL 120 million in debt capital. Capital deployment will

21
happen gradually over the next four to five years and by 2025 we expect the business to reach 30,000
pupils and to become the largest chain of affordable schools in Georgia.
Overall, based on the estimated dividend inflows, which do not include any dividend inflows from GHG, we
continue to expect to collect sufficient cash inflows through the end of 2022 to accommodate the equity capital
needs of early stage and pipeline stage portfolio companies during the same period. 2019 is a net equity capital
investment year for Georgia Capital, followed by relatively neutral 2020 and 2021, while in 2022 we expect net
equity capital returns from portfolio companies. Based on this outlook, and together with the available GEL 605
million funds at GCAP (liquid funds and issued loans) at 31 December 2018, we remain well-positioned to
support the value creation across our private portfolio businesses and take advantage of new opportunities
meeting our stringent acquisition criteria as and when they arise.
RETURN ON ALLOCATED CAPITAL
We use the Management Account figures to calculate Return on Allocated Capital (ROAC), a metric that provides
us with a visibility into returns on current management values for each portfolio company.
ROAC is an annual return on allocated capital as of 31 December 2018 and calculated at each private investment
level. Inputs into the ROAC calculation are as follows: (i) the numerator is an annual attributable income of the
private portfolio company, less allocated GCAP interest expense, and (ii) the denominator is the management
estimated fair value, as included in the NAV statement, less allocated gross debt of GCAP.
Listed Portfolio Companies
Internal Rate of Return Holding period
(years) 31 December 2018
Listed portfolio companies 39.8%
GHG 6.1 41.9%
BoG 10.1 25.8%
Private Businesses
Return on Allocated Capital Holding period
(years) 2018
Private portfolio companies, late stage 13.4%
Water Utility 2.8 12.3%
Housing Development 7.7 12.7%
P&C Insurance 9.1 17.2%
Private portfolio companies, early stage 2.0%
Renewable Energy 1.6 -4.2%
Hospitality & Commercial real estate 2.1 25.9%
Beverages 2.2 -50.0%
22
Investment rationale ▪ Natural monopoly in Tbilisi and surrounding district
▪ Utilities sector represents 3% of total Georgian economic output with c. 8.2% CAGR (2006-2017)
▪ Stable regulatory environment with fair return on investment
▪ Stable cash collection rates
Value creation potential ▪ EU harmonization reforms in progress in utilities sector in accordance with Georgia’s undertaking
under the Association Agreement with the EU, expected to drive water tariffs up
▪ High GDP growth combined with rapid tourism growth drive high demand from corporates
▪ Energy market deregulation expected to positively affect electricity sales price
▪ Upside opportunity from pursuing cost efficiencies by targeting decrease in self-consumption of
electricity in order to free up energy for third party electricity sales
▪ Growing dividend payment capacity
Value realisation outlook
IPO together with the renewable energy business
2H18 and FY18 performance
Positive operating leverage supports EBITDA margin expansion in 2018
GEL thousands, unless otherwise noted
INCOME STATEMENT HIGHLIGHTS 2H18 2H17 Change 1H18 Change FY18 FY17 Change
Revenue 79,295 74,419 6.6% 69,832 13.6% 149,127 135,000 10.5%
Water supply 70,062 63,924 9.6% 61,752 13.5% 131,814 118,904 10.9%
Energy 4,330 6,661 -35.0% 4,722 -8.3% 9,052 9,755 -7.2%
Other 4,903 3,834 27.9% 3,358 46.0% 8,261 6,341 30.3%
Operating expenses (31,157) (32,395) -3.8% (29,578) 5.3% (60,735) (60,752) -0.03%
Provision for doubtful trade receivables (2,011) (550) NMF (3,022) -33.5% (5,033) (1,675) NMF
EBITDA 46,127 41,474 11.2% 37,232 23.9% 83,359 72,573 14.9%
EBITDA margin 58.2% 55.7% 53.3% 55.9% 53.8%
Depreciation and amortization (13,308) (10,393) 28.0% (12,085) 10.1% (25,393) (20,213) 25.6%
Net interest expense (7,077) (7,283) -2.8% (7,253) -2.4% (14,330) (12,408) 15.5%
Net non-recurring expenses (637) (884) -27.9% (5,484) -88.4% (6,121) (1,135) NMF
Net profit4 15,745 21,951 -28.3% 16,800 -6.3% 32,545 37,401 -13.0%
CASH FLOW HIGHLIGHTS 2H18 2H17 Change 1H18 Change FY18 FY17 Change
Cash flow from operating activities
before maintenance capex 50,998 41,049 24.2% 30,592 66.7% 81,590 70,150 16.3%
Maintenance capex (10,096) (9,002) 12.2% (12,444) -18.9% (22,540) (23,203) -2.9%
Cash flow from operating activities 40,902 32,047 27.6% 18,148 NMF 59,050 46,947 25.8%
Cash flow used in investing activities (61,182) (74,486) -17.9% (63,910) -4.3% (125,092) (105,024) 19.1%
Development capex (71,383) (77,810) -8.3% (77,070) -7.4% (148,453) (113,605) 30.7%
Cash flow from financing activities 2,572 69,477 -96.3% 16,728 -84.6% 19,300 88,163 -78.1%
Net Proceeds from borrowings 43,663 110,226 -60.4% 27,225 60.4% 70,888 134,179 -47.2%
Dividends paid out (28,840) (28,244) 2.1% - NMF (28,840) (28,244) 2.1%
Cash ending balance 13,713 61,963 -77.9% 30,475 -55.0% 13,713 61,963 -77.9%
BALANCE SHEET HIGHLIGHTS Dec-18 Dec-17 Change
Total assets 639,267 567,936 12.6%
Property, plant and equipment 586,207 441,556 32.8%
Trades and other receivables 19,657 23,738 -17.2%
Cash balance 13,713 61,963 -77.9%
Total liabilities 368,781 300,150 22.9%
Total equity 270,486 267,786 1.0%
INCOME STATEMENT HIGHLIGHTS
The Water Utility’s 2H18 revenues were up 6.6% y-o-y and 13.6% h-o-h, and FY18 revenues were up 10.5%
over 2017 on the back of the strong performance of the water supply business.
Revenue from water supply to legal entities and individuals (2H18 up 9.6% y-o-y and 13.5% h-o-h and FY18 up
10.9% over 2017) benefitted from increases for both legal entities and individuals. Revenue from water supply
to legal entities increased 7.3% y-o-y to GEL 92.2 million in 2018 reflecting strong business activity across
various industries, while an 18.8% h-o-h increase to GEL 50.1 million was also positively affected by seasonality
in water consumption. Revenue from Water supply to individuals increased 20.2% y-o-y to GEL 39.6 million in
2018. Most of the increase is attributable to the increased residential tariff effective from 1 January 2018. New
connections, which more than doubled from 2,347 in 2017 to 5,015 in 2018, also contributed to the increase in
water supply revenues.
2H18 energy revenue was down 35.0% y-o-y and 8.3% h-o-h and FY18 revenue was down 7.2% over 2017. The
decrease in revenues from electricity power sales is attributable to extraordinarily lower than average
precipitation related water inflows to Zhinvali HPP, partly offset by significant savings in the Water Utility’s self-
consumption of electricity, which decreased by 21.0% to 116,703 thousand kwh in 2H18 and by 18.4% to
237,145 thousand kwh in 2018. 2H18 other income was up 27.9% y-o-y and 46.0% h-o-h and FY18 other income
was up 30.3% over 2017. The increase mainly reflects higher number of fines charged on illegal connections
amounting to GEL 0.6 million in 2H18 and GEL 1.7 million in 2018.
Our Water Utility is a natural monopoly in Tbilisi
and the surrounding area, where it provides water
and wastewater services to 1.4 million residents
representing more than one-third of Georgia’s
population and c. 33,000 legal entities. Water
Utility also operates hydro power plants with total
installed capacity of 152 MW.
Water Utility is 100% owned through GGU.
GEL millions, unless otherwise noted
Key Highlights 2018 2017 change
Revenue 149.1 135.0 10.5%
EBITDA 83.4 72.6 14.9%
Development capex1 148.5 113.6 30.7%
Maintenance capex1 22.5 23.2 -2.9%
FCF (66.0) (58.1) -13.7%
Cash from operations 81.6 70.2 16.3%
Net debt 306.5 185.4 65.3%
Key performance metrics
Net investment 157.4
2018 dividend 28.8
ROIC2 10.3%
(1) Capex figures are stated including VAT.
(2) Please see definition on page 53.
Capital Outlook through 2022
Capital needs3 70.8
of which, equity -
of which, debt 70.8
(3) Gross capital needs, excluding dividend distribution.
(4) Please refer to page 38 for the reconciliation of FY18
stand-alone Water Utility net income to the attributable
income from Water Utility as reported under the
management account income statement on page 15.
1. Water Utility (100% ownership)
Business description

23
2H18 operating expenses were down 3.8% y-o-y and up 5.3% h-o-h and FY18 operating expenses were flat. This reflects the
efficient cost management and continued rehabilitation works, resulting in significant cost savings in infrastructure assets maintenance
expenses and raw materials. Overall, in 2018 operating leverage was positive at 10.5 percentage points.
The increase in the provision for doubtful trade receivables to GEL 5.0 million in 2018 was primarily driven by the adoption of IFRS 9.
IFRS 9 introduced a forward-looking expected credit loss (ECL) approach effective from 1 January 2018, which is intended to result in an
earlier recognition of credit losses based on an ECL impairment approach, compared with the previous incurred-loss impairment
approach for financial instruments under IAS 39. Provision for doubtful trade receivables was down 33.5% h-o-h due to seasonally high
collection rates in the second half of the year.
The strong increase in water supply revenues coupled with the efficient cost management led to 11.2% y-o-y increase in EBITDA to GEL
46.1 million and to 14.9% y-o-y increase to GEL 83.4 million, respectively in 2H18 and in 2018.
Net interest expense was up 15.5% y-o-y in 2018 due to increased leverage obtained through international financial institutions and
local banks to finance capital expenditures and refinance more expensive and short-term funding. Net non-recurring expenses increased
in 2018 due to the acceleration of share-based payment expense recognition following Georgia Capital’s demerger from BGEO Group
in May 2018. Foreign exchange losses in 2018 reflect the accounting impact from Georgian Lari’s depreciation against the Euro as part
of GGU’s outstanding borrowings are denominated in Euros and GGU recorded losses in 2018 on its unhedged short position of GEL
131 million in Euros at 31 December 2018.
As a result, Water Utility profit was GEL 15.7 million in 2H18 (down 28.3% y-o-y and down 6.3% h-o-h) and GEL 32.5 million in 2018,
down 13.0% y-o-y.
BALANCE SHEET HIGHLIGHTS
The 32.8% increase in property, plant and equipment in 2018, was primarily due to development works on Water Utility infrastructure
carried out during the year in order to upgrade the network. Additionally, GEL 45.6 million of the increase in FY18 is driven by
rehabilitation works at the Gardabani wastewater treatment plant, which went through a major rehabilitation after c. 30 years of
operation, and since July 2018 has been fully functional, servicing the whole population in Tbilisi and surrounding area. Total capex for
Gardabani wastewater treatment plant rehabilitation was in line with the estimated GEL 60 million.
2017 and 2018 were capital-intensive years for the water utility business. Efficiency programs, such as upgrade of water and wastewater
network, purchase of heavy machinery and metering of residential and commercial customers, will have a dual effect of reducing own
electricity consumption and increasing third party electricity sales. Additionally, regulated CAPEX is included in Regulated Asset Base,
used by the regulator to calculate fair return on investment. For the regulatory period 2018-2020, such return on investment (referred
to as WACC in the tariff-setting methodology) is set at 15.99% (up from 13.54% in 2017). Capital expenditure level is expected to
decrease in 2019 and gradually reach long-term run-rate level of c. GEL 52-70 million by 2022. The table below summarizes capex
forecast through 2022:
GEL millions 2018A 2019F 2020F 2021F 2022F
Maintenance capex 23 23 23 23 22
Development capex 148 65-75 45-58 35-50 30-48
Total capital expenditures, including VAT 171 88-98 68-81 58-73 52-70
The increase in total liabilities is due to increased borrowings obtained from international financial institutions and local banks at the
end of 2017 to support capital expenditures for development of water supply network. During 2017, GGU secured long-term financing
of EUR 81.5 million from international financial institutions (IFIs) for efficiency-related capital expenditure purposes, namely from
European Investment Bank (EIB), The Netherlands Development Finance Company (FMO) and German Investment Corporation (DEG) at
the GWP level (GGU’s principal utility subsidiary). The borrowings were largely utilized in 2017 and the remaining undrawn balance of
EUR 8.6 was drawn down during 1H18 from the IFI financing. Additionally, c. GEL 48 million was obtained from local banks during 2018
to support intensive capital expenditures.
CASH FLOW HIGHLIGHTS
GGU has an outstanding water supply receivable collection rate within the 95-99% range. During 2H18 and FY18, the collection rates
for legal entities and households were 99% and 94%, respectively. Although the Georgian water utility sector historically had low
receivables collection rates, as a result of GGU’s arrangement with electricity suppliers since 2011, GGU’s collection rates remain very
strong at approximately 96%. As part of the arrangement non-paying water customers are disconnected from the electricity network
and in return, electricity suppliers receive flat monetary compensation from GGU. Operating cash flow was up 16.3% y-o-y in 2018 as a
result of the growth in revenues and positive operating leverage.
In 2H18, the water utility business distributed dividends in amount of GEL 28.8 million (up 3.0% y-o-y) to Georgia Capital.
2019 OUTLOOK
The water utility business’s outlook for 2019 is positive as management expects further continued growth in revenues from water supply
with limited increase in operating expenses, while continuing to reduce self-consumption of electricity and increasing third party
electricity sales. Electricity market deregulation, currently expected to be fully enacted from 1 May 2019, is anticipated to positively
impact revenue stream from electricity sales. The business plans to gradually decrease volume of capital expenditures after completing
two years of accelerated capex program and maintain the increasing trend of dividend distribution.

24
Our housing development business is a
leading real estate developer on the US$
1.1 billion Georgian real estate market
with three business lines: (a) a residential
development arm targeting mainly mass
market customers by offering affordable,
high quality and comfortable housing; (b)
a construction arm, engaging in
construction contracts for other
businesses as well as third-parties; and (c)
franchise platform for development of
third-party land plots with fee sharing
arrangements.
Housing Development is 100% owned
through m2.
2. Housing Development (100% ownership)
Business description
Investment rationale ▪ Shortage of housing from Soviet era combined with Georgian tradition of multiple generations living
under one roof, average household size is significantly higher at 3.3 compared to Eastern or Western
Europe
▪ Most of the housing stock dates back to Soviet era and is amortised
▪ In line with the economic growth, urbanization level is expected to increase from the current low level
Value creation potential Asset light strategy
▪ Unlock land value by developing housing projects
▪ Development of third-party land – franchise m2 brand name. Undisputed market leading platform of at
least 2,500 apartments1 to be delivered in 4-5 years
▪ Earn construction management fees from third-party projects and bring construction works in-house
Value realisation outlook Cash out by transformation into real estate asset manager
2H18 and FY18 performance
Solid GEL 10 million first-ever dividend payout following successful project execution INCOME STATEMENT HIGHLIGHTS 2H18 2H17 Change 1H18 Change FY18 FY17 Change
Gross profit from apartments sale 3,040 5,896 -48.4% 6,405 -52.5% 9,445 8,036 17.5%
Gross profit from construction services 4,254 - NMF 1,080 NMF 5,334 - NMF
Gross Real Estate Profit 7,341 6,114 20.1% 7,594 -3.3% 14,935 8,313 79.7%
Revaluation of commercial property2 3,213 (199) NMF 2,311 39.0% 5,524 21,586 -74.4%
Operating expenses (6,840) (4,708) 45.3% (4,742) 44.2% (11,582) (7,929) 46.1%
EBITDA 3,714 1,207 NMF 5,163 -28.1% 8,877 21,970 -59.6%
Profit5 362 (406) NMF 37 NMF 399 20,527 -98.1%
CASH FLOW HIGHLIGHTS Net cash flows from operating activities 7,970 18,395 -56.7% (18,124) NMF (10,154) 18,657 NMF
Net cash flows used in investing
activities (6,530) (4,166) 56.7% (7,161) -8.8% (13,691) (9,292) 47.3%
Net cash flows from financing activities (5,646) (51,056) -88.9% 22,241 NMF 16,595 (77,899) NMF
Net proceeds from borrowings - (15,801) NMF (850) NMF (850) 2,513 NMF
Cash, ending balance 10,467 20,059 -47.8% 13,844 -24.4% 10,467 20,059 -47.8% BALANCE SHEET HIGHLIGHTS Dec-18 Dec-17 Change Total assets 250,992 245,652 2.2% Land bank 8,722 58,373 -85.1% Inventories 105,307 59,199 77.9% Total liabilities 182,950 168,977 8.3% Total equity 68,042 76,675 -11.3%
(1) 2,500 apartments relate to the signed Tbilisi Airport Highway deal.
(2) Value created on commercial property.
The Housing Development gross profit from apartment sales fluctuates with the cycle of projects and strength of
demand in the market for affordable housing. 2H18 gross profit was down 48.4% y-o-y and 52.5% h-o-h, while FY18
gross profit was up 17.5% y-o-y. Market conditions remain strong and the FY18 y-o-y increase was driven by strong
project execution. In 2H18 Housing Development has successfully completed two affordable residential projects
located in the centre of Tbilisi. It reached total sales progress of 87% in on-going projects and managed to sell down
large part of its inventory at higher per ticket prices due to the sales closer to full completion stage. Average price
per square meter was up 24% in 2018 over 2017 and up 22% in 2H18 y-o-y. The development of apartment sales in
the relevant periods are shown in the table below:
2H18 1H18 2H17 FY18 FY17
Sq.m. sold 7,859 8,013 28,749 15,872 45,621
# of apartments sold 65 81 396 146 629
Total Sales value (US$) 10,991,971 11,349,941 31,449,207 22,341,912 49,118,065
Sales value of apartments (US$) 10,243,425 10,408,741 30,813,788 20,652,166 47,965,669
Average price per sq.m. 1,303 1,299 1,072 1,301 1,051
While in the process of receiving the new permits, Housing Development has not started new projects in 2018 and
sales momentum was negatively affected by low levels of inventory. Inventory levels will increase by approximately
3,000 apartments over the next few years, since in November Tbilisi City Municipality Council approved the
masterplan brief on Housing Development’s largest ever in-house affordable housing project. The Digomi project
will be developed in three stages and the construction and development of 168,000 sq.m. residential and 84,000 sq.m.
commercial spaces will continue for approximately four years. Housing Development started pre-sales for stage one
from February 2019, where the total sellable area is approximately 22,000 sq.m.. As of 19 February 2019, 3,176 sq.m.
with US$ 3.3 million sales value has already been pre-sold and 3,437 sq.m. has been booked.
During 2018, housing gain from revaluation of commercial property in the amount of GEL 5.5 million was recorded
on the apartments intended for lease out and on commercial spaces under development in our three major projects
as compared to GEL 21.6 million in 2017. In 2017 revaluation was performed for commercial spaces under
development in the above mentioned three major projects after reaching a construction progress threshold.
GEL millions, unless otherwise noted
Key highlights 2018 2017 Change
Revenue 137.8 115.1 19.7%
Gross real estate profit 14.9 8.3 79.7%
EBITDA 8.9 22.0 -59.6%
Development Capex 13.7 9.3 47.3%
Maintenance Capex - - NMF
FCF (23.8) 9.4 NMF
Cash from operations (10.2) 18.7 NMF
Net debt 107.2 65.1 64.7%
Key performance metrics Net investment 18.7
2018 dividend 10.0
ROIC3 4.1%
(3) Please see definition on page 53.
Capital Outlook through 2022
Capital needs4 31.3
of which, equity -
of which, debt 31.3
(4) Gross capital needs, excluding dividend
distribution.
(5) Please refer to page 38 for the reconciliation of
FY18 stand-alone Housing Development net
income to the attributable income from Housing
Development as reported under the management
account income statement on page 15.
25
During 2H18 the construction segment achieved robust performance and gross profit was GEL 4.3 million, almost four times
h-o-h result. Construction fees were mainly generated from two third-party construction agreements in addition to in-house development
projects: (i) the shell and core construction of a new shopping mall located in Tbilisi’s Saburtalo district and (ii) fit-out works for Radisson
Tsinandali in Kakheti region. Gross profit from construction services was GEL 5.3 million in 2018, which was 79% driven by third-party
projects.
Operating expenses were GEL 6.8 million in 2H18 (up 45.3% y-o-y and up 44.2% h-o-h) and GEL 11.6 million in 2018 (up 46.1% y-o-y). The
y-o-y increase reflects increased administrative expenses within the construction arm in line with the business ramp up, while bringing
construction works in-house will result in cost and project development efficiencies. The h-o-h increase is mainly driven by seasonally higher
marketing and advertising expenses at the end of year.
Housing Development recorded profit of GEL 0.4 million for both 2H18 and FY18 reflects mainly the impact of non-recurring expenses.
Non-recurring expenses amounted GEL 6.2 million in 2018 and were mainly driven by acceleration of share-based expense recognition as
a result of the Group’s demerger from BGEO Group in May and by expenses related to the construction of a college for vocational education
in Western Georgia, which was officially opened in 2H18. The college, with a total project cost of GEL 3 million, offers 11 short-term
vocational courses to more than 600 construction specialist/workers annually and most of the graduates are expected to be employed
within the construction arm. Before net non-recurring items, 2018 Housing Development profit was GEL 2.1 million in the second half and
GEL 6.6 million for the full year.
Housing Development currently has a land bank with a value of GEL 8.7 million, which decreased significantly y-o-y as a result of masterplan
brief approval for Digomi land (respective land was transferred from investment property to inventory). Land bank is expected to decrease
further over the coming years, in line with its asset light strategy, as Housing Development plans to develop third-party land plots under
franchise agreements going forward.
Cash flow highlights
The Housing Development business continued to deploy cash for on-going project developments, while low levels of inventory negatively
affected sales, which decreased from US$ 49.1 million sales value in 2017 to US$ 22.3 million in 2018 as noted above. Operating cash flow
was, therefore, negative GEL 10.2 million in 2018, down from GEL 18.7 million in 2017.
In December 2018, Housing Development distributed GEL 10.0 million dividends. The first ever dividend payment was made on the back of
accumulated cash inflows from successfully executed projects.
2019 OUTLOOK
During 2019, Housing Development expects to complete the construction of two ongoing residential projects and kick off the development
of its largest housing project in Digomi, which will drive revenue growth and gross margin expansion on the back of expected scale
efficiencies. Further, the business aims to complete the design stage and in 4Q19 start pre-sales of its largest-ever franchise project on a
third-party land plot located in Tbilisi airport highway in a densely populated suburban area.
26
3. Property & Casualty
Insurance (100% ownership)
Investment rationale ▪ Significantly underpenetrated insurance market in Georgia
▪ Market leader with a powerful distribution network of point of sale and
sales agents
Value creation potential ▪ Compulsory border TPL effective from 1 March 2018
▪ Local TPL expected to kick in from 1 July 2019 and provide access to untapped retail casco insurance market
▪ First mover advantage in underpenetrated SME segment
▪ Growing dividend payout capacity
Value realisation outlook Trade sale or IPO
2H18 and FY18 performance
Double-digit growth in net underwriting profit driven by efficient risk management
Gel thousands, unless otherwise noted
INCOME STATEMENT HIGHLIGHTS 2H18 2H17 Change 1H18 Change FY18 FY17 Change
Earned premiums, net 36,039 33,284 8.3% 31,451 14.6% 67,490 62,770 7.5%
Insurance claims expenses, net (13,245) (13,555) -2.3% (12,503) 5.9% (25,748) (25,098) 2.6%
Acquisition costs, net (5,712) (5,506) 3.7% (3,808) 50.0% (9,520) (9,100) 4.6%
Net underwriting profit 17,082 14,223 20.1% 15,140 12.8% 32,222 28,572 12.8%
Net investment profit 1,973 1,914 3.1% 2,015 -2.1% 3,988 3,490 14.3%
Operating profit 10,587 9,556 10.8% 10,000 5.9% 20,587 19,067 8.0%
Net non-recurring items (23) - NMF (629) -96.3% (652) - NMF
Pre-tax profit 11,047 10,335 6.9% 9,025 22.4% 20,072 19,275 4.1%
Income tax expense (1,641) (1,625) 1.0% (1,349) 21.6% (2,990) (2,975) 0.5%
Net profit3 9,406 8,710 8.0% 7,676 22.5% 17,082 16,300 4.8%
CASH FLOW HIGHLIGHTS
Net cash flows from operating activities 11,434 3,403 NMF 9,509 20.2% 20,943 12,684 65.1%
Net cash flows used in investing activities (3,077) (3,089) -0.4% (833) NMF (3,910) (5,600) -30.2%
Net cash flows from financing activities - - NMF (10,000) -100.0% (10,000) (7,000) 42.9%
Cash, ending balance 11,103 4,185 NMF 2,740 NMF 11,103 4,185 NMF
BALANCE SHEET HIGHLIGHTS Dec-18 Dec-17 Change
Cash and liquid funds 38,967 34,335 13.5%
Insurance premiums receivable, net 31,442 28,491 10.4%
Pension fund assets 18,931 18,536 2.1%
Total assets 145,710 135,157 7.8%
Gross technical provision 45,664 50,271 -9.2%
Pension benefit obligations 18,932 18,536 2.1%
Total liabilities 89,572 86,410 3.7%
Total equity 56,138 48,747 15.2%
P&C Insurance recorded solid double digit increase in net underwriting profit for the full year in 2018 and in 2H18
driven by strong increases in net premiums earned.
Net premiums earned were up 7.5% y-o-y in FY18 and in 2H18 were up 14.6% h-o-h and 8.3% y-o-y. This was driven
by multiple factors: (a) the termination of relationships with loss-making clients to improve the loss ratio and overall
bottom line; (b) the introduction of insurance supervision fees from 1 January 2018; (c) restrictions applied by
government to our Agro Insurance project (effective from 1 April 2018), limiting client eligibility; (d) net premiums
earned from the new compulsory border third-party liability (TPL) insurance of GEL 3.6 million in 2H18 and GEL 5.2
million in 2018 and e) substantial increase in net premiums earned from credit unemployment insurance line which
kicked in at the end of 2017, picking up in 2H18, with net revenue 2.4 times higher h-o-h in 2H18 to GEL 1.2 million
and 7 times higher to GEL 1.6 million in 2018. Additionally, as part of the risk management exercise, Aldagi revisited
its reinsurance policies and terminated a reinsurance treaty for credit life insurance products as of 1 January 2018
leading to net premiums earned from credit life insurance growing by 29.6% y-o-y in 2018.
Net insurance claims increased in 2018 only by 2.6% y-o-y and by 5.9% h-o-h in 2H18, where the increase was
primarily limited by profitability of compulsory border TPL portfolio, reducing the loss ratio in motor business line
from 62.2% to 55.0% y-o-y and from 57.9% to 52.4% h-o-h in 2H18. Overall, the loss ratio decreased by 1.8 percentage
points, reaching 38.2% during 2018.
Net acquisition costs were GEL 9.5 million in 2018 (up 4.6% y-o-y) and GEL 5.7 million in 2H18 (up 50.0% h-o-h), due
to on average higher commission rate on property insurance mainly driven by increased commission rate with a local
financial institution. Furthermore, introduction of compulsory border TPL insurance starting from March 2018
increased acquisition costs by 1.2 million y-o-y, of which GEL 0.8 million was related to 2H18. Nevertheless,
commission ratio decreased from 14.5% to 14.1% in FY18, mainly on the back of decrease in Agro insurance portfolio,
which on average has a higher commission rate.
P&C Insurance’s key performance ratios remained healthy during 2H18 and FY18 as noted below:
Key Ratios 2H18 2H17 1H18 FY18 FY17
Combined ratio 76.1% 77.0% 74.7% 75.5% 75.2%
Expense ratio 39.3% 36.3% 34.9% 37.3% 35.2%
Loss ratio 36.8% 40.7% 39.8% 38.2% 40.0%
Business description
Our property and casualty Insurance (P&C
Insurance) business is a leading player in
the local P&C insurance market with a
32% market share based on gross
premiums. P&C Insurance offers a wide
range of insurance products to Georgian
corporates and retail through five
business lines: motor, property, credit life,
liability and other insurance services.
P&C Insurance is 100% owned through
Aldagi.
GEL millions, unless otherwise noted
Key highlights 2018 2017 change
Earned premiums,
net 67.5 62.7 7.5%
Net income* 17.7 16.3 8.8%
Development Capex - - N/A
Maintenance Capex - - N/A
FCF 17.0 7.1 NMF
Cash from
operations 20.9 12.7 65.1%
Net debt - - NMF
* Net income is adjusted for non-recurring items
Key performance metrics
Net investment (13.9)
2018 Dividend 10.0
ROAE1 34.4%
(1) Adjusted for non-recurring items.
Capital Outlook through 2022
Capital needs2 -
of which, equity -
of which, debt -
(2) Gross capital needs, excluding dividend
distribution.
(3) Please refer to page 38 for the reconciliation of
FY18 stand-alone P&C Insurance net income to the
attributable income from P&C Insurance as
reported under the management account income
statement on page 15.
27
The expense ratio increased by 4.4 percentage points since 1H18, reaching 39.3% in 2H18. This is due to higher personnel
training costs incurred by the end of 2018, impairment charges due to termination of performance bond insurance contract and mandatory
costs of participation in compulsory border TPL project.
Net investment profit increased to GEL 4.0 million in 2018 (up 14.3% y-o-y). Investment yield remained high at 10.0% in FY18 compared to
9.9% in FY17. The liquid assets portfolio increased by 13.5% y-o-y in 2018.
P&C Insurance’s operating profit and net income reached GEL 20.6 million (up 8.0% y-o-y in 2018) and GEL 17.1 million (up 4.8% y-o-y in
2018), respectively, in 2018.
Balance sheet remains solid and well-capitalised
At 31 December 2018, total assets stood at GEL 145.9 million up 7.9% from 31 December 2017 driven by 13.5% increase in cash and liquid
funds during the same period. Insurance receivables increased due to prolongation of commercial property contract with significant client
in property insurance near the year-end. The increase in pension assets and pension liabilities was fully organic, resulting from business
growth. Due to introduction of the new state pension regulation effective from 1 January 2019, pension assets and related liabilities are
expected to substantially decrease starting from 2019. P&C Insurance’s strong position is also evidenced by solvency ratio, which stood at
136% at 31 December 2018, well above than the required minimum of 100%, however down from 145% at 30 June 2018 due to stricter
regulatory requirements. P&C insurance business expects to maintain its solvency ratio at minimum level of 130% over the coming years.
Cash flow highlights Operating cash flow was up 65.1% y-o-y in FY18 on the back of efficient risk management, decreasing payments for claims, while insurance
premiums received increased by 5%. Profitability of compulsory border TPL, having overall lower loss ratio, also drove operating cash flow
up. Increased Interest inflows in line with liquid assets growth also positively contributed to the increase in operating cash flow.
P&C insurance business paid a GEL 10 million dividend in 2018, which grew by 43% from GEL 7 million in 2017.
2019 OUTLOOK
P&C Insurance expects insurance activity to increase during 2019 across retail and SME segments and has actively started to develop its
marketing strategy towards entering these underpenetrated segments, expected to significantly increase revenue generation. Revenue
growth may significantly accelerate subject to parliament approval of the mandatory third-party liability (TPL) insurance legislation, which
has been submitted with a target launch date of 1 July 2019. The business also will continue to keep its focus on maintaining healthy
combined ratio, below 75%, and benefit from border TPL growth.

28
4. Renewable Energy (65% ownership)
Business description
Our renewable energy business is a platform
for developing hydro power plants, wind
power plants and solar power plants across
Georgia.
Georgia Capital owns 65% in the energy
business, with the remaining 35% owned by
the Austrian company RP Global – an
independent power producer with 30 years
of experience of developing, building,
owning and operating renewable power
plants globally.
Investment rationale ▪ Underdeveloped energy market with potential for significant growth - Low per capita power usage
▪ Cheap to develop – up to US$ 1.5 million for 1MW hydro and up to US$ 1.4 million for wind development
Value creation potential ▪ Opportunity to establish a renewable energy platform with 500MW operating capacity over the medium-
term (500MW target includes existing energy assets of the water utility business)
▪ Energy consumption has grown at 5.7% CAGR in last 10 years. We expect energy consumption to grow
further at least by CAGR 5%, translating into doubling of the consumption over the next 10-15 years, while
supply growth has been slower and electricity deficit is anticipated to continuously increase
▪ Stable dividend payment capacity in the medium term
Value realisation outlook IPO together with the water utility business
2H18 and FY18 performance
On track to launch first hydro power plant in 1H19
Intensive construction works continued on Mestiachala HPPs during 2H18 with GEL 45.6 million capital expenditures
spent on development, totaling GEL 63.9 million in 2018. The major part of the construction works is already
completed, including concrete works, pipe fitting, substation construction and electrical equipment installation. The
annual net generation capacity is projected at approximately 171GWh, with peak generation in August, when the
market prices are higher compared to May-June period, when most of the HPPs in Georgia have peak generation.
The project has a 15 year Government PPA in place with the price of US$ 55 per MWh during Sep-Apr period. The
project cost is anticipated at c. US$ 1.2 million per MW. GEL thousands, unless otherwise noted
INCOME STATEMENT HIGHLIGHTS 2H18 2H17 Change 1H18 Change FY18 FY17 Change
Revenue - - NMF - NMF - - NMF
Operating expenses (367) (729) 49.7% (403) 8.9% (770) (1,733) 55.6%
EBITDA (367) (729) 49.7% (403) 8.9% (770) (1,733) 55.6%
Net loss3 (400) (484) 17.4% (416) 3.8% (816) (2,177) 62.5%
Attributable to:
– shareholders of the Group (260) (766) 66.1% (270) 3.7% (530) (2,093) 74.7%
– non-controlling interests (140) 282 NMF (146) 4.1% (286) (84) NMF
CASH FLOW HIGHLIGHTS 2H18 2H17 Change 1H18 Change FY18 FY17 Change
Cash flow from operating activities (327) 793 NMF (369) 11.4% (696) (1,466) 52.5%
Cash flow used in investing activities (42,693) (46,653) 8.5% (19,602) NMF (62,295) (69,776) 10.7%
Development capex (47,693) (65,912) 27.6% (20,565) NMF (68,258) (76,565) 10.8%
Cash flow from financing activities 39,511 28,931 36.6% 23,717 66.6% 63,228 74,069 -14.6%
Proceeds from borrowings 37,218 21,964 69.5% 18,276 NMF 55,494 57,268 -3.1%
Cash ending balance 8,388 8,298 1.1% 11,351 -26.1% 8,388 8,298 1.1%
BALANCE SHEET HIGHLIGHTS Dec-18 Dec-17 Change
Total assets 169,304 96,551 75.4%
Property, plant and equipment 114,645 47,953 NMF
Cash balance 8,388 8,298 1.1%
Total liabilities 75,145 69,920 7.5%
Total debt4 70,711 64,848 9.0%
Total equity 94,159 26,631 NMF
Total equity attributable to the
shareholders of the group 61,203 16,505 NMF
(4) Mezzanine loan from GCAP is classified as borrowing in stand-alone IFRS financial statements of renewable energy business, which in
2018 was converted to equity.
Renewable Energy financials reflect Mestiachala HPP being in its construction stage and other renewable energy
projects being under development. The increase in property, plant and equipment compared to 31 December 2017
is primarily attributable to the construction of Mestiachala HPPs. The increase in total equity is primarily attributable
to capital injections from the shareholders for development and construction of renewable projects. Overall the
energy business is financing the projects with up to 30% equity contribution.
Renewable Energy continues to build ground for its 500MW operating capacity medium-term target. It searches for
opportunities to develop new hydro projects and seeks acquisition possibilities among existing projects, which are
either commissioned or under feasibility stage. Currently, preparation works are underway to commence
construction works on 46 MW Zoti HPPs in 2H19, located in Western part of Georgia, expected to have net
generation of 164 MWhs, with c. 53% of generation covered by 15-year Government PPA (average US$ 51 per MWh
during Sep-Apr period). In 2Q18 the company has applied for an MoU for yet another new project - 38 MW Racha
HPPs. Cost per MW is anticipated to be at c. US$ 1.5m with the capacity factor estimated to be as high as c. 49%.
Additionally, preliminary SPA has been signed for Bakhvi 2 HPP in August 2018 and the management is working on
prolongation of MoU formed with the Government. Subject to successful MoU prolongation, the project
construction works are anticipated to start in the first half of 2020 with the planned commissioning in the first half
of 2022. Based on the current feasibility study results, installed capacity of Bakhvi 2 HPP is anticipated to be 36 MWs,
with annual net generation of c. 127 GWhs. Total cost per MW is projected to be c. US$ 1.3m.
GEL millions, unless otherwise noted
Key highlights 2018 2017 change
Revenue n/a n/a n/a
EBITDA (0.8) (1.7) 55.6%
Capex 68.3 76.6 -10.9%
FCF n/a n/a n/a
Cash from
operations (0.7) (1.5) 52.5%
Net debt 62.3 56.6 10.2%
Key performance metrics
Net investment 56.6
2018 dividend -
ROIC1 -0.9%
(1) Please see definition on page 53.
Capital Outlook through 2022
Capital needs2 1,240
of which, our equity (65% stake) 177
of which, equity from minority 95
of which, debt 968
(2) Gross capital needs, excluding dividend
distribution.
(3) Please refer to page 38 for the reconciliation of
FY18 stand-alone Renewable Energy net loss to the
attributable loss from Renewable Energy as reported
under the management account income statement on
page 15.
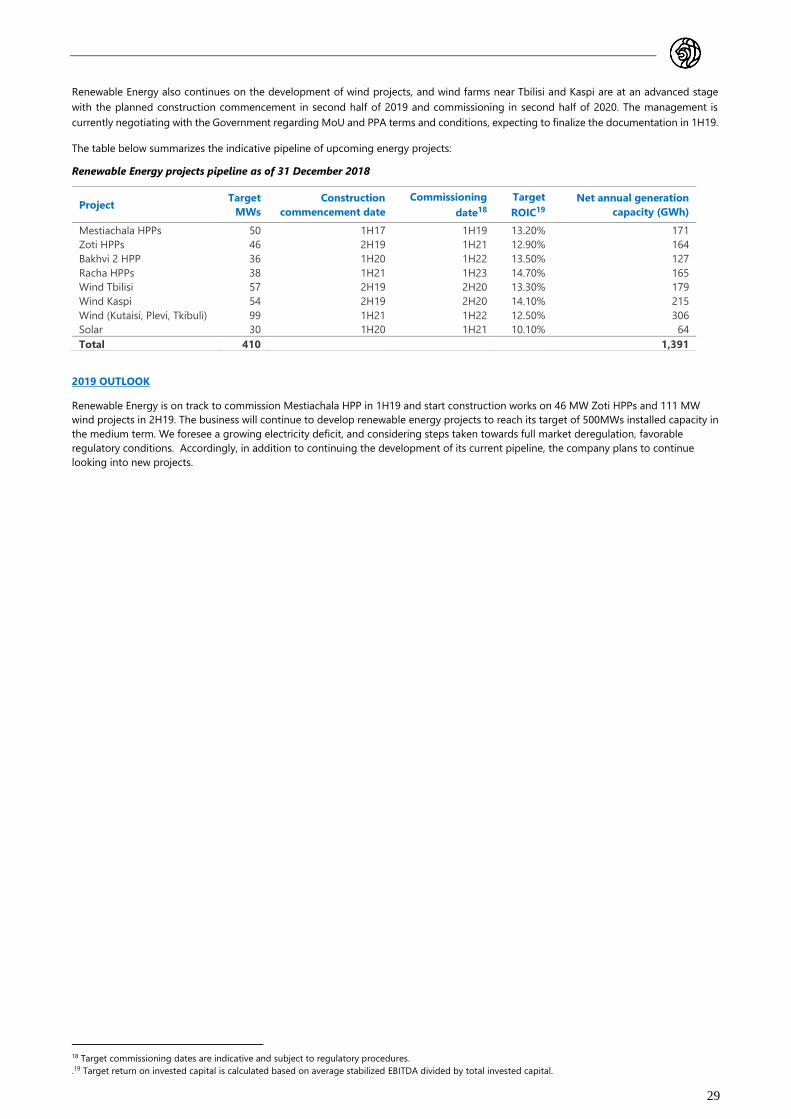
29
Renewable Energy also continues on the development of wind projects, and wind farms near Tbilisi and Kaspi are at an advanced stage
with the planned construction commencement in second half of 2019 and commissioning in second half of 2020. The management is
currently negotiating with the Government regarding MoU and PPA terms and conditions, expecting to finalize the documentation in 1H19.
The table below summarizes the indicative pipeline of upcoming energy projects:
Renewable Energy projects pipeline as of 31 December 2018
2019 OUTLOOK
Renewable Energy is on track to commission Mestiachala HPP in 1H19 and start construction works on 46 MW Zoti HPPs and 111 MW
wind projects in 2H19. The business will continue to develop renewable energy projects to reach its target of 500MWs installed capacity in
the medium term. We foresee a growing electricity deficit, and considering steps taken towards full market deregulation, favorable
regulatory conditions. Accordingly, in addition to continuing the development of its current pipeline, the company plans to continue
looking into new projects.
18 Target commissioning dates are indicative and subject to regulatory procedures.
.19 Target return on invested capital is calculated based on average stabilized EBITDA divided by total invested capital.
Project Target
MWs
Construction
commencement date
Commissioning
date18
Target
ROIC19
Net annual generation
capacity (GWh)
Mestiachala HPPs 50 1H17 1H19 13.20% 171
Zoti HPPs 46 2H19 1H21 12.90% 164
Bakhvi 2 HPP 36 1H20 1H22 13.50% 127
Racha HPPs 38 1H21 1H23 14.70% 165
Wind Tbilisi 57 2H19 2H20 13.30% 179
Wind Kaspi 54 2H19 2H20 14.10% 215
Wind (Kutaisi, Plevi, Tkibuli) 99 1H21 1H22 12.50% 306
Solar 30 1H20 1H21 10.10% 64
Total 410 1,391

30
5. Hospitality &
Commercial Real Estate (100% ownership)
Business description
Investment rationale ▪ Record number of tourists visiting Georgia every year: 4.8 million visitors in 2018, up 16.9% y-o-y,
10.5% CAGR over the last 5 years; Tourism inflows up 18.4% y-o-y from US$ 2.7bln in 2017 to US$
3.2bln in 2018, 13.2% CAGR over the last 5 years;
Value creation potential ▪ Grow portfolio of rent-earning assets through real estate developments and opportunistic acquisitions
▪ Reach more than 1,000 hotel rooms in the next 3 years. Currently approximately 1,121 rooms of which
152 are operational and c.969 are in pipeline.
Value realisation outlook We aim to spin-off yielding properties as a listed REIT managed by m2
2H18 and FY18 performance
A year of growth in Revenue, earnings, portfolio and pipeline
GEL thousands, unless otherwise noted
INCOME STATEMENT HIGHLIGHTS 2H18 2H17 Change 1H18 Change FY18 FY17 Change
Gross profit from operating leases 2,688 1,543 74.2% 1,900 41.5% 4,588 3,042 50.8%
Gross profit from hospitality services 1,488 - NMF 457 NMF 1,945 - NMF
Gross Real Estate Profit 4,354 1,543 NMF 2,407 80.9% 6,761 3,042 NMF
Revaluation of commercial property3 27,621 977 NMF - NMF 27,621 977 NMF
Operating expenses (2,285) (484) NMF (556) NMF (2,841) (650) NMF
Net operating income (NOI) 29,690 2,036 NMF 1,851 NMF 31,541 3,369 NMF
Profit (loss)4 26,806 1,884 NMF (410) NMF 26,396 3,135 NMF
CASH FLOW HIGHLIGHTS
Net cash flows from operating activities 4,063 1,350 NMF 1,607 NMF 5,670 2,689 NMF
Net cash flows used in investing activities (27,772) (24,240) 14.6% (51,672) -46.3% (79,444) (32,483) NMF
Net cash flows from financing activities 43,066 35,034 22.9% 44,669 -3.6% 87,735 40,372 NMF
Net Proceeds from borrowings 2,557 12,810 -80.0% 73,840 -96.5% 76,397 12,696 NMF
Cash, ending balance 28,616 14,806 93.3% 9,210 NMF 28,616 14,806 93.3%
BALANCE SHEET HIGHLIGHTS Dec-18 Dec-17 Change
Cash and cash equivalents 28,615 14,805 93.3%
Investment property 225,343 56,770 NMF
Land bank 37,459 14,529 NMF
Commercial real estate 187,884 42,241 NMF
Total assets 294,833 130,022 NMF
Borrowings 104,557 14,749 NMF
Total equity 159,839 87,955 81.7%
(3) Value created on commercial property.
INCOME STATEMENT HIGHLIGHTS
Gross profit from operating leases in 2H18 increased 74.2% y-o-y and 41.5% h-o-h and was up 50.8% y-o-y in
FY18 primarily due to the expansion of the commercial real estate portfolio, supported by high occupancy levels.
The portfolio available for lease continues to be successfully leased with an occupancy rate and an average yield
of 90.1% and 9.9% respectively in 2018, compared to 88.3% and 9.1% in 2017. The commercial real estate business
obtains commercial space (ground floor) at residential developments from the housing development business
and also acquires it opportunistically from third parties. Nearly 80% of the total commercial assets portfolio
represents office and retail areas and another 20% residential and industrial spaces.
Our first hotel, Ramada Encore on Kazbegi ave. has completed its ninth full month of operations, generating GEL
1.9 million of gross profit with US$ 74.6 ADR and 44.4% occupancy rate and earning net operating profit margin
of 37.8% since its launch in March 2018. Revenue acceleration was supported by a pick up in occupancy levels,
averaging 51.7% in 2H18 vs. 33.3% in 1H18. The hotel has a capacity of 152 rooms and is catering to the needs
of the rapidly growing market for budget travellers in Georgia.
In 2H18 Hospitality Business booked revaluation gain of GEL 25.8 million on two under construction and one
operational hotel, while a revaluation gain of GEL 1.9 million was recorded on rent-generating assets.
Management hires an independent, internationally recognized valuation company to determine the fair values of
hotels after a predetermined construction progress threshold is reached.
BALANCE SHEET HIGHLIGHTS
At 31 December 2018, total assets of Hospitality & Commercial Real Estate were GEL 294.8 million (more than
doubled from GEL 130.0 million at 31 December 2017) and was largely concentrated in investment property. In
2018 Commercial real estate increased more than four times compared to 31 December 2017 due to the
commencement of construction of Ramada Melikishvili hotel, acquisition of under construction Gudauri hotel,
completion of Ramada Encore Kazbegi Hotel and commercial portfolio expansion. Borrowings increased due to
the funding of the on-going hotel developments and acquisition of a single commercial real estate asset, all of
which was fully financed by Georgia Capital. In December 2018 Hospitality & Commercial Real Estate has initiated
the process of placing US$ 30 million bonds into the local market backed by rental income stream from
commercial properties. The bonds are being issued at par with a 3-year tenor and an annual coupon rate of 7.5%,
payable quarterly. The Proceeds will be used to finance upcoming hotel developments.
Our hospitality & commercial real estate
business is comprised of: (a) rent-earning
commercial assets with targeted 10%
yield and (b) hotel development business
across Georgia with targeted 1,000 rooms.
The hotel development business has
already confirmed 1,121 rooms, of which,
152 are operational and 969 are in
pipeline.
Hospitality & Commercial Real Estate is
100% owned through m2.
GEL millions, unless otherwise noted
Key highlights 2018 2017 change
Revenue 38.5 4.6 NMF
NOI 31.5 3.4 NMF
Development Capex 81.0 32.5 NMF
Maintenance Capex - - NMF
FCF (66.8) (29.8) NMF
Cash from
operations 5.7 2.7 NMF
Net debt 91.7 24.2 NMF
Key performance metrics
Net investment 107.0
2018 Dividend -
ROIC1 16.4%
(1) Please see definition on page 53.
Capital Outlook through 2022
Capital needs2 225.1
of which, GCAP equity 39.6
of which, debt 185.5
(2) Gross capital needs, excluding dividend
distribution.
(4) Please refer to page 38 for the reconciliation of
FY18 stand-alone Hospitality & Commercial Real
Estate net income to the attributable income from
Hospitality & Commercial Real Estate as reported
under the management account income statement
on page 15.

31
The hospitality business continued to build ground for its targeted 1,000 hotel rooms portfolio, by investing GEL 19 million in an under
construction hotel in Gudauri and a land plot in Telavi for hotel development. The business has three hotel projects under construction
– a luxury hotel on Gergeti street in Tbilisi with an expected 100 rooms, Melikishvili Avenue hotel in Tbilisi with expected 125 rooms and
hotel in the leading ski resort of the Caucasus region, Gudauri with an expected 121 rooms. Additionally, there are 6 hotels in a design
stage: (a) a hotel in Telavi with expected 130 rooms, (b) a hotel in Kutaisi with expected 121 rooms (c) a hotel in Akhasheni village,
Kakheti, in eastern part of Georgia well-known to tourists for wine destination with expected 60 rooms (d) a business style 4 star hotel
in old Tbilisi with expected 120 rooms and e) two hotels in mountainous Svaneti region with expected 192 rooms in total. The total
capital needs to complete the construction and development of the hotels in the current pipeline is estimated at GEL 247.5 million,
summarized in the table below:
Cash flow highlights The first operational Ramada Encore hotel added GEL 2.3 million to operating cash flow, which more than doubled from GEL 2.7 million
in 2017 to GEL 5.7 million in 2018. As the hospitality & commercial real estate business progressed towards its targeted 1,000 hotel
room portfolio in 2018, it continued to acquire under construction hotels and land plots for further development. Hospitality &
Commercial Real estate targets 70%:30% debt to equity leverage ratio at hotels and during 2018 m2 received a loan from Georgia Capital
with an outstanding balance of GEL 104.6 million (US$ 39.1 million) at 31 December 2018. The loan proceeds will be used primarily for
on-going development, construction and growth of the hotel pipeline.
2019 OUTLOOK
The hospitality business plans to commence the construction of a Ramada hotel in Kutaisi in 1Q19 - currently in the design stage,
complete the design stage of Telavi and Kakheti - Wine & Spa hotels and commission hotels in Gudauri and Seti Square Svaneti in 2019.
20 Target opening dates for hotels under design stage are subject to outcomes of design process and may be changed. 21 Target return on invested capital per each hotel equals stabilized adjusted net operating income divided by total investment.
Hotel Rooms Current
Stage
Target opening
date20
Total Cost
excl. VAT
US$ ‘000
Target
ROIC21
Ramada Encore Kazbegi, Tbilisi 152 Operational Q1-2018 12,066 18.0%
Gudauri 121 Construction Q2-2019 10,809 12.8%
Seti Square in Mestia, Svaneti 72 Design Q4-2019 5,915 16.2%
Ramada Melikishvili, Tbilisi 125 Construction Q1-2020 12,352 15.7%
Gergeti, Tbilisi 100 Construction Q3-2020 23,473 13.7%
Ramada Kutaisi 121 Design Q4-2020 9,535 17.5%
Mestia, Svaneti 120 Design Q1-2021 10,096 15.8%
Telavi 130 Design Q2-2021 12,735 13.4%
Javakhishvili, Tbilisi 120 Design Q2-2021 14,144 13.8%
Kakheti Wine & Spa 60 Design Q3-2021 7,500 17.3%
Total 1,121

32
Investment rationale ▪ High growth sector, which has doubled during the last 5 years to GEL 1.9 billion market
▪ Beer consumption at one of the lowest levels in the wider region at 27.5 liters per capita
▪ 50% CAGR growth in soft drinks export over the last 3 years
▪ Georgia’s favorable trade regimes (FTAs with EU and China) provide potential for export growth for beverages
Value creation potential ▪ Best-in-class distribution network platform ▪ 10-year exclusivity from Heineken to produce and sell beer in Georgia, Armenia and Azerbaijan ▪ Grow vineyard base to 1,000 hectares, from current 436 hectares, over the next three years
Value realization outlook Trade sale either of the whole business or parts
2H18 and FY18 performance
Outstanding growth in revenues driven by strong performance in the wine business
GEL thousands, unless otherwise noted
INCOME STATEMENT HIGHLIGHTS 2H18 2H17 change 1H18 change FY18 FY17 change
Consolidated
Revenue 45,747 38,152 19.9% 30,467 50.2% 76,214 55,730 36.8%
Gross profit 17,996 15,687 14.7% 11,258 59.9% 29,254 22,378 30.7%
EBITDA (354) 1,763 NMF (6,087) -94.2% (6,441) 856 NMF
Net loss4 (19,206) (11,362) 69.0% (9,967) 92.7% (29,173) (14,393) NMF
Wine Business
Revenue 19,495 12,455 56.5% 9,857 97.8% 29,352 20,427 43.7%
Gross profit 9,359 6,360 47.2% 4,683 99.9% 14,042 10,063 39.5%
Gross profit Margin 48.0% 51.1% 47.5% 47.8% 49.3%
Operating expenses (3,835) (2,416) 58.7% (3,056) 25.5% (6,891) (4,636) 48.6%
EBITDA 5,524 3,944 40.1% 1,627 NMF 7,151 5,427 31.8%
Net profit (94) 3,104 NMF 3 NMF (91) 4,137 NMF
Beer Business
Revenue 16,057 15,426 4.1% 13,251 21.2% 29,308 17,927 63.5%
Gross profit 5,639 6,249 -9.8% 4,448 26.8% 10,087 6,956 45.0%
Gross profit Margin 35.1% 40.5% 33.6% 34.4% 38.8%
Operating expenses (11,809) (8,973) 31.6% (12,032) -1.9% (23,841) (12,489) 90.9%
EBITDA (6,170) (2,724) NMF (7,584) -18.6% (13,754) (5,533) NMF
Net loss (19,011) (15,216) 24.9% (9,464) NMF (28,475) (19,507) 46.0%
Distribution Business3
Revenue 15,257 14,089 8.3% 9,639 58.3% 24,896 24,413 2.0%
Gross profit 3,168 3,029 4.6% 2,084 52.0% 5,252 5,166 1.7%
Gross profit Margin 20.8% 21.5% 21.6% 21.1% 21.2%
Operating expenses (2,819) (2,550) 10.5% (1,808) 55.9% (4,627) (4,438) 4.3%
EBITDA 349 479 -27.1% 276 26.4% 625 728 -14.1%
Net loss (30) 524 NMF (167) -82.0% (197) 308 NMF
In 2018 Georgia Capital continued to invest in the beverages business, successfully acquiring 100% equity stakes in
the leading Georgian craft beer producer, Black Lion LLC (total consideration of US$ 3.2 million) in February 2018 and
in the prominent winery Kindzmarauli Marani LLC (total consideration of US$ 9.5 million). Through the acquisition of
Kindzmarauli, which added 350 hectares of vineyards, bringing the total vineyard base to 436 hectares, our wine
business is now a top three winery in Georgia in terms of the vineyard base. Therefore, management expects to
minimize reliance on purchased grapes in the coming years and as a result, manage gross profit margin levels.
Beverages revenue in 2H18 was up 19.9% y-o-y and 50.2% h-o-h and for 2018 was up 36.8%. The increase was driven
by revenues generated from the beer & lemonade business line and by mostly organic growth in the wine business
supported by the country’s strong export markets growing at 13% y-o-y in 2018 reaching record high 86.2 million
wine bottle export sales. In line with the market growth, our wine bottle sales also increased significantly by 22% from
c. 3.5 million bottles in 2017 to 4.3 million in 2018.
Topline growth was also supported by the GEL 2.9 million revaluation gain on grapes recorded in December 2018,
driven by our increased vineyard base through the Kindzmarauli acquisition. Beverages achieved a well-diversified
revenue mix in 2018: wine (41%); distribution (21%) and beer & lemonade (38%).
The wine business maintained a solid gross profit margin of 48% in 2018, compared to 49% in 2017, despite
discontinuation of the Government subsidy on grapes, which adversely affected grape purchase prices for the
business and therefore, the cost of goods sold. Wine EBITDA increased by 31.8% y-o-y.
Beer EBITDA was negative GEL 6.2 million in 2H18 and negative GEL 13.8 million in 2018, compared to negative GEL
2.7 million in 2H17 and negative GEL 7.6 million in 1H18. During 2017, the beer business actively invested in beer
facilities to accommodate the launch of its beer & lemonade businesses, however, the launch of key Heineken brands
was delayed, thereby negatively impacting the 2018 performance. Based on the updated timeline, Heineken and
Amstel production are expected to commence in 1H19. Starting from 2H18 Beverages has strengthened its beer
business with a new CEO and COO and new management decreased the negative EBITDA contribution by 18.6% h-
o-h in 2H18 on the back of efficient cost management. Our beer business is actively working on export markets and
first batch of lemonade was exported in Russia in December 2018.
6. Beverages (80% ownership)
Business description
Our Beverages combines three business
lines: a wine business, a beer business
and a distribution business. We produce
and sell wine locally and export to 17
countries, while in our beer we have a 10-
year exclusive license to produce
Heineken brands in Georgia and sell
them in the South Caucasus.
Georgia Capital owns 80% of Beverages.
GEL millions, unless otherwise noted
Key highlights 2018 2017 change
Revenue 76.2 55.7 36.8%
EBITDA (6.4) 0.9 NMF
Dev. Capex 32.4 30.6 5.6%
Maint. Capex 0.4 - NMF
FCF (42.1) (40.0) -5.3%
Cash from
operations (13.8) (9.8) 39.7%
Net debt 107.1 49.6 115.9%
Key performance metrics
Net investment 116.0
2018 dividend -
ROIC1 -11.4%
(1) Please see definition on page 53.
Capital Outlook through 2022
Capital needs2 104.0
of which, equity 37.0
of which, debt 67.0
(2) Gross capital needs, excluding dividend
distribution.
(3) Starting from 4Q18 distribution business
represents separate business line after
reorganization within the company, therefore
results of distribution business line for
comparative periods differ from the one presented
in the previous announcements.
(4) Please refer to page 38 for the reconciliation of
FY18 stand-alone Beverages net loss to the
attributable loss from Beverages as reported under
the management account income statement on
page 15.

33
2019 OUTLOOK
The wine business expects to maintain high double-digit revenue growth on strategic export markets, while diversifying the export revenue
streams. At the same time the wine business plans to invest in improving the quality processes, renewing production facilities and acquiring
additional vineyards to further increase production capacity and reduce cost of goods sold. On the back of improvement in the quality
processes, the business is expected to enter the premium wine segment, thereby diversifying its current product mix.
The beer business plans to achieve 20% volume market share in beer by the end of 2019, by launching the Heineken brands in 1H19, improving
product mix, launching new brands, enhancing the distribution platform and targeted marketing.
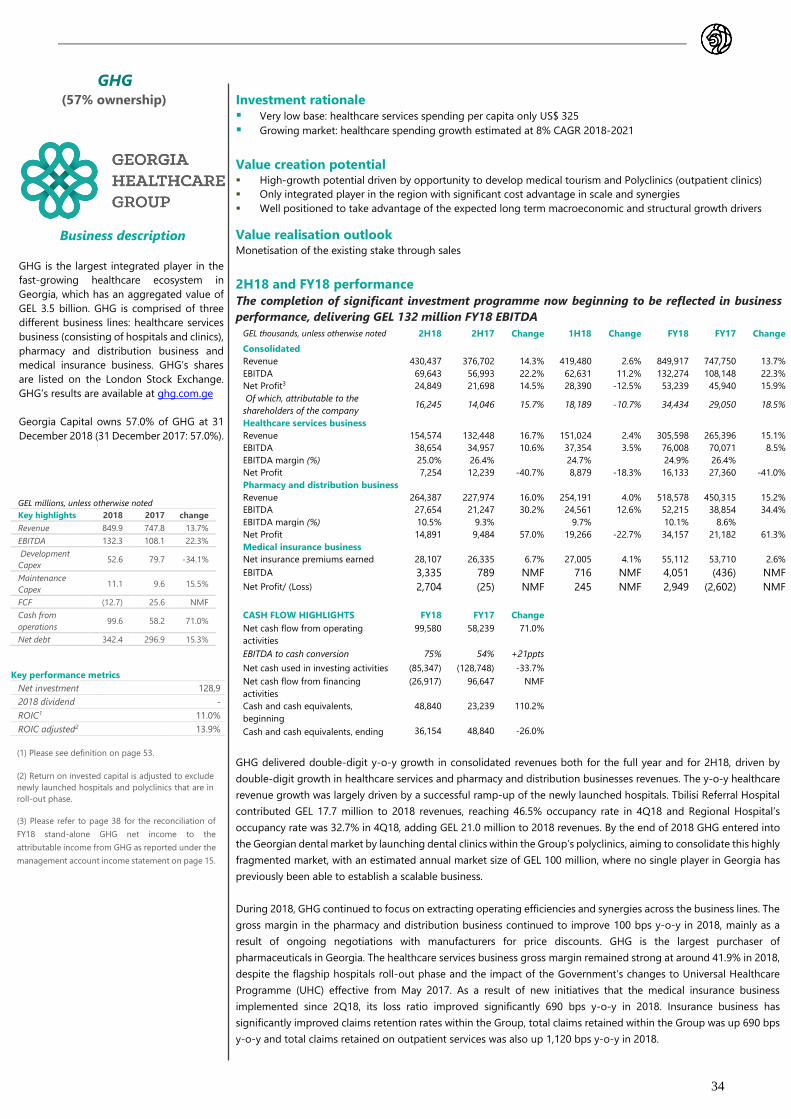
34
Business description
GHG (57% ownership)
Investment rationale ▪ Very low base: healthcare services spending per capita only US$ 325 ▪ Growing market: healthcare spending growth estimated at 8% CAGR 2018-2021
Value creation potential ▪ High-growth potential driven by opportunity to develop medical tourism and Polyclinics (outpatient clinics)
▪ Only integrated player in the region with significant cost advantage in scale and synergies
▪ Well positioned to take advantage of the expected long term macroeconomic and structural growth drivers
Value realisation outlook Monetisation of the existing stake through sales
2H18 and FY18 performance
The completion of significant investment programme now beginning to be reflected in business
performance, delivering GEL 132 million FY18 EBITDA
GEL thousands, unless otherwise noted 2H18 2H17 Change 1H18 Change FY18 FY17 Change
Consolidated
Revenue 430,437 376,702 14.3% 419,480 2.6% 849,917 747,750 13.7%
EBITDA 69,643 56,993 22.2% 62,631 11.2% 132,274 108,148 22.3%
Net Profit3 24,849 21,698 14.5% 28,390 -12.5% 53,239 45,940 15.9%
Of which, attributable to the
shareholders of the company 16,245 14,046 15.7% 18,189 -10.7% 34,434 29,050 18.5%
Healthcare services business
Revenue 154,574 132,448 16.7% 151,024 2.4% 305,598 265,396 15.1%
EBITDA 38,654 34,957 10.6% 37,354 3.5% 76,008 70,071 8.5%
EBITDA margin (%) 25.0% 26.4% 24.7% 24.9% 26.4%
Net Profit 7,254 12,239 -40.7% 8,879 -18.3% 16,133 27,360 -41.0%
Pharmacy and distribution business
Revenue 264,387 227,974 16.0% 254,191 4.0% 518,578 450,315 15.2%
EBITDA 27,654 21,247 30.2% 24,561 12.6% 52,215 38,854 34.4%
EBITDA margin (%) 10.5% 9.3% 9.7% 10.1% 8.6%
Net Profit 14,891 9,484 57.0% 19,266 -22.7% 34,157 21,182 61.3%
Medical insurance business
Net insurance premiums earned 28,107 26,335 6.7% 27,005 4.1% 55,112 53,710 2.6%
EBITDA 3,335 789 NMF 716 NMF 4,051 (436) NMF
Net Profit/ (Loss) 2,704 (25) NMF 245 NMF 2,949 (2,602) NMF
CASH FLOW HIGHLIGHTS FY18 FY17 Change
Net cash flow from operating
activities
99,580 58,239 71.0%
EBITDA to cash conversion 75% 54% +21ppts
Net cash used in investing activities (85,347) (128,748) -33.7%
Net cash flow from financing
activities
(26,917) 96,647 NMF
Cash and cash equivalents,
beginning
48,840 23,239 110.2%
Cash and cash equivalents, ending 36,154 48,840 -26.0%
GHG delivered double-digit y-o-y growth in consolidated revenues both for the full year and for 2H18, driven by
double-digit growth in healthcare services and pharmacy and distribution businesses revenues. The y-o-y healthcare
revenue growth was largely driven by a successful ramp-up of the newly launched hospitals. Tbilisi Referral Hospital
contributed GEL 17.7 million to 2018 revenues, reaching 46.5% occupancy rate in 4Q18 and Regional Hospital’s
occupancy rate was 32.7% in 4Q18, adding GEL 21.0 million to 2018 revenues. By the end of 2018 GHG entered into
the Georgian dental market by launching dental clinics within the Group’s polyclinics, aiming to consolidate this highly
fragmented market, with an estimated annual market size of GEL 100 million, where no single player in Georgia has
previously been able to establish a scalable business.
During 2018, GHG continued to focus on extracting operating efficiencies and synergies across the business lines. The
gross margin in the pharmacy and distribution business continued to improve 100 bps y-o-y in 2018, mainly as a
result of ongoing negotiations with manufacturers for price discounts. GHG is the largest purchaser of
pharmaceuticals in Georgia. The healthcare services business gross margin remained strong at around 41.9% in 2018,
despite the flagship hospitals roll-out phase and the impact of the Government’s changes to Universal Healthcare
Programme (UHC) effective from May 2017. As a result of new initiatives that the medical insurance business
implemented since 2Q18, its loss ratio improved significantly 690 bps y-o-y in 2018. Insurance business has
significantly improved claims retention rates within the Group, total claims retained within the Group was up 690 bps
y-o-y and total claims retained on outpatient services was also up 1,120 bps y-o-y in 2018.
GHG is the largest integrated player in the
fast-growing healthcare ecosystem in
Georgia, which has an aggregated value of
GEL 3.5 billion. GHG is comprised of three
different business lines: healthcare services
business (consisting of hospitals and clinics),
pharmacy and distribution business and
medical insurance business. GHG’s shares
are listed on the London Stock Exchange.
GHG’s results are available at ghg.com.ge
Georgia Capital owns 57.0% of GHG at 31
December 2018 (31 December 2017: 57.0%).
GEL millions, unless otherwise noted
Key highlights 2018 2017 change
Revenue 849.9 747.8 13.7%
EBITDA 132.3 108.1 22.3%
Development
Capex 52.6 79.7 -34.1%
Maintenance
Capex 11.1 9.6 15.5%
FCF (12.7) 25.6 NMF
Cash from
operations 99.6 58.2 71.0%
Net debt 342.4 296.9 15.3%
Key performance metrics
Net investment 128,9
2018 dividend -
ROIC1 11.0%
ROIC adjusted2 13.9%
(1) Please see definition on page 53.
(2) Return on invested capital is adjusted to exclude
newly launched hospitals and polyclinics that are in
roll-out phase.
(3) Please refer to page 38 for the reconciliation of
FY18 stand-alone GHG net income to the
attributable income from GHG as reported under the
management account income statement on page 15.

35
Healthcare services EBITDA margin was 25.0% in 2H18 and 24.9% in 2018, compared to 26.4% in both 2H17 and 2017, reflecting the planned
significant investment and roll-out phase of newly launched hospitals and polyclinics. The EBITDA margin for referral hospitals and community
clinics was 25.7% in FY18 (27.2% in FY17). Excluding the dilutive effect of roll-outs, the EBITDA margin was towards targeted level, 28.7% in
FY18. The pharmacy and distribution business delivered outstanding performance and on the back of extracted procurement synergies posted
record high EBITDA margin above 10% in both 2H18 (10.5%) and 2018 (10.1%), substantially exceeding its “more than 8%” medium term target.
The medical insurance business made a solid contribution of GEL 3.3 million in 2H18 and GEL 4.1 million in 2018 to GHG’s EBITDA, after
improved operational efficiency over the last 18 months.
Cash flow highlights
Net cash flows from operating activities was up 71.0% y-o-y in 2018 to GEL 99.6 million on the back of strong EBITDA performance and a
substantially improved EBITDA to cash conversion ratio. After a number of hospital openings in 2018, benefits of the major investment
programme started to materilise and was reflected in the reduced working capital needs. As a result, EBITDA to cash conversion ratio improved
considerably, reaching 75.3%, which is expected to further improve going forward.
In FY18 GHG spent a total of GEL 63.7 million on capital expenditures (“capex”), of which maintenance capex was GEL 11.1 million. With the
opening of the Mega Laboratory (“Mega Lab”), GHG has now completed its three-year intensive capital expenditure phase. 2018 was the final
year of the major investment programme and investment volume slowed (development capex outflow down 34.1% y-o-y) as the projects
completed. With the improved operational cash flow and declining investment volume, the Group has stabilised the needs for new borrowings.
Net outflow from financing activities amounted to GEL 26.9 million, which reflects only marginal excess of new funding over the repaid
borrowings during the year and interest payments.
Please refer to GHG’s announcement for more details at
http://ghg.com.ge/uploads/files/GHG%20PLC%204Q%20and%20FY%202018%20Results.pdf

36
Reconciliation of adjusted IFRS measures to consolidated IFRS figures
Income statement reconciliation for FY18
GEL thousands, unless otherwise noted GHG BOG Water Utility Housing
Development
P&C
Insurance
Renewable
Energy
Hospitality
&
Commercial
Beverages Other Corporate
Center
Inter-
Business
Eliminations/
Consolidations
Group
Total
Income before income taxes, provisions and
adjustments 21,373 91,196 43,635 6,929 17,597 (645) 28,808 (19,590) (1,438) 48,690 - 236,555
Adjustment for dividend income accrual - - - - - - - - - (72,504) - (72,504)
Provision - - - - - - - - - 356 - 356
Net Income (Management accounts) 21,373 91,196 43,635 6,929 17,597 (645) 28,808 (19,590) (1,438) (23,458) - 164,407
Non-recurring expense (1,276) (15,846) (6,121) (6,224) (652) 375 (1,333) (1,418) 24 (23,449) - (55,920)
Net foreign currency (loss) / gain - - (4,969) (486) 137 (261) (1,083) (1,462) 88 (22,900) - (30,936)
Reversal of BoGG attributable earning - (75,350) - - - - - - - - - (75,350)
Adjustment for BOGG dividend income - - - - - - - - - 23,875 - 23,875
Profit attributable to non-controlling
shareholders 33,138 - - - - (285) 3 (6,446) - - - 26,410
Reversal of hotel revaluations for Group reporting
purposes - - - - - - - - - - (27,061) (27,061)
Reversal of FX gain on preferred stock issued by
m2 - - - - - - - - - - (1,894) (1,894)
Other - - - - - - - - - - (6,619) (6,619)
Profit for the period (IFRS Consolidated) 53,235 - 32,545 219 17,082 (816) 26,395 (28,916) (1,326) (45,932) (35,575) 16,911
Income statement reconciliation for FY17
GEL thousands, unless otherwise noted GHG BOG Water Utility Housing
Development
P&C
Insurance
Renewable
Energy
Hospitality
&
Commercial
Beverages Corporate
Center
Inter-
Business Eliminations/
Consolidations
Group
Total
Income before income taxes, provisions and
adjustments 20,890 - 39,156 22,140 16,091 (838) 3,090 (6,619) 13,602 - 107,512
Adjustment for dividend income accrual - - - - - - - - (35,000) - (35,000)
Provision - - - - - - - - (2,039) - (2,039)
Net Income (Management accounts) 20,890 - 39,156 22,140 16,091 (838) 3,090 (6,619) (23,437) - 70,473
Non-recurring expense (2,995) - (1,136) (127) - 8 (2) 507 - - (3,745)
Net foreign currency (loss) / gain - - (482) 41 209 (741) - (5,172) 7,508 - 1,363
Profit attributable to non-controlling
shareholders 27,955 - - - - 141 - (3,957) - - 24,139
Realized gain from sale portfolio company shares - - - - - - - - 90,275 (90,275) -
Other - - - - - - - - - 2,039 2,039
Profit for the period (IFRS Consolidated) 45,850 - 37,538 22,054 16,300 (1,430) 3,088 (15,241) 74,346 (88,236) 94,269

37
Balance sheet reconciliation, 31 December 2018
GEL thousands, unless otherwise noted GHG BOG Water
Utility
Housing
Development
P&C
Insurance
Renewable
Energy
Hospitality
&
Commercial
Beverages Other Corporate
Center
Inter-
Business
Eliminations/
Consolidations
Group
Total
Adjusted Values 520,332 457,495 431,017 66,785 130,524 61,182 149,079 61,027 5,933 (195,154) - 1,688,220
Fair Value Adjustment of private companies - - (160,531) - (71,949) - 1,894 22,344 - - - (208,242)
Reallocation from/to corporate center - - - - (2,341) - - (39,289) - 20,777 20,853 -
Substitution of GHG's market value by book value attributable to
shareholders of GCAP (224,643) - - - - - - - - - - (224,643)
Reversal of Hotel revaluations for Group reporting purposes - - - - - - - - - - (27,061) (27,061)
Provision of interest accrued on preferred stock - - - - - - - - - - 1,103 1,103
GHG Hospitals and clinics accounted at cost for GCAP consolidation
purposes - - - - - - - - - - (9,246) (9,246)
m2 long-term share-based compensation adjustment for consolidation
purposes - - - - - - - - - - (5,297) (5,297)
Transfer of Market value of 19.9% in BOG to Corporate Center - (457,495) - - - - - - - 457,495 - -
Foreign currency revaluation adjustment for Preferred stock - - - - - - (1,894) - - - - (1,894)
Reversal of goodwill recognized on acquisition of non-controlling stake in
Kindzamarauli - - - - - - - - - - (7,022) (7,022)
Other - - - - - - - - - - (4,103) (4,103)
Total equity attributable to shareholders of Georgia Capital (IFRS) 295,689 - 270,486 66,785 56,234 61,182 149,079 44,082 5,933 283,118 (30,773) 1,201,815
Balance sheet reconciliation, 31 December 2017
GEL thousands, unless otherwise noted GHG BOG Water
Utility
Housing
Development
P&C
Insurance
Renewable
Energy
Hospitality
&
Commercial
Beverages Corporate
Center
Inter-
Business Eliminations/
Consolidations
Group
Total
Adjusted Values 933,481 - 498,181 75,609 141,480 51,511 78,142 72,457 (10,414) - 1,840,447
Fair Value Adjustment of private companies - - (230,258) - (90,287) - - (8,820) (6) 6 (329,365)
Reallocation from/to corporate center - - - - (2,341) (34,221) - (6,128) 34,221 8,469 -
Substitution of GHG's market value by Book value attributable to
shareholders of GCAP (650,976) - - - - - - - - - (650,976)
Provision of interest accrued on preferred stock - - - - - - - - - 2,039 2,039
Deduction of GCAP’s shares held by portfolio companies - - - - - - - - - (2,751) (2,751)
GHG Hospitals and clinics accounted at cost for GCAP consolidation
purposes - - - - - - - - - (9,283) (9,283)
m2 long-term share-based compensation adjustment for consolidation
purposes - - - - - - - - - (2,317) (2,317)
Other - - - - - - - - - (3,131) (3,131)
Total equity attributable to shareholders of Georgia Capital (IFRS) 282,505 - 267,923 75,609 48,852 17,290 78,142 57,509 23,801 (6,968) 844,663

38
Reconciliation of stand-alone IFRS net income to Management Account Income Statement
Stand-alone IFRS income statement Management accounts
Net income (loss)
(1)
Net foreign currency loss
(gain)
(2)
Net non-recurring expense
(gain)
(3)
Net adjusted earnings of
portfolio companies
(4) = (1)+(2)+(3)
Attributable income to
GCAP22
GCAP (69,803) 22,896 23,449 (23,458) (23,458)
Attributable income of listed portfolio companies 431,881 - 81,815 513,696 112,569
of which, BoG PLC 378,642 - 79,628 458,270 91,196
of which, GHG PLC 53,239 - 2,187 55,426 21,373
Attributable income of private portfolio companies 45,107 7,426 16,599 69,132 75,296
Late stage 50,026 5,139 12,996 68,161 68,161
of which, Water Utility 32,545 4,970 6,120 43,635 43,635
of which, Housing Development 399 306 6,224 6,929 6,929
of which, P&C Insurance 17,082 (137) 652 17,597 17,597
Early stage (3,593) 2,375 3,626 2,408 8,573
of which, Renewable Energy (816) (577) 401 (992) (645)
of which, Hospitality and Commercial 26,396 1,073 1,339 28,808 28,808
of which, Beverages (29,173) 1,879 1,886 (25,408) (19,590)
Pipeline (1,326) (88) (23) (1,437) (1,438)
Total net income 407,185 30,322 121,863 559,370 164,407
22 Net adjusted earnings of portfolio companies multiplied by effective ownership stake of GCAP.

39
Detailed financial information
CONSOLIDATED IFRS INCOME STATEMENT
GEL thousands, unless otherwise noted 2H18 2H17 change 1H18 Change 2018 2017 Change
Revenue 666,699 586,256 13.7% 616,167 8.2% 1,282,866 1,127,170 13.8%
Cost of sales (406,156) (365,027) 11.3% (390,035) 4.1% (796,191) (695,709) 14.4%
Gross profit 260,543 221,229 17.8% 226,132 15.2% 486,675 431,461 12.8%
Operating expenses (146,170) (110,779) 31.9% (122,814) 19.0% (268,984) (213,340) 26.1%
EBITDA 114,373 110,450 3.6% 103,318 10.7% 217,691 218,121 -0.2%
Share in profit of associates 247 165 49.7% - NMF 247 376 -34.3%
Dividend income 23,875 - NMF - NMF 23,875 - NMF
Depreciation and amortisation (39,237) (29,774) 31.8% (34,918) 12.4% (74,155) (54,031) 37.2%
Net foreign currency (loss)/ gain (42,332) (7,992) NMF 4,786 NMF (37,546) (6,737) NMF
Interest income 12,573 5,115 NMF 10,702 17.5% 23,275 8,909 NMF
Interest expense (48,382) (31,369) 54.2% (43,237) 14.9% (91,619) (60,903) 50.4%
Net operating income before non-recurring items 21,117 46,595 -54.7% 40,651 -48.1% 61,768 105,735 -41.6%
Net non-recurring items (4,421) (1,960) NMF (36,830) -88.0% (41,251) (5,330) NMF
Profit before income tax expense 16,696 44,635 -62.6% 3,821 NMF 20,517 100,405 -79.6%
Income tax expense (2,140) (4,193) -49.0% (1,466) 46.0% (3,606) (6,136) -41.2%
Profit for the period 14,556 40,442 -64.0% 2,355 NMF 16,911 94,269 -82.1% Total profit / (loss) attributable to:
– shareholders of Georgia Capital PLC 3,648 29,634 -87.7% (13,144) NMF (9,496) 70,125 NMF
– non-controlling interests 10,908 10,808 0.9% 15,499 -29.6% 26,407 24,144 9.4%
– basic and diluted earnings per share 0.09 0.94 -90.4% (0.35) NMF (0.26) 2.34 NMF
CONSOLIDATED IFRS STATEMENT OF CASH FLOW
GEL thousands, unless otherwise noted 2018 2017 Change
Net Cash flow from operating activities 163,502 155,024 5.5%
Net cash flows used in investing activities (590,182) (428,494) 37.7%
Net cash from financing activities 296,946 522,340 -43.2% Effect of exchange rates changes on cash and cash equivalents (8,417) (12,657) -33.5%
Net (decrease) increase in cash and cash equivalents (138,151) 236,213 NMF Cash and cash equivalents, beginning of the year 346,241 158,868 NMF
Cash and cash equivalents of disposal group held for sale beginning of the year 48,840 - NMF
Cash and cash equivalents of disposal group held for sale, end of the year - 48,840 NMF
Cash and cash equivalents, end of the year 256,930 346,241 -25.8%
IFRS consolidated accounts

40
CONSOLIDATED BALANCE SHEET
GEL thousands, unless otherwise noted Dec-18 Dec-17 Change
Cash and cash equivalents 256,930 346,241 -25.8%
Amounts due from credit institutions 40,299 38,141 5.7%
Debt securities owned 71,824 31,907 NMF
Equity investments at fair value 457,495 1,153 NMF
Accounts receivable 170,228 35,337 NMF
Insurance premiums receivable 57,801 30,855 87.3%
Inventories 278,615 80,110 NMF
Investment properties 151,232 159,989 -5.5%
Prepayments 117,909 87,760 34.4%
Income tax assets 2,405 1,374 75.0%
Property and equipment 1,671,917 657,635 NMF
Goodwill 142,095 21,935 NMF
Intangible assets 51,634 5,457 NMF
Other assets 251,462 69,870 NMF
Assets of disposal group held for sale - 1,148,584 NMF
Total assets 3,721,846 2,716,348 37.0%
Accounts payable 143,114 42,987 NMF
Insurance contracts liabilities 68,207 46,403 47.0%
Income tax liabilities 1,119 860 30.1%
Deferred income 62,059 73,066 -15.1%
Borrowings 764,355 650,734 17.5%
Debt securities issued 916,401 77,835 NMF
Other liabilities 235,771 63,206 NMF
Liabilities of disposal group held for sale - 619,029 NMF
Total liabilities 2,191,026 1,574,120 39.2% Total equity attributable to shareholders of Georgia Capital PLC 1,201,815 844,663 42.3%
Non-controlling interests 329,005 297,565 10.6%
Total equity 1,530,820 1,142,228 34.0%
Total liabilities and equity 3,721,846 2,716,348 37.0%

41
Fair value NAV comparison with book value NAV
Georgia Capital Number
of Shares Ownership % Fair value Book value Change amount Change (%)
GEL thousands unless otherwise noted 31-Dec-18 31-Dec-18
Listed portfolio companies 977,827 977,827 - 0.0%
Georgia Healthcare Group PLC 75,118,503 57.0% 520,332 520,332 - 0.0%
Bank of Georgia Group PLC 9,784,716 19.9% 457,495 457,495 - 0.0%
Private portfolio companies 905,547 697,305 208,242 29.9%
Late Stage 628,326 395,846 232,480 58.7%
Water Utility 100.0% 431,017 270,486 160,531 59.3%
Housing Development 100.0% 66,785 66,785 - 0.0%
P&C Insurance 100.0% 130,524 58,575 71,949 NMF
Early Stage 271,288 295,526 (24,238) -8.2%
Renewable Energy 65.0% 61,182 61,182 - 0.0%
Hospitality and Commercial 100.0% 149,079 150,973 (1,894) -1.3%
Beverage 80.0% 61,027 83,371 (22,344) -26.8%
Pipeline (at cost) 5,933 5,933 - 0.0%
Education 7,071 7,071 - 0.0%
Other 100.0% (1,138) (1,138) - 0.0%
Total Portfolio Value 1,883,374 1,675,132 208,242 12.4%
Net Debt (196,915) (196,915) - 0.0%
of which, Cash and liquid funds 299,650 299,650 - 0.0%
of which, Loans issued 305,480 305,480 - 0.0%
of which, Gross Debt (802,045) (802,045) - 0.0%
Net other assets/ (liabilities) 1,762 1,762 - 0.0%
Net Asset Value 1,688,221 1,479,979 208,242 14.1%
Shares outstanding 35,816,947 35,816,947 - 0.0%
Net Asset Value per share (GEL) 47.13 41.32 5.81 14.1%
Net Asset Value per share (GBP) 13.88 12.17 1.71 14.1%
Management accounts

42
GCAP CASH FLOW HIGHLIGHTS
2H18 2H17 Change 1H18 Change FY18 FY17 Change
Gel thousands unless otherwise noted y-o-y h-o-h y-o-y Dividends received 62,446 28,000 NMF 10,000 NMF 72,446 28,000 NMF Interest received 17,484 1,267 NMF 10,426 67.7% 27,909 1,457 NMF Interest paid (24,053) - NMF (21,785) 10.4% (45,838) - NMF Cash outflow from Operations before operating expenses 55,877 29,267 90.9% (1,359) NMF 54,517 29,457 85.1% GCAP operating expenses (7,726) (884) NMF (2,787) NMF (10,513) (1,129) NMF Cash outflow from operations 48,151 28,383 69.6% (4,147) NMF 44,004 28,328 55.3% Investments in portfolio companies (8,217) (16,738) -50.9% (19,700) -58.3% (27,917) (28,196) -1.0% Loans Issued (25,467) - NMF (249,635) -89.8% (275,102) (7,000) NMF Investments in preferred stock of portfolio companies (38,102) - NMF (19,029) NMF (57,131) - NMF Proceeds from sale of shares in portfolio companies - - NMF - NMF - 108,780 NMF Purchase of PPE (924) - NMF - NMF (924) - NMF Cash outflow on investing activities (72,710) (16,738) NMF (288,364) -74.8% (361,074) 73,584 NMF Share buybacks (37,834) - NMF (49,580) -23.7% (87,414) - NMF Cash outflow on buybacks (37,834) - NMF (49,580) -23.7% (87,414) - NMF Increase in capital - 44,826 NMF - NMF - 47,075 NMF Proceeds from debt securities issued - - NMF 715,729 -100.0% 715,729 - NMF Repayment of borrowings from former parent company - (11,636) NMF (248,295) -100.0% (248,295) (19,617) NMF Proceeds from borrowings - 119,030 NMF - NMF - 125,330 NMF Cash inflow from financing activities - 152,220 NMF 467,434 -100.0% 467,434 152,788 NMF Demerger related outflows (8,352) - NMF (24,245) -65.6% (32,597) - NMF Fx Effect & Fair valuation 18,393 7,185 NMF (13,642) NMF 4,751 6,606 -28.1% Net cash flow (52,352) 171,050 NMF 87,456 NMF 35,104 261,306 -86.6% Beginning cash and liquid funds 352,002 93,496 NMF 264,546 33.1% 264,546 3,240 NMF Ending cash and liquid funds 299,650 264,546 13.3% 352,002 -14.9% 299,650 264,546 13.3%

43
Private portfolio companies – IFRS Accounts
INCOME STATEMENT Water Utility STATEMENT OF CASH FLOW Water Utility
GEL thousands, unless otherwise noted 2H18 2H17 Change 1H18 Change FY18 FY17 Change GEL thousands, unless otherwise noted 2H18 2H17 Change 1H18 Change FY18 FY17 Change Revenue from water supply to legal
entities 50,078 47,055 6.4% 42,150 18.8% 92,228 85,983 7.3%
Cash received from customers 78,442 74,645 5.1% 66,031 18.8% 144,473 131,403 9.9%
Revenue from water supply to
individuals 19,984 16,869 18.5% 19,602 1.9% 39,586 32,921 20.2%
Cash paid to suppliers (20,810) (22,132) -6.0% (18,096) 15.0% (38,906) (38,932) -0.1%
Revenue from electric power sales 4,330 6,661 -35.0% 4,722 -8.3% 9,052 9,755 -7.2% Cash paid to employees (8,381) (8,367) 0.2% (9,246) -9.4% (17,627) (16,514) 6.7%
Revenue from technical support 1,438 1,192 20.6% 1,303 10.4% 2,741 2,604 5.3% Interest received 245 936 -73.8% 235 4.3% 480 1,501 -68.0%
Other income 3,465 2,642 31.2% 2,055 68.6% 5,520 3,737 47.7% Taxes paid 1,502 (4,033) NMF (8,332) NMF (6,830) (7,308) -6.5%
Revenue 79,295 74,419 6.6% 69,832 13.6% 149,127 135,000 10.5%
Cash flow from operating activities before
maintenance capex 50,998 41,049 24.2% 30,592 66.7% 81,590 70,150 16.3%
Salaries and benefits (9,139) (9,622) -5.0% (9,476) -3.6% (18,615) (18,920) -1.6%
Electricity and transmission costs (9,334) (9,418) -0.9% (9,361) -0.3% (18,695) (18,303) 2.1% Maintenance capex (10,096) (9,002) 12.2% (12,444) -18.9% (22,540) (23,203) -2.9%
Other operating expenses (12,684) (13,355) -5.0% (10,741) 18.1% (23,425) (23,529) -0.4% Operating cash flow 40,902 32,047 27.6% 18,148 NMF 59,050 46,947 25.8%
Operating expenses (31,157) (32,395) -3.8% (29,578) 5.3% (60,735) (60,752) 0.0% Purchase of PPE and intangible assets (71,383) (77,810) -8.3% (77,070) -7.4% (148,453) (113,605) 30.7%
Provisions for doubtful trade
receivables (2,011) (550) NMF (3,022) -33.5% (5,033) (1,675) NMF
Proceeds from PPE and investment property
sale 570 - NMF 1,458 -60.9% 2,028 - NMF
EBITDA 46,127 41,474 11.2% 37,232 23.9% 83,359 72,573 14.9% CAPEX VAT 6,607 7,238 -8.7% 8,193 -19.4% 14,800 11,134 32.9%
EBITDA Margin 58% 56% 53% 56% 54% Restricted cash in Bank 3,024 (3,914) NMF 3,509 -13.8% 6,533 (2,553) NMF
Depreciation and amortization (13,308) (10,393) 28.0% (12,085) 10.1% (25,393) (20,213) 25.6% Total cash used in investing activities (61,182) (74,486) -17.9% (63,910) -4.3% (125,092) (105,024) 19.1%
EBIT 32,819 31,081 5.6% 25,147 30.5% 57,966 52,360 10.7% Proceeds from borrowings 44,105 219,570 -79.9% 27,522 60.3% 71,627 252,516 -71.6%
EBIT Margin 41% 42% 36% 39% 39% Repayment of borrowings (442) (109,344) -99.6% (297) 48.8% (739) (118,337) -99.4%
Net interest expense (7,077) (7,283) -2.8% (7,253) -2.4% (14,330) (12,408) 15.5% Interest paid (10,722) (7,564) 41.8% (9,718) 10.3% (20,440) (12,831) 59.3%
Net non-recurring expenses (637) (884) -27.9% (5,484) -88.4% (6,121) (1,135) NMF Dividend paid (28,840) (28,244) 2.1% - NMF (28,840) (28,244) 2.1%
Foreign exchange (loss) gain (9,360) (419) NMF 4,390 NMF (4,970) (482) NMF Contributions under share-based payment plan (1,529) (4,941) -69.1% (779) 96.3% (2,308) (4,941) -53.3%
EBT 15,745 22,495 -30.0% 16,800 -6.3% 32,545 38,335 -15.1% Total cash flow from financing activities 2,572 69,477 -96.3% 16,728 -84.6% 19,300 88,163 -78.1%
Profit 15,745 21,951 -28.3% 16,800 -6.3% 32,545 37,401 -13.0% Effect of exchange rates changes on cash 946 4,746 -80.1% (2,454) NMF (1,508) 4,365 NMF
Total cash (outflow)/inflow (16,762) 31,784 NMF (31,488) -46.8% (48,250) 34,451 NMF
Cash, beginning balance 30,475 30,179 1.0% 61,963 -50.8% 61,963 27,512 NMF
Cash, ending balance 13,713 61,963 -77.9% 30,475 -55.0% 13,713 61,963 -77.9%
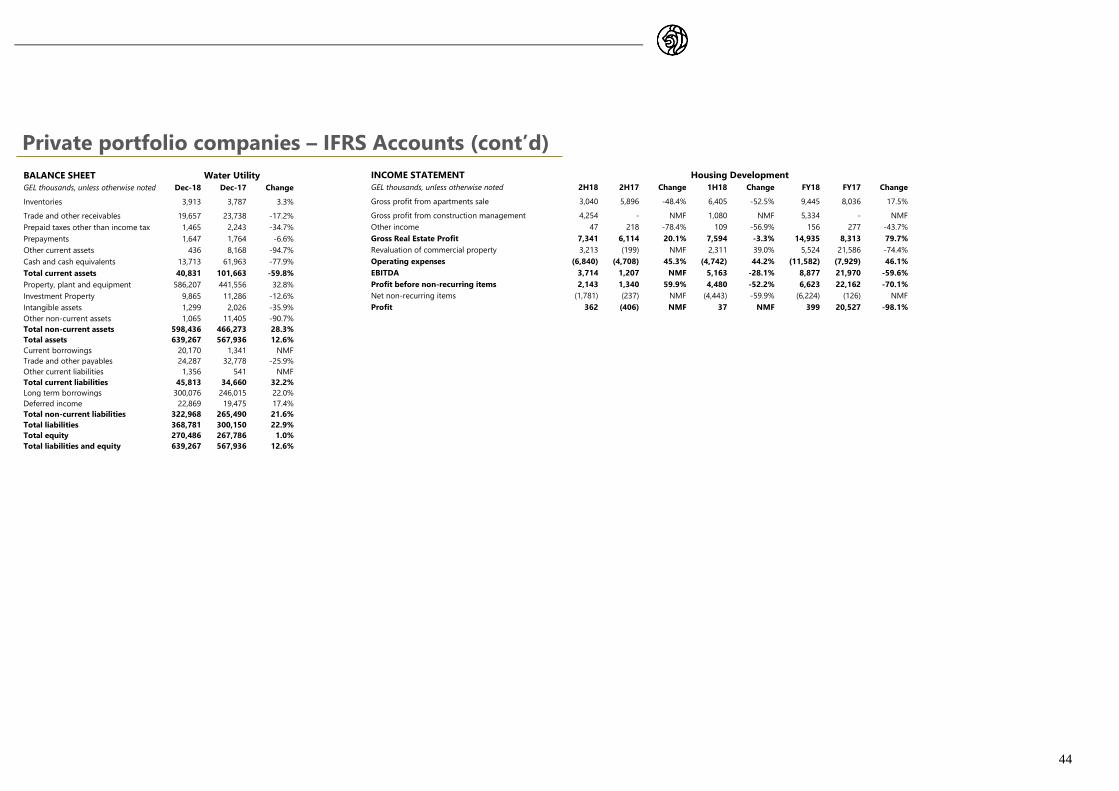
44
Private portfolio companies – IFRS Accounts (cont’d)
BALANCE SHEET Water Utility INCOME STATEMENT Housing Development
GEL thousands, unless otherwise noted Dec-18 Dec-17 Change GEL thousands, unless otherwise noted 2H18 2H17 Change 1H18 Change FY18 FY17 Change
Inventories 3,913 3,787 3.3% Gross profit from apartments sale 3,040 5,896 -48.4% 6,405 -52.5% 9,445 8,036 17.5% Trade and other receivables 19,657 23,738 -17.2% Gross profit from construction management 4,254 - NMF 1,080 NMF 5,334 - NMF Prepaid taxes other than income tax 1,465 2,243 -34.7% Other income 47 218 -78.4% 109 -56.9% 156 277 -43.7% Prepayments 1,647 1,764 -6.6% Gross Real Estate Profit 7,341 6,114 20.1% 7,594 -3.3% 14,935 8,313 79.7% Other current assets 436 8,168 -94.7% Revaluation of commercial property 3,213 (199) NMF 2,311 39.0% 5,524 21,586 -74.4% Cash and cash equivalents 13,713 61,963 -77.9% Operating expenses (6,840) (4,708) 45.3% (4,742) 44.2% (11,582) (7,929) 46.1% Total current assets 40,831 101,663 -59.8% EBITDA 3,714 1,207 NMF 5,163 -28.1% 8,877 21,970 -59.6% Property, plant and equipment 586,207 441,556 32.8% Profit before non-recurring items 2,143 1,340 59.9% 4,480 -52.2% 6,623 22,162 -70.1% Investment Property 9,865 11,286 -12.6% Net non-recurring items (1,781) (237) NMF (4,443) -59.9% (6,224) (126) NMF Intangible assets 1,299 2,026 -35.9% Profit 362 (406) NMF 37 NMF 399 20,527 -98.1% Other non-current assets 1,065 11,405 -90.7%
Total non-current assets 598,436 466,273 28.3%
Total assets 639,267 567,936 12.6%
Current borrowings 20,170 1,341 NMF
Trade and other payables 24,287 32,778 -25.9%
Other current liabilities 1,356 541 NMF
Total current liabilities 45,813 34,660 32.2%
Long term borrowings 300,076 246,015 22.0%
Deferred income 22,869 19,475 17.4%
Total non-current liabilities 322,968 265,490 21.6%
Total liabilities 368,781 300,150 22.9%
Total equity 270,486 267,786 1.0%
Total liabilities and equity 639,267 567,936 12.6%

45
Private portfolio companies – IFRS Accounts (cont’d)
STATEMENT OF CASH FLOW Housing Development BALANCE SHEET Housing Development
GEL thousands, unless otherwise noted 2H18 2H17 Change 1H18 Change FY18 FY17 Change GEL thousands, unless otherwise noted Dec-18 Dec-17 Change
Proceeds from sales of apartments 43,555 66,595 -34.6% 37,137 17.3% 80,692 112,215 -28.1% Cash and cash equivalents 8,833 19,945 -55.7%
Outflows for development (31,273) (43,213) -27.6% (45,293) -31.0% (76,566) (79,820) -4.1% Amounts due from credit institutions 1,634 114 NMF
Net proceeds from construction services 2,412 - NMF (2,619) NMF (207) - NMF Investment securities 512 3,205 -84.0%
Cash paid for operating expenses (6,724) (3,987) 68.6% (7,349) -8.5% (14,073) (8,884) 58.4% Accounts receivable and other loans 6,063 333 NMF
Income tax paid - (1,000) NMF - NMF - (4,854) NMF Prepayments 33,976 36,226 -6.2%
Net cash flows from operating activities 7,970 18,395 -56.7% (18,124) NMF (10,154) 18,657 NMF Inventories 105,307 59,199 77.9%
Capital expenditure on investment property and PPE (6,530) (4,166) 56.7% (7,161) -8.8% (13,691) (9,292) 47.3% Investment property 52,603 93,373 -43.7%
Net cash flows used in investing activities (6,530) (4,166) 56.7% (7,161) -8.8% (13,691) (9,292) 47.3% Land bank 8,722 58,373 -85.1%
Net Intersegment loans received/(issued) 8,835 (12,997) NMF 28,925 -69.5% 37,760 (18,543) NMF Commercial real estate 43,881 35,000 25.4%
Repayment of debt securities issued - - NMF - NMF - (34,099) NMF Property and equipment 8,232 4,214 95.3%
Contributions under share-based payment plan - (7,652) NMF (1,280) -100.0% (1,280) (7,652) -83.3% Other assets 33,832 29,043 16.5%
Proceeds from borrowings - - NMF 41,615 -100.0% 41,615 19,421 NMF Total assets 250,992 245,652 2.2%
Repayment of borrowings - (15,801) NMF (42,465) -100.0% (42,465) (16,908) NMF Amounts due to credit institutions 46,069 44,243 4.1%
Interest paid (4,481) (4,833) -7.3% (4,554) -1.6% (9,035) (10,345) -12.7% Debt securities issued 67,697 65,122 4.0%
Dividend paid (10,000) - NMF - NMF (10,000) - NMF Deferred income 23,009 46,660 -50.7%
Capital reallocation - (9,773) NMF - NMF - (9,773) NMF Other liabilities 46,175 12,952 NMF
Net cash flows from financing activities (5,646) (51,056) -88.9% 22,241 NMF 16,595 (77,899) NMF Total liabilities 182,950 168,977 8.3%
Exchange (losses)/gains on cash equivalents 829 6,163 -86.5% (3,171) NMF (2,342) (374) NMF Total equity 68,042 76,675 -11.3%
Total cash outflow (3,377) (30,664) -89.0% (6,215) -45.7% (9,592) (68,908) -86.1% Total liabilities and equity 250,992 245,652 2.2%
Cash, beginning balance 13,844 50,723 -72.7% 20,059 -31.0% 20,059 88,967 -77.5%
Cash, ending balance 10,467 20,059 -47.8% 13,844 -24.4% 10,467 20,059 -47.8%
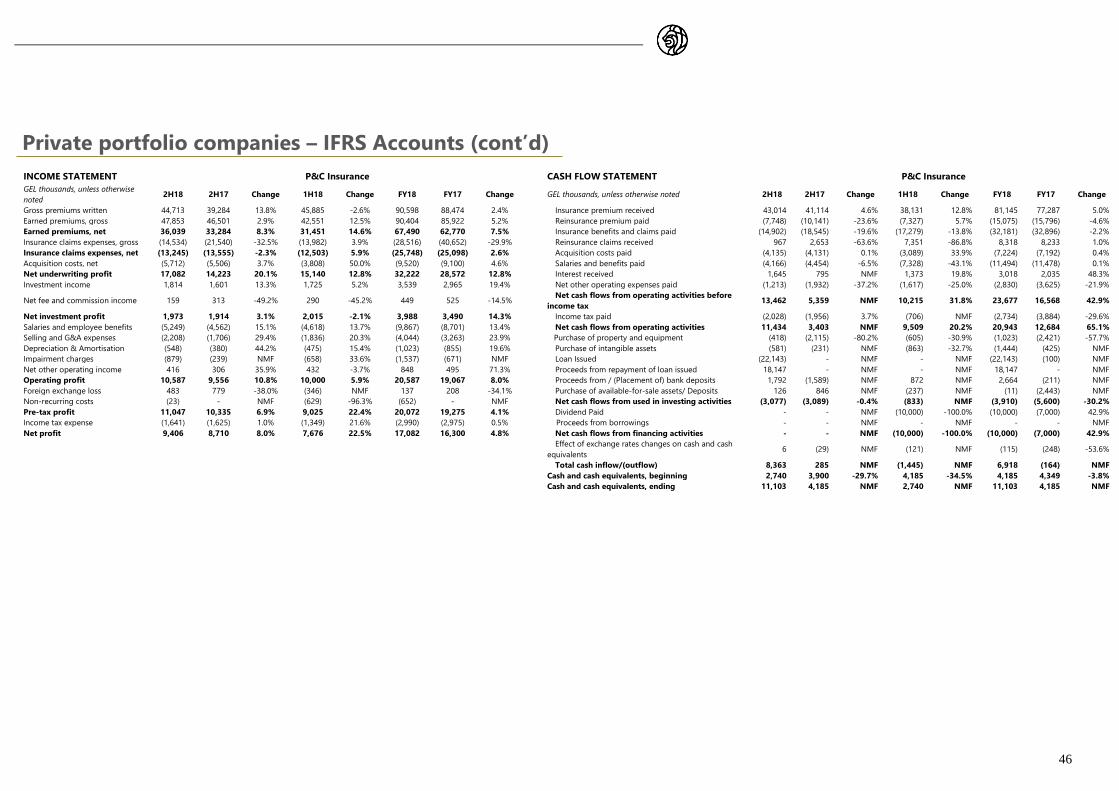
46
Private portfolio companies – IFRS Accounts (cont’d)
INCOME STATEMENT P&C Insurance CASH FLOW STATEMENT P&C Insurance
GEL thousands, unless otherwise
noted 2H18 2H17 Change 1H18 Change FY18 FY17 Change GEL thousands, unless otherwise noted 2H18 2H17 Change 1H18 Change FY18 FY17 Change
Gross premiums written 44,713 39,284 13.8% 45,885 -2.6% 90,598 88,474 2.4% Insurance premium received 43,014 41,114 4.6% 38,131 12.8% 81,145 77,287 5.0%
Earned premiums, gross 47,853 46,501 2.9% 42,551 12.5% 90,404 85,922 5.2% Reinsurance premium paid (7,748) (10,141) -23.6% (7,327) 5.7% (15,075) (15,796) -4.6%
Earned premiums, net 36,039 33,284 8.3% 31,451 14.6% 67,490 62,770 7.5% Insurance benefits and claims paid (14,902) (18,545) -19.6% (17,279) -13.8% (32,181) (32,896) -2.2%
Insurance claims expenses, gross (14,534) (21,540) -32.5% (13,982) 3.9% (28,516) (40,652) -29.9% Reinsurance claims received 967 2,653 -63.6% 7,351 -86.8% 8,318 8,233 1.0%
Insurance claims expenses, net (13,245) (13,555) -2.3% (12,503) 5.9% (25,748) (25,098) 2.6% Acquisition costs paid (4,135) (4,131) 0.1% (3,089) 33.9% (7,224) (7,192) 0.4%
Acquisition costs, net (5,712) (5,506) 3.7% (3,808) 50.0% (9,520) (9,100) 4.6% Salaries and benefits paid (4,166) (4,454) -6.5% (7,328) -43.1% (11,494) (11,478) 0.1%
Net underwriting profit 17,082 14,223 20.1% 15,140 12.8% 32,222 28,572 12.8% Interest received 1,645 795 NMF 1,373 19.8% 3,018 2,035 48.3%
Investment income 1,814 1,601 13.3% 1,725 5.2% 3,539 2,965 19.4% Net other operating expenses paid (1,213) (1,932) -37.2% (1,617) -25.0% (2,830) (3,625) -21.9%
Net fee and commission income 159 313 -49.2% 290 -45.2% 449 525 -14.5% Net cash flows from operating activities before
income tax 13,462 5,359 NMF 10,215 31.8% 23,677 16,568 42.9%
Net investment profit 1,973 1,914 3.1% 2,015 -2.1% 3,988 3,490 14.3% Income tax paid (2,028) (1,956) 3.7% (706) NMF (2,734) (3,884) -29.6%
Salaries and employee benefits (5,249) (4,562) 15.1% (4,618) 13.7% (9,867) (8,701) 13.4% Net cash flows from operating activities 11,434 3,403 NMF 9,509 20.2% 20,943 12,684 65.1%
Selling and G&A expenses (2,208) (1,706) 29.4% (1,836) 20.3% (4,044) (3,263) 23.9% Purchase of property and equipment (418) (2,115) -80.2% (605) -30.9% (1,023) (2,421) -57.7%
Depreciation & Amortisation (548) (380) 44.2% (475) 15.4% (1,023) (855) 19.6% Purchase of intangible assets (581) (231) NMF (863) -32.7% (1,444) (425) NMF
Impairment charges (879) (239) NMF (658) 33.6% (1,537) (671) NMF Loan Issued (22,143) - NMF - NMF (22,143) (100) NMF
Net other operating income 416 306 35.9% 432 -3.7% 848 495 71.3% Proceeds from repayment of loan issued 18,147 - NMF - NMF 18,147 - NMF
Operating profit 10,587 9,556 10.8% 10,000 5.9% 20,587 19,067 8.0% Proceeds from / (Placement of) bank deposits 1,792 (1,589) NMF 872 NMF 2,664 (211) NMF
Foreign exchange loss 483 779 -38.0% (346) NMF 137 208 -34.1% Purchase of available-for-sale assets/ Deposits 126 846 NMF (237) NMF (11) (2,443) NMF
Non-recurring costs (23) - NMF (629) -96.3% (652) - NMF Net cash flows from used in investing activities (3,077) (3,089) -0.4% (833) NMF (3,910) (5,600) -30.2%
Pre-tax profit 11,047 10,335 6.9% 9,025 22.4% 20,072 19,275 4.1% Dividend Paid - - NMF (10,000) -100.0% (10,000) (7,000) 42.9%
Income tax expense (1,641) (1,625) 1.0% (1,349) 21.6% (2,990) (2,975) 0.5% Proceeds from borrowings - - NMF - NMF - - NMF
Net profit 9,406 8,710 8.0% 7,676 22.5% 17,082 16,300 4.8% Net cash flows from financing activities - - NMF (10,000) -100.0% (10,000) (7,000) 42.9%
Effect of exchange rates changes on cash and cash
equivalents 6 (29) NMF (121) NMF (115) (248) -53.6%
Total cash inflow/(outflow) 8,363 285 NMF (1,445) NMF 6,918 (164) NMF Cash and cash equivalents, beginning 2,740 3,900 -29.7% 4,185 -34.5% 4,185 4,349 -3.8%
Cash and cash equivalents, ending 11,103 4,185 NMF 2,740 NMF 11,103 4,185 NMF
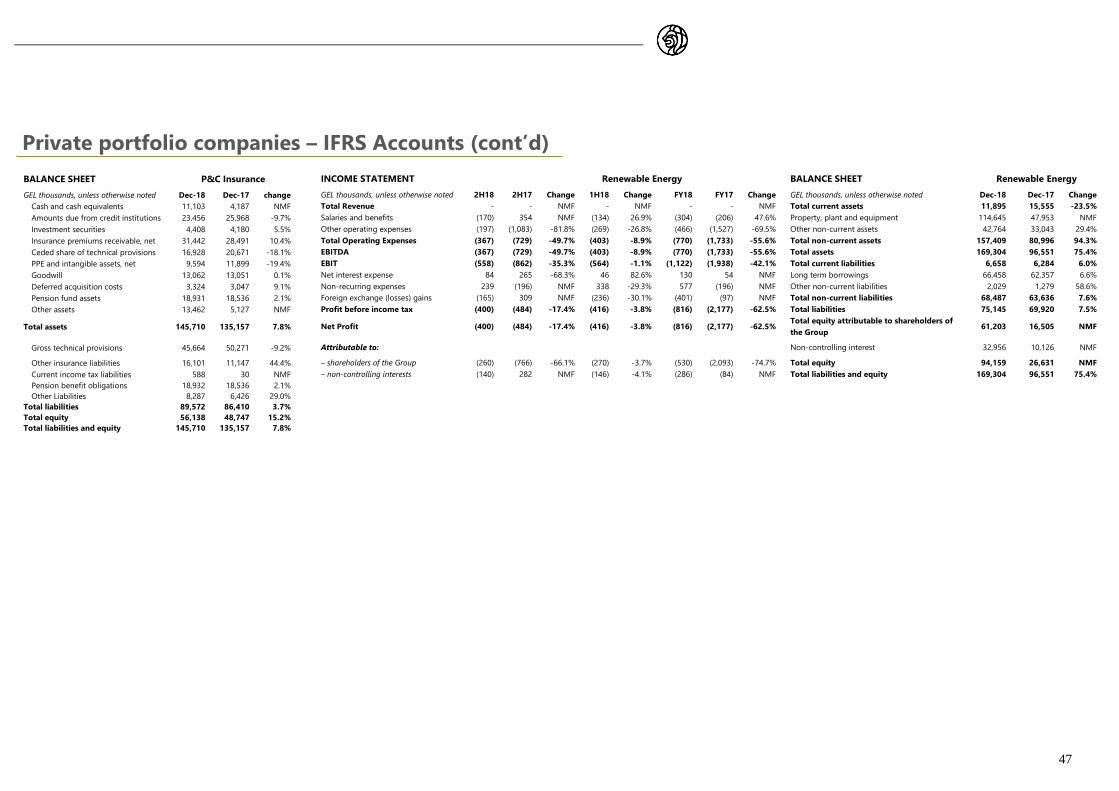
47
Private portfolio companies – IFRS Accounts (cont’d)
BALANCE SHEET P&C Insurance INCOME STATEMENT Renewable Energy BALANCE SHEET Renewable Energy
GEL thousands, unless otherwise noted Dec-18 Dec-17 change GEL thousands, unless otherwise noted 2H18 2H17 Change 1H18 Change FY18 FY17 Change GEL thousands, unless otherwise noted Dec-18 Dec-17 Change
Cash and cash equivalents 11,103 4,187 NMF Total Revenue - - NMF - NMF - - NMF Total current assets 11,895 15,555 -23.5%
Amounts due from credit institutions 23,456 25,968 -9.7% Salaries and benefits (170) 354 NMF (134) 26.9% (304) (206) 47.6% Property, plant and equipment 114,645 47,953 NMF
Investment securities 4,408 4,180 5.5% Other operating expenses (197) (1,083) -81.8% (269) -26.8% (466) (1,527) -69.5% Other non-current assets 42,764 33,043 29.4%
Insurance premiums receivable, net 31,442 28,491 10.4% Total Operating Expenses (367) (729) -49.7% (403) -8.9% (770) (1,733) -55.6% Total non-current assets 157,409 80,996 94.3%
Ceded share of technical provisions 16,928 20,671 -18.1% EBITDA (367) (729) -49.7% (403) -8.9% (770) (1,733) -55.6% Total assets 169,304 96,551 75.4%
PPE and intangible assets, net 9,594 11,899 -19.4% EBIT (558) (862) -35.3% (564) -1.1% (1,122) (1,938) -42.1% Total current liabilities 6,658 6,284 6.0%
Goodwill 13,062 13,051 0.1% Net interest expense 84 265 -68.3% 46 82.6% 130 54 NMF Long term borrowings 66,458 62,357 6.6%
Deferred acquisition costs 3,324 3,047 9.1% Non-recurring expenses 239 (196) NMF 338 -29.3% 577 (196) NMF Other non-current liabilities 2,029 1,279 58.6%
Pension fund assets 18,931 18,536 2.1% Foreign exchange (losses) gains (165) 309 NMF (236) -30.1% (401) (97) NMF Total non-current liabilities 68,487 63,636 7.6%
Other assets 13,462 5,127 NMF Profit before income tax (400) (484) -17.4% (416) -3.8% (816) (2,177) -62.5% Total liabilities 75,145 69,920 7.5%
Total assets 145,710 135,157 7.8% Net Profit (400) (484) -17.4% (416) -3.8% (816) (2,177) -62.5% Total equity attributable to shareholders of
the Group 61,203 16,505 NMF
Gross technical provisions 45,664 50,271 -9.2% Attributable to: Non-controlling interest 32,956 10,126 NMF
Other insurance liabilities 16,101 11,147 44.4% – shareholders of the Group (260) (766) -66.1% (270) -3.7% (530) (2,093) -74.7% Total equity 94,159 26,631 NMF
Current income tax liabilities 588 30 NMF – non-controlling interests (140) 282 NMF (146) -4.1% (286) (84) NMF Total liabilities and equity 169,304 96,551 75.4%
Pension benefit obligations 18,932 18,536 2.1%
Other Liabilities 8,287 6,426 29.0%
Total liabilities 89,572 86,410 3.7%
Total equity 56,138 48,747 15.2%
Total liabilities and equity 145,710 135,157 7.8%

48
Private portfolio companies – IFRS Accounts (cont’d)
CASH FLOW STATEMENT Renewable Energy INCOME STATEMENT Hospitality & Commercial Real Estate
GEL thousands, unless otherwise noted 2H18 2H17 Change 1H18 Change FY18 FY17 Change GEL thousands, unless otherwise noted 2H18 2H17 Change 1H18 Change FY18 FY17 Change
Cash paid to suppliers (459) 170 NMF (171) NMF (630) (1,335) -52.8% Gross profit from operating leases 2,688 1,543 74.2% 1,900 41.5% 4,588 3,042 50.8% Cash paid to employees 35 536 -93.5% (244) NMF (209) (223) -6.3% Gross profit from hospitality services 1,488 - NMF 457 NMF 1,945 - NMF Interest received 97 87 11.5% 46 NMF 143 92 55.4% Other income 178 - NMF 50 NMF 228 - NMF Cash flow from operating activities (327) 793 NMF (369) -11.4% (696) (1,466) -52.5% Gross Real Estate Profit 4,354 1,543 NMF 2,407 80.9% 6,761 3,042 NMF Purchase of PPE and intangible assets (47,693) (65,912) -27.6% (20,565) NMF (68,258) (76,565) -10.8% Revaluation on commercial property 27,621 977 NMF - NMF 27,621 977 NMF VAT return 5,000 6,856 -27.1% 963 NMF 5,963 6,635 -10.1% Operating expenses (2,285) (484) NMF (556) NMF (2,841) (650) NMF Restricted cash in Bank - 12,403 NMF - NMF - 154 NMF NOI 29,690 2,036 NMF 1,851 NMF 31,541 3,369 NMF Total cash flow used in investing
activities (42,693) (46,653) -8.5% (19,602) NMF (62,295) (69,776) -10.7% Profit before non-recurring items 26,958 1,938 NMF 777 NMF 27,735 3,183 NMF
Proceeds from borrowings 37,218 21,964 69.5% 18,276 NMF 55,494 57,268 -3.1% Net non-recurring items (152) (8) NMF (1,187) -87.2% (1,339) (2) NMF Capital increase 2,293 6,967 -67.1% 5,441 -57.9% 7,734 16,801 -54.0% Profit before income tax 26,806 1,930 NMF (410) NMF 26,396 3,181 NMF Total cash flow used in financing
activities 39,511 28,931 36.6% 23,717 66.6% 63,228 74,069 -14.6% Profit 26,806 1,884 NMF (410) NMF 26,396 3,135 NMF
Exchange (losses)/gains on cash
equivalents 546 1,198 -54.4% (693) NMF (147) 604 NMF
Total cash inflow/(outflow) (2,963) (15,731) -81.2% 3,053 NMF 90 3,431 -97.4%
Cash, beginning balance 11,351 24,029 -52.8% 8,298 36.8% 8,298 4,867 70.5%
Cash, ending balance 8,388 8,298 1.1% 11,351 -26.1% 8,388 8,298 1.1%
✓ R
e
n
e
w
a
b
l
e
e
n
e
r
g
y
b
u
s
i
n
e
s
s

49
Private portfolio companies – IFRS Accounts (cont’d)
CASH FLOW STATEMENT Hospitality & Commercial Real Estate BALANCE SHEET Hospitality & Commercial Real
Estate GEL thousands, unless otherwise noted 2H18 2H17 Change 1H18 Change FY18 FY17 Change GEL thousands, unless otherwise noted Dec-18 Dec-17 change
Net proceeds from rent generating assets 3,290 1,555 NMF 2,124 54.9% 5,414 3,042 78.0% Cash and cash equivalents, bank placements 28,615 14,805 93.3%
Net proceeds from hospitality services 1,756 - NMF 539 NMF 2,295 - NMF Prepayments 15,713 3,436 NMF
Other operating expenses paid (983) (205) NMF (1,056) -6.9% (2,039) (353) NMF Investment property 225,343 56,770 NMF
Net cash flows from operating activities 4,063 1,350 NMF 1,607 NMF 5,670 2,689 NMF Land bank 37,459 14,529 NMF
Acquisition of investment property (16,715) - NMF (36,760) -54.5% (53,475) (1,401) NMF Commercial real estate 187,884 42,241 NMF
Capital expenditure on investment property (13,328) (13,678) -2.6% (14,197) -6.1% (27,525) (20,520) 34.1% Property and equipment 172 45,427 -99.6%
VAT return 8,574 - NMF - NMF 8,574 - NMF Other assets 24,990 9,584 NMF
Loans issued (6,303) - NMF (715) NMF (7,018) - NMF Total assets 294,833 130,022 NMF
Acquisition of subsidiaries - (10,562) NMF - NMF - (10,562) NMF Borrowings 104,557 14,749 NMF
Net cash flows used in investing activities (27,772) (24,240) 14.6% (51,672) -46.3% (79,444) (32,483) NMF Debt securities issued 19,609 - NMF
Proceeds from preferred stock issued 32,914 - NMF - NMF 32,914 - NMF Other liabilities 10,828 27,318 -60.4%
Proceeds from debt securities issued 19,609 - NMF - NMF 19,609 - NMF Total liabilities 134,994 42,067 NMF
Contributions under share-based payment plan (1) (304) -99.7% (81) -98.8% (82) (304) -73.0% Total equity attributable to shareholders of the Group 149,078 77,537 92.3%
Proceeds from borrowings 4,766 12,696 -62.5% 91,031 -94.8% 95,797 12,696 NMF Non-controlling interest 10,761 10,418 3.3%
Repayment of borrowings (2,209) 114 NMF (17,191) -87.2% (19,400) - NMF Total equity 159,839 87,955 81.7%
Net intragroup loans (repaid)/ received (10,295) 12,997 NMF (27,465) -62.5% (37,760) 18,543 NMF Total liabilities and equity 294,833 130,022 NMF Capital Reallocation - 9,773 NMF - NMF - 9,773 NMF
Interest paid (1,718) (242) NMF (1,625) 5.7% (3,343) (336) NMF
Net cash flows from financing activities 43,066 35,034 22.9% 44,669 -3.6% 87,735 40,372 NMF Effect of exchange rate changes on cash and cash
equivalents 49 182 -73.1% (200) NMF (151) (15) NMF
Total cash inflow/(outflow) 19,406 12,326 57.4% (5,596) NMF 13,810 10,563 30.7% Cash, beginning balance 9,210 2,480 NMF 14,806 -37.8% 14,806 4,243 NMF Cash, ending balance 28,616 14,806 93.3% 9,210 NMF 28,616 14,806 93.3%

50
Private portfolio companies – IFRS Accounts (cont’d)
INCOME STATEMENT Beverages BALANCE SHEET Beverages
GEL thousands; unless otherwise noted 2H18 2H17 Change 1H18 Change FY18 FY17 Change GEL thousands, unless otherwise noted Dec-18 Dec-17 change
Wine Business 20,346 13,457 51.2% 10,757 89.1% 31,103 22,101 40.7% Cash and cash equivalents 9,954 17,455 -43.0%
Beer Business 16,037 18,023 -11.0% 13,252 21.0% 29,289 20,528 42.7% Amounts due from financial institutions 136 4,381 -96.9%
Distribution Business 9,364 6,672 40.3% 6,458 45.0% 15,822 13,101 20.8% Accounts Receivable 16,260 12,179 33.5%
Revenue 45,747 38,152 19.9% 30,467 50.2% 76,214 55,730 36.8% Prepayments & Other Assets 6,283 4,472 40.5%
Wine Business (9,838) (6,153) 59.9% (5,361) 83.5% (15,199) (10,314) 47.4% Inventory 30,043 17,454 72.1%
Beer Business (10,387) (11,093) -6.4% (8,803) 18.0% (19,190) (12,887) 48.9% Intangible Assets, Net 2,094 1,799 16.4%
Distribution Business (7,526) (5,219) 44.2% (5,045) 49.2% (12,571) (10,151) 23.8% Goodwill 8,198 2,836 NMF
COGS (27,751) (22,465) 23.5% (19,209) 44.5% (46,960) (33,352) 40.8% Property and Equipment, Net 130,980 102,872 27.3%
Gross Profit 17,996 15,687 14.7% 11,258 59.9% 29,254 22,378 30.7% Total Assets 203,948 163,448 24.8%
Gross Profit Margin 39.3% 41.1% 37.0% 38.4% 40.2% Accounts Payable 18,021 14,335 25.7%
Salaries and other employee benefits (7,843) (5,019) 56.3% (6,352) 23.5% (14,195) (7,807) 81.8% Borrowings 117,172 71,430 64.0%
Sales and marketing expenses (2,632) (3,026) -13.0% (3,794) -30.6% (6,426) (4,970) 29.3% Other Liabilities 6,728 1,776 NMF
General and administrative expenses (4,356) (2,733) 59.4% (3,557) 22.5% (7,913) (4,539) 74.3% Total Liabilities 141,921 87,541 62.1%
Distribution expenses (2,871) (2,152) 33.4% (2,012) 42.7% (4,883) (3,029) 61.2% Total equity 62,027 75,907 -18.3%
Other operating expenses (648) (994) -34.8% (1,630) -60.2% (2,278) (1,177) 93.5% TOTAL LIABILITIES AND EQUITY 203,948 163,448 24.8%
EBITDA (354) 1,763 NMF (6,087) 94.2% (6,441) 856 NMF
wine EBITDA 5,524 3,944 40.1% 1,627 NMF 7,151 5,427 31.8%
beer EBITDA (6,170) (2,724) NMF (7,584) -18.6% (13,754) (5,533) NMF
distribution EBITDA 349 479 -27.1% 276 26.4% 625 728 -14.1% Net foreign currency gain (loss) (6,380) (7,322) -12.9% 4,501 NMF (1,879) (7,090) -73.5% Depreciation and amortization (6,637) (3,924) 69.1% (5,245) 26.5% (11,882) (5,524) NMF Net interest income/expense (4,145) (2,388) 73.6% (2,940) 41.0% (7,085) (3,171) NMF Net non-recurring items (1,690) 509 NMF (196) NMF (1,886) 536 NMF Loss before income tax (19,206) (11,362) 69.0% (9,967) 92.7% (29,173) (14,393) NMF Loss (19,206) (11,362) 69.0% (9,967) 92.7% (29,173) (14,393) NMF
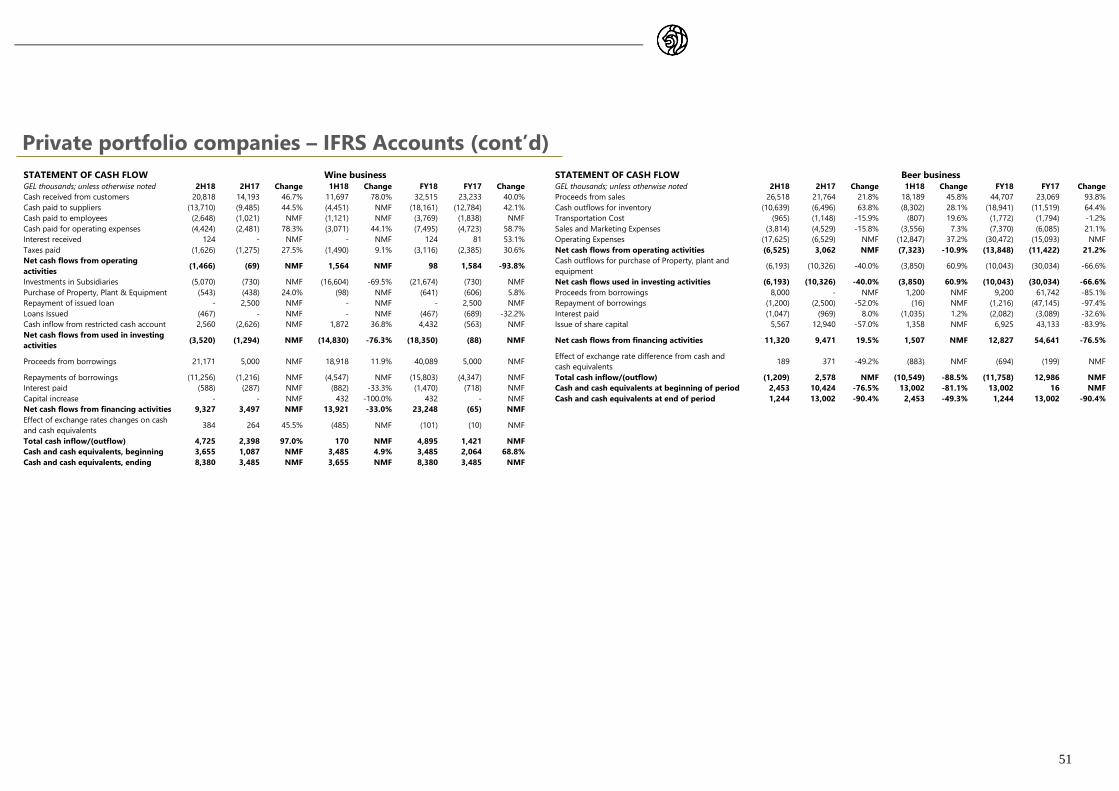
51
Private portfolio companies – IFRS Accounts (cont’d)
STATEMENT OF CASH FLOW Wine business STATEMENT OF CASH FLOW Beer business
GEL thousands; unless otherwise noted 2H18 2H17 Change 1H18 Change FY18 FY17 Change GEL thousands; unless otherwise noted 2H18 2H17 Change 1H18 Change FY18 FY17 Change
Cash received from customers 20,818 14,193 46.7% 11,697 78.0% 32,515 23,233 40.0% Proceeds from sales 26,518 21,764 21.8% 18,189 45.8% 44,707 23,069 93.8%
Cash paid to suppliers (13,710) (9,485) 44.5% (4,451) NMF (18,161) (12,784) 42.1% Cash outflows for inventory (10,639) (6,496) 63.8% (8,302) 28.1% (18,941) (11,519) 64.4%
Cash paid to employees (2,648) (1,021) NMF (1,121) NMF (3,769) (1,838) NMF Transportation Cost (965) (1,148) -15.9% (807) 19.6% (1,772) (1,794) -1.2%
Cash paid for operating expenses (4,424) (2,481) 78.3% (3,071) 44.1% (7,495) (4,723) 58.7% Sales and Marketing Expenses (3,814) (4,529) -15.8% (3,556) 7.3% (7,370) (6,085) 21.1%
Interest received 124 - NMF - NMF 124 81 53.1% Operating Expenses (17,625) (6,529) NMF (12,847) 37.2% (30,472) (15,093) NMF
Taxes paid (1,626) (1,275) 27.5% (1,490) 9.1% (3,116) (2,385) 30.6% Net cash flows from operating activities (6,525) 3,062 NMF (7,323) -10.9% (13,848) (11,422) 21.2%
Net cash flows from operating
activities (1,466) (69) NMF 1,564 NMF 98 1,584 -93.8% Cash outflows for purchase of Property, plant and
equipment (6,193) (10,326) -40.0% (3,850) 60.9% (10,043) (30,034) -66.6%
Investments in Subsidiaries (5,070) (730) NMF (16,604) -69.5% (21,674) (730) NMF Net cash flows used in investing activities (6,193) (10,326) -40.0% (3,850) 60.9% (10,043) (30,034) -66.6%
Purchase of Property, Plant & Equipment (543) (438) 24.0% (98) NMF (641) (606) 5.8% Proceeds from borrowings 8,000 - NMF 1,200 NMF 9,200 61,742 -85.1%
Repayment of issued loan - 2,500 NMF - NMF - 2,500 NMF Repayment of borrowings (1,200) (2,500) -52.0% (16) NMF (1,216) (47,145) -97.4%
Loans Issued (467) - NMF - NMF (467) (689) -32.2% Interest paid (1,047) (969) 8.0% (1,035) 1.2% (2,082) (3,089) -32.6%
Cash inflow from restricted cash account 2,560 (2,626) NMF 1,872 36.8% 4,432 (563) NMF Issue of share capital 5,567 12,940 -57.0% 1,358 NMF 6,925 43,133 -83.9%
Net cash flows from used in investing
activities (3,520) (1,294) NMF (14,830) -76.3% (18,350) (88) NMF Net cash flows from financing activities 11,320 9,471 19.5% 1,507 NMF 12,827 54,641 -76.5%
Proceeds from borrowings 21,171 5,000 NMF 18,918 11.9% 40,089 5,000 NMF Effect of exchange rate difference from cash and
cash equivalents 189 371 -49.2% (883) NMF (694) (199) NMF
Repayments of borrowings (11,256) (1,216) NMF (4,547) NMF (15,803) (4,347) NMF Total cash inflow/(outflow) (1,209) 2,578 NMF (10,549) -88.5% (11,758) 12,986 NMF
Interest paid (588) (287) NMF (882) -33.3% (1,470) (718) NMF Cash and cash equivalents at beginning of period 2,453 10,424 -76.5% 13,002 -81.1% 13,002 16 NMF
Capital increase - - NMF 432 -100.0% 432 - NMF Cash and cash equivalents at end of period 1,244 13,002 -90.4% 2,453 -49.3% 1,244 13,002 -90.4%
Net cash flows from financing activities 9,327 3,497 NMF 13,921 -33.0% 23,248 (65) NMF Effect of exchange rates changes on cash
and cash equivalents 384 264 45.5% (485) NMF (101) (10) NMF
Total cash inflow/(outflow) 4,725 2,398 97.0% 170 NMF 4,895 1,421 NMF Cash and cash equivalents, beginning 3,655 1,087 NMF 3,485 4.9% 3,485 2,064 68.8% Cash and cash equivalents, ending 8,380 3,485 NMF 3,655 NMF 8,380 3,485 NMF

52
Appendices
Management income statement preparation methodology
The management P&L is an aggregation of the bottom lines of the attributable stand-alone IFRS P&Ls of
listed and private portfolio companies together with GCAP’s stand-alone P&L.
• The top part of the income statement (GCAP Operating Income) represents the aggregation of the
two stand-alone holding company accounts, which we call GCAP (i.e. the UK holding company
Georgia Capital PLC and the Georgian holding company JSC Georgia Capital ), the performance
of which reflects the net result of a) dividend income accrual based on estimated annual dividend
proceeds from portfolio companies to be collected during the year, b) interest income on liquid
funds, mezzanine facilities issued and senior loans issued, c) interest expenses on debt incurred at
GCAP level (which consists of the bonds issued) and d) expenses incurred at GCAP level. These
amounts are derived from IFRS consolidated financial statements, note 6 on segment reporting
under segment name of Corporate Center.
• Portfolio company attributable income represents attributable recurring IFRS net profits or losses
of each portfolio company, i.e. stand-alone net profits adjusted to exclude minority interests and
impact of non-recurring items and foreign exchange movements. We view portfolio company
attributable income as a metric to measure the earning power of Georgia Capital’s holdings, which
itself reflects future dividend generation/distribution capacity of portfolio companies, indicating
cash receipt prospects of Georgia Capital.
• Within the bottom part of the income statement, we reverse in 2018 the double counting impact
of dividend accrual and recognize provisions for interest income items, where immediate
collectability is uncertain on instruments such as mezzanine loans. Following these adjustments,
we arrive at management net income for the period.
• Below the net income line, to arrive at total comprehensive income, we present i) gains or losses
from foreign exchange movements across the Group excluding listed portfolio companies, ii) non-
recurring items of both GCAP and related attributable shares of portfolio companies and iii)
realized gains or losses from sales from GCAP’s sales of equity interests in portfolio companies.
Starting from the 2H18 & FY18 results announcement, we present total gains or losses from foreign
exchange movements for private businesses and GCAP below net income line as part of other
comprehensive income/loss. Due to their seasonally fluctuating nature, foreign exchange movements
distort the earning power of the portfolio companies. Previously, within 1H18 results release, each
private portfolio company attributable income was shown net of respective gains or losses from foreign
exchange movements. Comparative periods were respectively amended.

53
Appendices (cont’d)
Glossary
1. GCAP refers to the aggregation of stand-alone Georgia Capital PLC and stand-alone JSC
Georgia Capital accounts
2. Georgia Capital and “the Group” refer to Georgia Capital PLC and its portfolio companies as a
whole
3. NMF – Not meaningful
4. NAV – Net Asset Value, represents the net value of an entity and is calculated as the total value
of the entity’s assets minus the total value of its liabilities.
5. LTM – last twelve month
6. EBITDA - Earnings before interest, taxes, non-recurring items, FX gain/losses and depreciation
and amortization; The Group has presented these figures in this document because
management uses EBITDA as a tool to measure the Group’s operational performance and the
profitability of its operations. The Company considers EBITDA to be an important indicator of
its representative recurring operations.
7. ROIC – return on invested capital is calculated as EBITDA less depreciation, divided by
aggregate amount of total equity and borrowed funds
8. IRR - for listed portfolio companies is calculated based on a) historical contributions to the
listed portfolio company less b) dividends received and c) market value of the portfolio
company at 31 December 2018.
9. ROI - for private portfolio companies is an annual return on net investment (gross investments
less capital returns) calculated at each investment level. Inputs into the ROI calculation are as
follows: (i) the numerator is the annual attributable income of the private portfolio company
less allocated GCAP interest expense, and (ii) the denominator, is the net investment less
allocated gross debt of GCAP.
10. ROAC – is an annual return on allocated capital as of 31 December 2018 and calculated at each
private investment level. Inputs into the ROAC calculation are as follows: (i) the numerator is the
annual attributable income of the private portfolio company, less allocated GCAP interest
expense, and (ii) the denominator is the management estimated fair value, as included in the
NAV statement, less allocated gross debt of GCAP.
11. Loss ratio equals net insurance claims expense divided by net earned premiums
12. Expense ratio equals sum of acquisition costs and operating expenses divided by net earned
premiums
13. Combined ratio equals sum of the loss ratio and the expense ratio
14. ROAE – Return on average total equity (ROAE) equals profit for the period attributable to
shareholders divided by monthly average equity attributable to shareholders of the business
for the same period for BoGG and P&C Insurance;
15. Net investment - gross investments less capital returns
16. EV – enterprise value
17. NOI – net operating income
18. EBITDA cash conversion ratio equals Net cash flows from / (used in) operating activities
before income tax divided by EBITDA
19. Liquid assets & loans issued include cash, marketable debt securities and issued short-term
loans.

54
COMPANY INFORMATION
Georgia Capital PLC
Registered Address
84 Brook Street
London W1K 5EH
United Kingdom
www.georgiacapital.ge
Registered under number 10852406 in England and Wales
Stock Listing
London Stock Exchange PLC’s Main Market for listed securities
Ticker: “CGEO.LN”
Contact Information
Georgia Capital PLC Investor Relations
Telephone: +44(0)203 178 4052; +995 322 000000
E-mail: [email protected]
Auditors
Ernst & Young LLP
25 Churchill Place
Canary Wharf
London E14 5EY
United Kingdom
Registrar
Computershare Investor Services PLC
The Pavilions
Bridgwater Road
Bristol BS13 8AE
United Kingdom
Please note that Investor Centre is a free, secure online service run by our Registrar, Computershare,
giving you convenient access to information on your shareholdings.
Investor Centre Web Address - www.investorcentre.co.uk.
Investor Centre Shareholder Helpline - + 44 (0)370 702 0176
Share price information
Shareholders can access both the latest and historical prices via the website
www.georgiacapital.ge