Embed Size (px)
Citation preview

2006 Commuter Labor StudyFredericksburg Region
George Mason University School of Public Policy
Center for Regional Analysis
Prepared for
The Fredericksburg Regional Alliance
By
The Center for Regional AnalysisSchool of Public Policy
George Mason University
Stephen S. Fuller, PhD, DirectorJohn C. McClain, Deputy Director
October 2006

George Mason University Center for Regional Analysis �
EXECUTIVE SUMMARY
The purpose of this research was to update the 2003 Commuter La-bor Survey to provide a current assessment of the strengths of the Fredericksburg region regarding its labor force and their attitudes and opinions about their commuting experience and interest in finding em-ployment in closer proximity to where they live in order to reduce daily commuting requirements and improve their quality of life. This report also provides an update to the greater Washington metropolitan econ-omy as a context for the economy and outlook for economic growth of the Fredericksburg region.
Two surveys were conducted in June and July of 2006. The first sur-vey was of the Fredericksburg region’s workers who are out-commut-ing to their jobs, principally northward to D.C, Arlington, Alexandria and areas inside the Washington Beltway. The second survey was of workers residing in Prince William and southern Fairfax who represent potential in-commuters to work locations in the Fredericksburg region. The questionnaires were the same as the ones used in 2003. The questionnaire was internet-based. The target market for the surveys was those commuters who are experiencing the most burdensome commutes. In order to focus on this market, GMU students handed out business cards at VDOT park-and-ride lots and VRE stations in the morning commute times over a period of weeks. This method was very effective and there were a total of almost 1400 responses to the questionnaire, approximately the same as the 2003 survey, and an excellent response rate.

George Mason University Center for Regional Analysis 2
Summary of Findings and Conclusions
• The Washington metropolitan area economy continues to outperform most all other metropolitan economies in the US with 2006 job growth running ahead of forecast (74,000 new jobs, up 2.6%) and with unemployment consistently the lowest among major markets. Over the past six years, the Washington area has generated more net new jobs (359,000) than any other metropolitan area in the U.S. with Northern Virginia accounting for approximately 60 percent of this gain.
• The key factor influencing the Washington region’s growth pattern has been federal procurement spending. This has been particularly true of Northern Virginia’s growth over the past twenty years and helps to explain its growing share of the regional economy. It also helps to explain the economy’s greater volatility in Northern Virginia. Recent data confirm that the annual increases in federal procurement spending dramatically slowed in 2005 after three years of double-digit increases. It is expected that this deceleration will begin to moderate overall job growth in the Washington region, and that over the next four years total job growth will slow down from the 65,000+ growth in 2006 to an average of 55,000 for 2007-2009.
• While the Fredericksburg area economy is relatively small (estimated at $8.5 billion in 2005), it has grown rapidly during the past five years. Forecasts for Northern Virginia have it growing faster in the second half of the decade than the first half which included the recession of 2001. Going forward, the Fredericksburg area economy is expected to keep pace with the larger county economies of Fairfax and Prince William while growing substantially faster than the Washington metropolitan area. The major forces driving this growth include: (1) population growth and the economy this growth supports; (2) local regional functions such as health and education; and (3) non-local regional functions that depend on regional, national and international markets.
• The Fredericksburg region’s labor force is strong and has been growing rapidly. From 2000 to 2005 the area has grown from a population of 241,000 to 301,300. This is a growth of 60,300 in five years and represents a growth rate of 25.0 percent, significantly higher than the Washington region over the same period which grew by 9.5 percent and also higher than the 13.3 percent growth rate in all of Northern Virginia. County to county migration data from the Internal Revenue Service show that a significant portion of the Fredericksburg region’s growth has come from Northern Virginia. For the period 2000 to 2004, more than 12,000 households moved from Arlington, Alexandria, Fairfax, and Prince William Counties to the Fredericksburg area. Workers in these households likely still hold jobs in D.C., Arlington, and Alexandria, and have now added to the commuters heading north from the Fredericksburg area.
• Implementation of the Base Realignment and Closure Commission’s final recommendations will likely provide some acceleration of population and labor force growth in the Fredericksburg region over the next ten years or more, especially after 2010. The BRAC actions may also provide opportunities for location of DOD contractors down the I-95 corridor towards the Fredericksburg region.
George Mason University Center for Regional Analysis �
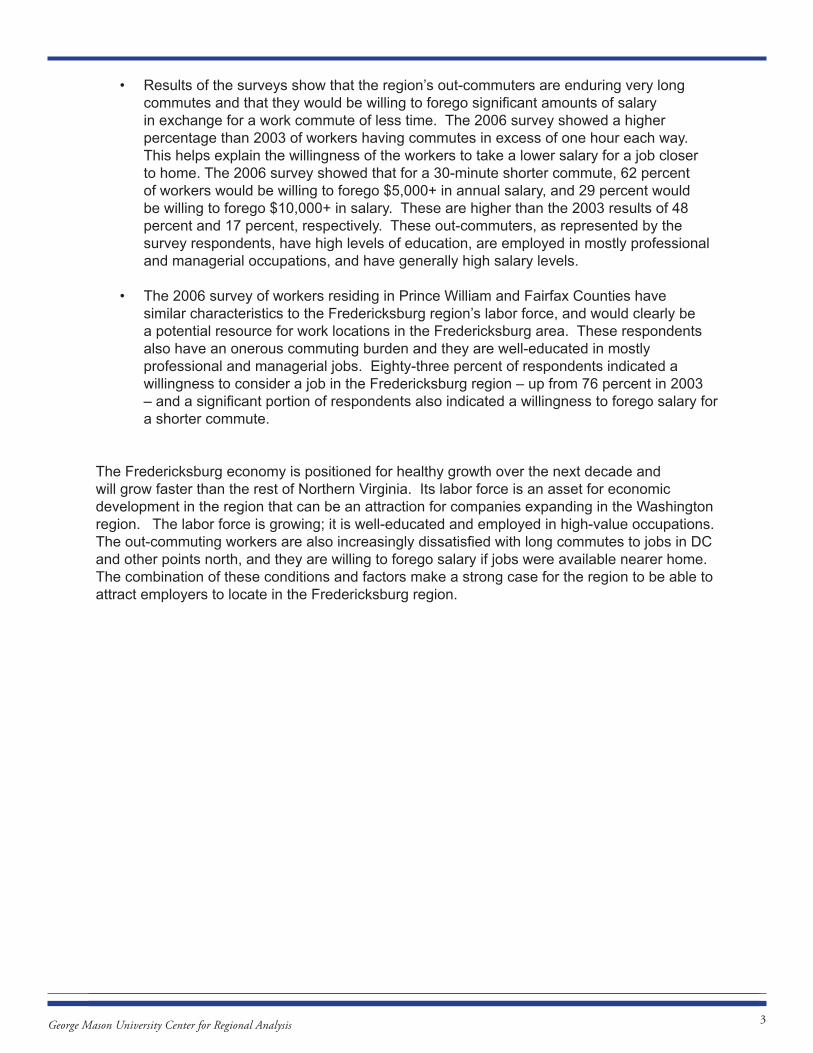
• Results of the surveys show that the region’s out-commuters are enduring very long commutes and that they would be willing to forego significant amounts of salary in exchange for a work commute of less time. The 2006 survey showed a higher percentage than 2003 of workers having commutes in excess of one hour each way. This helps explain the willingness of the workers to take a lower salary for a job closer to home. The 2006 survey showed that for a 30-minute shorter commute, 62 percent of workers would be willing to forego $5,000+ in annual salary, and 29 percent would be willing to forego $10,000+ in salary. These are higher than the 2003 results of 48 percent and 17 percent, respectively. These out-commuters, as represented by the survey respondents, have high levels of education, are employed in mostly professional and managerial occupations, and have generally high salary levels.
• The 2006 survey of workers residing in Prince William and Fairfax Counties have similar characteristics to the Fredericksburg region’s labor force, and would clearly be a potential resource for work locations in the Fredericksburg area. These respondents also have an onerous commuting burden and they are well-educated in mostly professional and managerial jobs. Eighty-three percent of respondents indicated a willingness to consider a job in the Fredericksburg region – up from 76 percent in 2003 – and a significant portion of respondents also indicated a willingness to forego salary for a shorter commute.
The Fredericksburg economy is positioned for healthy growth over the next decade and will grow faster than the rest of Northern Virginia. Its labor force is an asset for economic development in the region that can be an attraction for companies expanding in the Washington region. The labor force is growing; it is well-educated and employed in high-value occupations. The out-commuting workers are also increasingly dissatisfied with long commutes to jobs in DC and other points north, and they are willing to forego salary if jobs were available nearer home. The combination of these conditions and factors make a strong case for the region to be able to attract employers to locate in the Fredericksburg region.

George Mason University Center for Regional Analysis �
The Economy of the Fredericksburg Region
The Washington area and Northern Virginia economies provide the regional context for the economy of the four-county area served by the Fredericksburg Regional Alliance. With the rapid expansion of the Washington area economy being led by growth in Northern Virginia, the Fredericksburg area has also experienced rapidly changing economic conditions. These economic conditions have reflected a combination of increased commuter-borne earnings (income earned outside the four-county area and returned to it by resident commuters) and the development of an export base that has combined the hospitality industry, health and education services, federal contracting, and other businesses serving regional, national and even international markets. The current performance of the jurisdictions encompassing the Fredericksburg Regional Alliance and their outlook for the remainder of this decade have been shaped by this regional context and changes in federal procurement spending. This context is presented here along with the economic outlook for the Fredericksburg Region.
The Washington Area Economy: 2006 and Beyond
The Washington metropolitan area economy continues to be among the best performing among major metropolitan areas nationwide with job growth running ahead of forecast (74,000 new jobs, up 2.6%) with unemployment consistently the lowest among major markets. Over the past six years, the Washington area has generated more net new jobs than any other metropolitan area in the U.S. with Northern Virginia accounting for approximately 60 percent of this gain. Job growth through mid-year has been on target in Northern Virginia with gains averaging around 40,000 net new jobs. The District of Columbia is generating close to its forecast of 8,000 new jobs and Suburban Maryland is running ahead of forecast with gains exceeding 20,000. The unemployment rate in the District has dropped below 6% and in the suburbs rates are now hovering close to 2.0%.
Northern Virginia’s increasing share of the regional economy has a long history and has important implications for the future directions of growth in the outlying counties. The key factor influencing the Washington region’s growth pattern has been federal procurement spending. This has been particularly true of Northern Virginia’s growth over the past twenty years and helps to explain its growing share of the regional economy. It also helps to explain the economy’s greater volatility in Northern Virginia. Recent data confirm that the annual increases in federal procurement spending dramatically slowed in 2005 after three years of double-digit increases.
Federal spending totaled an estimated $107 billion in 2004 (inclusive of procurement outlays, payroll, retirement and disability, and grants including Medicare) accounting for approximately 35 percent of the Washington area’s gross regional product. Procurement outlays accounted for 49% of all federal spending in the Washington area. This total value for federal spending in 2005 has not yet been reported but is expected to have grown more slowly than in 2004 when it was up 11.4%.

George Mason University Center for Regional Analysis �
Metro Comparisons Job Change 2000-2005
15 Largest Metro Areas
-109-70
-52-52
2553
72101109
148154159
262285
359
-200 -100 0 100 200 300 400
Detroit
SF-Oakland
Chicago
Boston
Seattle
Minneapolis
Philadelphia
Dallas-FW
Atlanta
Houston
New York
Los Angeles
Phoenix
Miami
ThousandsWASHINGTON
Source: BLS, GMU Center for Regional Analysis
20%
25%
30%
35%
40%
45%
50%
1970 1975 1980 1985 1990 1995 2000 2005
Share of Washington Area Economy
1970-2005
N. Virginia
Sub. MD
District
% o
f GR
P
Year

George Mason University Center for Regional Analysis 6
What is now known is that the largest source of federal spending—procurement outlays for locally provided goods and services—increased only slightly in 2005 in contrast to its 19.0% gain in 2004. Preliminary totals (several agencies had not reported all FY 2005 outlays as of August 1) show federal procurement growing by only $1.3 billion or 2.5%, the smallest gain since 1997. The historic pattern of federal procurement spending in the Washington area is shown in the following figure with 2005 preliminary spending reported by sub-state portion presented in Table 1.
0
1
2
3
4
5
6
7
8
19801982
19841986
19881990
19921994
19961998
20002002
2004
Annual Change in Federal Procurement Spending
Washington Metro Area$ Billions
The increase in federal procurement spending in 2005 was expected to be slightly less than in 2004 but still to have exceeded the historic average (8.8%). However, the preliminary 2005 federal procurement data (August 2006) show that federal procurement spending increased only $1.3 billion or 2.5%. While the final total procurement outlays will be somewhat larger, they will not alter what must be viewed as a major shift in procurement spending patterns that could have a significant negative impact on the Washington area economy in 2007 and beyond. The slowdown in contract spending during FY 2005 could cost the region thousands of new jobs as contract spending has been found to generate approximately 7,000 new jobs per $1 billion in additional federal contract spending across all sectors of the area economy.
It should be noted that in addition to these 2005 federal spending data being preliminary, they also exclude local spending by the US Postal Service, the FAA, and other off-budget agencies such as the CIA, NSA, and DIA. Consequently, the total value of federal procurement spending always has exceeded the reported value and this differential has likely increased as a disproportional amount of the spending increases since FY 2001 has been for homeland security activities cutting across numerous agencies. Still, federal procurement spending, which has driven the region’s accelerated growth over the past three years, slowed its growth rate significantly in 2005 and this will have a measurable impact on the area’s economic performance in coming years.

George Mason University Center for Regional Analysis �
Table 1
Federal Procurement Spending in theWashington Metropolitan Area, FY 2004 and 2005*
(in billions of current dollars) ___________________________________________________________
Sub-state Area 2004 2005* Change % Change ___________________________________________________________
District of Columbia $13.3 $12.6 $ - 0.7 - 5.8 Suburban Maryland 11.9 12.5 0.6 5.6 Northern Virginia 25.9 27.3 1.4 5.4 Total Metro Area $51.1 $52.4 $1.3 2.5 ___________________________________________________________ Sources: Eagle Eye Publishers, Inc. and GMU Center for Regional Analysis. Note: federal procurement totals exclude purchases by the US
Postal Service, FAA and other “off-budget” outlays. *2005 values arePreliminary---reporting by some agencies is incomplete.
The impact of slower federal spending on the Washington area economy will not be as significant as in the late 1980s due to the economy’s increased scale and diversification achieved since 1995. However, if the area’s non-federally funded business activities cannot take up the slack due to increasing costs of operation (inflation and interest rates) or growing weakness in national and global markets, then the Washington area economic growth rate can be expected to decelerate faster than is currently projected. These projected GRP growth rates are presented in Table 2.
Table 2
Gross Regional Product, 2005-2010Washington Metropolitan Area and Sub-State Portions
(in billions of 2005 $s) _____________________________________________________________________
Year Metro Area District Suburban MD Northern VA Value % Change % Change % Change Value % Change _____________________________________________________________________ 2005 315.3 4.0 2.5 4.2 123.6 5.0 2006 327.0 3.7 2.3 3.8 129.4 4.7 2007 338.4 3.5 2.2 3.6 135.3 4.5 2008 349.6 3.3 2.0 3.5 141.1 4.3 2009 360.4 3.1 1.7 3.2 146.9 4.1 2010 370.9 2.9 1.6 3.1 152.5 3.8 _____________________________________________________________________ Source: GMU Center for Regional Analysis, 2006

George Mason University Center for Regional Analysis �
The employment forecast for the Washington metropolitan area and its sub-state portions is presented in Table 3. With this year’s growth of regular, full-time employment averaging 74,000 through eight months, it seems likely that the year-end gain will exceed the 65,500 new jobs forecasted at the beginning of the year. At this time, the estimated job growth in the District and Northern Virginia are on target with Suburban Maryland accounting for the job gains exceeding the forecast.
The 2006 job growth rate in the Washington region is projected to equal or surpass the job gain in 2005 that fell below forecast. The annual job growth rate is projected to slow further in 2007, 2008 land 2009. Job growth in Northern Virginia will account for between 50 and 60 percent of the Washington area total although its job growth will be more susceptible to changes in federal procurement spending and could drop below projection if procurement spending slows at a greater rate than currently assumed.
Table 3
Employment Projections for the Washington Area: 2005-2009(annual change in employment)
___________________________________________________________
Area 2005 2006 2007 2008 2009 ___________________________________________________________ District of Columbia 8.0 7.5 7.5 6.0 4.0 Suburban Maryland 13.5 17.0 15.0 13.5 12.0 Northern Virginia 43.3 41.5 38.5 35.0 31.5 Washington MSA* 64.3 65.5 59.3 53.5 53.5 ___________________________________________________________ Sources: NPA Data Services, Inc., GMU Center for Regional Analysis
*excludes Jefferson County in West Virginia; **full-time, year-round employees for whom employers withhold income tax and social security payments.

George Mason University Center for Regional Analysis �
Economic Growth in the Fredericksburg Region
The growth of the Fredericksburg area economy is measured by the change in value of the goods and services it produces. While the Fredericksburg area economy is relatively small (estimated at $8.5 billion in 2005), it has grown rapidly during the past five years. Forecasts for Northern Virginia have it growing faster in the second half of the decade than the first half which included the recession of 2001. Going forward, the Fredericksburg area economy is expected to keep pace with the larger county economies of Fairfax and Prince William while growing substantially faster than the Washington metropolitan area. These comparisons are presented in Table 4.
Table 4
Gross County Product: 1990-2015(inflation adjusted percent change)
__________________________________________________________
Period Washington Fairfax Prince Wm Fredericksburg Metro Area County County Region* __________________________________________________________
2000-2005 19.0 22.8 36.0 32.3 2005-2010 29.1 42.2 36.2 36.5 2010-2015 19.3 28.5 24.2 24.8 __________________________________________________________ Source: GMU Center for Regional Analysis * Caroline, King George, Spotsylvania, Stafford and Fredericksburg
The major forces driving this growth include: (1) population growth and the economy this growth supports; (2) local regional functions such as health and education; and (3) non-local regional functions that depend on regional, national and international markets. Household growth is projected to slow between 2005 and 2010. Slower household growth will translate into slower growth of residentially dependent commercial uses. Compensating for this slower growth of residentially dependent commercial uses will be gains in non-residentially dependent uses. These will include regional activities such as the Medicorp Health System and Mary Washington University.
Other non-local serving uses will also become more important to the economy’s performance. Geico Insurance Company, one of the region’s largest employers, is an example of this type of business. Federal contracts will become more important in the economy’s future. Already there is growing evidence of their importance in Stafford County with a 345 percent one-year increase in federal procurement contract value.
One measure of the shift of the economy from locally dependent to non-locally dependent is the ratio for jobs to population. As an economy shifts away from a residentially dependent economy this ratio moves up towards and passes 6 jobs for each 10 residents or 0.6. In 2005,

George Mason University Center for Regional Analysis �0
this jobs-to-population ratio in the Fredericksburg regional economy stood at .45. By 2010, this ratio is projected to increase only slightly to .47. As non-residentially dependent economic growth accelerated over the next ten years, this ratio will move higher. As this jobs-to-population ratio increases, the incomes generated by these new jobs will be increasing and the need for residents to commute out of the area to find higher paying jobs will diminish.
When the BRAC proposals are fully implemented by 2011, the impact of federal contracting and other federal spending in the Fredericksburg region will be substantially greater than its current levels. While the outlook for the increased growth of federal procurement spending becoming a major force within the area economy appears good, it is not guaranteed.
The one major threat to this forecast is a change in the growth of federal spending in the Washington region and in Northern Virginia. After experiencing double-digit increases in federal procurement spending for the entire Washington region in 2002, 2003 and 2004, this spending slowed to 2.5 percent in 2005. Northern Virginia’s annual growth in federal procurement spending has exceeded the Washington area’s growth rate over this period. Even as the growth of this spending slows, federal procurement in Northern Virginia was up 5.4 percent, for a gain of $1.4 billion and an amount that exceeded the total regional gain of $1.3 billion. In spite of Northern Virginia’s gains, federal procurement spending in the Fredericksburg region declined slightly in 2005, with only Stafford County and the City of Fredericksburg experiencing an increase in outlays.
The current outlook for the Fredericksburg regional economy is for increasing job growth with income and output growing faster than the increase in jobs. This shift towards higher value added jobs is predicated on the structure of the area economy and its location in Northern Virginia and does not reflect the additional potential growth effects of the BRAC proposals. While the growth of this economy is vulnerable to changing federal procurement trends and the realization of the proposed BRAC relocations and accompanying federal contractor relocations into the area, the magnitude and vitality of the larger Northern Virginia and metropolitan Washington area economies will result in above-national average growth rates over the come five years and beyond. More critical to capturing the economic potentials that can be realized within the Fredericksburg area economy will be the availability of a high quality workforce, affordable housing, and comparable public facilities and services. As more households locate within the local area and as commuters opt to work locally, the resident labor force will emerge as the area’s number one asset for attracting new non-residentially dependent businesses.

George Mason University Center for Regional Analysis ��
Key Comparisons of 2003 and 2006 Commuter Surveys

George Mason University Center for Regional Analysis �2
Key Comparisons of 2003 and 2006 Commuter Surveys
The 2006 surveys of both the Fredericksburg out-commuting labor force and the nearby labor force in Fairfax and Prince William Counties show some changes from the 2003 survey measurements. Part of the reason for the changes is that the survey operational methods in 2006 resulted in attracting more of the long-distance commuters than did the survey in 2003. This was a goal of the survey and it does explain some of the differences in numerical measurements. Given below are the key comparisons between the 2003 survey and the 2006 update survey.
The 2006 survey captured more of the longer distance out-commuters as a greater percentage of the Fredericksburg region respondents work in D.C, Arlington and Alexandria – 81% in 2006 as compared to 59% in the 2003 survey.
OutOut--Commuters Commuters Workplace Location Workplace Location
2003 and 20062003 and 2006
37
17 17
5
24
46
29
9 610
05
101520253035404550
D.C.Arlington
FairfaxAlexandria
Other
20032006
%
This difference was also true of the potential in-commuters from Fairfax and Prince William. The comparison for those commuters was 85 percent to D.C. Arlington and Alexandria in the 2006 survey and 67 percent to those jurisdictions in 2003.
With more respondents commuting to the more central parts of the Washington region, it is not surprising then that their commutes were longer. For Fredericksburg region out-commuters, commutes of more than one hour rose from 56 percent in 2003 to 68 percent in 2006, and for potential in-commuters the change was from 28 percent to 37%.

George Mason University Center for Regional Analysis ��
OutOut--Commuters Commuters Time of HomeTime of Home--toto--Work TripWork Trip
2003 and 20062003 and 2006
56
33
8 3
68
29
2 10
1020304050607080
One Hour +
45-60 Min
30-45 Min
< 30 Min
20032006
%
Potential InPotential In--CommutersCommutersTime of HomeTime of Home--toto--Work Trip Work Trip
2003 and 20062003 and 2006
28
41
20
12
3742
147
05
1015202530354045
One Hour +
45-60 Min
30-45 Min
< 30 Min
20032006
%
There is normally a correlation between length of trip and pay levels and this is shown by the 2006 survey respondents having more salaries at higher levels than in 2003. These results also demonstrate the increases in pay scales over the three-year period, so both factors explain the differences.

George Mason University Center for Regional Analysis ��
OutOut--Commuters Commuters Salary LevelsSalary Levels
2003 and 20062003 and 2006
11
25
37
20
8
3733
22
5 30
10
20
30
40
50
60
$100K+$75-$100K
$50-$75K
$35-$50K
< $35K
20032006
%
Potential InPotential In--CommutersCommutersSalary Levels Salary Levels
2003 and 20062003 and 2006
13
32 32
18
6
37
29
21
94
05
10152025303540
$100K+$75-$100K
$50-$75K
$35-$50K
<$35K
20032006
%
Along with higher salaries in the 2006 surveys, respondents also had higher educational levels as seen in the following two charts.

George Mason University Center for Regional Analysis ��
OutOut--Commuters Commuters Education LevelsEducation Levels2003 and 20062003 and 2006
2028 27
12 12
3731 27
50
010
2030
4050
60
Graduate/Prof Degree
Bachelors
Some College
High School
< High School
20032006
%
Potential InPotential In--Commuters Commuters Education LevelsEducation Levels2003 and 20062003 and 2006
33 35
1910
3
45
3021
3 00
10
2030
4050
60
Graduate/Prof Degree
Bachelors
Some College
High School
< High School
20032006
%

George Mason University Center for Regional Analysis �6
The most significant differences between the 2003 and 2006 surveys were the results of the questions on how much salary the labor force would be willing to forego for a shorter commute. Part of the reason for this is likely that by interviewing more of the long distance commuters, the survey captured more of the resident labor force that are having more difficult commutes and would like to improve their quality of daily living by having more time of their own and less in travel to work.
There were three questions on this issue in which the question of how much salary they would be willing to forego was for a 10-minute savings, a 20-minute savings and a 30-minute savings. For each of these levels of savings, the out-commuters are willing to forego more salary in 2006 than they were in 2003.
At the 10-minute savings each way, the percent who would not forego any salary dropped from 85 percent in 2003 to 72 percent in 2006, and the percentage willing to give up different levels of salary all went up.
OutOut--Commuters Commuters How Much Salary Willing to ForegoHow Much Salary Willing to Forego
For 10For 10--Minute Less Commute?Minute Less Commute?2003 and 20062003 and 2006
85
6 5 4
72
11 9 80
102030405060708090
100
None$2000-$3000
$5000-$6000
$10,000+
20032006
%
Whereas in 2003 there was 15 percent of the labor force willing to give up at least $2,000 in salary to save 10 minutes each way, in 2006 that percentage had risen to 28 percent. And the percent willing to forego $5,000 or more doubled from 9 percent to 18 percent.
George Mason University Center for Regional Analysis ��
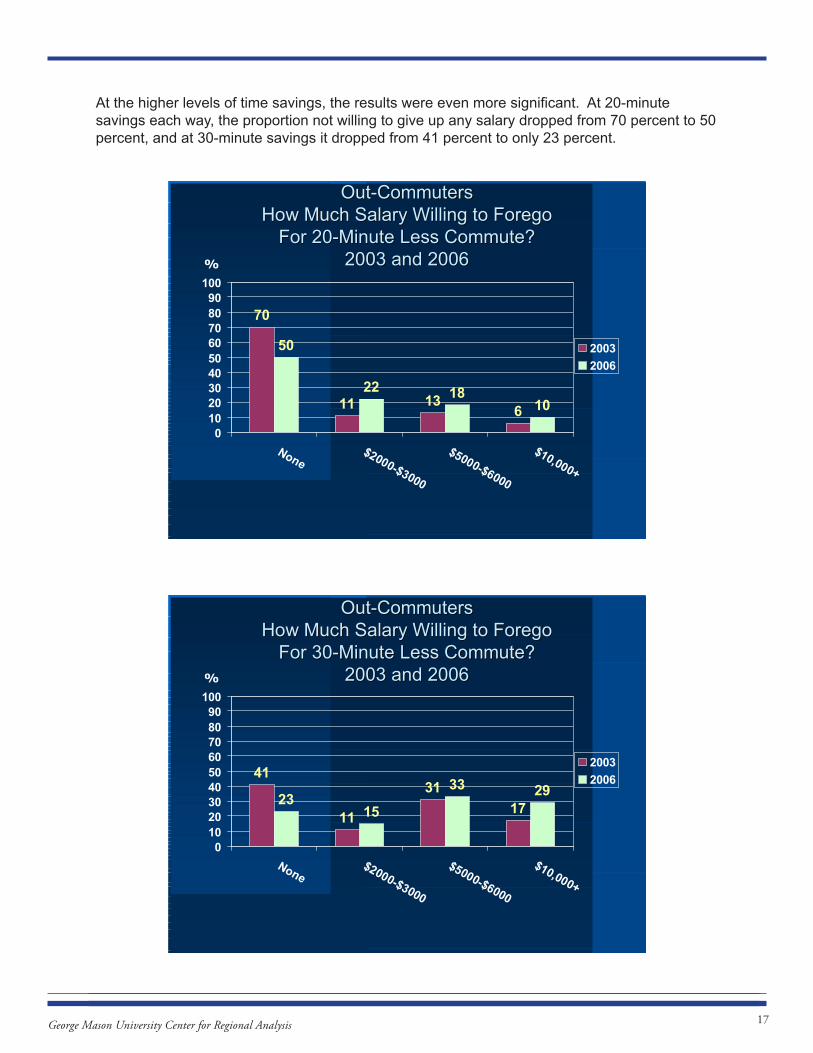
At the higher levels of time savings, the results were even more significant. At 20-minute savings each way, the proportion not willing to give up any salary dropped from 70 percent to 50 percent, and at 30-minute savings it dropped from 41 percent to only 23 percent.
OutOut--Commuters Commuters How Much Salary Willing to ForegoHow Much Salary Willing to Forego
For 20For 20--Minute Less Commute?Minute Less Commute?2003 and 20062003 and 2006
70
11 136
50
22 1810
0102030405060708090
100
None$2000-$3000
$5000-$6000
$10,000+
20032006
%
OutOut--Commuters Commuters How Much Salary Willing to ForegoHow Much Salary Willing to Forego
For 30For 30--Minute Less Commute?Minute Less Commute?2003 and 20062003 and 2006
41
11
311723
15
33 29
0102030405060708090
100
None$2000-$3000
$5000-$6000
$10,000+
20032006
%

George Mason University Center for Regional Analysis ��
The two charts above reveal a clear dissatisfaction with travel to work by the labor force of the Fredericksburg region. For 20 minutes of time savings in the commute each way, the percentage of respondents willing to forego $2,000 or more in pay went up from 30 percent in 2003 to 50 percent in 2006. At the 30-minute level, it went up from 59 percent to 77 percent.
Even more remarkable at the 30-minute time savings, 62 percent would be willing to forego $5,000 or more in salary, and almost a third – 29% - would be willing to forego $10,000 or more in salary. For members of the resident labor force who are now commuting more than an hour each way, mostly to jobs in DC, Arlington, Alexandria, and northern Fairfax, a 30-minute savings would be easily obtainable by taking a job close to Fredericksburg. Therefore, employers who would consider locating in the Fredericksburg area have access to a highly educated work force willing to forego significant salary to work closer to Fredericksburg.

George Mason University Center for Regional Analysis ��
Summary of Results of 2006 Surveys of Fredericksburg Region Out-Commuters and Potential In-Commuters from
Prince William and Fairfax

George Mason University Center for Regional Analysis 20
Fredericksburg Out-CommutersGeneral Characteristics of Survey Respondents
The majority of out-commuter survey respondents were residents of Stafford (58%) and Spotsylvania (30%) counties. The other twelve percent commuted from Caroline, Fredericksburg, King George, or other nearby counties. The survey results indicated that 95 percent of out-commuters traveled to a workplace location somewhere in DC or Northern Virginia. The table below shows the workplace location of respondents to the 2006 survey.
Workplace Location Percent District of Columbia 45.9%
Arlington County 28.5% Fairfax County 9.3% Alexandria 5.6% Other 10.7%
The 2006 survey indicates that 97 percent of commuters travel more than 45 minutes from home to work and more than two-thirds travel more than one hour. Being that half of respondents commuted to the District of Columbia, sixty-eight percent of respondents reporting travel time of more than one hour from home to work is not surprising. Survey responses specify that travel from work to home is even longer; 83 percent reported more than a one hour commute. This is probably because of there being more congestion for the return trip in the afternoon/evening.
Time of HomeTime of Home--toto--Work TripWork Trip
68
29
2 0.5 0.50
1020304050607080
One Hour +
45-60 Min
30-45 Min
20-29 Min
< 20 Min
%
Respondents indicated that the most common mode of transportation to work was some form of transit, be it formal or informal. Travel by train was the largest single means, but travel by car pool plus “slugging” was 49%. The percent of respondents who drove themselves was only five

George Mason University Center for Regional Analysis 2�
percent of 2006 survey respondents.
Mode of Travel PercentDrive Alone 5%
Car-Van Pool 22% Slug 27% Train 33% Bus 11% Other 3%
Out-commuters typically earn high salaries and have high levels of education. The median range of respondents’ annual salaries in 2006 is $75,000 to $99.900, and a calculated median salary is $90,100. Thirty-seven percent of out-commuter respondents are earning more than $100K.
SalarySalary
3733
22
52 1
05
10152025303540
$100K +$75-$100K
$50-$75K
$35-50K$25-35K
< $25K
%
Commensurate with high incomes and lengthy travel times, respondents’ levels of education are also quite high. The figures for level of education are presented below.
Highest Education Level 2006Grad/Prof Degree 37%
Bachelors 31% Some college 27% High School 5% < High School -

George Mason University Center for Regional Analysis 22
In accordance with high levels of education, Seventy percent of out-commuter respondents worked in management or professional occupations. Three percent worked in service occupations and the remaining 27 percent did not fall into either category.
Out-commuters in the survey are most likely to work for the federal government (68%) but 21 percent work in the private sector and 5% in the non-profit sector.
Attitudes about Commuting to Jobs in Fredericksburg Region
Thirty-four percent of respondents reported that they would accept a lower salary for a shorter commute and 28 percent said that they were not sure or undecided.
Would You Be Willing to Take Less Would You Be Willing to Take Less Salary to Work Closer to Home?Salary to Work Closer to Home?
34 3828
0
10
20
30
40
50
60
70
YES NO Not Sure
%
More than 90 percent of commuters would like for their commute to be less than 45 minutes. However, 97 percent travel for more than 45 minutes to get from home to work and most travel for even longer times to get from work to home. Since a vast majority consider a reasonable commute time to be less than 45 minutes, many workers are willing to accept less salary in return for less travel time.
The length by which a commute was shortened was important in determining people’s response to the questions regarding how much salary they would be willing to forego for a reduction in travel time to work. For a trip ten minutes shorter, 72 % would not give up any, 11 % would forego in the $2-3,000 range, 9 % would give up $5-6,000 and 8 % would forego $10,000 or more. At the higher time savings, these percentages changed substantially. For a 20-minute savings each way, the percent that would not give up any dropped to only half and the percentages for

George Mason University Center for Regional Analysis 2�
the different ranges went up. And then at the 30-minute time savings level, only 23 % would not forego any salary – almost three workers out of four would give up salary and 62 % would forego more then $5,000 and 29% would forego $10,000 or more. This portion of the survey allowed respondents to enter dollar amounts without being coaxed by multiple choice responses. This method makes the findings even more compelling.
The next three graphs illustrate the answers in detail showing brackets of income that commuters are willing to forego for a 10, 20, and 30-minute reduction in commute for both directions.
The survey shows that salary is not the only consideration in changing jobs. Another important factor in making such a decision is current employer. Sixty-six percent of respondents said that they would be willing to change employers to work closer to home but 19 percent said that they would not. Another 15 percent were undecided.
Although 66 percent of total respondents said that they would be willing to change employers in order to work closer to home, the percentage was much smaller for those employed by the government. Only thirty percent of those with a government jobs would change employment to be closer to home and 39 percent specified that they would not.
How Much Salary Willing to Forego for Work How Much Salary Willing to Forego for Work Trip Reduction of 10 minutes each way?Trip Reduction of 10 minutes each way?
72
11 9 80
102030405060708090
100
None$2-3K
$5-6K$10K+

George Mason University Center for Regional Analysis 2�
How Much Salary Willing to Forego for Work How Much Salary Willing to Forego for Work Trip Reduction of 20 minutes each way?Trip Reduction of 20 minutes each way?
50
22 1810
0102030405060708090
100
None$2-3K
$5-6K$10K+
How Much Salary Willing to Forego for Work How Much Salary Willing to Forego for Work Trip Reduction of 30 minutes each way?Trip Reduction of 30 minutes each way?
2315
33 29
0102030405060708090
100
None$2-3K
$5-6K$10K+

George Mason University Center for Regional Analysis 2�
Potential In-Commuters from Fairfax and Prince WilliamGeneral Characteristics of Survey Respondents
Eighty-one percent of respondents to the Potential In-Commuter survey were residents of Prince William County. Ten percent were residents of Fairfax and the remainder resided in other nearby counties.
Not surprisingly, Potential In-Commuter respondents had workplace locations that were very similar to respondents of the Fredericksburg commuter survey. Forty-seven percent of Fairfax/Prince William commuters in the survey traveled to the District of Columbia, 32 percent to Arlington, five percent to other Fairfax locations, and six percent to Alexandria. The table below shows Fairfax/Prince William respondents’ workplace in 2006.
Fairfax/Prince William FredericksburgDistrict of Columbia 47% 46%
Arlington County 32% 29% Fairfax County 6% 9% Alexandria 6% 6% Other 10% 10%
Of all respondents, a greater percentage of Fredericksburg respondents worked in Fairfax County than did Fairfax/Prince William respondents.
From home to work, 75 percent of respondents traveled for 45 minutes or more. Twenty-eight percent of respondents traveled for more than one hour from home to work. Seventy-nine percent traveled more than 45 minutes from work to home.
Nearly half of potential in-commuter respondents reported leaving home sometime between 6:00AM and 6:59AM. Thirty-four percent left home before 6:00AM and 18 percent left home after 7:00AM.
The most prevalent mode of travel for respondents is slug riding (a form of car-pooling): 44 percent of commuters in the survey use this mode from home to work. Thirty-three percent of commuters reported traveling by train and 15 percent by bus.
Similar to the Fredericksburg survey, only six percent of Fairfax/Prince William respondents drive alone to work. According to the surveys, the three most common modes of travel for both areas are slugging, train, and bus.
The percentages for mode of travel from home to work were nearly identical to those from work to home.
Similar to the Fredericksburg commuters, potential in-commuter respondents had fairly high salary levels: the same 37% make $100,000 or more, and only slightly fewer – 29% - make in the $75-$100,000 range.

George Mason University Center for Regional Analysis 26
Time of HomeTime of Home--toto--Work TripWork Trip
68
29
2 0.5 0.5
28
47
18
5 20
1020304050607080
One Hour +
45-60 Min
30-45 Min
20-29 Min
< 20 Min
Out-commutersPotential In-commuters
%
Time Leave Home to Go to WorkTime Leave Home to Go to Work
4
30
48
17
1 00
10
20
30
40
50
60
Before 5:00
5:00-5:59
6:00-6:59
7:00-7:59
8:00-8:59
9:00 +
%

George Mason University Center for Regional Analysis 2�
Mode of Travel to WorkMode of Travel to Work
61
44
33
15
105
101520253035404550
Drive Alone
Car-Van Pool
SlugTrain
Bus Other
%
Salary ComparisonSalary Comparison
3733
22
52 1
37
29
21
93 1
05
10152025303540
$100K +$75-$100K
$50-$75K
$35-50K$25-35K
< $25K
Out-commuters
Potential In-commuters
%

George Mason University Center for Regional Analysis 2�
Respondents from the Fairfax/Prince William survey had education levels that were slightly higher than those from the Fredericksburg Survey. Forty-five percent of potential in-commuters held graduate or professional degrees compared to 37 percent of out-commuter respondents. Overall, a total of 75 percent of potential in-commuter respondents had at least a bachelor’s degree. Only three percent had not had any college at all. The figures for level of education are presented in the next chart.
Highest Education Level Highest Education Level ComparisonComparison
3731 27
5
45
3021
40
1020304050
Graduate/Prof Degree
Bachelors
Some College
High School
Out-commuters
Potential In-commuters
%
EmployerEmployer
62
25
71 1 4
010203040506070
Federal Govt
Private Sector
Non-Profit
State/Local Govt
Self-employed
Other
%

George Mason University Center for Regional Analysis 2�
Consistent with high their high education levels, 77 percent of respondents worked in a management or professional occupation. Sixty-two percent of respondents are employed by the federal government and 25 percent by the private sector.
Attitudes about Commuting to Jobs in Fredericksburg Region
Since their commute time is already shorter, it follows that respondents to the Fairfax/Prince William survey would find longer commutes unreasonable. Potential in-commuters gave similar responses to out-commuters when asked how long they would like to travel from home to work. The table below compares the responses between the two surveys.
Trip Length Fairfax/Pr. William Fredericksburg< 20 Min 32% 47%
20 – 29 Min 35% 28% 30 – 45 Min 25% 15% 45 – 60 Min 8% 8% One Hour + 0% 1%
Like out-commuters, more than 90 percent of potential in-commuters would like their commutes to be 45 minutes or less. However, 75 percent commute for more than 45 minutes from home to work and many of those for more than one hour.
Thirty-two percent of potential in-commuter respondents indicated that they would accept a lower salary to work closer to their home. Sixty-eight percent responded that they would not accept a lower salary.
Would You Be Willing toWould You Be Willing to…… if You Could Work if You Could Work Closer to Home / Shorten Your Commute?Closer to Home / Shorten Your Commute?
32
7283
68
2817
0
20
40
60
80
100
Accept Less Salary
Change Employers
Reverse Commute
YesNo
%

George Mason University Center for Regional Analysis �0
Seventy-two percent of respondents specified that they would change employers to work closer to home and 83 percent would be willing to change the direction of their commute to shorten travel time.
When asked specifically what factors would affect the decision to reverse their commute, 73 percent of potential in-commuters indicated that a similar job or job level would be an important factor in their decision. Sixty-seven percent responded that similar benefits would also be important. Other factors that would be significant to this decision were the same kind of employer and a decreased commute time. The chart below shows how potential in-commuters responded to this question.
What Factors Would Be Important in What Factors Would Be Important in Considering Taking a Job in the Reverse Considering Taking a Job in the Reverse
Commute DirectionCommute Direction
73
34
67
9
31 33
100
102030405060708090
100
Similar Job / Level
Same Kind of Employer
Similar Benefits
Shorten Commute by 10 Min
Shorten Commute by 20 Min
Shorten Commute by 30 Min
Other
%

Appendix

1
Fredericksburg Fredericksburg Commuter Labor SurveyCommuter Labor Survey
JuneJune--July 2006July 2006
Residence LocationResidence Location
010203040506070
Caroline
Fredericksburg
King George
Spotslvania
StaffordOther
%
The majority of survey respondents reside in Spotsylvania and Stafford Counties.

2
Workplace LocationWorkplace Location
46
29
9 611
05
101520253035404550
D.C.Arlington
FairfaxAlexandria
Other
%
Most of the survey respondents are have long trips: 75% to DC and Arlington
Time of HomeTime of Home--toto--Work TripWork Trip
68
29
2 10
1020304050607080
One Hour +
45-60 Min
30-45 Min
< 30 Min
%
Most commuters are spending more than 2 hours a day commuting

3
Time of WorkTime of Work--toto--Home TripHome Trip
83
151 1
0102030405060708090
One Hour +
45-60 Min
30-45 Min
< 30 Min
%
Commuting trips in the evening are even longer than the morning trip
Mode of Travel to WorkMode of Travel to Work
5
2227
33
11
30
5
10
15
20
25
30
35
Drive Alone
Car-Van Pool
SlugTrain
Bus Other
%
Most commuters responding to the survey are using some form of transit.

4
SalarySalary
3733
22
52 1
05
10152025303540
$100K +$75-$100K
$50-$75K
$35-50K$25-35K
< $25K
%
Commuters are making generally good salaries
Highest Education LevelHighest Education Level
3731
27
5
05
10152025303540
Graduate/Prof Degree
Bachelors
Some College
High School
%
Commuters are well educated – more than 2/3 have a college degree.

5
EmployerEmployer
68
215 1 5
01020304050607080
Federal Govt
Private Sector
Non-Profit
State/Local Govt
Other
%
The Federal government is the primary employer of the commuters
In What Industry are You EmployedIn What Industry are You Employed
3 5 110
1
35
4
41
0102030405060
Agriculture, Forestry
Transportation, Warehousing
Construction
Information
Finance, Real Estate
Professional, Management
Education, Health
Other
%
The largest single industry of the commuters is Professional, Management.

6
How Long Would You Like for the How Long Would You Like for the Time of HomeTime of Home--toto--Work TripWork Trip
18
15
28
47
0
10
20
30
40
50
60
One Hour +
45-60 Min
30-45 Min
20-29 Min
< 20 Min
%
Most commuters would prefer to have a trip to work of less than 30 minutes (30 minutes is approximately the national average.)
Would You Be Willing to Take Less Would You Be Willing to Take Less Salary to Work Closer to Home?Salary to Work Closer to Home?
34 3828
0
10
20
30
40
50
60
70
YES NO Not Sure
%
One-third of commuters would take less salary to work closer to home. 28% might be willing depending on other factors as well

7
Would You Be Willing to Change Would You Be Willing to Change Employers to Work Closer to Home?Employers to Work Closer to Home?
66
19 15
01020304050607080
YES NO Not Sure
%
Two-thirds of commuters would be willing to change employers if they could work closer to home.
Currently Have Government Job Currently Have Government Job -- Willing to Willing to Work for Private Sector to Work Closer to Work for Private Sector to Work Closer to
Home?Home?
3039
31
0
10
20
30
40
50
60
YES NO Not Sure
%
Of those commuters working for the government, only 39% responded That they would not be willing to work in the private sector, if closer.

8
Currently Have Private Sector Job Currently Have Private Sector Job -- Willing Willing to Work for Government to Work Closer to to Work for Government to Work Closer to
Home?Home?
29
8
63
0
10
20
30
40
50
60
70
YES NO Not Sure
%
Only 8% of private sector commuters would not be willing to work for the government for a closer job.
How Much Salary Willing to Forego for Work How Much Salary Willing to Forego for Work Trip Reduction of 10 minutes each way?Trip Reduction of 10 minutes each way?
72
11 9 80
102030405060708090
100
None$2-3K
$5-6K$10K+
Even at a time savings each way of only 10 minutes, many commutersare willing to forego some salary for less commuting time.

9
How Much Salary Willing to Forego for Work How Much Salary Willing to Forego for Work Trip Reduction of 20 minutes each way?Trip Reduction of 20 minutes each way?
50
22 1810
0102030405060708090
100
None$2-3K
$5-6K$10K+
At a time savings of 20 minutes each way, half of commuters arewilling to forego significant salary.
How Much Salary Willing to Forego for Work How Much Salary Willing to Forego for Work Trip Reduction of 30 minutes each way?Trip Reduction of 30 minutes each way?
2315
33 29
0102030405060708090
100
None$2-3K
$5-6K$10K+
At a time savings of 30 minutes each way, three-fourths of commutersare willing to forego some salary, and over 60% more than $5,000.

10
Potential InPotential In--Commuter Commuter SurveySurvey
JuneJune--July 2006July 2006
Residence LocationResidence Location
10
81
90
102030405060708090
Fairfax Prince William
Other
%
Most respondents to the survey were residents of Prince William

11
Workplace LocationWorkplace Location
47
32
6 610
05
101520253035404550
D.C.Arlington
FairfaxAlexandria
Other
%
A large majority of potential in-commuters work in DC and Arlington
Time of HomeTime of Home--toto--Work TripWork Trip
28
47
185 2
01020304050607080
One Hour +
45-60 Min
30-45 Min
20-29 Min
< 20 Min
%
Three-fourths of potential in-commuters have a trip over 45 minutes

12
Mode of Travel to WorkMode of Travel to Work
61
44
33
15
105
101520253035404550
Drive Alone
Car-Van Pool
SlugTrain
Bus Other
%
Most potential in-commuters use some form of transit to commute
Time Leave Home to Go to WorkTime Leave Home to Go to Work
4
30
48
17
1 00
10
20
30
40
50
60
Before 5:00
5:00-5:59
6:00-6:59
7:00-7:59
8:00-8:59
9:00 +
%
Almost 80% of potential in-commuters leave home before 7:00AM

13
SalarySalary
37
29
21
93 1
05
10152025303540
$100K +$75-$100K
$50-$75K
$35-50K$25-35K
< $25K
%
Potential in-commuters are generally well paid
Highest Education LevelHighest Education Level
45
3021
305
101520253035404550
Graduate/Prof Degree
Bachelors
Some College
High School
%
Potential in-commuters are well-educated

14
EmployerEmployer
62
25
71 1 4
010203040506070
Federal Govt
Private Sector
Non-Profit
State/Local Govt
Self-employed
Other
%
The Federal government is the predominant employer of potential in-commuters
How Long Would You Like for the How Long Would You Like for the Time of HomeTime of Home--toto--Work TripWork Trip
07
2535 32
0
10
20
30
40
50
60
One Hour +
45-60 Min
30-45 Min
20-29 Min
< 20 Min
%
Potential in-commuters desire shorter commutes than they now have.

15
Would You Be Willing to Take Less Would You Be Willing to Take Less Salary to Work Closer to Home?Salary to Work Closer to Home?
32
68
0
10
20
30
40
50
60
70
YES NO
%
One-third of potential in-commuters would be willing to takeless salary for a shorter commute.
Would You Be Willing to Change Would You Be Willing to Change Employers to Work Closer to Home?Employers to Work Closer to Home?
72
28
0
10
20
30
40
50
60
70
80
YES NO
%
Almost 3 out of 4 would be willing to change employers
16
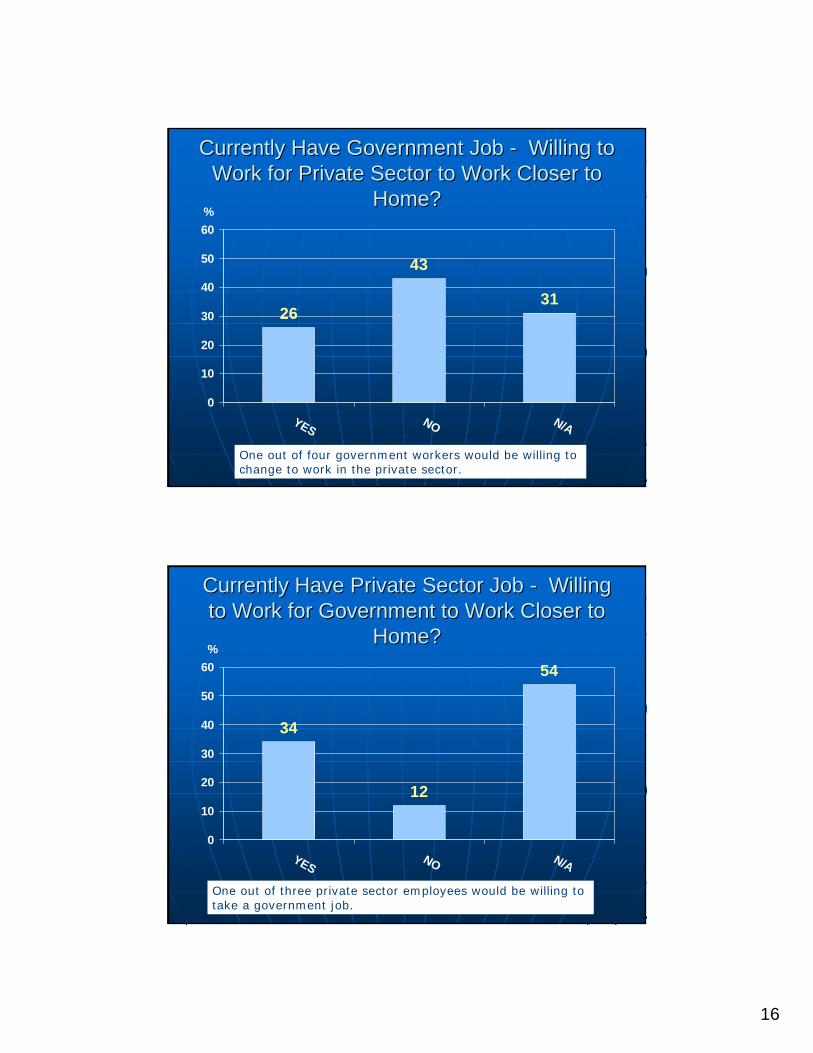
Currently Have Government Job Currently Have Government Job -- Willing to Willing to Work for Private Sector to Work Closer to Work for Private Sector to Work Closer to
Home?Home?
26
43
31
0
10
20
30
40
50
60
YES NO N/A
%
One out of four government workers would be willing to change to work in the private sector.
Currently Have Private Sector Job Currently Have Private Sector Job -- Willing Willing to Work for Government to Work Closer to to Work for Government to Work Closer to
Home?Home?
34
12
54
0
10
20
30
40
50
60
YES NO N/A
%
One out of three private sector employees would be willing to take a government job.

17
Would You Consider Taking a Job in the Would You Consider Taking a Job in the Reverse Direction (e.g. towards Fredericksburg) Reverse Direction (e.g. towards Fredericksburg)
to Shorten Your Commuting Timeto Shorten Your Commuting Time
83
17
0102030405060708090
100
Yes No
%
A large majority of potential in-commuters would consider taking a job close to Fredericksburg.
What Factors Would Be Important in What Factors Would Be Important in Considering Taking a Job in the Reverse Considering Taking a Job in the Reverse
Commute DirectionCommute Direction
73
34
67
9
31 33
100
102030405060708090
100
Similar Job / Level
Same Kind of Employer
Similar Benefits
Decreased Commute of 10 Minutes
Decreased Commute of 20 Minutes
Decreased Commute of 30 Minutes
Other
%
A similar job with similar benefits would be major factors in considering a job change.