Embed Size (px)
Citation preview

GEOMAGNETIC REVERSALS RECORDED IN CHINESE LOESS
J. SHAW Geomagnetism Laboratory, Liverpool University, U.K.
Introduction
The loess of China is a thick aeolian deposit covering much of central China (Figure 1). The source of the loess is not clearly understood but is thought to originate from either glacial grinding/weathering due to the rapid rise of the Tibetan plateau or from dust blown from the deserts to the north and west of China or a combination of both with the deserts being an intermediate reservoir. Whatever the source the resulting loess is very well sorted and loosely cemented by fine syngenetic carbonate, being coarser and thicker in the west and finer and thinner to the east. The Chinese loess was deposited over the past 2.4 Ma (Heller and Liu, 1982), covers a very large area (440,000 km 2) and is formed under a range of climatic conditions. During glacial periods almost the whole of the loess plateau was a desert and there is little evidence of soil forming processes. During interglacial periods easily identifiable palaesols were formed over much of the plateau except for the northern and western regions where desert conditions remained virtually unchanged. The loess/palaeosol stratigraphy provides possibly the best terrestrial record of Quaternary climatic change (Liu et al., 1985).
Magne tos t ra t ig raphy One of the most complete sections can be found at the edge of the Bahe river 20 km to the east of the ancient capital Xian and close to the homo erectus site at Lantian (Cheng et al., 1978; An and Ho, 1989; Shaw et al., 1991). The section consists of 133.5 m of loess/palaeosol on top of 61.5 m of Red Clay. Over 500 oriented hand samples were collected from the loess and Red Clay. Two 2 cm cubic paleomagnetic samples were taken from each hand sample and the 1000+ samples measmed using thermal demagnetization and principal component analysis to determine the palaeomagnetic directions (Zhent et al., 1992). The Brunhes normal polarity period can be clearly seen in the top 50 m of the section (Figure 2). Below this there are a number of normal and reversed intervals, the polarity stratigraphy is shown next to the depth scale.
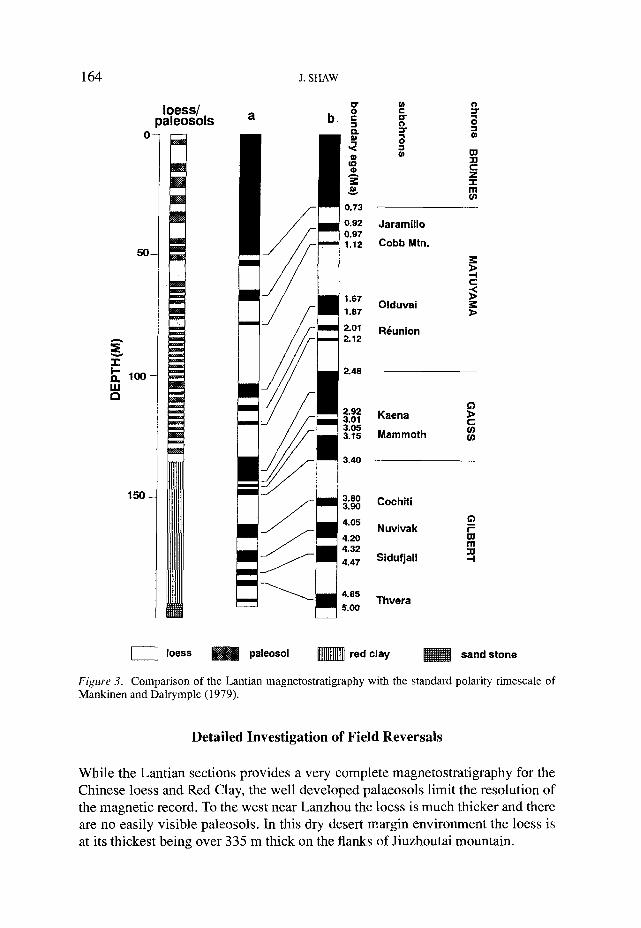
Comparing the polarity stratigraphy of Figure 2 with the standard polarity timescale of Mankinen and Dalrymple (1979) we see that there is excellent agree- ment and that the Lantian section covers the last 5 Ma (Figure 3). As well as containing all of the expected field reversals the Lantian section also contains a
Surveys in Geophysics 17" 161-167, 1996. @ 1996 Kluwer AcademicPublishers. Printed in the Netherlands.

162 J. SHAW
l \
/
f % MONGOLIA ,- ...J r2--
-----'-__..,-'--"' _~.~ Beijing/% Z' /
CHINA / CHINA / SEA
/ ~ ~ . ~ )~ - ~ ~ ~ ' ~ - 0 k i l o m e t r e s 1000 , ' * , f ~'J . . . . . . . . . . . . ! J I
Figure 1. Map of China showing the area of loess deposition (shaded).
short reversal just prior to the Brunhes/Matuyama (B/M) reversal boundary. This 'precursor' to the B/M reversal may explain why some workers have found the B/M boundary in the 8th palaeosol horizon while others have found it higher up between the 7th and 8th paleosol horizons in loess level 8, which is where it is in the Lantian section. The short reversed interval between the B/M boundary and the B/M precursor could be removed by pedogenic smoothing or simply missed by using larger sampling intervals thus giving the false impression that the B/M boundary is in loess level 8. It is important to know if the B/M boundary is in a loess (cool dry conditions) or palaeosol (warm humid conditions) as it is a global stratigraphic marker linking the terrestrial and oceanic palaeoclimatic records.
The magnetostratigraphy of the Lantian section clearly shows the onset of loess accumulation at 2.4 Ma and suggests an age of 5.0 Ma for the base of the Red Clay.

GEOMAGNETIC REVERSALS RECORDED IN CHINESE LOESS 163
(o;
50.
-r" I-,. i~100- 1:3
150-
D E C L I N A T I O N I N C L I N A T I O N 180 360 -90 0 90
i I I
i .
i
i
i !
!
I i
i i
- - _ _ �9
Figure 2,, Declination and Inclinati0n results from the Lantian section. The polarity stratigraphy is shown down the left hand side. Normal polarity is black, reversed white.
Just across the~Bahe river, and linked to the Lantian section by palaeosol stratig- raphy, is the Lantian Man homo erectus site. The cranium and mandible of Lantian Man were found near the villages of Gongwangling and Chenjianow (Wu, 1964, 1966). The cranium was stratigraphically the oldest of the finds with a biostrati- graphic:age of 0.7 Ma (Aigner and Laughlin, 1973). Using the magnetostratigraphy of the Lantian section the cranium was found just below the Cobb Mountain event and therefore has an age of 1.7 Ma (Shaw et al., 1991). This is one of the oldest reliable ages for homo erectus in China.
164 J. SHAW
5 0 -
:1: i-- 12. 1 0 0 - UJ
1 5 0 - -
loess/ )aleosols
O -
b o- r o o r :~ c r -,i o
c z
r z m r
0.73
0.92 Jaramillo 0.97 1.12 Cobb Mtn,
1.67 O lduva i
1.87
2.01 R~un ion 2.12
2.48
c
~>
2.92 Kaena ~> 3.01 c 3.05 r 3.15 M a m m o t h
3.40
3.80 Cochiti 3.90
4.05 N u v i v a k F
4.20 oo m 4.32
4.47 S iduf ja l l --I
4,85 Thvera 5.00
[ ~ loess ~ paleosol ~ red clay ~ sand stone
Figure 3. Comparison of the Lantian magnetostratigraphy with the standard polarity timescale of Mankinen and Dalrymple (1979).
Detailed Investigation of Field Reversals
While the Lantian sections provides a very complete magnetostratigraphy for the Chinese loess and Red Clay, the well developed palaeosols limit the resolution of the magnetic record. To the west near Lanzhou the loess is much thicker and there are no easily visible paleosols. In this dry desert margin environment the loess is at its thickest being over 335 m thick on the flanks of Jiuzhoutai mountain.
GEOMAGNETIC REVERSALS RECORDED IN CHINESE LOESS 165
-90
90
0 ~
60
(a)
�9 ~ . t ~ ~ 7 ~ ~k-~ 1 *Y~ o ~
�9 ~o , t , , 0 7 .I )" ~#.~ - "'-~-~-:, ! / ' / f , , , o<, / ~> '" i Oo . . 'll oi~i o~
0 site
�9 Upper Jaramil lo N-R Transition
(b)
O0 0 @@
O0@n 0
30 0
180
o Lower Jaramillo R-N Transition
(c)
25
0 0 0 90 180 0 180 360
Colatitude Longitude
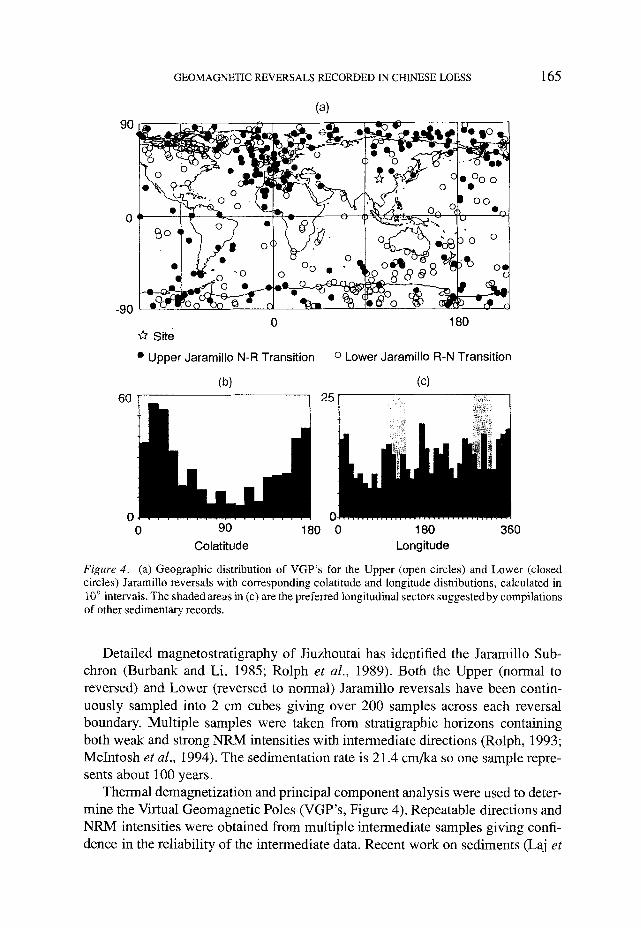
Figure 4. (a) Geographic distribution of VGP's for the Upper (open circles) and Lower (closed circles) Jaramillo reversals with corresponding colatitude and longitude distributions, calculated in 10 ~ intervals. The shaded areas in (c) are the preferred longitudinal sectors suggestedby compilations of other sedimentary records,
Detailed magnetostratigraphy of Jiuzhoutai has identified the Jaramillo Sub- chron (Burbank and Li, 1985; Rolph et al., 1989). Both the Upper (normal to reversed) and Lower (reversed to normal) Jaramillo reversals have been contin- uously sampled into 2 cm cubes giving over 200 samples across each reversal boundary. Multiple samples were taken from stratigraphic horizons containing both weak and strong NRM intensities with intermediate directions (Rolph, 1993; McIntosh et al., 1994). The sedimentation rate is 21.4 cm/ka so one sample repre- sents about I00 years.
Thermal demagnetization and principal component analysis were used to deter- mine the Virtual Geomagnetic Poles (VGP's, Figure 4). Repeatable directions and NRM intensities were obtained from multiple intermediate samples giving confi- dence in the reliability of the intermediate data. Recent work on sediments (Laj et

1 6 6 J. SHAW
0 o
v
iT.
0 0 UO 0 tO O4
eseq eAoqe st~01..-I
v
I . t I �9 1'- 0 0") CO
(w) l q6!eq q eJ~,S
rr
0
CO
v
I i CO I ~ s I 0
(w) 146!aq 'leJ~,8
E
0
0
�9
0
0
~ , c b
� 9
= ~

GEOMAGNETIC REVERSALS RECORDED IN CHINESE LOESS 167
al., 1991; Tric et al., 1991) suggests that there is longitudinal confinement of VGP paths within antipodal bands centered on North America and Australasia. However, this longitudinal confinement is absent in a compilation of transitional VGP's from volcanic records (Valet and Camps, 1992; Prevot and Camps, 1993). The preferred bands are shown in Figure 4c and it is clear that the Jaramillo reversals recorded in the loess, like the lava records, do not support the idea of longitudinal confinement of the transitional VGP's.
In common with other records of the Upper (cf Chauvin et al., 1990) and Lower (cf Clement and Martinson, 1992) Jaramillo transitions there are a number of VGP features/clusters over North America, South America, Australia and the Pacific, and northern Africa. Some of these features correlate with persistent core/mantle flux features of the recent geomagnetic field (Gubbins and Bloxham, 1987) supporting the idea that the non-dipole field has very long term features that substantially contribute to the transitional geomagnetic field.
Because the loess around Lanzhou is very uniform with little evidence of pedo- genesis, the magnetization of the loess is primarily controlled by the concentration of magnetic minerals and the strength of the geomagnetic field. Dividing the nat- ural remnant magnetization by a laboratory anhysteretic magnetization, both AF demagnetized to 40 mT, corrects for changes in magnetic concentration and allows changes in relative palaeointensity to be observed (McIntosh, 1994).
The similarities between the relative paleointensity records from the Upper and Lower Jaramillo are remarkable (Figure 5). Even more remarkable is the similarity between these two relative paleointensity records and the palaeointensity record obtained from the Steens Mountain volcanic sequence (Prevot et al., 1995). All three records show a slow decay of the field preceding the transitions, a very weak field during the transition, and a rapid oscillating recovery of the post transi- tional field intensity (McIntosh, 1994). The total time for the reversal to occur is approximately 10,000 years.
Acknowledgments
Particular thanks to Professors An Zisheng, Wang Jingtai and Edward Derbyshire for their encouragement and help. This work has been supported by the Royal Society, the British Council and the NERC.