Embed Size (px)
Citation preview
IN REPLY REFER TO:
UNITED STATESDEPARTMENT OF THE INTERIOR
GEOLOGICAL SURVEYWASHINGTON 25, D. C.
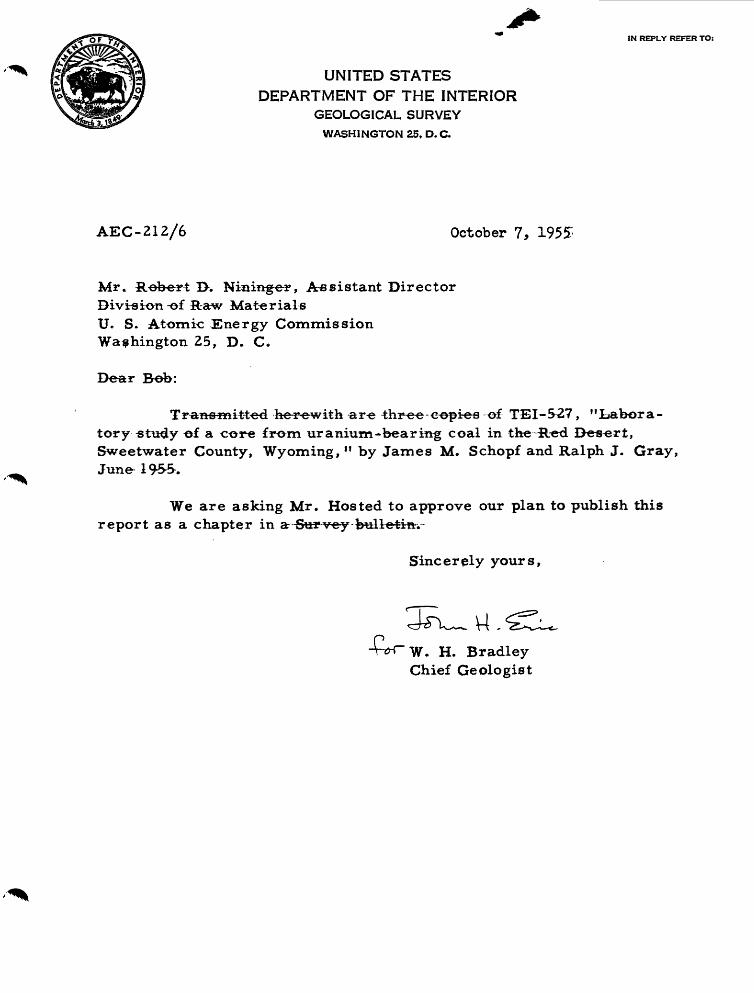
AEC-212/6 October 7, 1955
Mr. Robert l>. Nininger, Assistant Director Division-of Raw Materials U. S. Atomic Energy Commission Washington 25, D. C.
Dear Bob:
Transmitted herewith are three-copies -of TEI-S27 , "Labora tory «tudy of a core from uranium-bearing coal in the Red Desert, Sweetwater County, Wyoming, n by James M. Schopf and Ralph J. Gray, June- 19-5-S.
We are asking Mr. Hosted to approve our plan to publish this report as a chapter in a-Ster-vey bullctin.-
Sincerely yours,
w. H. Bradley Chief Geologist

Geology ^tnd Mineralogy
This document consists of 57 pages, Series A
UNITED STATES DEPARTMENT OF THE INTERIOR
GEOLOGICAL SURVEY
LABORATORY STUDY OF A CORE FROM URANIUM-BEARING COAL
IN THE RED DESERT* SWEETWATER COUNTY, WYOMING*
By
James M. Schopf and Ralph J. Gray
/
June 1955
Trace Elements Investigations Report 5Z7
This preliminary report is-dis-tributed without editorial -and -technical review for confortnity'with official standards and nomenclature. It is not for public inspection or quotation.
*This report concerns work done on behalf of the Division of Raw Materials of the U. S. Atomic Energy Commission.

USGS-TEI-527
GEOLOGY AND MINERALOGY
Distribution (Series A) No. of copiesArgonne National Laboratory, ................. IAtomic Energy Commission, Washington ..........••• 2Battelle Memorial Institute, Columbus. ............ 1Carbide and Carbon Chemicals Company, Y-12 Area. ....... 1Division of Raw Materials, Albuquerque .........*.* 1Division of Raw Materials, Butte <,...........*.. 1Division of Raw Materials, Casper. .............. 1Division of Raw Materials, Denver. .............. 1Division of Raw Materials, Hot Springs ............ 1Division of Raw Materials^ '.£shpeming ............. 1Division of Raw Materials, Phoenix .............. 1Division of Raw Materials, St. George. ...........* 1Division of Raw Materials, Salt Lake City. .......... 1Division of Raw Materials, Washington. ............ 3Dow Chemical Company, Pittsburg. ............... 1Exploration Division, Grand Junction Operations Office. ... 1Grand Junction Operations Office ............... 1National Lead Company, Winchester. .............. 1Pennsylvania State University, University Park (Spackman). . , 1Technical Information Service, Oak Ridge ........... 6Tennessee Valley Authority, Wilson Dam ............ 1U. S e Geological Survey;Fuels Branch, Washington ................... 3Geochemistry and Petrology Branch, Washington. ........ 1Geophysics Branch, Washington. ................ 1Mineral Deposits Branch, Washington. ............. 1E. H. Bailey, Menlo Park ................... 1A. L. Brokaw, Grand Junction ................. 1N. M. Denson, Denver ..................... 1R. J. Gray, Columbus ................ ..... 1R. L. Griggs, Albuquerque. .................. 1J. W. Huddle, Lexington. ................... 1M. R. Klepper, Spokane .................... 1A. H. Koschmann, Denver. ................... 1J. D. Love, Lararnie. .. ... .............. «o 1L. R. Page, Washington .................... 1J. F. Pepper, New Philadelphia ................ 1J. M. Schopf, Columbus .................... 1Q. D. Singewald, Beltsville. ................. 1A. E. Weissenborn, Spokane .................. 1TEPCO, Denver. .......... A ............. 2TEPCO, RPS, Washington (including "master). .......... 2
53

CONTENTSPage
Abstract .................................................... 6
Introduction ................................................. 7
Acknowledgments ........................................ 7
Previous investigations-....................................... 8
General description of the material studied ..................... 10
Radioactivity and uranium content ............................. 11
Occurrence of other trace elements ........................... 15
Coal analyses ............................................... 20
Coal petrology .............................................. 26
Microscopic-appearance ................................. 29
Relation of petrologic composition to occurrence of uranium-. .... 38
Petrology of selected layers . . ................................ 42
Source of waxy matter ................................... 46
Literature cited ............................................. 49
Appendix; core description ................................... 51

ILLUSTRATIONSPage
Figure 1. Index map showing location of hole 72 ................ 9
2. Correlation of uranium content with radioactivitymeasurements .................................... 12
3. Radioactivity measurements ctmipared with apparentspecific gravity and ash content ..................... 13
4. Comparison of specific gravity and ash contentof selected samples ................................ 14
5. Profiles of chemical elements detected in coal and associated beds; Si& Al, Fe, Ca$-Na, Mn, Co, V, Zr, Ge, Ag, Sn, By, U ...................... 17
6. As above; Mg, Ti, Pb» Ga, Cr, Ni, Cu, Se, Ba,, U .... 18
7. As above; Y, Ce, Nd, La, Sr, Be, Yb, B, Mo, U..... 19
8. Comparison of petrol ogie and proximate composition of coal analytic samples with ash and uranium contents .......................................... 25
9. Mieros-eo-pic composition of thin sections ............ 31
10. Diagram showing relationship of anthraxylon,translucent attritus-, and uranium ................... 39
11. Comparison of petrologic composition, whole coalbasis, with uranium and ash contents ................ 40

TABLESPage
JL a Die i. "fclements identiiied "by spec trogr~ap4iy m traceelements samples from hole 72 ...................... 16
2. Elements searched for but not identified by spec-trography of trace elements sample* from hole 72 ..... 16
3. Occurrence of germanium in special samplesfrom hole 72 ....................................... 21
4. Proximate analyses of selected composite samplesof shaly coal and banded coal from hole 72 ............ 22
5. Coal analyses- of core samples- from hole 72 .......... 23
6. Calorific and ash valuer from core samplesof hole 72 ......................................... 24
7. Summary of petrologic constituents in coal bedsfrom hole 72 ...................................... 26
8. Percentages of coal con-stituents in upper and lower divisions of the bed and in coal analytic samples, calculated on visually pure basis .................... 28
9. Yitrain in samples of Lruman coal ................... 30
10. Percent petrologic composition ©f selected coallayers, R-ed Desert hole 72 ........................ 43
11. Percent composition of translucent attritus inselected coal layers, Red Desert hole 72 ............ 45

LABORATORY STH0Y OF A-GORE- FROM URAmiJM-BEARING COAL
IN THE R-B0 DESERT, SWEETWATER COUNTY, WYOMING
by James M. iSchopf and Ralph J. Gray
ABSTRACT
This report presenta there&ults of a detailed laboratory study of
uranium in an 8-inch cere-ef ceal and cealy^hale drem the Luman lN"o. 1
coal bed in tir*e northern part ef the Red Desert area, Sweetwater County,
Wyoming. Results of-micrescepie, sjpe€tr^gra|^iic i chemical, and radio-
i»etric wo^rk are presented for-&tes- frem this eore. The Liai^an N^. 1
bed at this- locality appears to be a characteristic example of the uraniferous
coal of the Red 3>esert area.
Layers of impure eoal eont ain mere u-rani^m than purer eoal layers.
The uranium probably ts in intimate assoeiation with the carbonaceous
material as- a-n organo~uraniui» complex or e©MErpoend« Semitjuantitative
s-peetrographic anaiy«es-were studied for many other elements, but none
«how a distribution pattern that is sufficiently similar to that of uranium
to- indicate a similarity in-mode of deposit.
Mieres-eopic studies—show that the-eeal is-domin'antly attrital, and that
highly uraniferous- layers usually have a -considerable armount-efamorphous
waxy and clayey i^ineral ^natter and eorfi-monly lie adjacent t-o-a layer of
much greater-mrineral ^entetit. The extent of organic-degradation, type of
-«Bfganic matter, a-nd -the -oceurrenee-of Kftineral impurities all appear te have
significance in relation to the natural concentration of uranium in this deposit.

INTRODUCTION
This report gives-results of a -detailed-study of one of the-Red Desert
coal bed® and its associated sediments from a -core $ inches in diameter
that was-ebtained fo-r special s-tudy at the elose-of the 1953 field season.
The coal and uranium occurrences- in this -8~ineh Red Desert core
appear to be generally -eomparable to the -other occurrences in coal in
this district insofar as they are known to us-. The sample-material avail
able from the large core has-provided anexeelient opportunity for estab
lishing the nature of the coaly materials associated with varying uranium
content in the Red Bese-rt area. Ttte investigation-was- conducted by the
Geological Survey on behalf of the Division of Raw Materials of the U. S.
Atomic Energy Commission.
Acknowledgments
Uranium, ash, and-speetrographi-e oveterminatlons on TE samples
have been carried out at the Washington Trace -Elements Laboratory of the
U. Si Geological Survey. Coal analyses a^d real specMic gravity determi
nations--have beenr-irtatde-by the Coal Analysis Section of-the U. 5. Brureau of
Mines-under-supervision of Roy Abernethy. James War-man, Heiary Hildreth,, i
and Bruee Middle-ten brave assisted in preparing the core description, sampling,
radioactivity and apparent specific gravity-measurement, in preparation and
microscopic analysis-of thin sections. Charles J. y^lix-a-ssiste^d'-in the calcu
lation of petrologic and analytic results and in maceration of coal samples
used for this report.

PREVIOUS INVESTIGATIONS
The-s-ouree location for the material -s-tudled irs -shown on the index
map in figure 1. Hole 72 was drilled in the SE 1/4 NW 1/4 -see. 15, T. 24 N. ,
R. 95W, , about 30 miles north of Wamsutter in the northeastern part of
Sweetwater County. The core samples the Luman No. 1 coal bed mapped
through the area by Masursky and Pipiringos (in preparation).
The Red Desert-coal field is in the northeastern part of the extensive
Eocene basin in-s-oathwestern Wyoming. This ^basin was formerly largely
occupied by deposits-of the Was ate h and Green River formations which still
are exposed over large areas including part of the Red Desert. It seems
reasonable to -suppose that the general conditions of rainfall, temperature,
evaporation, relief, and erosion that have been established by Bradley
(1930, 194&) in determining the mode of origin for the Green River formation
apply equally to this coal-bearing -s-equenee. These conditions evidently
had considerable bearing on the type characteristics of the coal.
The organic composition of the oil shale and coal offers points for
comparison, particularly in the impure layers a-ss-ociated with the coal.
-Plant micr-ofos-siis simitar to s-ome of those in the coal also-^&eenr in the
oil shale (Bradley, 1931), but the matrix is different. Wodehouse (1933)
identified an extensive flora based on pollen of the oil shale. Other reports
pertinent to the-paleobotany, paleoeeology and general environment of the
Green River Lake areas have been given by Berry (1930), Brown (1929r
1934), and by Chaney (1944). A recent study of petrified woody remains

R96W R95W R94W R93W
INDEX MAP OF WYOMING
To Rawlins 27Miles
To Rock Springs 78 Miles
X/// Ptoya areas R94W R93W R92W
FIGURE I.-INDEX MAP SHOWING LOCATION
OF HOLE 72, SWEETWATER COUNTY, WYOMING

10
of Green River age by Kruse (1954) re-emphasizes the tropical to sub
tropical character of the flora.
Breger, Deal, Meyrowitz (in pres-s) have described chemical and min-
eralogieal features- associated with uranium in a thin and relatively pure
layer of the Luman No. 1 bed.
* GENERAL DESCRIPTION OF THE MATERIAL STUDIED
Slightly over 9 feet of the 8-inch diameter core was recovered in a
1^-foot run, -starting at a-<iepth of approximately 96 feet. In the-laboratory
several longitudinal segments were cut from the core for preparation of
thin sections, ^etermina-tion of radioactivity, chemical determination of
uranium, spectrographie determination of elements detectable in the ash,
and for standard coa-1 analyses.
The core-st udied includes the foil-owing -sueee-s-sion of beds:
Character and thicknes-s- Depths in feet1. silty shale (3. 36') ........................ 96.00* to 99.36*2. impure and shaly coal {. 92') ............... 99. 36 ! to 100. 28*3. upper coal bench, relatively pure (.84*) .,... 106.28* to 101.12'
-4, impure and shaly coal (. 32*) ............... 101.12' to 101.44 15. light gray "middle 11 shale (. 31 1 ) ............. l&l.44* to 101.75'6. shaly coal and coaly shale (2. 23 1 ) ........... 101. 75* to 103. 98«7. lower <:oal bench, relatively pure (. 72J ) ..... 103. 9&* to 104. 70'8. coaly shale (.12') ......................... 104.70' to 104.82«9. plastic clay (.18*) ......................... 104.82* to 105.00'
The -general features- of the section are indicated diagramma tic ally,
with some indication of additional differentiation of layers, in figures 2,
3, and 8 to indicate the correlation of lithology with other data. Micro
scopic study has as-s-isted in further lithologie diHeT-efitiation as indicated
by the additional thin layers in the "micro11 lithologic section of figures
10 and 11

II
Coal of the two purer benches, noted above, is largely thin- or micro-
banded. One vitrain band band 3/4-of an inch thick is an exceptional
occurrence near the base. A very small amount of vitrain is present in
the lower bench of coal and this occurs in bands less than 2 millimeters
thick. Aside from the few vitrain bands, all the coal ha-s-a—moderately
dull to moderately bright luster and is sparingly eleated. The luster is
diminished, and cleat is very poorly developed or absent in the impure or
shaly layers. The impure layers have a tendency to break into tabular
pieces, owing to the Striped" distribution of clayey impurities.
The s-haly or clayey layers show no striking features. Ho identifiable
megascopic plant or an|a*ial fossil remains and no uroot zones" were ob
served. Small carbonaceous fragments can usually be detected in the shales,
RADIOACTIVITY AND URANIUM CONTENT
The radioactivity ^f the core from hole 72, expressed in-fmls-espeir
minute per gram as determined in the coal geology laboratory, the radioac-"
tivity expressed as equivalent uranium as determined in the geochemical
laboratories, and the chemically determined uranium, are shown graphi
cally in figure 2. The generally good agreement between chemical and
radioactive indications suggests that the uranium in most samples is in good
equilibrium with its daughter products.
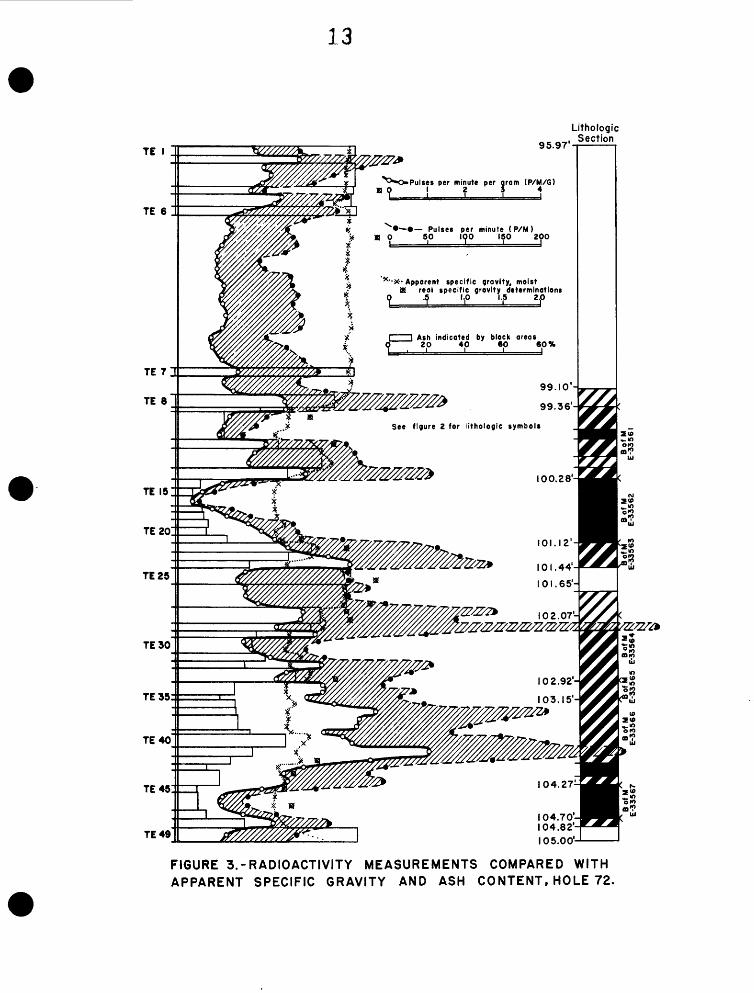
The relationships between radioactivity (pulses ^er minute and pulses
per naintite-per--gratrrr)-, -specific gravity, and ash content of the coal an,d inter-
bedded rock of the core, are shown in figure 3. The relatively purer, low

12
95.97'
Litholpgic Section
96.87'-
Uron'um , chemicolly determned. 0 .002% .006% .01%
-Pulses per minute per grom ( P/M/G) 01234
( I P/M/G uni = ca 27ppm U )
'•X-.. Equiva ent uranium (eU)0 .002% .006% 01%
Lithologtc symbols
Carbonaceous sha'e
impure coal or coaly shale
Coal
Slightly or Non carbonaceous
104.27'Bof M
E-33567104.70' 104.82-
105.00-
FIGURE 2.-CORRELATION OF URANIUM CONTENT WITH RADIOACTIVITY MEASUREM ENTS , HOLE 72.
13
TE I
TE 6
95.97
Lithologic , Section
TE35
TE40
TE45
TE49
^••O-Pulses per minute per gram (P/M/G)' f J 1
*if •—•— Pulses per minute ( P/M )
** " ° 50 100 150 200
*
X- -X-- Apparent specific gravity, moist8 real specific gravity determinations
See figure 2 for iithologic symbol*
FIGURE 3.-RADIOACTIVITY MEASUREMENTS COMPARED WITH APPARENT SPECIFIC GRAVITY AND ASH CONTENT, HOLE 72.

2.5 -r
2.0-
1.5
1.0 90-
80-
70-
60-
50-
40-
30-
20-
10-
«"••
••^
-^
XX
X o ® 9- -Lab. Sample Numbers > X /
o o ©^ /6 4 8 40 55 54 10 X y- AA^AA/^OA '/
9s*>
O
Os'b
tt>Q.
>
v /
>
v t\ /\ /v /p ^\^ \^X y
v c*V 0̂/" *C X JVe> ©
v^f^ >V^t f 3
v ^^ ^^A, 1 30\ f r> ^ O^ r» ^ 1 31 1
-X _ ^* ^A 1 99 1 W >
V
3>
f \
\
I^IM ^
G/
7<7
5
^ >
3 '
^ \1, o x« J+-* 'I 5 , V ^ V '0^"
©.^ fj '0 | o o o o
©^ © ™ ^.o^ ^ ̂ o o o o
o ^ ^* ^ o o Difference between0^ ̂ 0 apparent and real specific gravity
X Oo °^^ °
_ ^ ̂
o
FIGURE 4.-COMPARISON OF SPECIFIC GRAVITY AND ASH CONTENT OF SELECTED SAMPLES.
15
ash and low specific gravity, coal layers show the least radioactivity and
have a low uranium content.
Sixteen of the sample blocks used for determination of the apparent
specific gravity were dried, crushed, and submitted to the Bureau of Mines
laboratory for real specific gravity determinations. The suite of samples
was ehos-eti to-range from coal with about 10 percent ash, to«hale with
over 90 percent ignition residue. The results are given in figure 4, ar
ranged in order of their real specific gravities, and compared with their
corresponding apparent specific gravity values and with their ash contents.
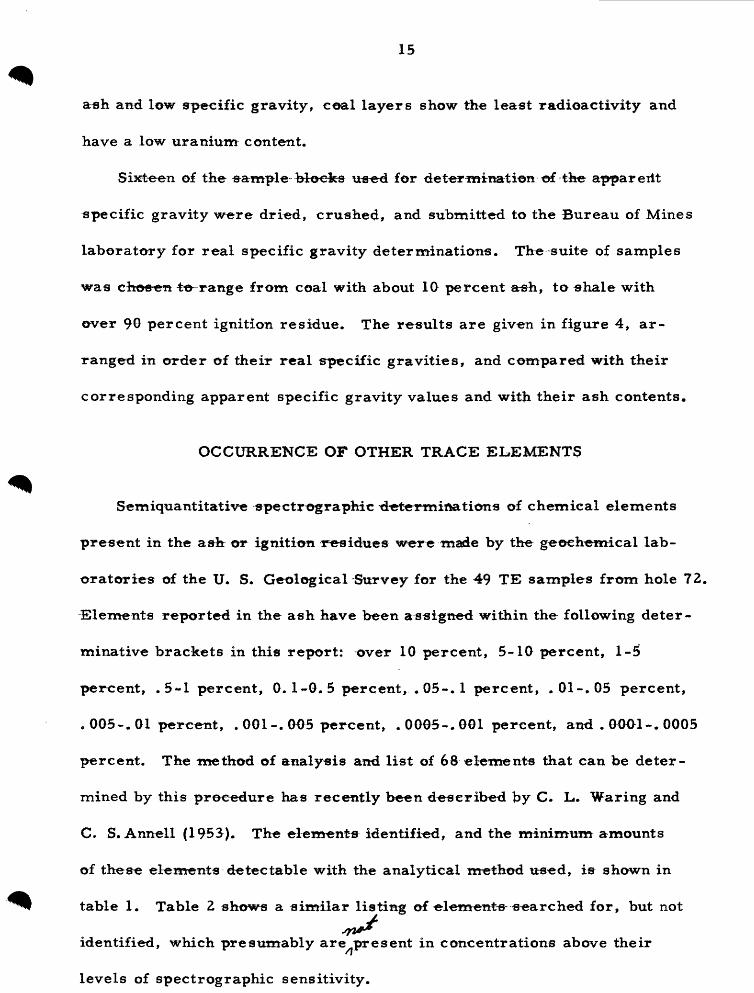
OCCURRENCE OF OTHER TRACE ELEMENTS
Semiquantitative spectr ©graphic tl-etermitfcations of chemical elements
present in the ash or ignition residues were made by the geoehemical lab
oratories of the U. S. Geological Survey for the 49 TE samples from hole 72,
^Elements reported in the ash have been assigned within the following deter
minative brackets in this report: over 10 percent, 5-10 percent, 1-5
percent, .5-1 percent, 0. 1~0. 5 percent, . Q5-. 1 percent, .01-, 05 percent,
o 005-. 01 percent, . 001 -. O05 percent, . 0005-. 001 percent, and . OOO1-. 0005
percent. The method of analysis and list of 68 elements that can be deter
mined by this procedure has recently been described by C. L. Waring and
C. S. Annell (1953). The element* identified, and the minimum amounts
of these elements detectable with the analytical method used, is shown in
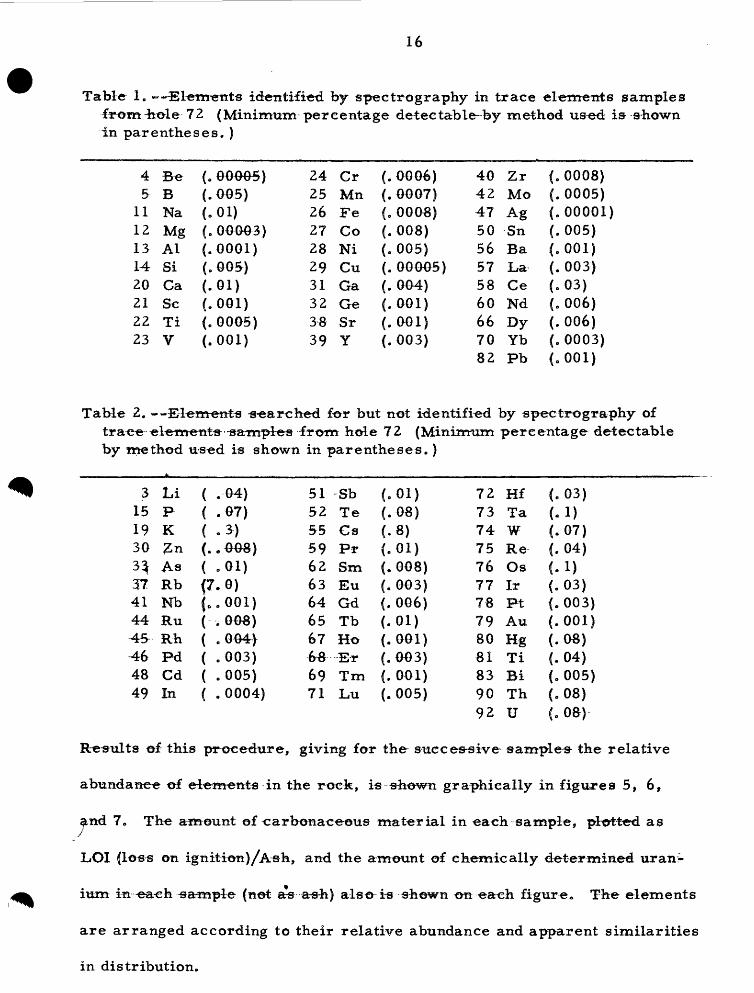
table 1. Table 2 shows a similar listing of elements- searched for, but not
identified, which presumably are present in concentrations above their
levels of spectrographic sensitivity.
16
Table 1. -"-^Elements identified by speetrography in trace elements samples ^rom-hole 72 (Minimum percentage deteetable-by method used is- shown in parentheses. )
45
1112131420212223
fieBNaMgAlSiCaScTiV
(,00005)(.005)(.01)(. 00003)(.0001)(. 005)(.01)(.001)(. 0005)(.001)
24252627282931323839
CrMnFeCoNiCuGaGeSrY
(. 0006)(. 0007)(oOOOS)(.008)(.005)(. 00005)(. 004)(.001)(. 001)(.003)
4042475056575860667082
ZrMoASSnBaLaCeNdDyYbPb
(.0008)(.0005)(.00001)(.005)(.001)(.003)(.03)(.006)(.006)(.0003)(.001)
Table 2. --Elements searched for but not identified by speetrography of trace element* -samples from hole 72 (Minimum percentage detectable by method used is shown in parentheses.)
31519303}37414445464849
Li iP iK i£n iAs jRb 1Nb |Ru |Rh |Pd |Cd |In |
( --04)( .07)( • 3-)(..008)( .oi)(7.0)(,..001)( . 008)[ . 004}( .003)( .005)[ .0004)
515255596263646567&$6971
SbTeCsPrSmEuGdTbHoErTmLu
(.01)(.03)(.8)(.01)(. 008)(. 003)(.006)(.01)(. 001)(. 003)(. 001)(.005)
72737475767778798081839092
HfTaWReOsIrPtAuHgTiBiThU
(.03)(.1)(.07)(.04)(.1)(.03)(.003)(.001)(.08)(.04)(.005)(.08)(. 08)
Results of this procedure, giving for the sueces-sive samples- the relative
abundanee of elements in the rock, is shown graphically in figures 5, 6,
a«d 7. The amount of carbonaceous material in each sample, plotted as
LOI (los« on ignitien)/Ash, and the amount of chemically determined uran:-
ium in each -sample (not ars a-s-h) also is s&own on each figure,, The elements
are arranged according to their relative abundance and apparent similarities
in distribution.

Loss
on /
ignitio
n/A
sh
TE
8
J^r5
0%
Ash
[24.l%
Ash
TE
I5
TE
20
TE
25
TE
30
TE
35
TE
40
TE
45
TE
49
U (C
hem
.)
o.o
i %
Ge
Ag
Sn
I ,0
01
%
^0
01
%
I -0
01 %
TTo^
i. 11
0%
Si a A
t Fe
No
a
Co
Mn
.001%
Dy
Se
milo
ga
rith
mic
sc
ale
10.
5.
2.5
1.0
.5
.25
.1 .0
5 .0
1
I 0.0
1 %
U (C
hem
.)
FIG
UR
E
5.
PR
OF
ILE
S
OF
CH
EM
ICA
L
EL
EM
EN
TS
D
ET
EC
TE
D
IN
CO
AL
AN
D
AS
SO
CIA
TE
D
BE
DS
, H
OLE
72.
_L-L
_J_
I .
II
I...L
.OO
I.0
001 %
__I
=-in
crea
sing
——
C
ON
CE
NT
RA
TIO
N
——
decr
easi
ng-^
- •E
lem
ents
n
ot
indic
ate
d
by
routin
e
spect
rogra
phy

Loss
on
TE
25
TE
30
TE
35
TE
40
TE
45
TE
49
100%
U (C
hem
.).0
1%
FIG
UR
E
6.
PR
OF
ILE
S
OF
C
HE
MIC
AL
E
LE
ME
NT
S
DE
TE
CT
ED
IN
C
OA
L A
ND
A
SS
OC
IAT
ED
B
ED
S,
HO
LE
7
2.
Bo
Sem
ilogorith
mic
sc
ale
10.
5.
2.5
1.0
.5
.25
.1 .0
5 I.I
.
I.I
.
I.I
.01 I
0.0
!%U
(Che
m.)
.001
.0
001%
_1,1
, I
•incr
easi
ng—
CO
NC
EN
TR
AT
ION
—
de
cre
asr
ng

CD
CO
o_0
-^ °.E
» «3$ jcO <<__
_ O —Z> q—
o ~ o CA _
u1 •£ «— .- q~
- o 2,_-° 2 oo 'c m |~-
i— <f>1 m in ~Jg CO>§ p_
r̂ « ^ - ^O >- in —O P 0-
1c c"v
cau 5.aX
2C
&ah2UC2 CC
Cc '3ca!•
C
C
1
O UJI-0 UJ
UJoCOh-"Z.
UJsUJ_lUl
CJ
UJ
< v>u QS ̂J2 QOUl^ QU UJ
L_ oCO UJ
o o(O (O
u.O Qcn zQ. <
Ula:
u_
u

20
As the ash (or ignition residue) varies from 7, 2 percent to over 90 per
cent indifferent sample* of the suite from hole 72, direct comparison of ;
speetrographic analyses -of the a-sh is-difficult to interpret in terms of actual
geologic occurrence of different-elements in the rock. The relative abundance
of an element in the rock, as opposed to the occurrence in the ash, may be
determined approximately from semi-quantitative analyses by compensating
for the concentration that takes place in burning the samples in preparation
of ash or ignition residues.
In order to te«t the possibility of an association of germanium-w-ith vitrain
in TE-9 and TE-10 a special series of samples was submitted for spectr^
graphic analysis. Results aire given in table 3.
COAL ANALYSES
Proximate analyses, calorific, ash fusibility and specific gravity values
for composite samples of purer banded coal and of impurfe (shaly) coal layers
of the core are given in table 4. Proximate and ultimate analyses and other
values for all the core as divided in seven layers are given in table 5»
arranged according to the-sequence of samples in the drill core. All stand
ard coal analyses have been made by the U. -S. Bureau of Mines. The Bureau
laboratory numbers, corresponding to respective intervals as s-armpled,
are shown in relation to the analytic tables and the lithotogic sections and
trace element sample intervals in figures 2, 3, 8, 10, and 11.

Tab
le 3
. --
Occurr
ence
of G
erm
aniu
m i
n S
pec
ial
Sam
ple
rs f
rom
Ho
le 7
2 I/
Desc
ripti
on
and
Sam
ple
no.
Coal
y s
hale
7
2T
E-9
-1
Att
rita
l co
al7
2T
E-9
-2
Att
rita
l co
al72T
E-1
0-3
Att
rita
l co
alw
ith v
itra
in72T
E-1
0-4
Pure
vit
rain
72T
E-1
0-5
Py
riti
t: v
itra
in
72T
E-1
0-6
Dep
ths
and
Inte
rval
99.3
1 t
o
99
.36
*
99.3
6 t
o9
9.5
3*
(.17
*)
99.
53^
to9
9.7
3*
99
.53
to
99
.73
*(.
2*)
99.7
3 t
o99.7
55*
(.0
25
')
99
.75
5 t
o
99.7
7*
Ash
G
e A
«h
perc
en
t in
ash
perc
ent
(MF
2/)
(M
F)
(AR
3/)
62.7
^.0
010
58
.3
36.5
.0
400
31.9
27.2
.0
300
23.0
25
.2
.0200
21
.3
10
.8
.0400
8.5
14
.9
.00
70
11.9
Mois
ture
G
e in
G
e in
(A
R
3/)
s &
mp
le
sam
ple
~
(M
F 3
/ (A
R
2/)
7.0
<
.00
06
.0
006
12
.5
.01
46
.0
12
8
15.6
.0
082
.00
69
15.5
.0
050
.00
43
21.3
.0
043
.0034
20.1
.0
010
.0008
\J
Ajn
taly
&es
by C
. T
aughn a
nd
M.
Fra
nk
, U
. S
. G
eolo
gic
al S
urv
ey W
ash
ing
ton
Lab
ora
tory
,2/
MF
=
mo
istu
re f
ree b
asi
sj d
ried a
t 11
0eC
.3/
AR
•-
as
receiv
ed
basi
s.
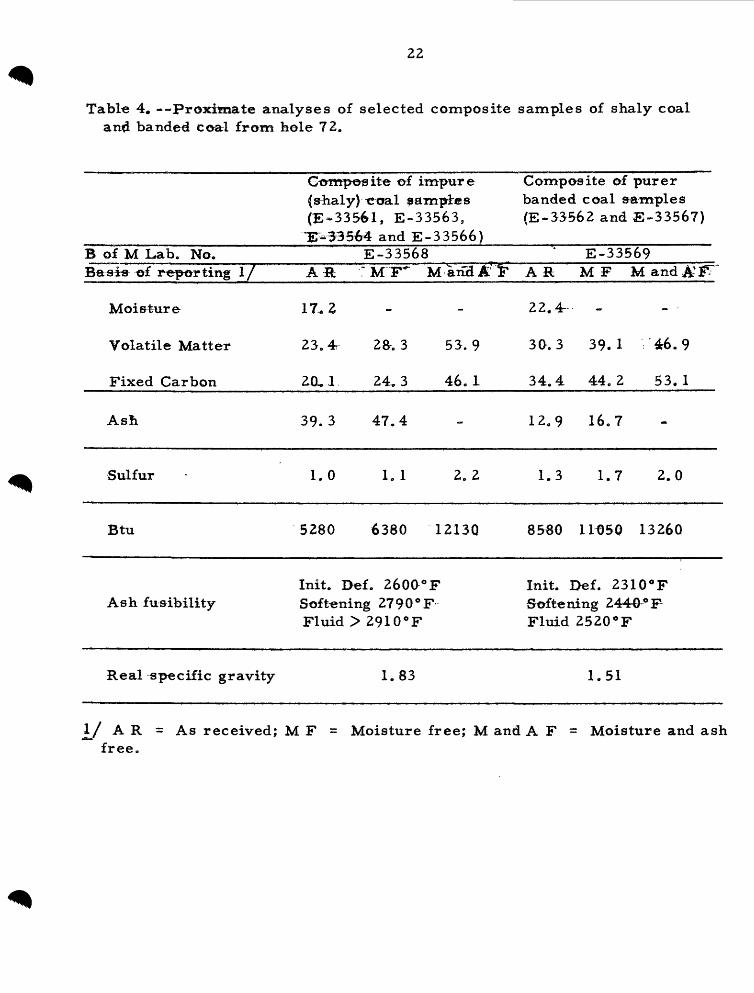
Table 4. --Proximate analyses of selected composite samples of shaly coal banded coal from hole 72.
B of M Lab. No.Ba«i» of reporting I/
Moi&ture
Volatile Matter
Fixed Carbon
Ash
Sulfur
Btu
Composite of impure (shaly) coal pamptes (£-33561, E-33563,
"17-33564 and £-33566)E-33568
A E : i/nr M ana £ $*
17,2
23. 4r 2&. 3 53.9
2.0,1 24,3 46.1
39.3 47.4
1.0 1.1 2.2
5280 6380 1213Q
Composite of purer banded coal samples (E-33562 and £-33567)
E-33569Aft MF MandA-^
22. 4r -
3Q. 3 39.1 46.9
34.4 44.2 53.1
12.9 16.7
1.3 1.7 2.0
8580 11050 1326Q
Ash fusibilityInit. Bef. 2600°F Softening 2790°F Fluid > 2910°F
Init. Def. 2310°F Softening 2440^F Fluid 2520°F
Real specific gravity 1.83 1.51
_/ A R = As received; M F = Moisture freej M and A F = Moisture and ash free.

Table 5.—Coal analyses
of c
ore
samp
les
from
hole 72
Nature o
f material
and
depth
B of
M Lab
. No
0
Rank
ind
icat
ions
!/
Basis
of r
eporting^/
1
Proximate
0> i» ,
r5
Mois
ture
Vola
tile
Matter
Fixed Ca
rbon
Ash iSu
lfat
e
Pyri
tic
Orga
nic
Total
Hydrog
enCa
rbon
Nitr
ogen
Oxygen
Btu As
hFusibility
Real
specific
grav
ity
Impure a
nd sh
aly
coal 11-
V8";
de
pth
99 '4-
1/4"
to
10
0 '1-3/8"
E-33
561
Upper
coal b
ench
10
-1/8
"; de
pth
100 '3-3/8"
to
101 '1
-1/2
"
E-33
562
(51-
88)
([56
-98)
Sub B oq »v.
AR
MF
M&A F
A R
MF
MfiA
F
17.0
-
21.4
25.8
54.2
18.1
21.7
45.8
43.5
52.5
-
.04
.04
.09
1.06
1.28
2.69
.42
.51
1.06
1.5
1.8
3.8
_ _
_-
_ _
_ _
_- 4680
5640
11
860
Init
.Def
.249
0°F
Softening
2670°F
Fluid
2870°F
1.91
22.2
-
29.0
37.2
45.8
34.2 44.0
54.2
14.6
18.8
-
.02
.02
.03
.62
.80
.98
.76
.97
1.20
1.4
1.8
2.2
6.0
4.5
5.6
46.7
60.0
73.9
1.1
1.4
1.7
J0.2
13.5
16.6
8280
10640
13100
Init
.Def
.2350°F
Soft
enin
g 2450°F
Fluid
2650°F
1.54
Impure and
shaly
coal 3
-3/4";
depth 10
1'1-
V2"
to 1
01' 5-
1/4"
E-33
563
(48-91)
A R
M F
MfiA F
15.1
-
21.8
25.7
57.1
16.4
19.3
42.9
46.7
55.0
-
_ _
__ _ 0.
5 0,
6 1.
3—
— _
_ _
-—
— _
_ 4520
5320
11830
_ ^ _ 1.92
Shaly coal & coa
ly
shal
e 10-V4";
dept
h 10
2 '3/4"
to
102 UX"
E-33564
(49-
88)
A R
M F
MM F
16.1
- —
21.3
25
.4
56.1
16.7
19.9 43.9
45.9
54.7
-
—
- _
_ _
_
_ _
_
0.6
0.8
1.6
_ _
__
_ — .
— _
_- 4450
5310
11710
_ _ _ 1.93
Shaly
coal
2-3/4";
depth
102' 11
" to
103 '1
-3/4
"
£-33565
(53-97)
A R
M F
MSA F
19.9
-
26.6
33.2 48.9
27.9
34
.8
51.1
25.6
32.0
-
_-
_ 0.6
0.8
1.1
_ _
__
_ _,
_ _
—_ 7030
8770
1290
0
_ _ _ -
Impure a
nd b
anded
coal
13-V2";
depth
103 '1
-3/4
" to 1
04«3-V4IL
E-33566
(52-97)
A R
M F
MSA F
18.9
-
26.1
32.2
50.8
25.3
31.2
49.2
29.7
36.6
-
.01
.02
.02
.20
.24
.38
.57
.70
1.10
0.8
1.0
1.5
_ _
_-
- -
_ _
__ 6570
8090
1276
0
Init
.Def
.28l
O°F
Soft
enin
g 2890°F
Fluid
> 2910°F
1.69
Lover
coal b
ench
(part) 5-3/8";
depth
104'3-l/4"
to 1
04' 8-3/8"
E-33567
(52-103) Sub
B e
q'v.
A R
M F
M^A F
23.0
-
31.5
41.0 47.1
35.4 45.9
52.9
10.1
13.1
-
.00
.00
.00
.42
.55
.63
.72
.93
1.07
f" 1.1
1.5
1.7
- _ _
_- _ 91
30
1186
0 13
640
Init
.Def
.230
0°F
Sof t
enin
g_ 2450°F
Fluid
2530°F
1.46
_
indication i
s given by a
par
enth
etic
hyp
hena
ted
numb
er acc
ordi
ng to
the me
thod
sug
gest
ed b
y ASTM Standards
on
Coa
l & Co
ke (1949, p«
The parentheses
indicate bot
h included numbers a
re c
alculated
on a
Min
eral
-Mat
ter-
Free
bas
is;
the first
numb
er r
epre
sent
s pe
rcen
t fixed
carb
on o
n the
dry,
or u
nit
coal,
basi
s; the
second num
ber
repr
esen
ts h
undr
eds
of Btu on a moist
basis.
The
rank
ind
icat
ion
sugg
ests
wha
t ra
nk wou
ld apply i
f the
samples
had be
en o
btai
ned
unde
r st
anda
rd c
onditions. a
s specified by ASTM st
anda
rds.
»AR=As r
ecei
ved;
MF=Moisture
Free; M & A F=M
oist
ure an
d As
h Fr
ee.
653)
.

24
Calorific value-s are given in table 6 for the seven samples according to
the five common ba-s-es of expressing them. The coaly material apparently
is of slightly lower rank than the well-known Monarch bed near Sheridan in
northern Wyoming and a little higher rank than the thick bed at the Wyodak
mine, ea-st of Gillette, Wyoming, in the Powder River Basin.
Table 6. --Calorific and ash values from core samples of hole 72,
B of M sample no.
E-33561
E-33562
E-33563
E-33564
E-33565
E-33566
E-33567
I/ A R = As
Ash MineralA R \J Matter
43.5
14.6
46.7
45.9
25.6
29.7
10. 1
received;
47.8
16.5
50,7
49.9
28. 0
32.5
11.5
M F =
z/, - -A R4680
8280
4520
4450
7030
6570
9130
»
CALORIFIC VALUES (Btu)Bases of calculation I/
M F M.&AF MMifcFj M^tinF.5640
10640
5320
5310
8770
8090
11860
Moisture -free; M
11850
13100
11830
11710
12^00
12780
13650
an,4 A F
8820
9840
912$
8820
9720
9680
10260
= Moisture
13080
13400
13150
13000
13430
13400
13868
and ash-free; M Min F = Moist, mineral-matter-freej Mand MinF^= Moisture and miner a-1 - matte r - f r ee.
2/ Mineral matter calculated as 1. 08 x a«h -f . 55 x sulfur.
Figure 8 shows-driagrammatically the comparison of petro^logic ingredients
w^ith proximate--compo-aitien of each of the 7 samples. Variations of uranium
and ash within each of the coal sample layers atao is shown at the right of the
diagram. The illustration indicates that substantial differences ^exist between
the layers with regard to petrologic composition. These differences could

99
.36
10
0.2
8'Li
thol
ogic
,
Sec
tion
Petr
olo
gic
C
ompo
sitio
n(
Who
le
coa
l ba
sis:
wei
ghte
d a
vera
ge
s )
Tot
al
Anth
raxy
lon
Tra
nsl
uce
nt
Opa
que
pusa
m
Vis
ible
M
ois
ture
V
ola
tile
F
ixed
Att
ritu
s
Att
ritu
s Im
puritie
s M
atter
Carb
on
374%
.3
% .
03%
14
.8%
18
.8%
24
.5%
24.4
%
10
1.1
2'
101
Pro
xim
ate
Com
posi
tion
Ura
nium
and
Ash
Con
tent
(As
rece
ived
ba
sis:
wei
ghte
d av
erag
es)
of
Trac
e E
lem
ents
Sam
ples
Ash
(A
ir dry
b
asi
s)A
sh
Pro
file
Ura
nium
P
rofil
e
(Che
m.)
TE
9:
IOI.
65
__
__
_|
ISe
e fig
ure
2 fo
r lit
holo
gic
sym
bols
( W
ho'*
err
' ca
sts'
w
eigh
ted
ave
rag
es)
Tota
l A
nth
raxy
lon
Tra
nsl
uce
nt
Opa
que
> Fus
air.!
Vis
ible
A
ttritu
s
Attritu
s",
/Im
purities
.5%
.5
%
11.6
%
(As
rece
ived
ba
sis:
wei
ghte
d a
vera
ge
s)
Ash
Mo
istu
re
Vola
tile
Fix
edM
atter
Ca
rbo
n18
.8%
25.5
%
24
.4%
31.4
%
- -
-
- o>
-«
c"'
•'T
lfl
——
— 1
0
te)
I 1
=3
—
M
•^~*^™
" s= * ^
•XY/
XY *
- X-
X-XY
! o>
.Y.Y
.Y.-.
<M
1 i_J
TE
36
.
TE
44
TE
45
1
TE
4
7]
10
4.8
2'
ro
en
Ura
nium
, ch
em
ically
dete
rmin
ed
FIG
UR
E
8.-C
OM
PA
RIS
ON
O
F
PE
TR
OLO
GIC
A
ND
P
RO
XIM
AT
E
CO
MP
OS
ITIO
N
OF
C
OA
L
AN
AL
YT
IC
SA
MP
LE
SW
ITH
U
RA
NIU
M
AN
D
AS
H
CO
NT
EN
TS
, H
OLE
72.

26
cause at least some of the apparent analytic discrepancy between samples.
COAL PETROLOGY
Except for about 8-1/2 inches of "middle11 shale and coaly shale below
101.44 feet depth, all of the coal and coaly shale between depths of 99. 36
feet and 104. 82 feet has been studied microscopically in thin section. Re
sults of the microbe epic study are summarized in table 7.
Table 7. --Summary of pfetrologic constituents in coal beds from hole 72.
WHOLE COAL BASIS
A,ttTital coal (clarain and duraitiVisible im- Vitrain fraction; constituent plant frag- Megascopic purities 13% 13.2% ments less than 0. 5 mm thick) 73. 6% fusain
________________________________________ .2%Attciial
Anthraxylon Translucent Opaque 'fusain Clayey 12.5% 40% attritus attritusPyritic .3% 46.3% .4% Petrologic fusain Other . 2%_____^_______________________________. 3%_____
Relatively reactive 86. 3% Relatively inert . 7%
VISUALLY PURE BASIS 87% of bed « 100% ncoal»
Anthraxylon 45. 8% Opaque attritus „ 5% Translucent attritus 53. 3% Fusain
Relatively reactive 99. 1% Relatively inert . 9%
The form in which table 7 is presented is se^mi-dia gramma tie in that
it indicates the relationship of texture and quantity of the megascopic coal
ingredients (vitrain, attrital coal, and megascopic fusain) with that of

27
microscopic constituents (anthraxylon,, translucent attritus s opaque attritus
and petrologic fusain). It emphasizes the fact that not all anthraxylon is iden
tifiable megaseopically a-s vitrain and that the quantity of identifiable fusain
also depends on the observational facilities that are employed. Most of all,
this table emphasizes the very large attrital fraction that characterizes this
coal and the ^-mall amount of inert organic matter that is present.
Table 8 shows-a tabulation of the coal constituents for the upper and
lower divis-ions of the coal bed in hole 72,, and for the 7 coal analytic layers.
From the tabulation in table & the general features of petrologic composition
are apparent. All this coal is characterized by small, almost insignificant
amounts of opaque attritus and fus-ain.
It would appear from results shown in table -8 that the basal coal was
formed of most highly degraded plant materials but coarser fragments become
more abundant and decay probably somewhat less pronounced toward the upper
pdrtion of the lower coal division. A slight reversal in this tendency occurred
at the top. The same tendency is recapitulated in the upper coal division
but with less extreme degradation indicated. In the upper division the maxi
mum concentration of anthraxylon occurs in the layer of purest eoal, whereas
in the lower Division the maximum occurs above the purer layer in the seq-
tion with 3. 5 percent visible mineral matter and 25 percent ash.
The thickness threshold for identification trf atithraxylon is .about 14
micron«-and all anthraxylon is identified in lentieles, -strands or bands of
greater thickness (see "discussion, 11 p. 553, in Parks and OrD©nnell ) 1949).
The threshold for identification of vitrain used in these studies is 500 microns

(vn|V
O(H
5j °
>d
* II
II <!
"
5"
H-
O
d-
ca
*-d
S*
p!
P
hi
M
CD ^
*<!
MJc
* O
?d
- 3
d
-
CD
H-
d-
ctl
CO I-P
-lM
p!
*£*
CQ
d-
ii a
*TJ
H-3
CD
Hj
cf-
P
o
cnI —
I 1 —
1o
p:O
Q
OH
' CD
O
P Cf"
»-rj
p!
Jx>*
03
d*
P
d-
H-
HJ3
H
-
0)
Low
er
div
isio
n
' — "*
I — ' ' —
*> '^
~x I
— '
tlJ
'*"""•
' \ —
' (3
J <-
~N 1
— i
(3d
' — ̂
! — '
tjdII
0 3
«O
IIO
1!
O
H
O-P
-O
-P-O
V
OO
M
O
MO
t— 3
• i-3
« H
J t—
3 •
HJ
i-3
* H
J i-3
• H
jt?
J —
vj
O
t?-}
fO
t?3
I — '
t?d
NO
t?
-} ! —
'•p
- o
o
-P~
~^3
JsJ
vo v
n js
j vo
jo
tsj
ON
IS
CO
-P
vn
-
ON
- -P
~-
M
-N
-"
M
I M
I
w
1 •
bd
-<j
W
d-
1-3
d"
1 i-3
d"
1 i-3
d
- 1
d*l
[3
_p-
vo
p-
vo
vo
vo
vo! —
' p
—v3
! — ' v
n
-P~
1 — ' vn
vn
| —
' vn
i— 3
I — ' v
nO
M
"*
— ' O
O
N
*~-s
O
ON
^^ O
O
N
t?3
O
ON
• cn
•
• •
vo «
00-
H*
~^3
** — ̂
ro
1 — '
Vo
vO
MM
O
cr
1 -<
3 vn
^-
^ M
- *
~s
-
CD
-£3
1 — '
VO
O
-p
- -P
""
-p-
O
(— i
J^
M
-<}
M»
* •
• *
vo
vn o
M
vn
O
vo
GN>
CI
vn
• vn
vn
CO
CO
Pi
ON
JO
C
O•
#
H(
«
•
«
| — i
VO
0
00
- i —
' -P
-
0
M*
• o
• *
•O
N M
P
O
-P
- M
M
P.
£
^
£M
P
M
P
vn
0
OCD
CD
M
MO
N
M
O
VO
M
'•
• «
• •
so
-p-
N£>
vn
vo
Up
pe
r d
ivis
ion
| _ 1
£jrj
s —
\ j —
I |j£j
^ —
\ xO
dd
O
II
O
II
v£>
MO
O
O
>-
3 <•
O•
HJ
1-3
• M
J tp
^VO
Hj
! — '
t?d
M
NO
O
Nj\j
J^
1 — i
— ̂j
*2J
| —
S
—
4*~
"*
^3t?
J 1
t?J
t?d
d"
t?J
d-
J i-3
d
" 1
M 0
1
o
vo
t?-}
O
vo
vo
voV
O
fo
VO
»• —
' M
VO
M v
n
M H
vn
O
vn
O
ON
•>
— •*
O
ON
O
O
NM
VO
M
M
• M
•
M
t-
M c
r-
CD [3vo
o-
o
vn.p
- vn
JT
M•
* •
M
MO
V
O
O
Void
4^
~vn
4>
P!
00
*
* f~
j *
-<3
vo
CD
4^-
r.*
* O
•
M
ON
p
M
M
^^
d~
H
P
MO 0
1
M
Mvn
M
vo
• •
*M
vn
-q
S~
~*L
\ —
——
— 1
£—
— >
II 0
0
M M
S
i"\»
CD
M M
hi
ON
»-3
—
P*
t?d
H-
M
d-
<$
CO
0
H-
1 cn
i-3 M
H
'W
OO
CO
•
"— 'C
O M VO CO
• vn O O * VO • ON
. MD M M • vn
/"™N
s-O
t —
!II
\O ^
C5«
^csH-
3 V
O 0
W
ON
hi
NO
-
i a
t-3
d-
H-
i t?a
o
<$
; M
P
. i
-P-
M
wv_
x Q
- (_
i»
|M
0
4*- — vn vn * O 4> .f> * \^)
* 4^-
* M 1 — i
4?-
• CO
J3>
3 IM t-3 jr» r-(-
IM o jt» ^f- |U) 1 l4-
~°"^
^^
o
o <J
M
P-
£*
0
d-
H-
c;
d- a
1M
CD
M
P
p. 0
i _ t,
i .
t _ j^
o
HJ
3!3
o
Hc3
3
P» Hj
<ri
H*
Ivn
1^
t-3
P
cr o
M
p
H>
CD
CO w cr
.CD
I
C7"
*T3
0
CD OP
CD
£5
CD
CO
O
O
Op
Hj
MO
p
O
& p
P
M
M «<d
O
d"
O
M*
3
O
0)
CQ
H-
S
d~
T3
CDJ_
_J
f-X
CD
d-
CQ
CQ
v»H
' O
P
P M
CD
P
4
c+
CD
p
O 13
M
O
iiS P a
M
H-
P: o
hi
J3CD
CO
00
29
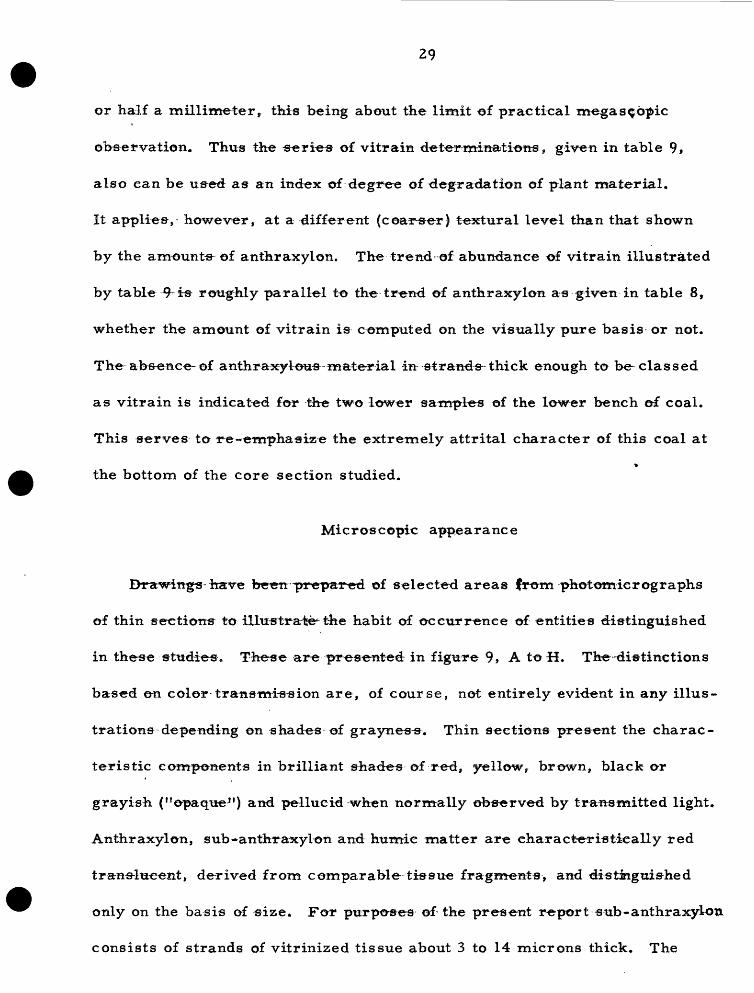
or half a millimeter, this being about the limit of practical megascopic
observation. Thus the series of vitrain determinations, given in table 9,
also can be used as an index of degree of degradation of plant material.
It applies, however, at a-different (coar-ser) textural level than that shown
by the amounts-of anthraxylon. The trend of abundance of vitrain illustrated
by table 9-i« roughly parallel to the trend of anthraxylon as given in table 8,
whether the amount of vitrain is computed on the visually pure basis or not.
The absence-of anthraxyteus-material in strands- thick enough to Declassed
as vitrain is indicated for the two lower samples of the lower bench of coal.
This serves to re -emphasize the extremely attrital character of this coal at
*
the bottom of the core section studied.
Microscopic appearance
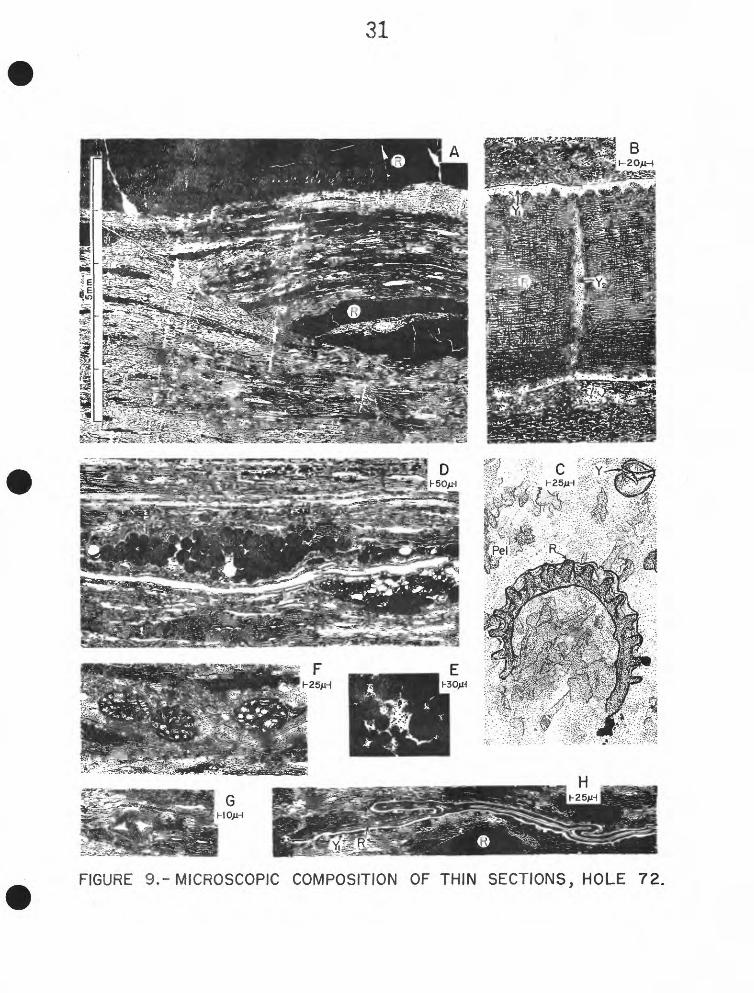
Drawings-have taetm-prepaT-ed of selected areas from photomicrographs
of thin sections to illustrate^t-he habit of occurrence of entities distinguished
in these studies. These are presented in figure 9, A to H. The-distinctions
based on color transmission are, of course, not entirely evident in any illus
trations depending on shades of graynes-s. Thin sections present the charac
teristic components in brilliant shades of red, yellow, brown, black or
grayish ("opaque*') and pellucid when normally observed by transmitted light.
Anthraxylon, sub-anthraxylon and humie matter are characteristically red
trans-lucesit, derived from comparable tissue fragments, and distinguished
only on the basis of size. For purposes of the present report sub-anthraxylom
consists of strands of vitrinized tissue about 3 to 14 microns thick. The

Lo
we
r d
ivis
ion
^,-j
5*
x-x
(_
. td
X
-N H
td
x-x
M
3)
II O
O
H
O
MO
II
O
.p-
.p-
O
VjO
O
fO
O
H3«tjd
i-3
° H
j t-3
«
HJ
K-3
• H
Jt?d
~v3
M j
o t?d
i — '
t?d N
O-P
- o o
.£
- -a
S
U3
\j^^
v_o
ro H
CO
-
Hj
Vn
—
O
N-
-P~
-
v-x
i ttj
i
M
i t«d
o t?3
o C
o t?d
o C
o t?
j o
Coca
-P
1" Co
-p
~ ^o
co
v*
)| —
' Q
j ~~
N^
J — '
\JT
*P
"~
1 — ̂
V^"T
V^
Fl
1 — '
VT
l^j
y
**^s ^
j Q
N
*~~
s (^ Q
\ v _ s Q
Q
x_p
— >
^J
.p—
-^
3
^-
QN
V
jJ \ji
* ) —
i «
• .
CO <
D ->
3 fO
H
fO
O
-J
[ V
n
3 &
H
roH-
H-
o
roH
H
ON
00
.
3 &
M
roH
- H
- H
v>
0H
H
• N
O
ON
HO
N
H- '
O
v*)
* •
• *
NO
4>
N
O
vn
H
ro
wj
O
NO
vn
* •
•H
-O
O
N
"-^H
tfl
II 0 M
O
H
• H
,
ro O
N is:
(—3
t?dfd
c»-
i
I h-
V
Ji1-
3 O
O
Nt?d
ro
4>
v^M
— H H Jv5
H
f~ ro ro H * VjO 4>
VJl
* NO
Up
pe
r d
ivis
ion
x->>
H1
0 1 — i
*~3
•£d
H
w r
oi t?
j O
ro 4-
Hv_
x O H * £ 1 —
iv_
o* -p
-
H * NO ro VJl ro 4> ON
-<J
to
x-^H
-1 tr>
'^
NO
td
HO
H
N
Oo
o o
-
oH
j h-
3 •
Hj
1-3
VjO
HJ
t?j
W
t?d
ON
^
.F-
-
1 ^
t?3
| C-
tj i—
3 c^
~ t?
dI
>~3
c^~
1 t?
d O
I
Co
t?d o
Co
( —
i Co
\ji
\—>
(—1
vn
N_->
Q v
j7O
N
v_
> o
O
N
O
ON
VjJ
| —
i fy
j o
| — i
• J\
J
(0
H
v_n
• ON
ON
iO
H
vn
VjO
• *
NO
O (0
(—>
Vjj
VM
^3
j ——
| _
£»
-P~
* V
O•
*
ON
vn
0"x-x<
as s;
H*0)
&
c»
-H
' O
4
0)
(— «
P
^_xC
D
H-
00 o
"b
^p3 I —
'
CJ ' —
x "^
pi
<J
H«H
j p. cf
CD
03
40
pj
CJ1
P
H
' £D
H
13
0)
h-1
J-J«
^<q
^5
-^0
)"s
_X
<i
~^^
<z$
^d
H-
o
ca0
S
H
-03
p-
cr"
o
c+ C
Dp:
CD
| — i
G-.
H«
£15
p
H* >
-s b
O
O
HJ13
0
H
-
o as
mO
H
«
h-1
CD
COP
S
3*
£3
cr1
JBP
«<}
ea,H CO CQ
na p cr j_i
CD NO
« 1 <J H-
cf- p̂j H-
P H.
P w S3 3 *d H CD Cfl
O Hj
J? P3 3 0 o p J_l
0
31
FIGURE 9.-MICROSCOPIC COMPOSITION OF THIN SECTIONS, HOLE 72.
32
humic or cell wall degradation matter is Degraded to finer -sizes and an-
thraxylon i& identified as the material in lentictes-, strands or bands,
exceeding 14 microns in thickness. At least vestiges of the original cell
ular tissue texture are visible in anthraxylon strands or bands, but the
finer materials, mostly derived from cellular fragments and cell contents,
usually are too fragmental for identification of their specific origin.
Figure 9A shows the characteristic texture of impure--coal frotn the
upper coal «one including one of the minor low angle ^compaction" faults.
Microscopic shear f^kfies of this type frequently die out in a distance of a
few millimeters. The darker areas of this section are nearly all red trans
lucent fR), and the coarser bands are identified as anthraxylon. The light
areas here are nearly pellucid, with tinges of yellowish waxy material. It
is most difficult to estimate accurately the amount of waxy matter so finely
dispersed in a clayey matrix. Apparently the clayey matter i-s virtually
"infiltrated11 with yellow wa-xy organic material and this in highly variable
degree. Probably both clay and waxy matter were deposited in s-emicolloidal
dispersion: probably their interrelations were considerably modified during
diagenesis. The relative amotmts of inspissated waxy matter can be judged
by the intensity of coloration, but the quantitative accuracy of these relative
estimates cannot be proved. In component analysis of s-elected layers the
amount of Ilwax in clay" has been estimated at a relatively high magnification
and listed in tables 10 and 11 as a separate entity.
Figure 9© illustrates a band of anthraxylon with its enclosing cuticle to
provide proof of its origin from a small woody twig. The vitrinized materials

33
are characteristically red translucent (R) and show an obscure horizontal
striation resulting from the collapse and compression of vascular and other
tissues as-the-y were- altered to form coal.
Deeply yellow colored waxy~ resinous canals are evident in much of the
anthraxylon in this deposit. They commonly show wedge or dagger-s-haped ex
trusions into the adjoining vitrini&ed tissues, proving that the waxy contents
of these secretory eanals yielded under pressure. In the particular an
thraxylon strand illustrated in figure 9B the canals are infrequent, but a
characteristic cleat (shrinkage) fissure appears which is wax-filled. Dis
placed occurrences* of amorphou-s-waxy matter are common in the deposit.
The cleat-filling wax has a deeper coloration (Y2 ) than that of the-outer cu
ticle (Yj). The cuticle is a,bright lemon yellow and evidently has not been
materially displaced, though it is distorted by compression. Some of the
remains of epidermal cells- are deeply embedded in the waxy cuticle layer.
Yisible mineral matter rarely occurs within anthraxylon bands, but
the attritus above and below the example illustrated in figure 9B contains
irregular nricrogranular aggregates of clayey minerals-that, according to
the study by Breger and others-(in press), probably is kaolinite. Organic
matter of the attritus mostly consists of disordered red*-translucent humic
matter.
Figure 9C is taken from one of the few horizontal thin sections that were
prepared t& demonstrate botanical feartures of some of the characteristic
materials. This illustration shows a spore and a fern sporangium-in a
clayey matrix. The sporangium is similar to that previously illustrated by

34
Bradley (1930, p0 23, fig. 12)-and by Winchester (1923, pi. 7c) from Green
River oil shale. Tiny fragments of hum'ic and resinous attrital matter alsuo
are present. The distinctive annulus of the fern sporangium suggests that
ferns -of essentially modern type contributed to the coal deposit.
Figure 9I> and figure 9E illustrate occurrences of pyrite that are
highly characteristic. Very tiny pyritic crystals, drawn as black specks
in the central part of figure 9E, are of common ocjrurrence. Usually
whenever any local abundance of pyrite is noted the tiny crystallites are
grouped in distinctive spherical aggregates 20 to 40 microns -in diameter.
These spherical aggregates often are clumped in largeir lenticles and niQfce
or less grown together. 1*he lamination in some samples is almost undis
turbed, suggesting actual organic replacement;'in others, it dips steeply
around the pyrite suggesting that most of the compaction of organic matter
occurred after the pyrite had been deposited. It seems clear that pyrite was
deposited contemporaneously with decay, during initial compaction or shortly
thereafter, just as Bradley (1939, p. SO-31) has reported ^©r similar pyritic
occurrences in the Green River oil shale. No veinlets of secondary pyrite
were observed.
Many of the pyritie spherulites are so smooth that question may arise
as to their identity-when viewed as opaque objects by transmitted light. *
The high reflectance of these spherulites-when observed by vertical illumi
nation and the occurrence with "framboidal 11 types of aggregates of lower
density*-the-s-pherulitie form and size- being normally developed in these but
with the individual tiny cubic crystals separated from one another by organic

35
material so that one becomes convinced naf the comparative internal simi
larity of all-«amount to an adequate proof of the pyritic nature of these bodies
by whatever means they are observed. There als-o is- no indication that they
represent mineralized tffossilization1* of any organic structure^ Although
such primary occurrences of pyrite probably indicate anaerobic decomposition
by bacteria that liberated hydrogen sulfide, no visible evidence of actual
bacterial remains could be observed. The pyritic -spherulites; -may never
theless mark the approximate former locations of a-etive bacterial colonies.
Pyrite-is- not present in any important concentration except in the layer
corresponding with T-15- Sample 9» where it accounts for about 5-percent of
the visible mineral matter, in the upper part of TE-10, and in TE-4&. Prob
ably these concentrations are responsible for the slight increase in total sulfur
in respective coal analytic samples. Tiny crystals and aggregates-of pyrite
are observable in most of the thin sections, but the sulfur determinations
given for eoal analytic--sat«ples are all relatively low and indicative of the
gene-ral dispersion: of mlcrocrystalline- pyrite.
Fungal remains are-shown in figures 9F and G. The former shows three
scls&r^tia of a eomt^on type as they occur in attrital «oal. Several other
characteristic varietie-s are present which are not illustrated. The mo»t
abundant form-is elongate lenticular, about half a rrtilliTneter long, with thinner
cell walls which differ^ from: those shown in being much compressed. The
structure shown in figure ^G is probably arwittd-blown fungus spore, possibly
cut in an oblique pla-new -Fungal ma-terials-of this type-occur in practically all
of the thin sections but are more abundant in some layers than in others.

36
^similar types of fungus spores have been illustrated by Bradley (1931,
pis. 19^ and 2$) from^i^r^tome-seetions-^of Green -River shale.
There-are three -possible -eeuTees-~e€ fungus remains in this -deposit and
pr^ba-bly representation from all three. Some, possibly the most abundant
varieties including vegetative mycelium, are cleatrly «aprophytic and grew
in situ in the deposit. Seme~of the remains of saprophytic forms also could
have been ear^rited^ fr^sm-eome-^istanee a-s an organic -sediment -with other
degraded pla«t remains. Wind blown fungus -spores also-have-iae -direct
on the in situ decomposition of the deposit. In addition, evidences
fck: fungi have been observed that had their origin with their host
plants i Thein-s-itu-saprophytic fungi are -of greatest interest to us- as they
indicate an -environment ef aerobic -deeomposition. F-urther -study of fungus
remains- ±» required to distinguish the types indicated above and all have been
included as fungal phyterals in tables 10 and 11.
Figure 9H shows a characteristic type of seed that is most abundant in
the lower part of the lower coal ssone. It has-much of the appearance in thin
section of the large megaspores found: in Paleozoic coal beds but it evidently
is error e t: o 111 plex . The wall includes a thin red hiimie layer {R) that repre
sents a tliin-seed coat, and the -outer most waxy layer (Yj) is cuticular. Only
the internal yellow band represents a seed megaspore. The presence of the
seed -mega spore indicates that these- fes-s-ils represent one of the groups of
gymnosperms. Exatnination of isolated seed -exaiaoiples obtained by macer
ation of the coal also suggests *the~presence of a -micropylar tube similar to
the "tubulus" present on seeds of Ephedr^t, the "Mormon Tea, " which has

37
a more southerly distribution in the present day flora. All seeds observed
are smaller than those of any modern North American species of Ephedra*
however, and further study is required to establish the relationship of these
fossils. Relationship with Ephedra would be interesting, if true, in indicat
ing an extreme diversity of habitats in this Eocene lake basin because modern
species of Ephedra are-extreme xerophytes and, as such, would contrast
strongly with the general character of the floral assemblage. The common
occurrence of gymnospermous elements in the Green River flora is some
what exceptional.
The bulk of the plant remains in this deposit are in all probability angio-
spermotts in derivation. The cuticles of angio«|»ermous plants-seem to domi
nate^ the few maceration residues that have been prepared from this coal,
and there is an abundance of angiospermous pollen. However, frpm the
evidence presented above, it appears the flora was quite diversified and
that gymnosperms, ferns, and a considerable number of saprophytic and
parasitic fungi also are represented. Coalified filamentous fossils resem
bling some of the algae described by Bradley (1931) were noted in one
horizontal thin section.

THE RELATION OF PETROLOGIC COMPOSITION TO THE OCCURRENCE OF URANIUM
Large variations in uranium content are present in nearly all of the coal
analytic samples, as previously demonstrated by the prof He of uranium con
centration in figure &; The coal analytic samples- apparently are sufficiently
specific to indicate the general range of variations in peat aetrumulation pre
requisite-to forming coal and for purposes of type comparison between coal
deposits, but there evidently is nodirect connection between average concen
tration of coal constituents- in these samples and the amount of uranium^ that
may be present in the coal. The foil owing-discussion in relation to occurrence
of uranium-is-based, therefore, on petrologie study-of the smaller and more
specific laboratory samples that were originally taken for determination of
radioactivity. These-samples are closely correlated with those used for
chemical deterfninatitms^of uramitrm.
The chart shown in figure 10 illustrates the inherent petrologic vari
ations in this -material, calculated on a visually pure basis. Figure 11
illustrates the composition on a whole-coal bas-is with visible impurities
included in the respective layers. The "weighted averarges-of composition
for upper and lower coal zones are presented at the top of table 8 (p. 29).
Specific thin layers differ very appreciably from these averages as shown by
the varying length bars in figures 10 and 11. Uranium concentration in or
ganic matter, as computed by the me-thods-diseussed below, is shown
superimposed on the column of translucent attritus in figure 10 9 and in a
separate column in relation to ash content in figure 11. The microscopic

Lith
olpg
ic
Sec
tion
99.3
6'-
iOQ
.28'
10
1.4
4'
101.6
5'C
102
07
!<
102.9
2''
103.
15
104
27
PE
TR
OLO
GIC
C
OM
PO
SIT
ION
(We
igh
ted
a
vera
ge
s,
visu
ally
pu
re
ba
sis)
To
tal
Anth
raxy
lon
55 7
%T
ran
slu
cen
t U
rani
um
Opa
que
Fus
ain
Attritu
s .
4%
.04
%
I
^^^^^^^^^^
w®
JE
16
See
fig
ure
Z
for
llth
olo
glc
sy
mb
ols
Sca
le o
f ur
aniu
m i
n o
rga
nic
m
atter
Sca
le
of
petr
olo
gtc
co
nst
itue
nts
0%
-0
02%
.O
q6%
.0
08%
.0
09%
0%
20
%
40%
60%
80%
(We
igh
ted
a
vera
ge
s,
visu
ally
pu
re
basi
s)T
ota
l A
nth
raxy
lon
38.5
%
Vitr
ain
10
.6%
A
ttrita
l A
n. 2
7.9
%T
ran
slu
cen
t A
ttritu
s
60
3%
Op
aq
ue
Attritu
s .
65F
usai
n .6
%
CO
C
D
FIG
UR
E
IO.-
DIA
GR
AM
S
HO
WIN
G
RE
LA
TIO
NS
HIP
O
F A
NT
HR
AX
YLO
N,
TR
AN
SLU
CE
NT
A
TT
RIT
US
AN
D,
UR
AN
IUM
O
F T
HE
LU
MA
N
NO
. I
BE
D.
HO
LE
72
.

Lit h
o lo
gic
Sec
tion 8
Petr
olo
gic
C
om
posi
tion
( W
hole
co
al
basi
s:
wei
ghte
d av
erag
es )
99.3
6'-
100.
28*
Tota
l A
nthr
axyl
on
65
.5%
Vitr
oin
18.1
%
Att
rita
l An
. 4
7.4
%T
ran
slu
cen
t A
ttri
tus
37.4
%O
paqu
e Fu
sain
A
ttri
tus.
3%
.03%
^^^^P
^%
%%
aY
////
////
////
////
XS//
////
7m
>^C
x\^^
^^^^
^^x^
^^3
S«t
fi««r
t 2
for
litho
legi
c ty
mbc
ls(
Who
le
coal
ba
sis:
w
eigh
ted
aver
ages
)T
ota
l A
nthr
axyl
on
43.5
%
Vit
rain
9.
4%
Att
rita
l A
a34.l%
Vis
ible
Im
puri
ties
14.8
%
Ura
niu
m
and
A
sh
Co
nte
nt
of T
race
Ele
men
ts S
ampl
es(A
ir d
ry
bas
is)
Ash
Pro
file
Ura
nium
Pro
file
(Ch
em.)
•*=
•
CD
Sca
li of
pt f
ro lo
gic
co
«*t
ita*n
t*
0%
20
%
40%
60%
80
%
Vis
ible
Im
puritie
s 11
.6%
Ur«
«i«n
, eh
tin
lcel
ly
dct
crn
iiied
O
JO
O2
-OO
6 .O
O«
JOO
»%
IO4.
70'
1048
2'13
FIG
UR
E
11.-
CO
MP
AR
ISO
N
OF
PE
TRO
LOG
IC
CO
MP
OS
ITIO
N,
WH
OLE
C
OA
L B
AS
IS.
WIT
H
UR
AN
IUM
A
ND
A
SH
C
ON
TE
NT
S,
HO
LE
72
.

41
studies, upon which the charts are largely based, also have indicated some
lithelogie refinements that are «hown in the separate * harder©*1 column at the
left of the figures, All columns have been broken at points corresponding to
division^ between coal analytic samples to facilitate a detailed comparison
with those re-suits previously discussed.
According to Breger and others (in press), *}8r percent of the uranium
present in a sample of purer coal from the upper part of the Luman No, 1
coal bed is associated with the organic matterj 2 percent is accounted for
. O&^,£^
in mineral association. Their whole sample assayed aboutt-.'^fis percent U,
so they estimated that the average uranium content of the-organic matter in
. &63i3
their material amounted to about .USilJ^ percents and that the-mineral matter
contained about „ 0006 percent U. If the same relations hold in our more highly
uraniferous and higher ash samples, the smaller proportion of organic matter
in these samples-must have a relatively high uranium content. The uranium
a-ss-ociated with the mineral matter might be practically ignored.
On the other hand, it is- conceivable that their estimate of the amount of
uranium in the mineral matter associated with the L*uman coal bed is s-omewhat
too low. The upper part of the core from hole 72 consisted essentially of non-
carhonaceous silty shale that contained about .0033 percent uranium according
to the -determination based on s-ample TE»7. Radioactivity values^ for our lab**
oratory samples as plotted in figures 2 and 3 suggest that perhaps . 0020-,, 0030
percent of uranium is normal for essentially noncarbonaeeous core from hole 72.
Uranium data have been calculated on a pure-coal volumetric basis- (con
sidering uranium to be mostly associated with organic naatter) in two different
42
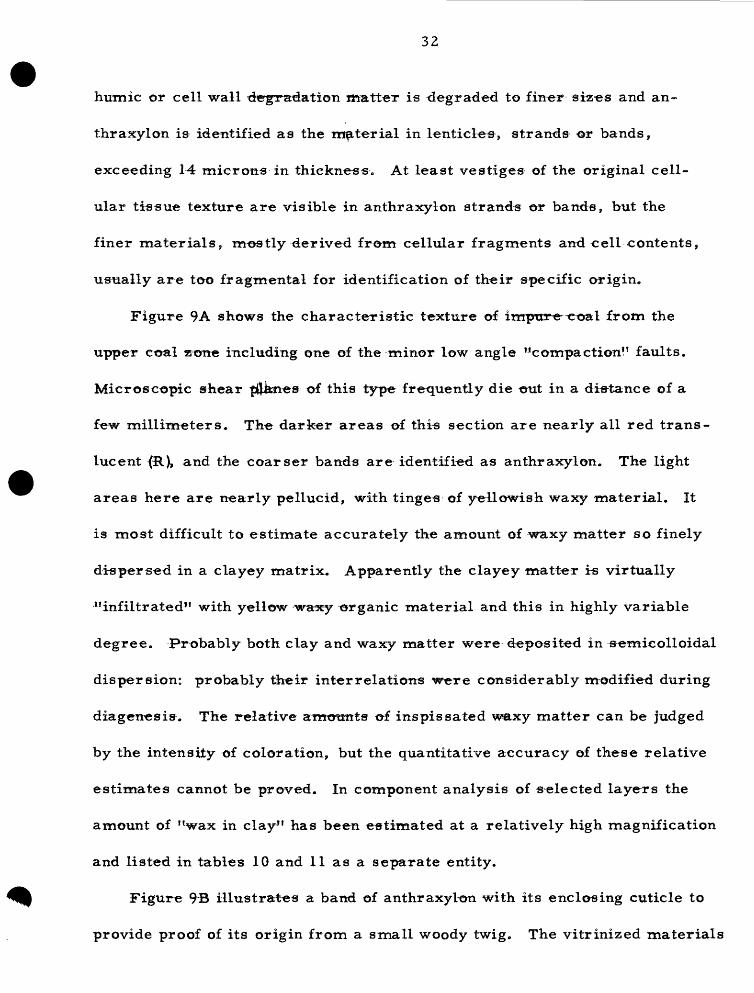
ways: $1) according to the assumption that~-essentially all uranium i& assoc
iated with organic matter, and (2) on the as-sumption that the -mineral matter
itself contains about . 0025 percent uranium. Both sets of results have been
shown, superimposed graphically on the translucent attritus column in figure
10. It is apparent that only a slight relative change in uranium distribution
is involved.
The best correlation between uranium concentratiots: and petrolegic com
position is shown by trfcnslucent attritus. The correlation is somewhat better
when results- are presented on a whole-coal basis (fig. 11) than on the visually-
pure basis (fig. 10), even though the uranium evidently is chiefly associated
with the organic matter, and the visible impurities (determined on an area
basis) correspond closely with trends of concentration shown by ash (deter
mined by weight). The correlation is -most striking for samples included in
the upper coal division. It also appears that a layer is most likely to be
highly uraniferous if it occurs adjacent to a layer having a high mineral eon-
tent. This relationship is best shown in the lower division 'where the relation
to translucent attritus is less evident.
PETROLOGY OF SELECTED LAYERS
The nature of components included in the translucent attritus of different
layers also was investigated for its possible influence on the occurrence of
uranium. Nine layers corresponding -with trace elements samples were selec-
ted for further study and detailed comparison of their microscopic composition,

Tabl
e 30
. Percent
petr
olog
ic
comp
osit
ion
of s
elec
ted
coal
layers, Red
Dese
rt h
ole
72.
M •rl b ranslucen
t att
CONS
TITU
ENTS
OR
COMPONENTS
Coarse a
nthraxylon (=vitrain)
Attrital anthraxylon
Tota
l an
thra
xylo
n
Sub-anthraxylon
Translucent
humic
deg.
matter
Tota
l humic
or c
ell wall d
egra
dation matter
Red at
trit
al r
esin
s
Cuticle
Spor
es
Yellow attrital
resi
ns
Waxy
amorphous
Estimated wax
in c
lay
Tota
l ye
llow
-wax
y matter
Fungal p
hyte
rals
Brown ma
tter
Opaq
ue a
ttritus
Micro -fusain
Mega
— fu
sain
Tota
l fusain
Diss
emin
ated
pyr
ites
Transparent mi
nera
ls
Clayey min
eral
s To
tal visible mineral
irapurities
TOTAL
% uranium
chem
ical
ly determined
"HIG
H" URANIUM CONTENT
TE-41
TE-42
TE-24
TE-40
5.62
24.53
0.00
0.
65
20.28
26.80
19.21
13.17
25.9
0 51
.33
19.21
13.82
11.6
7 10.81
4.79
2.14
26.58
17.60
42.18
18.93
38.25
28.4
1 46.97
21.07
0.59
1.
13
0.21
0.48
0.00
0.00
0.08
0.01
1.33
0.82
1.50
2.
91
0.42
0.21
0.21
0.54
7.67
6.
64
10.4
1 10.83
12.60
5.57
17.57
16.32
22.02
13.24
29.77
30.6
1
trace
trac
e trace
trace
0.25
0.52
0.75
0.94
0.51
0.12
0.
21
1.27
O.L4
0.00
0.14
0.11
0.00
0.00
0.00
5.38
0.14
0.00
0.14
5.
49
0.13
0.20
0.14
0.
00
0.09
0.00
0.14
0.
03
12.. DS
J.
.04_
2.
47
26.29
1S.2
C>
5.24
2.75
2£T32
99.96
99.99
100.
01 100.00
.0206
.0155
.011
7 .0
111
LOW URANIUM CO
NTEN
T TE
-20
TE-4
7 TE-L4
TE-46
TE-16
6.02
0.
00
19.7
5 0.
00
45.97
45.69
29.7
0 39.32
?6.68
37.2
3 51.71
29.7
0 59
.07
36758
83.2
0
25.74
59.3
9 20
.30
57.3
4 7.
11
18.16
4.05
15
.63
0.79
5.70
43.90
63.4
4 35
.93
58.13
12.8
1
0.35
1.
88
0.34
1.22
0.34
0.21
0.
18
0.10
0.24
0.29
0.
13
0.00
0.
06
0.00
0.
12
0.00
0.
00
0.00
0.
00
0.12
1.39
2.
25
1.01
1.
22
0.36
1.
21
0.68
1.35
1.00
0.22
2.94
3.
11
2.52
^J&
1.11
0.44
0.33
0.
13
0.33
0.
75
0.37
0.65
0.21
0.
30
0.07
0.04
0.
35
0.14
0.
19
1.50
0.00
0.00
0.00
0.00
0.08
0.00
0.
00
0.00
O.OC
0.00
0.00
0.00
0.00
0.
00
0.08
0.13
0.11
0.39
0.69
0.08
0.
05
0.00
0.00
0.00
0.04
0.09
0.42
JL.24
0.00
0.
00
0.27
0.53
1.63
0.69
0.12
100.02
99.99
99.9
7 10
0.00
99
.98
.005
7 .0042
.0035
-0033
*boi
id
GO

44
These included the four highest in uranium content and five of low radio*
activity, including layers from the parts having a minimum uranium con
centration within the two benches of purer coal. This selection should
indicate whether-•-systematic differences in specific organic composition are
associated with the presence or absence of significant uranium concentrations
in this material* The special layers selected for this study are marked by
asterisks-a-long the base line of the translucent attritus column in figure 10
and, along the uranium column in figure 11. The quantitative results are
given in detail in tables 10 and 11. Both tables are arranged in the order
of decreasing uranium content.
Table 1& shows the detailed composition of each of the layers selected
for this special study including visible impurities, coal constituents and
all their important components-. An important component, "estimated wax
in clay, If has been added to further differentiate materials normally included
in translucent attritus. It may be significant that all five samples of rela
tively high uranium content have a considerable amount of-waxy material,
and the clayey laminae in some sections appear highly yellow translucent
on account of it. However, neither the estimated wax, amorphous wax,
nor the amount of clayey minerals show precise quantitative relationship
to the uranium content.
The same general/relationship^ is shown in table 11 which presents the
composition of translucent attritus in these layers, exclusive of impurities
or other constituents. The amount of "translucent attritus contained in each
of the layers is given near the bottom of the table. The "high" layers average

Tabis 11 -
Percent
composition
cf t
ranslucent at
trit
us in s
elected
coal l
ayers, Red
Dese
rt hole
72.
COMP
ONEN
TS
Sub-anth
raxylon
Tran
sluc
ent
humic
degr
adat
ion
matt
er
Tota
l hu
mic
or c
ell wa
ll degra
dation matter
Red at
trit
al r
esin
s
Cuticle
Spor
es
Yellow att
rita
l re
sins
Waxy amo
rpho
us
Esti
mate
d wa
x in
cla
y To
tal yellow-waxy ma
tter
Total fungal phyterals
Brow
n matter
TOTA
L
Appr
oxim
ate
percent
of l
ayer
represented
by the t
rans
luce
nt
attr
itus
an
alyz
ed
% uranium ch
emic
ally
det
ermi
ned
"K1G
TE-4
1
19.0
9
43.4
8
62.5
7
0.97
0.00
2.18
0.69
12
.56
20.6
2 3^05
trac
e
0.41
100.
00
61.1
2
.020
6
H" UR
ANIU
M -CONTENT
TE-4
2 TE
-24
TE-40
24.9
7
40.6
5
65.6
2
2.60
0.00
1.90
0.49
15.33
12.8
7 30.59
trac
e
1.19
100.
00
43.29
.0155
6.15
&*22
60.44
0.27
0.11
1.93
0.27
13.40
22.62
38.33
trac
e
0.96
100.
00
77.6
9
.0117
4.03
22*&
39.68
0.91
0.03
5.47
1.01
20.40
30.74
5735
trace
1.76
100.
00
53.10
.0111
TE-2
0
53.64
37.83
91.47
0.74
0.43
0.26
0.00
2.90
2.51
6.10
0.91
0.78
100.
00
47.98
.0057
LOW UR
ANIU
M CONTENT
TE-4
7 TiL-14
TE^,
6
85.58
-li&
91 .42
2.70
0.25
0.00
0.00
3.24
0.97
~47Z
5
0.47
0.94
99.99
69.40
.0042
51.87
39.94
91.81
0.88
0.24
0.15
0.00
2.58
3.46
6.43
0.34
0.54
100.
00
39.14
.0035
91.84
1,27
93.11
1.95
0.38
0.
00
0.00
1.95
1.60
3.93
0.53
0.48
100.
00
62.43
.003
3
TE-16
47.12
37.82
84.94
2.24
1.92
0.80
0.80
2.40
-M4
7.36
4.97
0.48
99.99
15.08
.001
2

46
58. 8 percent translucent attritus and the low uranium layers 4&« IS percent.
This tends to support the general relationship previously noted between
translucent attritus and uranium content in thte-ce-al, but it certainly is not
definite enough to serve as more than a tentative guide for investigation.
The- total yellow waxy matter would seem to offer a better indication
of uranium concentration than the amount of translucent attritus. • The
"high1 * layers avera-ge about -4rQ percent waxy, the low uranium layers about
5.6 percent. The dominant waxy matter includes both "amorphous waxy11
and "estimated wax in clay. " Since the-relationship is not an exact one,
the waxy material must be regarded as a factor favorable to uranium em
placement, rather than a cause, and, although it would seem that this is
the organic component with which uranium is most likely to be associated,
no doubt a great deal depends upon the availability of and access to some
uranium source.
Source of waxy matter
Presumably the wax in clay is a dispersed form of the amorphous waxy
matter-which is fairly common as a minor component in-many coals. From
the geologic relat ions hips s proximity and microscopic appearance, it would
seem that the origin of most of the waxy matter of the Luman zone and the
Green River shale may be similar.
This amorphous waxy material is largely identified by its lack of morpho
logically distinguishing features, and its source is not easily determined.
It may be presumed that it originates as a vegetable product that has been

47
separated from the plant tissties that were genetically associated with it
and secondarily dispersed, or concentrated within the existing deposit.
It now is associated with -such a diverse assemblage of organic and inorganic
micro-materials that its present association is of little assistance in identi
fying its origin moire precisely than the ass-emblage of plants known as the
Green River flora. Most of this assemblage consists of shrubby or arbo
rescent angiospermsj but, as mentioned previously, some gymnosperms,
ferns, and a variety of fungi and algae have been recognized.
It is not ̂ certain that the waxy matter may all be -derived from a plant
source. Sections prepared for comparison of types of organic matter from
the varved Green River marlstone at the Fossil Fish Cliffs locality west of
Kemmerer, Wyoming, have shown a striking association of the amorphous
waxy material with carapaces of abundant ostracodes. The ostraeode valves
evidently initiate formation of a type of microgeode within which crystalline
ealcite^ was-deposited marginally. The center of such "geodes11 is usually
more or less fully occupied by_amorphous waxy matter in contact with the
euhedral terminations of calcite. No obvious connection with waxy amor
phous material outside the carapaces is visible; and, if one had not observed
the identical type of substance in many other kinds of association, the con
clusion that this yellow material represented alteration products, possibly
including fatty food reserves, ^tc. » indigenous to the ostracodes, would be
rather compelling. It is still far from proved that this microscopic ally in4is-
tinguishable type of waxy matter is all derived from a unique vegetable source.
It probably could arise from different sources with the much modified end

48
products of the^ same microbial and geochemical environment tending to
show points of resemblance.
Whatever the original source or sources were, it seems evident that
the waxy mate rial has undergone considerable transfiguration in arriving
in its present occurrence. As pointed out in previous-discuss ion, wax-
filled secretory canals are common in anthraxylon of the Luman zone and
these generally show evidence of mobility under coalification pressure.
Cleat cracks in vitrain commonly are filled by waxy matter that has mi
grated to fill them. There is every indication that much of the waxy material
in the deposit, not incorporated in spore coats-or cuticles-, is more or less
labile and susceptible to flowage and displacement during consolidation.
Prrer to consolidation of the deposit a softer, much more plastic, essen
tially "fluid, " condition can be presumed for-most of the organic substances.
Any waxy matter freed from plant tissues by extrusion or early decay could
contribute to the amorphous waxy matter of the deposit, provided these
products are chemically sufficiently stable.
It is very likely that most of the organic matter in the deposit was con
tributed by angiospermous plants resembling those of southern coastal swamps,
Remains of all the kinds of tissues that such plants might contribute seem to
be reasonably represented in the coal with the exception of periderm. Corky
layers of the bark are not as commonly found as in the more prominently
banded western coals. The plant waxes known as suberin are generally
present in the corky tissues of angiospermous plants to aid retention of mois
ture in living tissues. Sometimes suberin forms a substantial proportion

49
of the dry weight of the corky layers. Suberin may be mixed with some
variety of organic materials and may show differences in chemical com-r
position, but, as a type of substance, suberin is relatively stable (Zetzsche,
I932j Kaufmann, 1932) 0 In general it is similar to the waxes that form
the plant cuticle and spore coats except that It is not usually ^o completely
exposed to atmospheric oxygen and does not become fully saturated.
S€>me of these fatty plant products have characteristics of drying oils, of
which linseed is an example. Suberin may thus be suggested as a most
plausible-general-source for the amorphous-waxy matter in the coaly deposit
If so, it has been generally modified by decay, probably both aer-obic and
aerdbic, so that direct proof of Its origin 1ms been virtually obliterated.
LITERATURE CITED
Berry, E. W., 1930, A flora of Green River age in the Wind River basin of Wyoming: U. S. Geol. Survey Prof. Paper 165~b s p0 55-81.
Bradley, W. H. , 1930, The varves and climate of the Green River epoch: U. S. GeoL Survey Pro!, Paper 158e, p. 87-110.
________, 1931, Origin and rnicrofessils of the oil shale of the GreenRiver formation of Colorado and Utah: U. S. Geol. Survey Prof. Paper 168, p. 1-58.
Bradley, W. H. , 1948, Limnology and the Eocene lake® of the rocky moun tain region: Geol. Soc. America Bull. , v. 59 * p. 635-648.
Breger, I. A., Deul, M. , and Meyrowitz, R. , (in press) Geochemistry and Mineralogy of a uraniferous subbituminous coal: Econ. Geol. v. 50,
Brown, Roland W. , 1929, Additions to the flora of the Green River for mation: U. S. Geol. Survey Prof. Paper 154-jj p. 279-293.
________ , 1934, The recognizable species of the Green River flora:U. &. Geol. Sttrvey Prof. Paper 185-c: p* 45-77.
Chaney, R. W. , 1944 S A fossil cactus from the Eocene of Utah: Amer. Jour. Bet., v. 31 S p. 507~52&.
Kaufmann, H. P., 1932, F-ette und Waehse, p. 590*674: in Handbuch der Pflanzenanalyse herausgegeben von G» Klein? Zweiter Band, Erster Teil, Orgamsehe Stoffe I. p., l-973 9 J. Springer, Vienna.
Kruse, Ho O. , 1954, Some Eocene dicotyledonous woods from Eden Yalley, Wyoming: The Ohio Jour, of Sci.» v. 54, no. 4, p. 243
Ma-sur-s-ky, Jfarold, and Pipiringos, G. No * (in preparation) Preliminary report on uranium-bearing coal in the Red Desert area, Sweetwater County, Wyoming, U. S. Geol. Survey Bull.
Parks-, B. C. , and OlBonnell s H« J. , 194^ Betertnination of petrographic components of coal by examinatit>n of thin sections (with discussion, and text corrections omitted from AI ME Tech. Paper 2492, Nov. 1948): Am. Inst. Min. Met. Eng. Trans-. , Coa-1 Div. , 194ft?- v. 177, p. 535-555,
Schopf, J. M. , Gray, R. J. , and Warman, J. C. , 1953, Lignite coreprocessing, in Geologic investigation's of radio-active^ deposits-, semi annual progress report, June 1 to November 30, 1953: U. S. Geol. Survey TEI-390, issued by U. S. Atomic Energy Comm. , Tech. Inf. Service, Qakridge, Tenn. , p. 146-156.
Schopf, J. M. , and Gray, R. J0 , 1954, Microscopic studies of uraniferous coal deposits: U. S. Geol. Survey C ire. 343 9 p. ii -F 10.
Schopf, J. M., Gray, R c J. , -Felix, C. J. , and Warman, J. C. , 1954* Coal petrography, in Geologic investigations of radioactive deposit s a semiannual progress report, December 1, 1953, to May 31, 1954: U« S. Geol. Survey TEI~440, issued by U. S. Atomic Energy Comm. , Tech. Inf. Service, Oak Ridge, Tenn. , <p 0 124~12o9.
Waring, C. L». , and Annell, C« S. , 1953, Semiquantitative spectr ©graphic method for analysis of minerals, rocks, and ores: Anal. Chemistry, v. 25, p. 1174-1179.
Winchester, D. E, , 1923, Oil shale of the Rocky Mountain region: U* S« Geol, Survey Bull. 729, p. 1-204.
Wodehouse, R. P., 1933 9 Tertiary pollen-II. The oil shales of the Green River formation: Torrey Bot. Club Bull. , v. 60, p. 47^-521.
Eetzsehe, Fritz, 193- 2-, Kork trad Cuti«tdarsubstart»ei*, p. 205-239; alsoInkohlte Pflamaenproduktej, p. 295^326: in Ifet»dbuch der Pflanzenanalyse herausgegeben von G. Klein; Dritter Band, Zweiter Teil, Organische Stoffe II, erste Halfte, J. Springer, Tienna, p. 1-806.

51
APPMDIX
COB! DESCBIPTION
Hole 72, 8" Diameter Core, Bed Desert Area, Sweetwater County, Wyoming.
DATES? Cored—11/24/53, by the Pennsylvania Drilling Company, Harlan Gallihue, driller.
Shipment received at Columbus—11/30/53Described and sampled at Coal Geology Laboratory—12/14 through 12/23/53Samples sent to TE Laboratories 12/22/53 and 12/29/53
LOCATION! SE 1/4 of NW 1/4 of Section 15, T 24 N, E 95 W
ELEVATIONS 6,580' SampleNumber
95.97' _____Shale, light gray with very light silty streaksand a few thin carbonaceous streaks. TE 1CGL 84, 2.03 F/M/G, 2.297 ASGM I/ ______
96.08'Shale as above. CGL 83, 3.15 P/M/G, TE 22.272 ASGM ______
96.18'Shale as above. CGL 82, 2.23 P/M/G,2.246 ASGM
96.29'Shale, light gray with black carbonaceous streaksat top. CGL 81, 2.41 F/M/G, 2.254 ASGM TE 3
96.39 5Shale, light gray with a few carbonaceous streaksand very light silty streaks at bottom. CGL 80,2.19 P/M/G, 2.253 ASGM ______
96.49'Shale, light gray with carbonaceous streaks. TE 4CGL 79, 1.89 P/M/G, 2.227 ASGM, 2.64 BSG 2j ______
96.58'Shale as above with thin light gray clayey partingin middle. CGL 78, 2.69 P/M/G, 2*209 ASGM
96.67' TE 5Shale, light gray with thin carbonaceous streaksand clayey parting at bottom.CGL 77, 2.51, P/M/G, 2.123 ASGM _____
I/ ASGM a apparent specific gravity in moist condition.
2J BSG a real specific gravity, U. S. Bureau of Mines determination.

52
Shale, silty, light gray with lighter siltystreaks and very fine carbonaceous flecks;thin dark gray carbonaceous streaks at top. TE 6CGL 76, 1.74 P/^/G, 2.266 ASGM ______
96 0 87 ?Shale, silty, light gray with lighter siltystreaks and very fine carbonaceous flecks.CGL 75, 1.28 P/M/G, 2.289 ASGM
97.00'Shale as above. CGL 74, 1.40 P/M/G, 2.280 ASGM
97.10'Shale as above. CGL 73, 1.24 P/M/G, 2.316 ASGM,2.62 RSG
97.20'Shale as above, less silty. CGL 72, 1.13 P/M/G,2.275 ASGM
97.30'Shale as above. CGL 71, 1.08 P/M/G, 2.268 ASGM
97.40'Shale as above. CGL 70, 1.03 P/M/G, 2.269 ASGM
97.51'Shale as above. CGL 69, 1.03 P/M/G, 2.240 ASGM
97.61'Shale, finely silty, light gray, slightly more car bonaceous than above. CGL 68, 1.08 P/M/G, 2.254 ASGM
97.71'Shale as above. CGL 67, 1.18 P/M/G, 2.278 ASGM
97.83 sShale, silty, light gray with lighter silty streaksand a few carbonaceous flecks. CGL 66, 1.14 P/M/G,2.253 ASGM
97.95 1Shale as above. CGL 65 ? 1.16 P/M/G, 2.268 ASGM
98.07'Shale, silty, light gray with carbonaceous flecks.CGL 64, 1.23 P/WG, 2.302 ASGM
98.25'Shale, silty, light gray with irregular carbonaceousstreaks. CGL 63, 1.15 P/M/G, 2.316 ASGM
98.40 1Shale as above. CGL 62, 0.85 P/M/G, 2.255 ASGM
98.49 fShale, light gray with lighter irregular siltystreaks and carbonaceous flecks. CGL 61, 0.89 P/M/G,2.236 ASGM
98.64 rShale as above| becomes gray carbonaceous shale in lower- half. CGL 60, 1.13 P/M/G, 2.305 ASGM
98.83* ______Shale, light gray with carbonaceous streaks. CGL TF „59, 1.56 P/M/G, 2.276 ASGM ^ '

53
98.95 1Shale, light gray with carbonaceous flecks. CGL 58, 1.20 P/M/G, 2.300 ASGM
99.10'Shale light gray, carbonaceous in lower half with thin clayey partings. GGL 57 5 1.43 P/M/G, 2.279 ASGM
99*18' ________ Shale, light gray with black carbonaceous bands. CGL 56, 2.77 P/k/G, 2.114 ASGM ^ a
99.36'Coal; impure coal in upper 1/3 with gray shaly blebs. Finely disseminated pyrite blebs.through- TE 9 out. CGL 55, 2.79 P/k/G, 1.509 ASGM, 1.70 RSG _________
99.41'Coal, impure, sparsely thin-banded with .02' band of coal .02' from bottom. Finely disseminated pyrite throughout, with pyrite lenses in bottom half. CGL 54, 1.34 P/k/G, 1-475 ASGM, 1.74 RSG
99.53'Coal, impure, sparsely thin-banded. Finely dis seminated pyrites concentrated in upper .02' and scattered pyrite blebs throughout upper half. TE 10 CGL 53, 1.21 P/k/G, 1.458 ASGM
99.65'Coal, moderately medium-ana coarse-banded. .04*vitrain band at bottom. Impure with small amountof finely disseminated pyrite in upper 1/3. CGL52, 1.07 P/M/G., 1.312 ASGM ______t
99.77'Coal, shaly, sparsely thin-banded, becoming moreshaly towards bottom. Pyrite blebs scattered TE 11through upper 1/3. Micro-fault present. CGL 51,2.28 P/k/G, 1.814 ASGM, 2.05 RSG _________
99.88'Shale, gray to black, ca.-bonaceous with impure coal between 99»94 f and ?9.96'. Numerous clay blebs in lower half. CGL 50, 1.98 P/k/G 3 1.911 ASGM
100.00' TE 12 Shale, gray to black carbonaceous with numerous gray clayey blebs. CGL 49, 1.83 P/k/G, 2.040 ASGM _________
100.13 sShale, black, coaly, with some carbonaceous shale,sparsely thin-banded. Gray clay blebs and finely TE 13disseminated pyrite throughout. CGL 48, 3-31P/k/G, 1.658 ASGM _________
100.28'Coal, sparsely thin-banded. About 0.8' impurecoal layer at top. Finely disseminated pyrite TE 14throughout. CGL 47, 1.15 P/M/G, 1.338 ASGM _________
100.40'Coal, moderately thin- and medium-banded. CGL TE 15 46, 0.63 P/k/G, 1.286 ASGM _________

100.50' _________ Coal, abundantly medium to coarse banded. GGL 45, 0,37 P/M/G, 1.294 ASGM TE 16
100.63'Coal, moderately to abundantly thin- and medium- banded with ,06' vitrain at top. CGL 44, 0.88 TE 17 P/M/G 5 1.297 ASGM _________
100,72'Coal, moderately thin- and medium-banded. CGL 43, TE 18 1.27 P/M/G, 1.322 ASGM _________
100.82'Coal, moderately thin-banded. Some pyrite andhumic canneloid in bottom 1/3* Pyrite wedge .007' TE 19thick in upper 1/3. CGL 42, 1.82 P/ii/G, 1.412 ASGM _________
100.92'Coal, sparsely thin- and medium-banded, with some TE 20humic canneloid layers. CGL 41, 2.16 P/M/G, 1.305ASGM _________
101.02'Coal, impure, moderately thin- to medium-banded. TE 21 CGL 40, 2.51 P/M/G, 1.382 ASGM 1.63 RSG _________
101.12'Shale carbonaceous, sparsely thin-banded, withirregular gray shaly lenses and blebs. ,03' TE 22vitrain band at top. CGL 39, 2.85 P/M/G, 1.849ASGM, 2.21 RSG - _________
101.23'Shale carbonaceous, black at top to impure coalin lower 1/4. Sparsely thin-banded. CGL 38, 3.91 TE 23P/M/G, 1.776 ASGM . _________
101.34'Coal impure, attrital. More mineral matter and TE 24finely disseminated pyrite in upper 1/3 CGL 37,4.47 P/H/G, 1.455 ASGM _________
101.44'Shale, light gray with carbonaceous streaks CGL TE 25 36, 1.75 P/M/G, 2.223 ASGM - _________
101.54'Shale as above. CGL 35, 1.55 P/M/G, 2.297 ASGM, TE 25 260 RSG _________
101.65'Shale as above. CGL 34, 1.73 P/V&, 2.219 ASGM
101.75'Shale carbonaceous, gray with black streaks. CGL TE 26 33, 1.76 P.M.G, 2.218 ASGM
101.85'Shale as above. CGL 32, 2.07 P/M/G, 2.186 ASGM,2.54 RSG _________
101.95 fShale, black with coaly streaks. CGL 31, 3.25 TE 27 P/M/G, 1.907 ASGM, 2.21 RSG __________
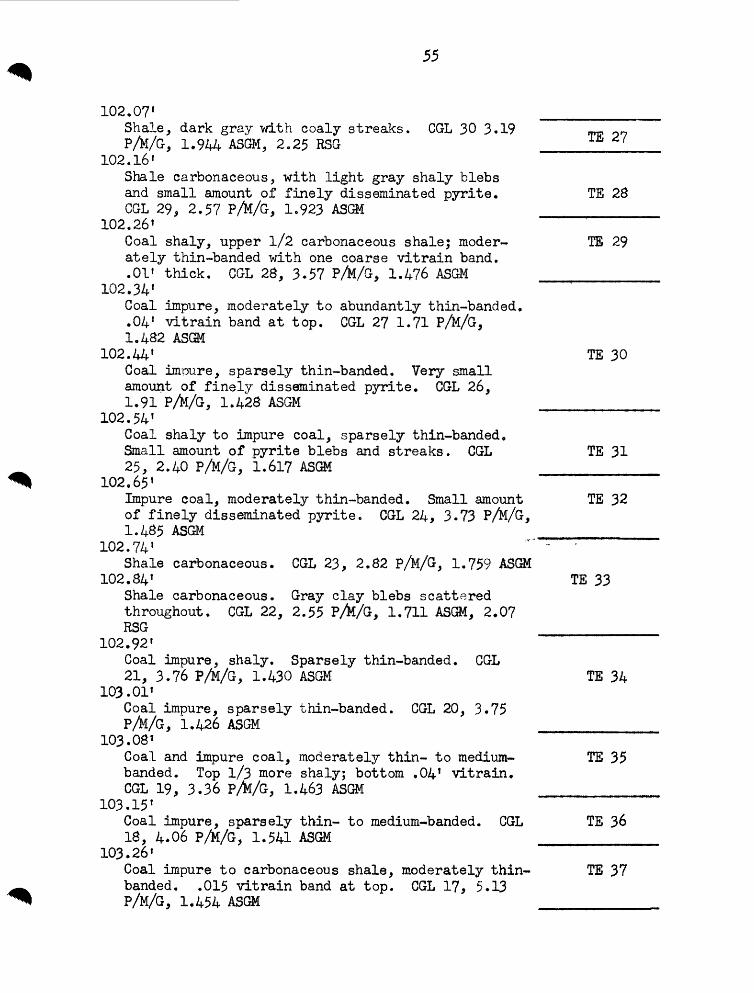
55
102.07' ________ Shale, dark gray with coaly streaks. CGL 30 3.19 in? 97 P/k/G, 1.944 ASGM, 2.25 RSG IJi> * (
102.16'Shale carbonaceous, with light gray shaly blebsand small amount of finely disseminated pyrite. TE 28GGL 29, 2.57 P/M/G, 1.923 ASGM ________
102.26*Coal shaly, upper 1/2 carbonaceous shale; moder-* TE 29ately thin-banded with one coarse vitrain band..01' thick. CGL 28, 3.57 P/M/G, 1.476 ASGM ________
102.34 1Coal impure, moderately to abundantly thin-banded. .04* vitrain band at top. CGL 27 1.71 P/fa/G, 1.482 ASCM
102.44' TE 30 Coal impure, sparsely thin-banded. Very small amount of finely disseminated pyrite. CGL 26, 1.91 P/H/G, 1.428 ASGM ________
102.54 !Coal shaly to impure coal, sparsely thin-banded.Small amount of pyrite blebs and streaks. GGL TE 3125, 2.40 P/M/G, 1.617 ASGM ________
102.65'Impure coal, moderately thin-banded. Small amount TE 32of finely disseminated pyrite. CGL 24, 3.73 P/k/G,1.485 ASGM ________
102.74' " - '
Shale carbonaceous. CGL 23, 2.82 P/M/G, 1.759 ASGM102.84' TE 33
Shale carbonaceous. Gray clay blebs scattered throughout. CGL 22, 2.55 P/fc/G, 1.711 ASGM, 2.07 RSG ________
102.92'Coal impure, shaly. Sparsely thin-banded. CGL21, 3.76 P/M/G, 1.430 ASGM TE 34
103.01'Coal impure, sparsely thin-banded. CGL 20, 3.75P/M/G, 1.426 ASGM ________
103.08'Coal and impure coal, moderately thin- to medium- TE 35banded. Top 1/3 more shaly; bottom .04' vitrain.CGL 19, 3.36 P/k/G, 1.463 ASGM ________
103.15'Coal impure, sparsely thin- to medium-banded. CGL TE 36 18, 4.06 P/fc/G, 1*541 ASGM ________
103.26'Coal impure to carbonaceous shale, moderately thin- TE 37banded. .015 vitrain band at top. CGL 17, 5.13P/M/G, 1.454 ASGM ________

56
103.35' _______ Shale coaly and carbonaceous shale. CGL 16, 4.71 P/M/G, 1.463 ASGM
103.45' TE 38 Coal impure, attrital. CGL 15, 4.64 P/M/G, 1.438 ASGM ________
103.54'Coal impure with carbonaceous shale in lower 1/3. TE 39 CGL 14, 3.79 P/fc/G, 1-475 ASGM ________
103.60'Coal impure to shaly coal, with few scattered clayblebs. CGL 13, 4.28 P/M/G, 1.739 ASGM. TE 40
103.66'Shale carbonaceous, with a few scattered clay blebs.CGL 12, 4.53 P/fc/G, 1.667 AS(3! ________
103.77 1Coal impure; carbonaceous shale in upper and lower1/5, sparsely thin-banded. Small amount of dissem- TE 41inated pyrite through lower 1/3. CGL 11, 6.53P/M/G, 1.555 ASGM ________
103.88'Coal impure, shaly. Moderately thin-banded with TE 42one .02' vitrain band at bottom. CGL 10, 5.01P/X/G, 1.617 ASGM, 1.83 RSG ________
103.98'Coal, moderately thin-banded, with .02' vitrain TE 43band at top. Finely disseminated pyrite throughoutCGL 9, 3.27 P/M/G, 1.334 ASGM ________
104.07'Coal, sparsely to moderately thin-banded with.025' impure layer at bottom. Finely dissemi-nate'd pyrite throughout. CGL 8, 2.75 P/M/G,1.360 ASGM, 1.51 RSG TE 44
104.16'Coal impure, thin carbonaceous band at top,sparsely thin banded. Finely disseminated pyritethroughout. CGL 7, 2.85 P/M/G, 1.407 ASGM ________
104.27'Coal attrital, slightly impure in upper 1/2.Finely disseminated pyrite in upper 1/3. CGL 6, TE 452.18 P/M/G, 1.291 ASGM, 1.40 RSG ________
104.36'Coal attrital. Small amount of finelv disseminated pyrite throughout. CGL 5, 1.16 P/k/G, 1.282 ASGM
104.47 1 TE 46 Coal attrital. Blebs and streaks of pyrite con centrated .05' from bottom. CGL 4, 1.14 P/&/G, 1.270 ASGM, 1.49 RSG ________
104.58'Coal attrital. CGL 3, 1.70 P/fo/G, 1.304 ASGM TE 47

57
104.70' _______Coal impure, attrital. CGL 2 S 2.48 P/M/G., 1.377 ASGM TE 48
104.82'Clay, light gray, plastic, CGL 1, 1.25 P/&/G TE 49
105.00' (Bottom of core received at Coal GeologyLaboratory)I 1 loss in coring recorded at drill site
106.00' (Total depth drilled.)