Embed Size (px)
Citation preview
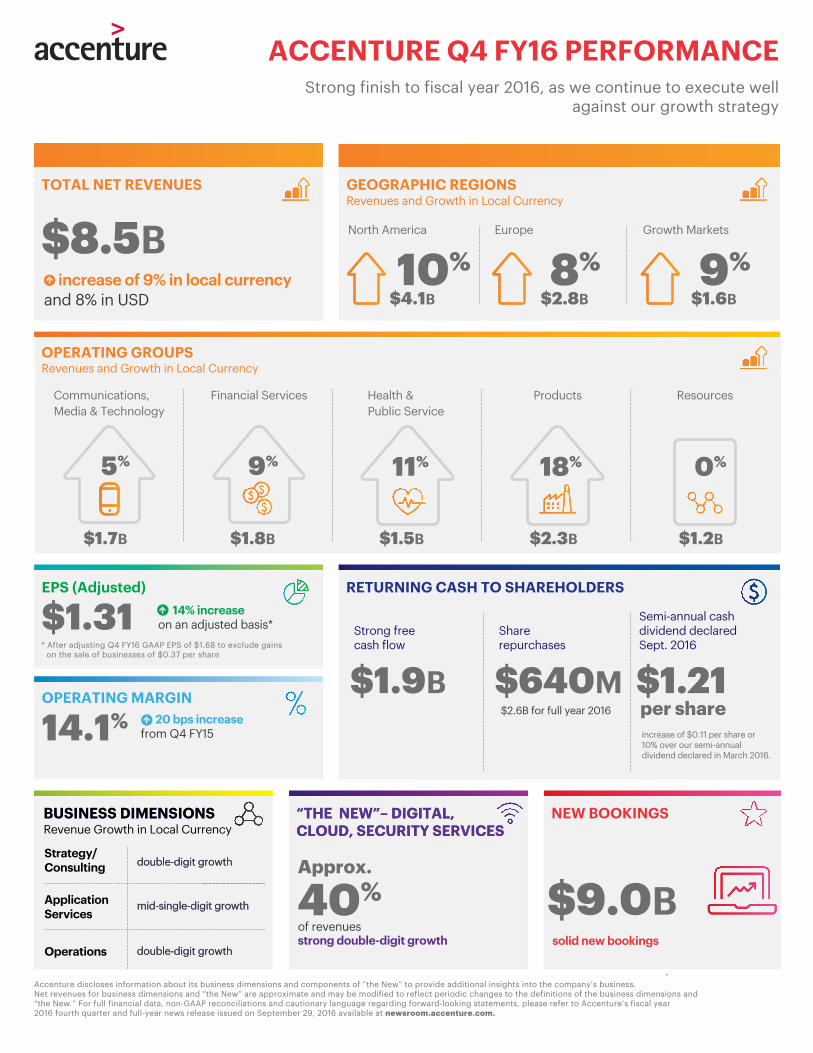
Revenue Growth in Local CurrencyBUSINESS DIMENSIONSBUSINESS DIMENSIONS
Strategy/Consulting double-digit growthdouble-digit growth
double-digit growthdouble-digit growth
mid-single-digit growthmid-single-digit growth
Operations
Application Services
ACCENTURE Q4 FY16 PERFORMANCE
.
20 bps increasefrom Q4 FY15
OPERATING MARGIN
EPS (Adjusted) RETURNING CASH TO SHAREHOLDERS
Share repurchases
Strong freecash flow
14.1%
$1.31
$1.9B $640M $1.21
14% increaseon an adjusted basis*
Strong finish to fiscal year 2016, as we continue to execute well against our growth strategy
Communications, Media & Technology
ProductsFinancial Services ResourcesHealth & Public Service
North America Europe Growth Markets
GEOGRAPHIC REGIONS
OPERATING GROUPS
10% increase of 9% in local currency
and 8% in USD
Revenues and Growth in Local Currency
Revenues and Growth in Local Currency
TOTAL NET REVENUES
$8.5B8% 9%
9% 11% 18% 0%
NEW BOOKINGS
$9.0B
“THE NEW”– DIGITAL,CLOUD, SECURITY SERVICES “THE NEW”– DIGITAL,CLOUD, SECURITY SERVICES
of revenues
Approx.
40%
strong double-digit growth
per share
5%
$4.1B $2.8B $1.6B
$1.2B$2.3B$1.5B$1.8B$1.7B
* After adjusting Q4 FY16 GAAP EPS of $1.68 to exclude gains on the sale of businesses of $0.37 per share
Semi-annual cashdividend declaredSept. 2016
$2.6B for full year 2016
solid new bookings
increase of $0.11 per share or10% over our semi-annualdividend declared in March 2016.
Accenture discloses information about its business dimensions and components of “the New” to provide additional insights into the company’s business. Net revenues for business dimensions and “the New” are approximate and may be modified to reflect periodic changes to the definitions of the business dimensions and“the New.” For full financial data, non-GAAP reconciliations and cautionary language regarding forward-looking statements, please refer to Accenture’s fiscal year 2016 fourth quarter and full-year news release issued on September 29, 2016 available at newsroom.accenture.com.

ACCENTURE FY 2016 PERFORMANCE
Strong, broad-based financial performance driving superior shareholder value
BUSINESS DIMENSIONSBUSINESS DIMENSIONS “THE NEW” – DIGITAL, CLOUD, SECURITY SERVICES“THE NEW” – DIGITAL, CLOUD, SECURITY SERVICES
* Revenues for “the New” include Digital-, Cloud- and Security-related services, net of estimated overlap
10 bps increase from adjusted FY15*
OPERATING MARGIN
EPS (Adjusted) RETURNING CASH TO SHAREHOLDERS
Strong freecash flow
Share repurchases
Cash dividendspaid
increase of 7% in local currency
14.6%
$5.34
$4.1B $2.6B
11% increasefrom adjusted FY15*
Communications, Media & Technology
ProductsFinancial Services ResourcesHealth & Public Service
North America Europe Growth Markets
GEOGRAPHIC REGIONS
OPERATING GROUPS
Revenues and Growth in Local Currency
Revenues and Growth in Local Currency
TOTAL NET REVENUES
$32.9B
11% 12% 15% 3%
NEW BOOKINGS
strong new bookings
$35.4B
9%
$15.7B $11.4B $5.8B
$4.8B$8.4B$6.0B$7.0B$6.6B
11% 11% 8%increase of 10.5% in local currency
and 6% in USD
TOTAL $33B 100% 10.5%
approx. 40%of total revenues $13.5B*
Revenues ($ USD)% of
Revenues
Strategy & Consulting $10B 31% Double-digit
Double-digit
Mid-single-digitApplication Services $16B 47%
Operations $7B 22% $4.5B
DigitalservicesCloudservicesSecurityservices
Revenues ($ USD)% of
Revenues
$9.5B 30% 30%
$0.7B
Est’d % Growthin Local Currency
Est’d % Growthin Local Currency
$1.4B $2.20 per share,an 8% increaseover prior-yeardividend
* After adjusting FY16 GAAP EPS of $6.45 to exclude gains on the sale of businesses ($1.11 per share), and adjusting FY15 GAAP EPS of $4.76 to exclude a pension settlement charge ($0.06 per share).
*FY15 adjusted operating margin of 14.5% excludes impact of pension settlement charge (20 basis points).
Approx. FY16 revenuesApprox. FY16 revenues
reflects a free cash flow to adjusted net income ratio of 1.1 (after adjusting GAAP net income of $4.35B to exclude $745M inafter-tax gains on the saleof businesses)
Accenture discloses information about its business dimensions and components of “the New” to provide additional insights into the company’s business. Net revenues for business dimensions and “the New” are approximate and may be modified to reflect periodic changes to the definitions of the business dimensions and“the New.” For full financial data, non-GAAP reconciliations and cautionary language regarding forward-looking statements, please refer to Accenture’s fiscal year 2016 fourth quarter and full-year news release issued on September 29, 2016 available at newsroom.accenture.com.

Business Dimension Growth
FY16 Indicative Estimates
Accenture discloses information about its business dimensions to provide additional insight into the company’s business. Business dimension net revenues are
approximate and may be modified to reflect periodic changes to the definitions of the business dimensions.
Accenture’s net revenue growth was 10.5% in local currency and 6% in U.S. dollars.
Net Revenues
($USD)(approx.)
% ofNet
Revenues(approx.)
Net RevenuesGrowth in Local
Currency
Strategy & Consulting
$10 B 31% Double digit
Application Services
$16 B 47%Mid-single
digit
Operations $7 B 22% Double digit
Total $33 B 100% 10.5%
Digital-RelatedServices
$9.5 B 30%
Estimated
growth approx.
30%
Application Services
Strategy &
ConsultingOperations

Individual breakouts shown for Digital-, Cloud- and Security-related services include an element of overlap, whereas the total of “the New”, is net of any estimated
overlap. Accenture discloses information about the components of “the New” to provide additional insight into the company’s business. “The New” net revenues are
approximate and may be modified to reflect periodic changes to the definition of the components of “the New”.
Rapid Rotation to “the New”
Approximately $13.5 B or 40% of
total Net Revenues in FY16, net of
overlap
Digital-Related Services ~ $9.5 B
Security-Related Services ~ $0.7 B
Digital-Related
Services
Security-
Related
Services
Cloud-Related
ServicesCloud-Related Services ~ $4.5 B
FY16 Indicative Estimates

11/30/14 2/28/15 5/31/15 8/31/15 11/30/15 2/29/16 5/31/16 8/31/16
Return on Invested Capital 57% 53% 52% 51% 53% 50% 51% 50%
Return on Equity 57% 54% 52% 51% 53% 56% 57% 59%
Return on Assets 19% 20% 19% 18% 18% 22% 22% 22%
Note: February 2016 through August 2016 results include the gain on the sale of Navitaire
August 2016 results include the gain on the sale of Duck Creek
Twelve Months Ended
(Unaudited)
Quarter Ending Return Metrics from November 30, 2014 to August 31, 2016
Q4 FY16
RETURN METRICS TREND

Purpose
Twelve Months Ended
8/31/16(1)
Comments
Net Income Attributable to Accenture plc $4,112
Noncontrolling interests 238
Provision related to income taxes 1,254
Non-operating (income) expense (793) This represents the sum of the following line items on the
Consolidated Income Statements: Interest income, Interest
expense, Other income/expense, net, and gain on sale of
businesses.
Operating Income $4,810
Annual Effective Tax Rate 22.4% The tax rate represents a weighted average of the FY16 full year
tax rate
Tax Adjusted Operating Income $3,734
Divided by Average Capital:
Capital at August 31, 2016
Noncontrolling interests 634
Total Accenture plc shareholders' equity 7,555
Short-term bank borrowings, Long-term debt 27
$8,217
Capital at August 31, 2015
Noncontrolling interests 514
Total Accenture plc shareholders' equity 6,134
Short-term bank borrowings, Long-term debt 27
$6,675
Average Capital $7,446
Return on Invested Capital 50%
(1) May not total due to rounding
Note: Results include the gain on the sale of Navitaire and Duck Creek
(Unaudited)
ROIC represents Return on Invested Capital and is equal to the tax adjusted operating income divided by total average capital,
as outlined below. Accenture believes reporting ROIC provides investors with greater visibility of how effectively Accenture uses
the capital invested in its operations. ROIC is not a measure of financial performance under generally accepted accounting
principles and should not be considered in isolation or as an alternative to net income as an indicator of company performance,
or as an alternative to cash flows from operating activities as a measure of liquidity.
RECONCILIATION OF RETURN ON INVESTED CAPITAL (ROIC)
For the Twelve Months Ended August 31, 2016
(in millions of U.S. dollars)
Q4 FY16

Purpose
Twelve Months Ended
8/31/16(1)
Comments
Net Income Attributable to Accenture plc $4,112
Noncontrolling interests 238
Provision related to income taxes 1,254
Income Before Income Taxes $5,604
Annual Effective Tax Rate 22.4% The tax rate represents a weighted average of the
FY16 full year tax rate
Tax Adjusted Income Before Income Taxes $4,350
Divided by Average Equity and Noncontrolling Interests:
Noncontrolling interests at August 31, 2016 634
Total Accenture plc shareholders' equity at August 31, 2016 7,555
$8,189
Noncontrolling interests at August 31, 2015 514
Total Accenture plc shareholders' equity at August 31, 2015 6,134
$6,648
Average Equity and Noncontrolling Interests $7,418
Return on Equity 59%
(1) May not total due to rounding
Note: Results include the gain on the sale of Navitaire and Duck Creek
(Unaudited)
ROE represents Return on Equity and is equal to the tax adjusted income before income taxes divided by average equity plus
noncontrolling interests, as outlined below. Accenture believes reporting Return on Equity provides investors with a measure of
the level of earnings generated in relation to total shareholders' equity plus noncontrolling interests. ROE is not a measure of
financial performance under generally accepted accounting principles and should not be considered in isolation or as an
alternative to net income as an indicator of company performance, or as an alternative to cash flows from operating activities as
a measure of liquidity.
RECONCILIATION OF RETURN ON EQUITY (ROE)
For the Twelve Months Ended August 31, 2016
(in millions of U.S. dollars)
Q4 FY16

Purpose
Twelve Months Ended
8/31/16(1)
Comments
Net Income Attributable to Accenture plc $4,112
Noncontrolling interests 238
Provision related to income taxes 1,254
Income Before Income Taxes $5,604
Annual Effective Tax Rate 22.4% The tax rate represents a weighted average of the
FY16 full year tax rate
Tax Adjusted Income Before Income Taxes $4,350
Divided by Average Assets:
Total Assets at August 31, 2016 20,609
Total Assets at August 31, 2015 18,203
Average Assets $19,406
Return on Assets 22%
(1) May not total due to rounding
Note: Results include the gain on the sale of Navitaire and Duck Creek
(Unaudited)
ROA represents Return on Assets and is equal to the tax adjusted income before income taxes divided by average assets,
as outlined below. Accenture believes reporting Return on Assets provides investors with a measure of the level of earnings
generated in relation to total assets. ROA is not a measure of financial performance under generally accepted accounting
principles and should not be considered in isolation or as an alternative to net income as an indicator of company
performance, or as an alternative to cash flows from operating activities as a measure of liquidity.
RECONCILIATION OF RETURN ON ASSETS (ROA)
For the Twelve Months Ended August 31, 2016
(in millions of U.S. dollars)
Q4 FY16
11/30/14 2/28/15 5/31/15 8/31/15 11/30/15 2/29/16 5/31/16 8/31/16
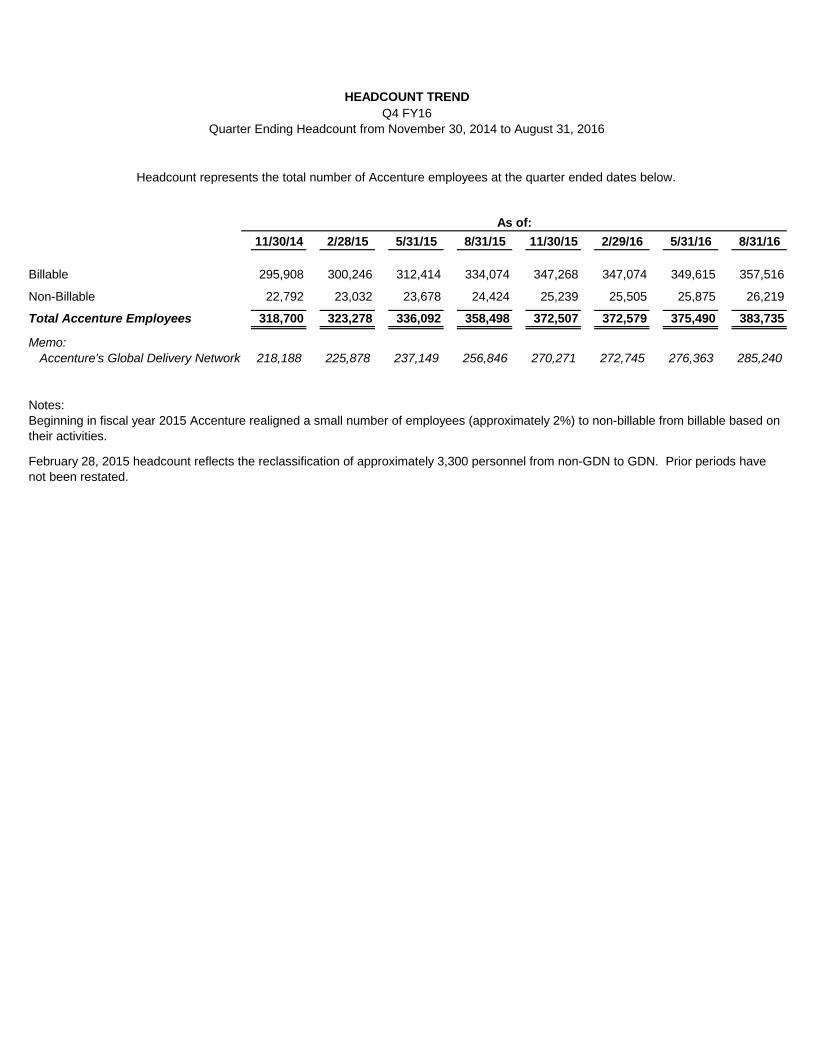
Billable 295,908 300,246 312,414 334,074 347,268 347,074 349,615 357,516
Non-Billable 22,792 23,032 23,678 24,424 25,239 25,505 25,875 26,219
Total Accenture Employees 318,700 323,278 336,092 358,498 372,507 372,579 375,490 383,735
Memo:
Accenture's Global Delivery Network 218,188 225,878 237,149 256,846 270,271 272,745 276,363 285,240
Notes:
Beginning in fiscal year 2015 Accenture realigned a small number of employees (approximately 2%) to non-billable from billable based on
their activities.
February 28, 2015 headcount reflects the reclassification of approximately 3,300 personnel from non-GDN to GDN. Prior periods have
not been restated.
Q4 FY16
HEADCOUNT TREND
As of:
Headcount represents the total number of Accenture employees at the quarter ended dates below.
Quarter Ending Headcount from November 30, 2014 to August 31, 2016
August 31, 2016 Comments
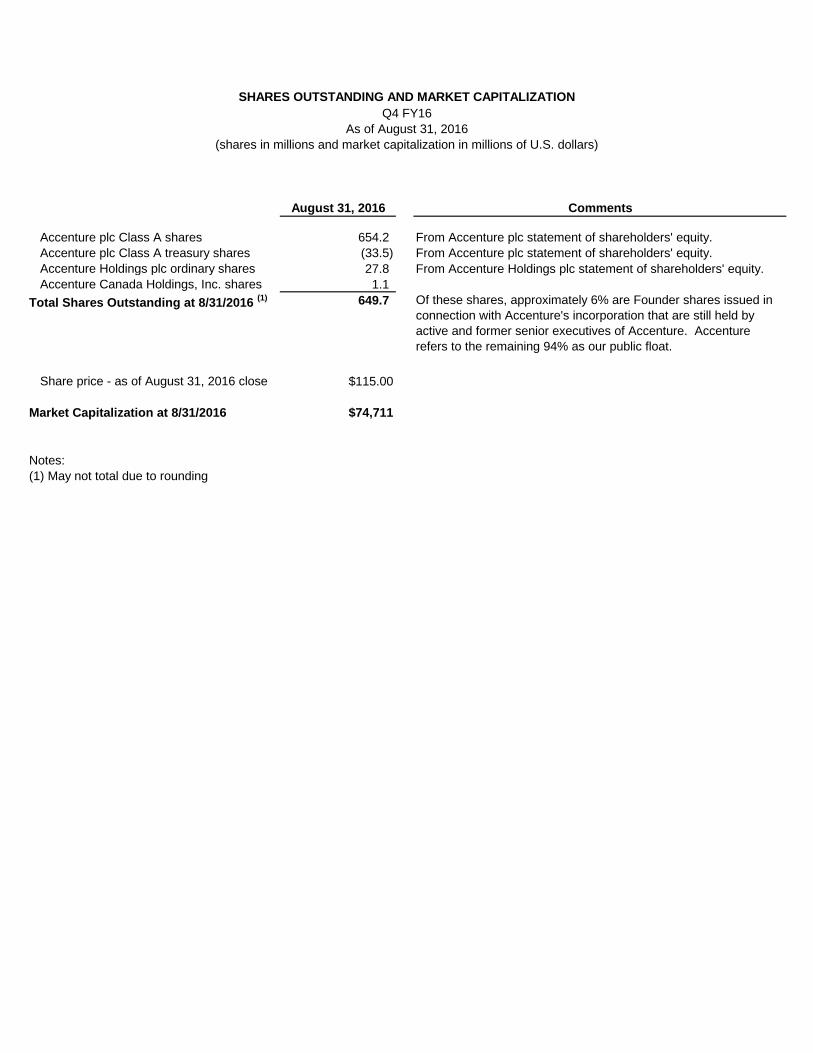
Accenture plc Class A shares 654.2 From Accenture plc statement of shareholders' equity.
Accenture plc Class A treasury shares (33.5) From Accenture plc statement of shareholders' equity.
Accenture Holdings plc ordinary shares 27.8 From Accenture Holdings plc statement of shareholders' equity.
Accenture Canada Holdings, Inc. shares 1.1
Total Shares Outstanding at 8/31/2016 (1) 649.7 Of these shares, approximately 6% are Founder shares issued in
connection with Accenture's incorporation that are still held by
active and former senior executives of Accenture. Accenture
refers to the remaining 94% as our public float.
Share price - as of August 31, 2016 close $115.00
Market Capitalization at 8/31/2016 $74,711
Notes:
(1) May not total due to rounding
SHARES OUTSTANDING AND MARKET CAPITALIZATION
As of August 31, 2016
(shares in millions and market capitalization in millions of U.S. dollars)
Q4 FY16

Operating Group Q1
% of
Total Q2
% of
Total Q3
% of
Total Q4
% of
Total
Full
Year
% of
Total Q1
% of
Total Q2
% of
Total Q3
% of
Total Q4
% of
Total
Full
Year
% of
Total
Comm. Media & Tech $1,581 20% $1,517 20% $1,613 21% $1,638 21% $6,349 20% $1,605 20% $1,607 20% $1,708 20% $1,697 20% $6,616 20%
Financial Services 1,716 22% 1,590 21% 1,638 21% 1,691 21% 6,635 21% 1,745 22% 1,685 21% 1,805 21% 1,796 21% 7,031 21%
Health & Public Service 1,368 17% 1,320 18% 1,384 18% 1,391 18% 5,463 18% 1,424 18% 1,482 19% 1,539 18% 1,541 18% 5,987 18%
Products 1,930 25% 1,851 25% 1,883 24% 1,932 24% 7,596 25% 1,990 25% 1,995 25% 2,158 26% 2,252 27% 8,395 26%
Resources 1,295 16% 1,212 16% 1,248 16% 1,233 16% 4,989 16% 1,245 15% 1,174 15% 1,221 15% 1,199 14% 4,839 15%
Other 4 n/m 4 n/m 4 n/m 4 n/m 17 n/m 4 n/m 3 n/m 4 n/m 4 n/m 15 n/m
Total (1)
$7,896 100% $7,493 100% $7,770 100% $7,889 100% $31,048 100% $8,013 100% $7,946 100% $8,435 100% $8,489 100% $32,883 100%
Geographic Region Q1
% of
Total Q2
% of
Total Q3
% of
Total Q4
% of
Total
Full
Year
% of
Total Q1
% of
Total Q2
% of
Total Q3
% of
Total Q4
% of
Total
Full
Year
% of
Total
North America $3,438 43% $3,412 46% $3,644 47% $3,715 47% $14,209 46% $3,763 47% $3,791 48% $4,017 48% $4,082 48% $15,653 48%
Europe 2,905 37% 2,660 35% 2,653 34% 2,712 34% 10,930 35% 2,885 36% 2,785 35% 2,946 35% 2,833 33% 11,448 35%
Growth Markets 1,552 20% 1,422 19% 1,473 19% 1,462 19% 5,909 19% 1,365 17% 1,370 17% 1,472 17% 1,574 19% 5,781 17%
Total (1)
$7,896 100% $7,493 100% $7,770 100% $7,889 100% $31,048 100% $8,013 100% $7,946 100% $8,435 100% $8,489 100% $32,883 100%
Type of Work Q1
% of
Total Q2
% of
Total Q3
% of
Total Q4
% of
Total
Full
Year
% of
Total Q1
% of
Total Q2
% of
Total Q3
% of
Total Q4
% of
Total
Full
Year
% of
Total
Consulting $4,093 52% $3,839 51% $4,112 53% $4,160 53% $16,204 52% $4,346 54% $4,293 54% $4,621 55% $4,608 54% $17,868 54%
Outsourcing 3,803 48% 3,654 49% 3,658 47% 3,729 47% 14,844 48% 3,667 46% 3,653 46% 3,813 45% 3,882 46% 15,015 46%
Total (1)
$7,896 100% $7,493 100% $7,770 100% $7,889 100% $31,048 100% $8,013 100% $7,946 100% $8,435 100% $8,489 100% $32,883 100%
Notes:
(1) May not total due to rounding
The company's geographic regions are as follows:
•North America: The United States and Canada •Europe •Growth Markets: Asia Pacific, Latin America, Africa, the Middle East, Russia and Turkey
FY2016
FY2016
FY2015
FY2015
FY2016
(Unaudited)
NET REVENUES TREND
Q4 FY16
Quarter Ending Net Revenue from November 30, 2014 to August 31, 2016
(in millions of U.S. dollars)
FY2015

Type of Work Q1
% of
Total Q2
% of
Total Q3
% of
Total Q4
% of
Total
Full
Year
% of
Total Q1
% of
Total Q2
% of
Total Q3
% of
Total Q4
% of
Total
Full
Year
% of
Total
Consulting $3.86 50% $4.25 45% $4.51 53% $4.08 46% $16.70 49% $4.42 57% $5.01 52% $4.93 54% $4.81 53% $19.16 54%
Outsourcing 3.80 50% 5.11 55% 4.02 47% 4.73 54% 17.66 51% 3.32 43% 4.54 48% 4.19 46% 4.18 47% 16.23 46%
Total $7.66 100% $9.36 100% $8.53 100% $8.81 100% $34.36 100% $7.74 100% $9.55 100% $9.12 100% $8.99 100% $35.39 100%
FY2016
(Unaudited)
NEW BOOKINGS TREND
Q4 FY16
Quarter Ending New Bookings from November 30, 2014 to August 31, 2016
(in billions of U.S. dollars)
FY2015


![8 th Grade TAKS Review Objective Three. 8.5B Summarize arguments regarding protective tariffs, taxation, [and the banking system.]](https://img.dokumen.tips/doc/110x75/56649ed85503460f94be6dfe/8-th-grade-taks-review-objective-three-85b-summarize-arguments-regarding.jpg)