Embed Size (px)
Citation preview

This article was downloaded by: 10.3.98.104On: 12 Dec 2021Access details: subscription numberPublisher: CRC PressInforma Ltd Registered in England and Wales Registered Number: 1072954 Registered office: 5 Howick Place, London SW1P 1WG, UK
GeocryologyCharacteristics and Use of Frozen Ground and PermafrostLandformsStuart A. Harris, Anatoli Brouchkov, Cheng Guodong
Factors affecting permafrost distribution
Publication detailshttps://www.routledgehandbooks.com/doi/10.4324/9781315166988-4
Stuart A. Harris, Anatoli Brouchkov, Cheng GuodongPublished online on: 28 Sep 2017
How to cite :- Stuart A. Harris, Anatoli Brouchkov, Cheng Guodong. 28 Sep 2017, Factorsaffecting permafrost distribution from: Geocryology, Characteristics and Use of Frozen Ground andPermafrost Landforms CRC PressAccessed on: 12 Dec 2021https://www.routledgehandbooks.com/doi/10.4324/9781315166988-4
PLEASE SCROLL DOWN FOR DOCUMENT
Full terms and conditions of use: https://www.routledgehandbooks.com/legal-notices/terms
This Document PDF may be used for research, teaching and private study purposes. Any substantial or systematic reproductions,re-distribution, re-selling, loan or sub-licensing, systematic supply or distribution in any form to anyone is expressly forbidden.
The publisher does not give any warranty express or implied or make any representation that the contents will be complete oraccurate or up to date. The publisher shall not be liable for an loss, actions, claims, proceedings, demand or costs or damageswhatsoever or howsoever caused arising directly or indirectly in connection with or arising out of the use of this material.

Dow
nloa
ded
By:
10.
3.98
.104
At:
14:3
1 12
Dec
202
1; F
or: 9
7813
1516
6988
, cha
pter
3, 1
0.43
24/9
7813
1516
6988
-4
Chapter 3
Factors affecting permafrostdistribution
3.1 INTRODUCTION
As already noted, permafrost is defined as ground that remains below 0◦C for morethan two years. Determining this is difficult without actual temperature measurementssince by merely looking at the ground surface, the temperature regime cannot be deter-mined. Again, fluctuations in weather from year to year can change the status of frozenground. Using actual temperature measurements and relevant observations, Brown &Péwé (1973) divided the factors affecting the presence or absence of permafrost intoclimatic and terrain factors which interact together to determine the actual distributionof permafrost. The climatic factors control the level of heat (temperature) and amountof heat (duration) applied to the surface of the Earth. Altitude, latitude, longitudeand type, timing, and amount of precipitation are involved. Their combined effect ismodified by the terrain factors, e.g., local relief, aspect, vegetation, hydrology, natureof the substrate and fire. In addition, environmental changes over time and the activ-ities of humans further affect the distribution of permafrost. The climatic factors aredominant in areas of continuous permafrost, whereas the terrain factors increase inimportance as the percentage of ground underlain by permafrost decreases. Each ofthese factors will be discussed in turn in this chapter.
3.2 CLIMATIC FACTORS
3.2.1 Heat balance on the surface of the Earthand its effect on the climate
The actual ground temperature is a result of the heat balance on the surface of theEarth. This is dependent on two main factors, viz., the geothermal heat flow and thesolar radiation reaching the surface of the Earth. As noted in Chapter 1, the geothermalheat flow is small compared to the potential solar radiation, but can vary dependingon the presence or absence of hot spots beneath the surface layers of the crust or thepresence of plate margins.
Solar radiation comes to the surface directly from the sun (long-wave radiation)and as radiation from the atmosphere. A part of that radiation is reflected, and thefraction of solar energy (short-wave radiation) reflected from the Earth is called thealbedo (α). Snow has a very high albedo, whereas dark coloured soil has a low albedo,

Dow
nloa
ded
By:
10.
3.98
.104
At:
14:3
1 12
Dec
202
1; F
or: 9
7813
1516
6988
, cha
pter
3, 1
0.43
24/9
7813
1516
6988
-4
86 Geocryology
Table 3.1 Typical albedos of various surfaces (Dostovalov, B. N. & Kudryavtsev, 1967).
Surface Albedo Surface Albedo
Limestone 56 Clay dry 16–23Basalt 6 Clay wet 5–14Granite 12–18 Grass green 16–27Clay desert surface 29–31 Water (depending on sun position 2–78
and condition of water surface)Snow 30–85 Earth in total 40 (according to Budyko, 1980)
resulting in the surface of the soil absorbing most of the incoming energy arriving onits surface (see Table 3.1). Part of this absorbed energy is reradiated back into theatmosphere (E), the actual amount depending on the temperature (T) of the groundsurface according to the Stefan–Boltzmann law:
E = σT4 (3.1)
The constant of proportionality σ is called the Stefan–Boltzmann constant:
σ = 5.6703 ∗ 10−8 Wattm2K2
(3.2)
The difference between the energy reaching the surface and that emitted from the sur-face radiation by reradiation is called the net solar radiation (Rn). It varies dependingon the time of day, season, geographical position and micro-environment. Averagedover the year, net solar radiation (measured in the upper atmosphere) is negative fornorthern areas (Figure 3.1). On the surface, the negative net radiation only occursin high latitudes or altitudes (Budyko, 1971). In the Tropics, there is an excessiveamount of net solar radiation, and this energy imbalance is the driver of both theatmospheric and oceanic circulations. To maintain the mean annual air temperaturein the Northern Hemisphere at the present-day levels, 30% of the heat absorbed inthe Tropics must be moved polewards by air mass movements, surface ocean currentsand the thermohaline circulation (Christofferson, 1994; Harris, 2002a). Any fluctua-tion in any of these processes can alter the mean annual air and ground temperatureswhich will result in a tendency to increase or decrease the active layer thickness andultimately the temperature and thickness of the permafrost. Since energy and mattercannot be created or destroyed, one place will become warmer whereas another placewill become proportionately colder, i.e., it produces regional climate changes. Cohenet al. (2012) showed that regional changes can also be produced by changes in thepatterns of winter precipitation modifying the winter cooling on a regional basis.
One of the main causes of precipitation is the interaction between cold, dense,polar or sub-polar air and warm, humid temperate or tropical air, so the move-ments of the air masses are critical in maintaining the precipitation at any givenlocation. Harris (2013a) discusses some of the main causes that are involved inproducing climate change, listed in Table 3.2. The first order causes produce thelargest temperature changes, reinforced by feedbacks from the second order causes.

Dow
nloa
ded
By:
10.
3.98
.104
At:
14:3
1 12
Dec
202
1; F
or: 9
7813
1516
6988
, cha
pter
3, 1
0.43
24/9
7813
1516
6988
-4
Factors affecting permafrost distribution 87
Figure 3.1 Global net solar radiation as measured from space satellites.The measurements were madeby the Clouds and the Earth’s Radiant Energy System (CERES) sensors on NASA’s Terraand Aqua satellites (Wielicki et al., 1996).
Table 3.2 Some suggested controls of climatic change arranged into four orders based on the potentialtemperature change that they can cause (Harris, 2013a, with permission).
Potential changeOrder inTemperature Control
1st 20–30◦C 1. Difference in heat absorption by sea and land as controlledby the position of continents and oceans.
2. Changes in surface ocean currents and thermohalinecirculations.
3. Changes in Ocean Gateways.4. Plate Tectonics.
2nd 15–20◦C 5. Eustatic sea level changes.6. Snow covering ice bodies.7. Changes in air masses.
3rd 5–10◦C 8. Milankovich Cycles.4th <5◦C 9. Fluctuations in CO2 and greenhouse gases.
10. Cosmic rays and fluctuations in the total solar irradiance.11.Variations in solar output; the Maunder cycle.12. Large-scale volcanic eruptions.13. Elevation of large tracts of land, e.g.,Tibet.14. Oscillatory ocean currents, e.g., El Niño and La Niña.15. Other short-term cycles, e.g., 2 and 7 years.16. Agriculture, deforestation and urbanization.

Dow
nloa
ded
By:
10.
3.98
.104
At:
14:3
1 12
Dec
202
1; F
or: 9
7813
1516
6988
, cha
pter
3, 1
0.43
24/9
7813
1516
6988
-4
88 Geocryology
Figure 3.2 Comparison of the carbon dioxide content of the atmosphere over the past 4000 millionyears with mean annual air temperature on a linear scale (modified from Berner, 1990;Berner & Kothavala, 2001; Retallack., 2001; Ruddiman, 2001; Royer et al., 2004; Pagani et al.,2005).
The Milankovitch cycles are always present so long as the Earth and sun maintain theircurrent trajectories. The fourth order causes produce minor fluctuations. These causesare all interacting at any one time, and the weather and climate merely show the prod-uct of all these factors. With so many processes oscillating with differing periodicitiesor gradually changing with time, it is no wonder that the weather is so unpredictable.
It has been proposed that the decreasing level of CO2 was a primary driver ofPhanerozoic climate (Royer et al., 2004). Carbon dioxide is an unusual gas in that itssolubility in water increases with decreasing water temperatures. The Earth has oceansand seas covering approximately 70% of its surface, so a small lowering in tempera-ture of the Earth will result in considerable quantities of carbon dioxide leaving theatmosphere to become sequestered in the water bodies. This reduces the carbon diox-ide content of the atmosphere. Conversely, a slight increase in the temperature of theEarth will result in release of some carbon dioxide from the water bodies, increasingthe CO2 content of the atmosphere as demonstrated by Landschützer et al. (2015).Thus mean annual air temperature and CO2 content of the atmosphere will normallybe closely correlated, unless some other factors are changing the situation. Examina-tion of the long-term record of mean annual air temperature measured using proxieswith the measured CO2 content of the air shows that there have been spectacularlydifferent independent fluctuations in air temperature and carbon dioxide content ofthe atmosphere in the past (Figure 3.2), so that other causes besides changes in carbondioxide content of the atmosphere must have been involved in causing the changes inair temperature of the Earth.

Dow
nloa
ded
By:
10.
3.98
.104
At:
14:3
1 12
Dec
202
1; F
or: 9
7813
1516
6988
, cha
pter
3, 1
0.43
24/9
7813
1516
6988
-4
Factors affecting permafrost distribution 89
The actual timing of the development of geocryological conditions depended onthe geographical location and local history of plate tectonics. Antarctica was the firstland area to be affected (c. 30 Ma – Tripati et al., 2008), followed by South America(8.9 Ma – Rabassa et al., 2004; Rabassa, 2008), northwest North America and easternSiberia (3.5 Ma – Froese, 1998; Harris, 2001a), Kazakhstan (3.5 Ma – Aubekerova &Gorbunov, 1999), Southern Siberia (3.0 Ma – Fortiev, 2009), Europe and westernRussia (1.8 Ma – Ehlers & Gibbard, 2008), and Tibet (c. 1.0 Ma). When the SouthAmerican plate moved north to collide with the North American plate between 2.8 and2.4 Ma, it closed off the Panamanian Seaway to El Niño, which resulted in reducedwarming of Western Europe by the Gulf Stream.
The distribution of land and sea are also very important in producing either con-tinental or maritime conditions, each of which result in different combinations ofpermafrost landforms being present or absent. The reduction in area of the TethyanSea during the Cenozoic Era correlates with a drastic drop in mean annual air tem-perature of the Earth (Figure 3.2). The presence of mountain ranges over which moistair masses must pass is also involved in controlling the amount of moisture that isavailable to produce ground ice.
In general, energy on the Earth surface should be balanced so that the amountof energy which comes in also goes out over the span of a year or else the averagetemperature will rise or fall. Solar radiation comes to the surface of the Earth in theamount of about 1368 Watts per square metre, which called solar constant (S). TheEarth is a globe, which receives energy depending on the Sun’s position and angle ofsurface, πr2S(1 − α) in total, but reradiates from all over its surface, 4 πr2ST4 in total,where T is the Earth temperature. Then the result is:
S4
(1 − α)
σ= T4 (3.3)
The average albedo of the Earth is about 0.3, so the incident solar radiationreflected back to space will be 1368/4 = 342 and 342 × 0.7 = 239.4 Watts per squaremetre. Emitting radiation is the only way the Earth can get rid of energy. Most of theenergy emitted is infrared radiation which is not warm enough to emit visible radia-tion. The equation above can be used to estimate the average temperature of the Earth,which is called the effective radiating temperature. It is the temperature that wouldbe measured by an infrared radiometer in space, pointed at the Earth.
It follows from the equation above that the effective radiating temperature of theEarth is 255◦K (−18◦C). However, the average temperature of the surface of the Earth isabout 287◦K (+15◦C). Accordingly, there is 32◦C difference between the calculated andthe actual temperature of the Earth surface, which can be explained by the greenhouseeffect. The short wavelengths of visible light from the sun can pass relatively easilythrough the atmosphere, but the longer wavelengths of the infrared re-radiation fromthe Earth surface are absorbed by water vapour, carbon dioxide and other greenhousegases. The trapping of the long wavelength radiation by the atmosphere causes heatingof the atmosphere, and eventually, the Earth surface. Increase of carbon dioxide andmethane concentration in the atmosphere by human activity can result in limited globalclimatic change, as well as regional climate changes. However, the ratio of water

Dow
nloa
ded
By:
10.
3.98
.104
At:
14:3
1 12
Dec
202
1; F
or: 9
7813
1516
6988
, cha
pter
3, 1
0.43
24/9
7813
1516
6988
-4
90 Geocryology
Figure 3.3 Mean annual ground surface and air temperatures for sites in areas overlying or close topermafrost in Canada and Norway (from Harris, 2015).
vapour to carbon dioxide is 500–750 to 3, so that any changes in relative humidityof the atmosphere can produce a far more significant change in the greenhouse effect(Harris, 2010b, p. 18).
The Earth surface and the atmosphere also exchange heat through convectionbetween the surface and the air (the sensible heat flux, H) as well as through evapora-tion and transpiration (latent heat, LE). That happens due to the latent heat requiredfor any phase transitions of water on the surface of the Earth. The rest of the heaton the surface goes into the lithosphere as the ground heat flux (G). Thus, the heatbalance equation on the Earth surface is:
Rn = H + LE + G (3.4)
where: Rn – net solar radiation, H – sensible heat flux, LE – latent heat, G – groundheat flux.
In spite of the fact that in the full annual cycle (day, year etc.) the net solar radiationtends to be zero, at any given moment this may not be the case for the sensible heatflux, latent heat and ground heat flux. Usually the value of the ground heat flux issubstantially (usually 0–7◦C) warmer than the net solar radiation, sensible heat fluxor latent heat (Figure 3.3). However, the ground heat flux is the reason for seasonalfreezing and thawing of the ground and other thermal processes. Topography andslope aspect have a significant effect on the net diurnal heat flux, even when the slopesare a mere 5◦ (Figure 3.4). Study of the exact values for energy flows on the Earthsurface is an ongoing research, supplemented by new estimates coming from satelliteobservations, ground-based observations, and numerical modeling.

Dow
nloa
ded
By:
10.
3.98
.104
At:
14:3
1 12
Dec
202
1; F
or: 9
7813
1516
6988
, cha
pter
3, 1
0.43
24/9
7813
1516
6988
-4
Factors affecting permafrost distribution 91
Figure 3.4 Variation in mean soil heat flux and diurnal range of heat flux at 5 cm depth on silt loam soilsunder various slope conditions (zero and 5◦), aspects and vegetation covers on lithalsa #4,Fox Lake,Yukon Territory, on August 17th, 1992 (redrawn from Harris, 1998b, Figure 5).
3.2.2 Relationship between air and ground temperatures
A simple plot of mean annual air temperatures (MAAT) against mean annual groundtemperatures (MAGT) indicates a considerable discrepancy and variability, withthe ground temperature usually being noticeably colder than the air temperature(Figure 3.3). This difference is called the thermal offset, and will be discussed below.However in areas of low winter snow cover (under 50 cm), there is a strong relation-ship between the permafrost distribution and the mean annual thawing index (MATI)calculated by adding up the total positive mean annual daily air temperatures andthe mean annual freezing index (MAFI) (see Figure 3.5). The relationship still showssome variability, but the relationship can be used to obtain a reasonable probabilityof the potential for the existence of permafrost around the weather station (Harris,1981a, Figure 5). The same plot can also be used to show the relative continentalityof permafrost areas (Figure 3.6).
In areas with higher winter snow covers, the bottom snow temperature (BTS) atthe end of winter has been shown to indicate the presence or absence of permafrost(Haeberli, 1973) as well as the probable thickness of the active layer (Haeberli &Patzelt, 1983). Once again, the results are not always correct, but they have been usedsuccessfully to indicate areas of permafrost in the Alps (Haeberli, 1973), Colorado(Greenstein, 1983), Scandinavia (King, 1983), and in the mountain ranges of thesouthern Yukon Territory (Lewkowicz et al., 2011).

Dow
nloa
ded
By:
10.
3.98
.104
At:
14:3
1 12
Dec
202
1; F
or: 9
7813
1516
6988
, cha
pter
3, 1
0.43
24/9
7813
1516
6988
-4
92 Geocryology
Figure 3.5 Distribution of continuous permafrost (>70%), discontinuous permafrost and sporadicpermafrost (>30%) using annual freeze – thaw indices (from Harris, 1981a, Figure 5).
Nelson & Outcalt (1987) introduced the Nelson frost number for predicting theregional distribution of permafrost, following an earlier test in central Canada (Nelson,1986). While this predicted permafrost distribution satisfactorily on the Qinghai-TibetPlateau under cold, arid conditions, others have found that it does not always work.Additional models have been suggested by various authors, but a recent detailed testof these methods and suggested modifications produced a less than satisfactory resultusing ten-year data from ten sites in the Alps (Mutter & Phillips, 2012). Later algo-rithms are still under discussion, especially in regard to the effects of the necessaryassumptions, e.g., Xie & Gough (2013), and Kurylyk (2015).
The reasons for the rather unpredictable effect of the snow cover were exploredby Goodrich (1983), who concluded that the effect of the snow cover is difficult tomodel accurately due to the timing of the snowfalls with variations in air temperatures,redistribution of snow, and latent heat effects. Subsequently, it has been found that thediode effect of peat and fractured rock, together with the processes operating within

Dow
nloa
ded
By:
10.
3.98
.104
At:
14:3
1 12
Dec
202
1; F
or: 9
7813
1516
6988
, cha
pter
3, 1
0.43
24/9
7813
1516
6988
-4
Factors affecting permafrost distribution 93
Figure 3.6 Comparison of the degree of continentality of selected permafrost areas (after Harris,1981a, Figure 6). Continentality increases with increasing freezing and thawing indices.
them seriously interfere with the modeling (see Harris and Pedersen, 1998). In addition,sublimation of snow alters the balance of latent heat, which creates further problemsin areas of low winter humidity (Harris, 1972; Peng et al., 2007).
3.2.3 Thermal offset
This term was introduced by Kudryavtsev et al. (1974) to explain the change inobserved temperature between the air and the upper surface layers of the soil or under-lying rock (Figure 3.3; see also, Smith & Riseborough, 2002). Unfortunately, theterm “thermal offset’’ is not usually used in a form signifying exactly what is beingdiscussed, nor is the time period always provided for which the value is measured.

Dow
nloa
ded
By:
10.
3.98
.104
At:
14:3
1 12
Dec
202
1; F
or: 9
7813
1516
6988
, cha
pter
3, 1
0.43
24/9
7813
1516
6988
-4
94 Geocryology
Figure 3.7 An example of the thermal offsets in winter in the boreal forest ofAlaska (from Romanovskyet al.,2011). Since the thermal offsets change diurnally and seasonally, the overall mean annualthermal offset between the air and ground temperatures is much less than shown here.
It is actually a product of the sum of several types of thermal offsets across distinctboundaries within a given microenvironment. These offsets may be positive or nega-tive, but the total effect is usually negative (see Figure 3.2). Most thermal offsets arecontinually changing with the seasons, e.g., snow cover, so specifying the time periodbeing considered is essential.
Figure 3.7 shows the general concept of some of the layers involved in pro-ducing the various thermal offsets. The total thermal offset represents the sum ofmultiple parts. Within the atmosphere, there is usually a lapse rate approximating0.4–0.6◦C/100 m rise in altitude, assuming there are no temperature inversions present.In a coniferous forest in winter, there is an offset at the top of the forest canopy (thetree offset), one at the surface of the snow pack (snow pack offset), one at the surfaceof the O horizon which is usually 1–2 cm thick (called the organic layer offset), oneat the upper boundary of the A horizon (the top of the true mineral soil) which is only5–15 cm deep (called the A horizon offset), and then the one at the surface of the Band C horizons (called the mineral soil offset). Each of these layers has a differentthermal conductivity which means that significant temperature offsets will occur. Thetree offset is usually positive by day in winter, whereas the summer tree offset togetherwith the other offsets are usually negative. If ground or shrub vegetation is present, thistoo, will result in temperature offsets that will change with the time of year (the ground

Dow
nloa
ded
By:
10.
3.98
.104
At:
14:3
1 12
Dec
202
1; F
or: 9
7813
1516
6988
, cha
pter
3, 1
0.43
24/9
7813
1516
6988
-4
Factors affecting permafrost distribution 95
vegetation offset and the shrub offset). To add to these complications, the snow packcomes and goes with the seasons, and the thermal conductivity of the layers changeswith moisture content as well as between frozen and unfrozen states. Meltwater willadd to the moisture content in the soil during late spring-early summer, and summerrains will bring extra heat to the surface layers of the ground. Soil textures can varyconsiderably in a small distance. Inevitably, the thermal offsets are constantly chang-ing and even fluctuate from year to year, and it is always necessary to specify thetime period (day, season, annual) being discussed. Any interference with any one ofthe offsets will alter the overall thermal condition of the soil. Usually, the variationsin vegetation and winter snow cover produce the largest offsets that can amount toseveral degrees C. Similarly, poor drainage and standing water have enormous effects.
Kudryavtsev et al. (1974) also considered the effect of slope and aspect in affectingthe total thermal offset. The exposure and slope thermal offsets alter both the MAAT(tav) as well as the amplitude of the ground surface temperature (As) by modifying thequantity of incoming and absorbed solar radiation. Aspect decreases both tav and As
when the maximum insolation comes from the south, through southwest to northeastto north in the northern hemisphere. Since winter cooling differs little on all slopes, itis the summer insolation that controls the effect. The combined effect of both exposureand slope angle can be estimated as follows (Kudryavtsev et al., 1974):
H = k�tR = Rn − LE − G and �tR = (Rn − LE − G)/k (3.5)
where: Rn is the net solar radiation, H is the sensible heat flux, LE is the latent heat,G is the ground heat flux, k is the coefficient of turbulent heat transfer between theground and atmosphere minus the sensible heat flux.
One of the least complicated situations in the field is that for nearly vertical rockwalls, but even there, thermal offsets have been reported (Hasler et al., 2011a, 2011b),some being positive while others are negative. Lacelle et al. (2016) show that a similarsimple case occurs in the McMurdo Dry Valleys of Antarctica.
Another simple case is found in the Prairies of North America, well south of thepermafrost region. The main offsets there are the snow pack offset, the ground vegeta-tion offset, the A horizon offset and the mineral horizon offset. Since the compositionand structure of the vegetation cover and soil horizonation is similar throughout theregion, the main variable is the snow pack offset. Todhunter & Popham (2008) exam-ined the relationship of soil and air temperatures at sites throughout the Great Plainsof the United States, using screen air temperatures and soil temperatures at 10.5 cmdepth (within the A horizon). The results indicated that the total annual thermal offsetwas less than 1◦C in the south, but increased to >4◦C by the border with Canada. Thesouthern stations showed no sensitivity to snow cover, so their offset is mainly dueto variations in the ground vegetation and A horizon offsets. In the north, the annualthermal offsets were very variable and were obviously strongly affected by variationsin snow cover, timing of snowfalls and duration of the snow cover. In an earlier studyof the annual thermal offset at Fargo, North Dakota, Grundstein et al. (2005) showedthat the mean annual thermal offset at Fargo varied wildly from year to year, rangingfrom slightly under 1.5◦C to over 4.0◦C. These authors discussed the variability indetail, but found no model that has been proposed so far which satisfactorily explainsall the variations. Even wider discrepancies between MAAT and apparently stablepermafrost can occur in ice caves (Harris, 1979).

Dow
nloa
ded
By:
10.
3.98
.104
At:
14:3
1 12
Dec
202
1; F
or: 9
7813
1516
6988
, cha
pter
3, 1
0.43
24/9
7813
1516
6988
-4
96 Geocryology
Burn & Smith (1988) examined the total annual thermal offset at several sitesnear Mayo, Yukon Territory. Some sites were in hay fields but others were in theBoreal Forest. The air temperatures were up to 1.7◦C warmer than the ground sur-face temperature, and the permafrost appeared to be in thermal equilibrium with thepresent-day climate, or actually aggrading at sites where the MAAT was between 0◦Cand 1.7◦C. In a more detailed study of a transect across two hills near Fairbanks,Alaska, Romanovsky et al. (2011) found a range of total annual thermal offset for2010–2011 ranging from −0.3 to 2.2◦C. Brouchkov et al. (2005) working in centralYakutia (MAAT c. −10◦C), found that the mean annual ground temperature was −3.0to −3.5◦C in larch forests, −2.2 to −2.7◦C in birch forests, amd −1.8 to −2.3◦C in dis-turbed areas. These results also suggest that there may be a reduction in the magnitudeof the annual thermal offset at the latitudes above the 60◦ parallel. Seasonal variabilitywill remain, but the long winter condition dominates the average. For comparisonwith these mean annual thermal offsets, those for the adjacent profiles in loessic soiland a block slope at the base of Plateau Mountain for 1995 were −0.8 and −4.5◦Crespectively at c. 5 cm depth (recalculated from Harris & Pedersen, 1998). There, theoffset became positive at greater depths in the loessic soil, but not in the block field,at least not in the upper 90 cm.
Hasler et al. (2015) found that topoclimatic factors strongly influence the thermaloffset over permafrost in the mountains of British Columbia. Excluding wetlands andpeatlands, the seven sites studied exhibited only small total offsets between the airand ground temperatures. However there was a 4◦C difference between steep northand south facing slopes on vertical rocks as opposed to a 1.5–3◦C difference on exposedgentle slopes with a similar aspect. Small macroclimatic differences were ascribed toeither differences in snow cover or variation in the magnitude of amplitude of the airtemperature. There was no discussion of the possible role of variations in precipitationwhich are highly variable in that Province.
Further complications take place if the environment is disturbed. Forest fires,logging, meandering of rivers, and other types of modification by humans will upsetthe balance, resulting in significant temperature changes that can cause thermokarstlandforms such as alas formation.
Forest fires are one of the triggers of thermal regime change and the formation ofthermokarst lakes and depressions, which develop in the continuous permafrost areaof Central Yakutia (Hinzman et al., 2001). These fires modify ground surface condi-tions, causing deepening of the active layer. Mackay (1977) demonstrated a deepeningof the active layer between 1968 and 1976 as a result of the Inuvik fire. The removalof the surface vegetation and organic layer by fire changes the energy budget of soilsignificantly. Even on the steppes of Mongolia, overgrazing can result in the develop-ment of thermokarst (Harris, 2002b), while the agricultural reforms on the TibetanPlateau after the Chinese started administering the area, resulted in the beginnings ofdesertification of vast areas, resulting in widespread permafrost degradation (Harris,2013a). Once started these processes are very difficult to stop, let alone reverse.
3.2.4 Relation to air masses
Permafrost distribution is closely related to the distribution of the Arctic and Antarcticair masses as well as the polar air masses. As indicated above, the subtropical air massesare critical in moving heat polewards to compensate for the imbalance in solar radiation

Dow
nloa
ded
By:
10.
3.98
.104
At:
14:3
1 12
Dec
202
1; F
or: 9
7813
1516
6988
, cha
pter
3, 1
0.43
24/9
7813
1516
6988
-4
Factors affecting permafrost distribution 97
Figure 3.8 The evolution of the Rossby Waves with time as they move east (stages A to E). The exactrate of movement, shape of the lobes and rate of change depends on the air pressuredifferences in the air masses. Cyclones and associated fronts are omitted to simplify thediagram.
at the higher latitudes, particularly in continental areas such as Antarctica, interiorCanada and Siberia. In the polar regions, the Arctic and Antarctic Polar air massesare very cold in winter, and the dense cold air spreads out towards the equator until itcollides with the subtropical air moving polewards or the maritime Temperate air massmoving eastwards on-shore from the two major oceans. Wherever the cold air massesgo for substantial periods in winter, permafrost and glaciers are commonly found.

Dow
nloa
ded
By:
10.
3.98
.104
At:
14:3
1 12
Dec
202
1; F
or: 9
7813
1516
6988
, cha
pter
3, 1
0.43
24/9
7813
1516
6988
-4
98 Geocryology
Figure 3.9 North-south section through the lower atmosphere showing the circulation of the airmasses under the climatic conditions occurring in 1980 A.D. (from Harris, 2010a).
The rotation of the Earth causes the air masses to move eastwards, with thepolar and arctic air masses rotating around the North Pole in a series of four waves(Figure 3.8), both at the surface and at the 500 mb level (the Rossby waves).Figure 3.9 shows a north-south section through the lower atmosphere showing the airmass movements currently occurring along the Eastern Cordillera of North America.The polar jet streams are normally found along the margins of the Rossby waves. Thewaves go through a cycle as they move (Figure 3.8), and the cyclical variations resultin there being a zone with alternating warmer and colder fluctuations through much ofthe winter months. This zone only exhibits sporadic permafrost at locations where themicroenvironment is particularly favorable for the development of permafrost. Lowelevational, latitudinal permafrost usually occurs on the poleward side of this zone,unless there are mitigating circumstances, e.g., a deep winter snow cover in Québec.A similar set of Rossby waves are found in the southern hemisphere, but are locatedprimarily over the ocean due to the strong Antarctic high pressure air mass. Thesewaves only affect the South Island of New Zealand, Tasmania, the West Antarcticarchipelago, and Patagonia.
The average position of the boundary between the warm air and the colder, densepolar air can vary over time, producing dramatic changes in MAAT along the bound-aries. Thus the average position moved north of Smithers and Fort Nelson (BritishColumbia) between 1982 and 1994, resulting in a change of MAAT of +5.23◦C in 14years, after which it stabilized (Harris, 2009, Figure 9). This was due to a strength-ening of the maritime Pacific air mass and the continental tropical air mass relativeto the continental polar air mass, resulting in the average position of the Arctic Frontmoving north past them.
Since the air masses can move freely towards areas of lower air pressure, they areconstantly fluctuating. These boundaries between air masses are also the locus of con-siderable precipitation. In summer, it falls as rain, but in winter, the associated fronts

Dow
nloa
ded
By:
10.
3.98
.104
At:
14:3
1 12
Dec
202
1; F
or: 9
7813
1516
6988
, cha
pter
3, 1
0.43
24/9
7813
1516
6988
-4
Factors affecting permafrost distribution 99
bring snowfall. The other major sources of precipitation are the maritime temperateair masses coming onshore from the North Pacific or Atlantic Oceans. These producemaritime permafrost conditions on the cold west coasts of Alaska, Greenland, Icelandand Scandinavia. As the moisture-laden air moves east, it causes orographic precip-itation on any mountain chains over which it must climb, e.g., the Alps, the RockyMountains, Caucasus, etc. This will be discussed below.
3.2.5 Precipitation
In most permafrost areas, at least half of the annual precipitation falls as snow, and itaccumulates as the snow pack. The snow pack offset is often regarded as the criticalone in areas with permafrost by modifying the radiation balance. Snow changes thealbedo of the ground surface, increasing its reflectivity to 0.7 to 0.85 compared with0.1 to 0.3 for the vegetation during summer. As a result, under a thin snow cover,the quantity of absorbed radiation is reduced, and a cooling effect of the snow occurs.A large portion of the incoming radiation that is absorbed is used in the reduction of thesnow pack through thawing or sublimation. On the other hand, a thick winter snowpack insulates the ground from heat loss into the atmosphere (Brown, 1966b; Mackay,1978; Nicholson, 1978). It only operates for the cold part of the year, whereas mostother thermal offsets affect the microenvironments on a given landscape throughout theyear. Mackay (1978) introduced the idea of using snow fences to modify the thicknessof the winter snow pack. He was able to demonstrate that cracking of the ground couldbe reduced or even halted by causing artificial accumulations of deep snow, resultingin an increase in the MAGT.
The snow influence as an insulator can be estimated as follows (Kudryavtsev et al.,1974):
�tsnow = �Asnow = Av2
(1 − e−zs
√CπλT
)(3.6)
where: �tsnow is the thermal offset of annual mean temperature due to the warminginfluence of the snow, ◦C; �Asnow is the decrease of the amplitude (physical) of theannual fluctuations of temperature under the snow in ◦C; Av is the meteorologicalamplitude of the annual fluctuations of the temperature of air, ◦C; zs is the depth ofsnow cover, m; C is the volumetric heat capacity of snow (J/m3 ∗ ◦C); λ is the thermalconductivity of snow, W/(m ∗ ◦C); T is the period, equal to the year, s.
Another formula for an estimate of the thermal offset – warming snow influence�tsnow taking into account the annual heat exchange of grounds with the atmospherewas proposed by S.N. Buldovich (2001):
�tsnow = Rsnow
T
√2λf�wQ (3.7)
where: Rsnow – the average thermal resistance of snow in winter; Q – the heat of phasetransitions in the ground; λf – the thermal conductivity of the frozen ground; �w – aparameter equal to |tw| ∗ τw, where tw – average winter temperature, τw – the durationof the winter.

Dow
nloa
ded
By:
10.
3.98
.104
At:
14:3
1 12
Dec
202
1; F
or: 9
7813
1516
6988
, cha
pter
3, 1
0.43
24/9
7813
1516
6988
-4
100 Geocryology
t1+ –t2 t1 t2
A1
A2
A3
0
Δξ
Δξ
Temperature
Seasonally thawedSeasonally frozenDepth
Figure 3.10 The effect of positive (warming) snow pack thermal offset on the depth of the active layer.�ξ: t – temperature,A – temperature amplitude, t1 – under snow, t2 – without snow.
Figure 3.11 Diagram showing the effect of various depths of snow cover on the underlying groundtemperatures.
The positive (warming) snow pack thermal offset of the MAAT affects seasonallyfrozen and seasonally thawed layers within the ground differently (Figure 3.10), thechange being greater in seasonally frozen horizons.
In areas where the snow-pack is thin (less than h1), the snow cools the soil(Figure 3.11) since its role as a reflector prevails, but reradiation continues. Snowis a cooling factor in this case. With an increase in snow depth from h1 to h2, itprevents excessive heat loss due to its insulating qualities.
Figure 3.12 shows the effect of the thickness of the snow pack on the mean winterground surface temperature at Plateau Mountain, Alberta (Harris & Brown, 1978).Fifty centimetres is the critical lower thickness of snow cover to prevent significantfreezing of the ground at an MAAT of about −2◦C and a MAFI of around 2,000 degreedays ◦C per year. The depth of snow required to have a similar effect in the Arctic Islandsof Canada is estimated to be 110 cm (Alan S. Judge, personal communication, 1981).The critical depth varies during the year as the snow pack metamorphoses, as well aswith the variations in MAAT and MAFI at a particular site. Thus Granberg (1973)found that 65–75 cm was the critical depth at Schefferville, Québec. It is the differencein the depth of snow cover that causes the considerable differences in permafrostdistribution on the two sides of Hudson Bay, Canada. Mackay (1978) used snowfences to reduce the cracking of the ground during winter on Garry Island, and thesame technique has subsequently been used elsewhere to reduce the winter coolingof the ground, or to prevent thermal contraction cracks breaking up the substrate.

Dow
nloa
ded
By:
10.
3.98
.104
At:
14:3
1 12
Dec
202
1; F
or: 9
7813
1516
6988
, cha
pter
3, 1
0.43
24/9
7813
1516
6988
-4
Factors affecting permafrost distribution 101
100
50
20
10
5
Mea
n w
inte
r sn
ow d
epth
(cm
)
Mean winter temperature at150 cm depth (°C)
3
2
1–1 –2 –3 –5 –7 –10
30
Figure 3.12 Effect of mean snow depth in winter on the ground temperature at 150 cm soil depth onPlateau Mountain (after Harris and Brown, 1978, Figure 9).
However, the formation of snow drifts or the piling up of snow around houses candestabilize the underlying permafrost (Chapter 13).
Duration of snow cover is also important since snow may persist for much of theperiod of the year when the insolation is at its maximum, thus reducing the amountof solar energy that can be used for thawing the active layer. Summer snow falls, suchas often occur on the Qinghai-Tibet Plateau, greatly reduce the effects of summerheating (French, 1970). The first autumn snowfall uses up much of the heat in coolingthe upper part of the active layer while adding a substantial quantity of water to thesurface layers of soil. This becomes ice as the surface temperature drops below 0◦C,but the ice increases the thermal conductivity of the now frozen surface layer, thusaiding the freezing process. During the winter, timing of arrival of the snow relativeto the cold temperatures, drifting of snow and variations in snow density due to windcan cause tremendous variations in ground temperatures over short distances (Brown,1972; Seppälä, 1982).

Dow
nloa
ded
By:
10.
3.98
.104
At:
14:3
1 12
Dec
202
1; F
or: 9
7813
1516
6988
, cha
pter
3, 1
0.43
24/9
7813
1516
6988
-4
102 Geocryology
While warming temperatures may result in earlier melting of the snow, this doesnot necessarily mean a longer growth period for plants. The changes in air temperatureon the Qinghai-Tibet Plateau during the last few decades have altered the phenologyof the forbs. Although the winter snow pack melts earlier, there is negligible changein the time available for plant growth (Yu et al., 2010). This has prompted varioustheories by biologists as to why this occurs (Chen et al., 2011), but it is almost cer-tainly due to increased accumulation of water in the form of ice in the soil duringthe winter. Lack of a vegetation cover increases soil cooling (Hu et al., 2008) andthe increased winter snowfall provides more water. This water moves to the coldestplaces in the soil, usually in the surface layer, and in spring, it has to be changed backfrom ice to water at 0◦C, thus requiring more solar heating before the ground warmsup sufficiently for the vegetation to start growing. Summer precipitation can have asignificant effect on the ground temperature, reaching up to 2–5◦C in areas with awarm and rainy summer. Kudryavtsev (1974) developed a formula based on the factthat the infiltrated water is cooled in the layer ξ to 0◦C, using the entire reserve ofheat to produce the phase transitions as well as an increase of the temperature of theground:
�toc = (Qpr ∗ ξ)(λg ∗ T), (3.8)
where: �toc – an increase in the average annual temperature on the bottom of the layerof the seasonal thawing (tξ) in comparison with the average annual temperature onthe ground surface (ts) due to the infiltration of atmospheric precipitation, ◦C; ξ – thedepth of the seasonal thawing, m; T – period of year, s; Qpr – heat of atmosphericprecipitation coming to the layer of the seasonal thawing ξ, J/m2; λg – effective thermalconductivity of the layer ξ, W/(m ∗ ◦C).
The amount of heat in the atmospheric precipitation coming to the layer of theseasonal thaw can be calculated as follows:
Qpr = Cw
∑Vpr,i ∗ tpr,i (3.9)
where: Vpr,i – the monthly (or decade) sum of summer atmospheric precipitation,kg/m2; tpr,i – the average monthly (or decade average) temperature of precipitation,approximately taken as the temperature of air (in the absence of data), ◦C; Cw – theheat capacity of water, J/(kg ∗ ◦C).
Supra-permafrost water in the active layer inevitably imparts instability to sedi-ments on slopes. The water perches on the frozen ground underneath and often causesslope instability on slopes. It also makes frost susceptible layers unstable resulting incryoturbation, etc.
The winter precipitation tends to accumulate as the snow pack. There are lossesinto the cold ground as well as into the atmosphere by sublimation, but a substantialaccumulation of snow is present in the spring. After deposition, the snow undergoesmetamorphism, whereby the crystals lose their hexagonal shape and increase in sizeand density. This is particularly marked at the base where the grains take on a sphericalshape, leaving large spaces under the main snow pack. It is this lack of contact withthe underlying ground that causes the collapse of the snow pack when walked on inspring, as well as a tendency to produce snow avalanches.

Dow
nloa
ded
By:
10.
3.98
.104
At:
14:3
1 12
Dec
202
1; F
or: 9
7813
1516
6988
, cha
pter
3, 1
0.43
24/9
7813
1516
6988
-4
Factors affecting permafrost distribution 103
3.2.6 Latitude and longitude
The position of the site on Earth is a major factor since the latitude determines therange of angles of incidence of the solar radiation at every location. While there is asimilar total annual potential radiation throughout the tropics, the potential amountdecreases towards thepoles. The length of daylight compensates for this between about54◦ and 60◦ latitude in summer, but reduces the incoming solar radiation in winter.The low angle of summer sun polewards of the Arctic and Antarctic circles is notadequately compensated for by the 24 hours of daylight, while at the winter solstice,24 hours of darkness prevails. This intensifies the cooling in winter, and reduces theeffectiveness of the low-angle sun in summer. Under conditions of equal MAAT, thepermafrost thickness appears to be thinner on the Qinghai-Tibet Plateau than at 70◦N,while ice wedge casts typically measure a maximum of about 2 m, compared with 4 malong the shores of northern Russia. The active layer also appears to be deeper. Thismay be due to the greater summer intensity of the solar radiation at lower latitudesdue to the greater angle of incidence of the solar rays.
There are a number of factors influencing the lower altitudinal limit of permafrost,so the variation of the lower limit with latitude is complex, but follows certain pat-terns. Other conditions being equal, the relationship between the lower altitudinallimit and latitude can be expressed by a Gaussian curve (Figure 3.13; see Cheng, 1983;Cheng & Wang, 1992; Corte, 1988). This curve resembles curves of latitude versus
Figure 3.13 The lower limit of permafrost in the Andes of the Southern Hemisphere (open circles)(Corte, 1988) compared with the average in the Northern Hemisphere (closed circles)(Cheng, 1983a).
Dow
nloa
ded
By:
10.
3.98
.104
At:
14:3
1 12
Dec
202
1; F
or: 9
7813
1516
6988
, cha
pter
3, 1
0.43
24/9
7813
1516
6988
-4
104 Geocryology
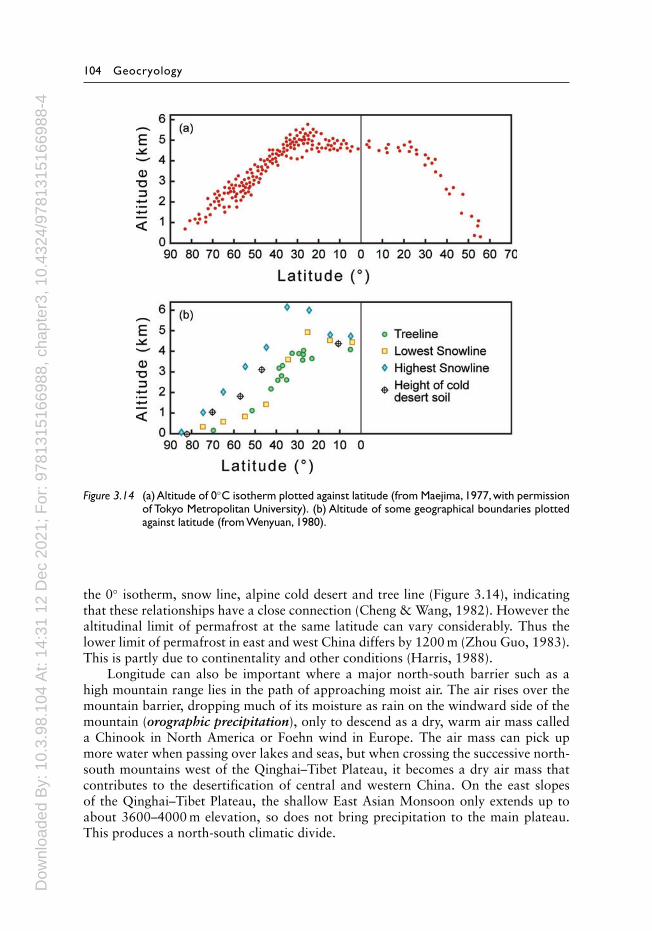
Figure 3.14 (a)Altitude of 0◦C isotherm plotted against latitude (from Maejima, 1977, with permissionof Tokyo Metropolitan University). (b) Altitude of some geographical boundaries plottedagainst latitude (from Wenyuan, 1980).
the 0◦ isotherm, snow line, alpine cold desert and tree line (Figure 3.14), indicatingthat these relationships have a close connection (Cheng & Wang, 1982). However thealtitudinal limit of permafrost at the same latitude can vary considerably. Thus thelower limit of permafrost in east and west China differs by 1200 m (Zhou Guo, 1983).This is partly due to continentality and other conditions (Harris, 1988).
Longitude can also be important where a major north-south barrier such as ahigh mountain range lies in the path of approaching moist air. The air rises over themountain barrier, dropping much of its moisture as rain on the windward side of themountain (orographic precipitation), only to descend as a dry, warm air mass calleda Chinook in North America or Foehn wind in Europe. The air mass can pick upmore water when passing over lakes and seas, but when crossing the successive north-south mountains west of the Qinghai–Tibet Plateau, it becomes a dry air mass thatcontributes to the desertification of central and western China. On the east slopesof the Qinghai–Tibet Plateau, the shallow East Asian Monsoon only extends up toabout 3600–4000 m elevation, so does not bring precipitation to the main plateau.This produces a north-south climatic divide.

Dow
nloa
ded
By:
10.
3.98
.104
At:
14:3
1 12
Dec
202
1; F
or: 9
7813
1516
6988
, cha
pter
3, 1
0.43
24/9
7813
1516
6988
-4
Factors affecting permafrost distribution 105
Figure 3.15 Comparison of A, the modelled temperature field for a north-south section of theMatterhorn showing present-day isotherms together with those projected for 2109 and2209 based on present rates of climate warming (modified from Noetzli & Gruber, 2009),and B, Plateau Mountain with its relict permafrost remaining from when it was a nunataksurrounded by glaciers during the Last Major Glaciation (15–25 ka) (modified from Harris &Prick, 1997).
3.2.7 Topography and altitude
Topography is very important (Figure 3.4). In areas with relatively low maximumangles of incidence of solar radiation, there is normally a different vegetation on thenorth-east facing slopes to that occurring on slopes facing south-west. Other thingsbeing equal, permafrost will be found further towards the equator on the north-eastfacing slopes. This is one of the causes of discontinuous, sporadic and isolated per-mafrost. Again, the position on a slope matters, with isolated patches of permafrostfirst appearing at the foot of slopes. Steep-sided mountains cast large shadows for aconsiderable part of the year, this becoming more important with increasing latitude(Figure 3.15 and 3.16). There are also sun traps and cold spots, and there is usuallyan inversion producing warmer winter air temperatures about 100 m above a col orsaddle in a Pass (Harris and Brown, 1982). Topography also causes local modifications

Dow
nloa
ded
By:
10.
3.98
.104
At:
14:3
1 12
Dec
202
1; F
or: 9
7813
1516
6988
, cha
pter
3, 1
0.43
24/9
7813
1516
6988
-4
106 Geocryology
Figure 3.16 Section north-south across Alaska showing the position and thickness of permafrost toscale. Note the influence of aspect on the distribution of permafrost.
of the vegetation, winter snow cover and hydrology, which affect the distribution oftaliks and the thickness of the active layer. Even in areas of continuous permafrost,the permafrost forms an outer cold layer in the upper part of the ground that tends tofollow the contours (Figure 3.14a), though modified by aspect and by the hydrology ofthe area. In contrast, the base of relict permafrost in former nunataks tends to parallelthe former limit of the ice sheet, being nearly horizontal on Plateau Mountain in spiteof the topography (Figure 3.14b).
Air masses have a specific upper limit. Thus the Indian Monsoon is only about5000–6000 m. high, so it cannot readily cross the Himalayas at the present time tobring appreciable moisture to the Qinghai-Tibet Plateau. Likewise, the East AsianMonsoon is only about 4000–4500 m high, so it does not bring large quantities ofprecipitation to the northeastern slopes of the Qinghai-Tibet Plateau (Harris & Jin,2012). Some of the deeper permafrost on mountains such as along the Tanggula Range(5000 > 6000 m) is relict.
Altitude affects the distribution of permafrost because the air becomes colder withincreasing altitude. The rate of change is called the lapse rate, and the average near-surface lapse rate is approximately minus 1.6◦C/100 m rise in altitude. However, thisis very variable and is particularly dependent on air mass distribution, time of day,season of the year, and ground cover (vegetation, cultivation, urban landscape, snowcover). The cold Mongolia-Siberian high pressure air mass is only about 4000 m thick

Dow
nloa
ded
By:
10.
3.98
.104
At:
14:3
1 12
Dec
202
1; F
or: 9
7813
1516
6988
, cha
pter
3, 1
0.43
24/9
7813
1516
6988
-4
Factors affecting permafrost distribution 107
Figure 3.17 Anatomy of the cold air drainage west of Fort Nelson, British Columbia on January 7th,1982, showing the uncorrected temperature distribution (modified from Harris, 1982,Figure 1). The coldest corrected temperature was −64◦C.
on the northern flanks of the Plateau, so that the main portion of the Plateau abovethis altitude is affected by the local lapse rate in winter, and above 4500 m in summer.
Where there is warm air aloft, it will actually get warmer with altitude until thewarmer air mass is reached, whereupon the lapse rate will become negative. Lowertemperatures at higher altitudes are the cause of the southward extension of permafrostalong the Eastern Cordillera of North America (Harris, 1986b), as well as the occur-rence of permafrost on the Qinghai-Tibet Plateau. In extensive mountain ranges withenclosed deep valleys, cold air drainage may occur (see below).
3.2.8 Cold air drainage
In valleys and basins in large areas of mountainous terrain, the climate may be modifiedin winter by cold air drainage. When the sky is clear and there is negligible wind, thereis very high reradiation of heat back into the atmosphere at night. Where there aredifferences in vegetation with altitude, differential heat loss by reradiation results insevere cooling of the tundra and the adjacent air, which becomes increasingly dense,compared with the forested slopes at lower elevations. When the difference in density ofthe air becomes high enough to overcome the resistance of the roughness of the terrain,the colder air moves downslope, displacing the less dense warmer air in the depressions(Figure 3.17, after Harris, 1983b). Once there, it is not readily removed. The cold aircan remain in the lowland for up to a week, and warmer air simply rides over the top.The average number of events for the cold air drainage at Fox Lake, Yukon Territory,between 1987 and 1996 inclusive was 6.5 events per year. The exact threshold depends

Dow
nloa
ded
By:
10.
3.98
.104
At:
14:3
1 12
Dec
202
1; F
or: 9
7813
1516
6988
, cha
pter
3, 1
0.43
24/9
7813
1516
6988
-4
108 Geocryology
Figure 3.18 The temperature of the still cP air mass plotted against presence or absence of cold airdrainage at Fox Lake,YukonTerritory for the winters of 1987–1996 (translated from Harris,2007). The black circles correspond to data from cold air drainage events.
on the terrain and the temperature of the air mass, but in the Yukon River valley, ittends to occur when the ground surface temperature of the main air mass falls below−16◦C (Figure 3.18, after Harris, 2006, 2007, 2010c). The cold air drainage causes atemperature inversion that shows in the MAAT at different elevations on a mountainside, e.g., at Snag and Mayo, Yukon Territory, and again in the large mountain rangesof Siberia. The cold weather in the valleys results in the development of permafrost inareas with discontinuous or sporadic permafrost. MAGST in the valley is lower thanon the mountainside above.
3.2.9 Buffering of temperatures against changein mountain ranges
One of the characteristics of these deep valleys in large areas of mountains in con-tinental situations is that the MAAT in the valleys resists the climate changes beingrecorded in the surrounding lowlands (Harris, 2006, 2007, 2010c). It does not occuron the flanks of the mountains, nor in the lowlands subject to the influence of theocean currents. In the case of the mountain valleys of central and southern Yukon andAlaska, this appears to be due to the combined effects of cold air drainage, inversionsand steam fog (Harris, 2006, 2007). If the regional air warms up, and the warm airover-rides the cold air trapped in the mountain valleys, a thicker cloud layer devel-ops at the inversion, thus producing decreased insolation at the ground surface. Thiscounteracts the effect of the regional warming. The cold air drainage requires a certain

Dow
nloa
ded
By:
10.
3.98
.104
At:
14:3
1 12
Dec
202
1; F
or: 9
7813
1516
6988
, cha
pter
3, 1
0.43
24/9
7813
1516
6988
-4
Factors affecting permafrost distribution 109
minimum temperature to be exceeded at a given site for it to occur (Figure 3.18). Sincea 2◦C warming does not appreciably alter the period in winter when it is colder thanthis threshold, cold air drainage remains a major factor maintaining permafrost stabil-ity. In addition, most mountain valleys have extensive lakes and fens. When colder airoverlies the open water in the early Fall, steam fog develops, cutting down on the inso-lation reaching the ground surface until the water becomes completely frozen over inearly December. By then the incoming radiation at these northern latitudes is minimal.Regional warming causes the air to contain more moisture, which has the feedbackeffect of increasing the thickness and duration of the steam fog, These three processescan only occur in depressions in the mountains, and this buffering may explain whyareas such as the mountains of Beringia and eastern Siberia had a decrease in MAATof only 9–10◦C during the last major glaciations, while western Europe endured adecrease of at least 19◦C (Washburn, 1979; Isarin, 1997) Thus these buffered areaswere very important refugia during glaciations.
3.3 TERRAIN FACTORS
3.3.1 Vegetation
The vegetation cover has an enormous effect on the microclimate in the forested areasunderlain by permafrost, but this effect decreases towards the poles as the vegetationbecomes more stunted, and is replaced by tundra plants (Brown, 1963, 1970, 1972). Inboth the Arctic and Antarctic, there are also polar deserts where even isolated cushionplants do not live. However, there are some lichens that can survive on rock. Removalof vegetation has an enormous effect (Moskalenko, 1998).
The most obvious effect of a continuous vegetation cover is in reducing the depth ofthaw of the active layer by shielding the ground from insolation (Brown and Johnson,1964; Lindsay and Odynsky, 1965; Jeffrey, 1967; Price, 1971). If moss is present, itgreatly reduces the thickness of the active layer in a manner similar to peat (Greene,1983; Harris, 1979b), i.e., it acts as a thermal diode, as can a thick litter layer. Theeffect occurs throughout the year, and can result in a reduction of MASG of 2–4◦Ccompared with soils without a moss cover (Kudryavtsev et al., 1974).
Trees and dense thickets of shrubs shade the ground from insolation in summerand act as radiators of heat in winter. The reduction in solar radiation reaching theground may be as high as 70% in a closed canopy forest in summer. Combined with theheat-moisture transfer in plant cover, the evaporation from the soil may be decreasedseveral times compared to open sites. Turbulent heat exchange is always less in forestssince the wind speed is reduced to 8–10% of that in open areas. In the Russian taiga,maximum cooling is seen in fir and pine forests, with a reduction of 0.5–2◦C comparedwith open sites.
In the forest-tundra transition, the shrubs in the northern taiga of Western Siberia,the reduction in solar radiation is offset by the decrease in turbulent heat exchange.However, the much higher snow accumulation due to intercepting blowing snow causesbetter insulation of the underlying ground from the winter cold than in open areaswhich have a snow deficit. This results in a higher MAGT. The snow density is also5–10% less in the bushes (Pavlov & Dubrovin, 1979).

Dow
nloa
ded
By:
10.
3.98
.104
At:
14:3
1 12
Dec
202
1; F
or: 9
7813
1516
6988
, cha
pter
3, 1
0.43
24/9
7813
1516
6988
-4
110 Geocryology
Conifers intercept some of the snow, producing a low area with thin or negli-gible snow pack around their base, so altering the local heat exchange significantly(Viereck, 1975). In the dense, dark coniferous forests of Southern Siberia, there is agreat reduction in snow cover, resulting in greater cooling of the ground. Deciduoustrees only provide shade in summer, whereas conifers produce significantly differentmicroclimates in winter, e.g., the air temperatures beneath conifers in winter in theRocky Mountains of southwestern Canada average 1◦C higher than in neighboringecosystems (Harris, 1976).
Beneath the canopy of the old growth Western Red Cedar forest east of Revel-stoke, British Columbia, there is an air temperature of around 15–20◦C when the airtemperature in the adjacent more open second growth forest is over 30◦C in summer.The air in the old forest is very humid so that ferns and mosses are abundant in theshade, whereas in the second growth forest, the air has a relative humidity of lessthan 60%. All trees modify wind velocities at the ground surface, thus reducing heattransfer. The ground under the trees tends to hold more moisture in summer than thesoils under the more open grassland vegetation. All trees contribute litter to the groundsurface, and since the rate of decay of vegetation is slow in the short summer season inareas with permafrost, there is usually a significant organic layer present. This tendsto cause a weak thermal diode effect, so patches of permafrost may be present in themoist forested areas at the foot of slopes, e.g., the northern slopes of the Tian Shanof China and in Switzerland. Williams & van Everdingen (1973) reported air temper-atures several degrees colder in peatlands with stunted Black Spruce trees than in thesurrounding vegetation types in northern Canada.
Removal or disturbance of the surface vegetation cover usually causes degradationof the underlying permafrost (Mackay, 1970), unless moss and/or peat are left pro-tecting the ground (Linell & Johnston, 1973). Types of disturbance include grazing,fire, logging, cultivation of hay, or engineering constructions of all kinds. Seral evolu-tion of the vegetation results in changes in the thermal regime resulting in growth ordecay of permafrost. Thus the colonization by vegetation of sandy bars along rivers isusually accompanied by increasing development of permafrost, e.g., on the MackenzieDelta (Smith, 1975), but in Interior Alaska, permafrost is more widespread in theearly successional stages of willow and Balsam Poplar (Viereck, 1970; Péwé, 1970;Van Cleve & Viereck, 1983). On lithalsa mounds at Fox Lake, Yukon Territory, theactive layer was thinnest under willows and mature spruce forest (Harris, 1993), whileBlok et al. (2010) have postulated that the expansion of shrubs in some Arctic regions(Sturm et al., 2001; Tape et al., 2006) may at least partly counteract the warming thatcauses the vegetation change (Lawrence & Swenson, 2011) by becoming a carbon sink.
On the microscale, the species of vascular and nonvascular plants present on thesurface of the ground each produce different thermal effects on the organic soil under-neath them at latitudes 61–64◦N in the southern Yukon Territory (Harris, 1998b).Net radiation on bright sunny days in August represents 25% of the potential radi-ation. However, in the shade, net radiation is negative, even at 1400 hours. Heatflux into the substrate beneath different vegetation covers showed marked differences,depending on the plant species and vegetation structure. Single vegetation canopies ormats showed the least negative values and the highest diurnal amplitudes. Values weremore negative beneath multiple canopies and exhibited the lowest diurnal ranges ofheat flux. Sites in the shade of trees exhibited a negative net heat flux, even though
Dow
nloa
ded
By:
10.
3.98
.104
At:
14:3
1 12
Dec
202
1; F
or: 9
7813
1516
6988
, cha
pter
3, 1
0.43
24/9
7813
1516
6988
-4
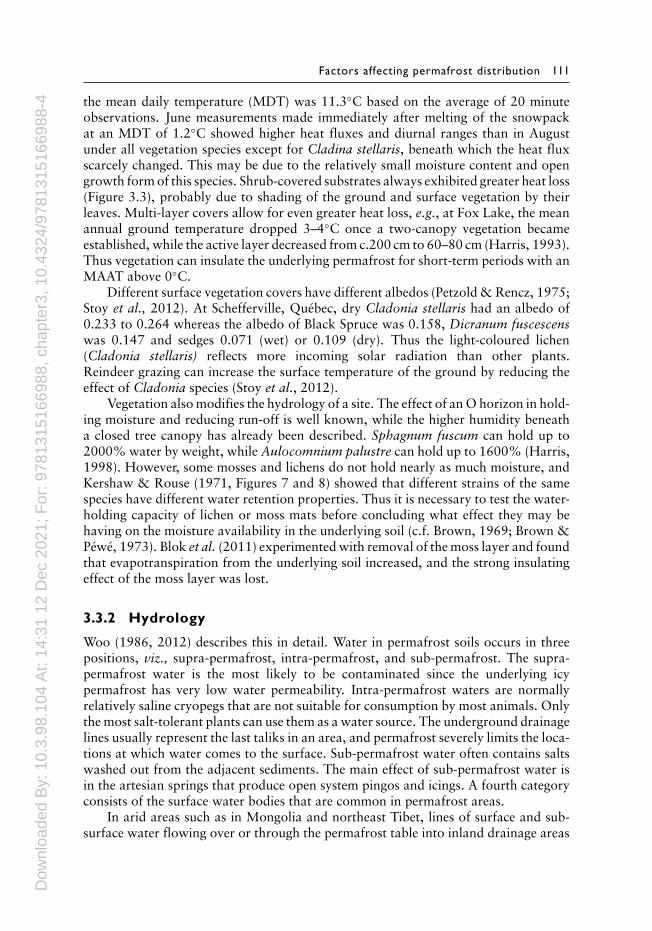
Factors affecting permafrost distribution 111
the mean daily temperature (MDT) was 11.3◦C based on the average of 20 minuteobservations. June measurements made immediately after melting of the snowpackat an MDT of 1.2◦C showed higher heat fluxes and diurnal ranges than in Augustunder all vegetation species except for Cladina stellaris, beneath which the heat fluxscarcely changed. This may be due to the relatively small moisture content and opengrowth form of this species. Shrub-covered substrates always exhibited greater heat loss(Figure 3.3), probably due to shading of the ground and surface vegetation by theirleaves. Multi-layer covers allow for even greater heat loss, e.g., at Fox Lake, the meanannual ground temperature dropped 3–4◦C once a two-canopy vegetation becameestablished, while the active layer decreased from c.200 cm to 60–80 cm (Harris, 1993).Thus vegetation can insulate the underlying permafrost for short-term periods with anMAAT above 0◦C.
Different surface vegetation covers have different albedos (Petzold & Rencz, 1975;Stoy et al., 2012). At Schefferville, Québec, dry Cladonia stellaris had an albedo of0.233 to 0.264 whereas the albedo of Black Spruce was 0.158, Dicranum fuscescenswas 0.147 and sedges 0.071 (wet) or 0.109 (dry). Thus the light-coloured lichen(Cladonia stellaris) reflects more incoming solar radiation than other plants.Reindeer grazing can increase the surface temperature of the ground by reducing theeffect of Cladonia species (Stoy et al., 2012).
Vegetation also modifies the hydrology of a site. The effect of an O horizon in hold-ing moisture and reducing run-off is well known, while the higher humidity beneatha closed tree canopy has already been described. Sphagnum fuscum can hold up to2000% water by weight, while Aulocomnium palustre can hold up to 1600% (Harris,1998). However, some mosses and lichens do not hold nearly as much moisture, andKershaw & Rouse (1971, Figures 7 and 8) showed that different strains of the samespecies have different water retention properties. Thus it is necessary to test the water-holding capacity of lichen or moss mats before concluding what effect they may behaving on the moisture availability in the underlying soil (c.f. Brown, 1969; Brown &Péwé, 1973). Blok et al. (2011) experimented with removal of the moss layer and foundthat evapotranspiration from the underlying soil increased, and the strong insulatingeffect of the moss layer was lost.
3.3.2 Hydrology
Woo (1986, 2012) describes this in detail. Water in permafrost soils occurs in threepositions, viz., supra-permafrost, intra-permafrost, and sub-permafrost. The supra-permafrost water is the most likely to be contaminated since the underlying icypermafrost has very low water permeability. Intra-permafrost waters are normallyrelatively saline cryopegs that are not suitable for consumption by most animals. Onlythe most salt-tolerant plants can use them as a water source. The underground drainagelines usually represent the last taliks in an area, and permafrost severely limits the loca-tions at which water comes to the surface. Sub-permafrost water often contains saltswashed out from the adjacent sediments. The main effect of sub-permafrost water isin the artesian springs that produce open system pingos and icings. A fourth categoryconsists of the surface water bodies that are common in permafrost areas.
In arid areas such as in Mongolia and northeast Tibet, lines of surface and sub-surface water flowing over or through the permafrost table into inland drainage areas

Dow
nloa
ded
By:
10.
3.98
.104
At:
14:3
1 12
Dec
202
1; F
or: 9
7813
1516
6988
, cha
pter
3, 1
0.43
24/9
7813
1516
6988
-4
112 Geocryology
can create pingos (see Figure 1.19) and icings along their path (Kowalkowski, 1978;Froehlich & Slupik, 1978). In wetter areas, they tend to produce seasonal frost blisters.These lines have been called water tracks in Antarctica (Levy et al., 2011), and consistof zones of high soil moisture which represent a route that ground water takes tomove downslope. Water content of the soil and its form have a considerable effect onthe thickness of the active layer. The thermal conductivity of ice is greater than thatof soil, and changing ice back to water takes considerable input of energy before theground can warm up. A similar removal of energy is required during freezing in thefall. Increased soil moisture results in a reduction in the depth of seasonal freezingand thawing. This is connected to the thermal offset, which is determined by the ratioof the coefficients of the thermal conductivity of frozen and thawed ground, and alsoby the value of annual heat exchange in the ground. The value of it ranges between0.5◦C and 1.5◦C (Kudryavtsev et al., 1974). If the thermal conductivity of the groundin the thawed state of λuf differs from the thermal conductivity of the ground in thefrozen state of λf , then the average annual temperature of the ground changes withdepth in the active layer, reaching a maximum at the bottom.
Where thermokarst mounds have developed, water flows through the active layer,down slope over the surface of the permafrost table. This water is generated fromthe snow pack, melting pore ice at the ice table beneath the water tracks, and thaw-ing buried segregation ice formed during winter freeze-up. The water is enriched insolutes derived from chemical weathering of sediments as well as the dissolution ofsalts contained in the soil. Salt content is about four times that in normal runoff, andthe quantity of water transported in this way is about twice as fast as in the adjacentwet soil. These intra-soil flows of water represent salt superhighways, redistributingwater, energy and nutrients in the cold deserts of the Antarctic. The water ends upin lakes that are frozen over. Similar natural flow paths for water in the active layerhave been identified along the Alaska Highway near Beaver Creek (de Grandpré et al.,2010), where they create subsidence problems by degrading the permafrost beneaththe Alaska Highway.
The effects of liquid surface water are seen in the more humid areas. Liquid wateris a source of heat, and is an effective thawing and erosive agent, e.g., Ling et al.(2012), especially when moving past ice-rich ground (Mackay & Black, 1973). Thisis particularly well demonstrated after fire or any other interference with the naturalvegetation. Thus alteration of the water table by placing a culvert too low can producespectacular results in areas with ice- wedge polygons (Figure 3.19). Conversely, the verydry air and strong winds on the Qinghai-Tibet Plateau result in extreme evaporationand cooling of the soil on valley floors with a high water table, which can result indevelopment of permafrost. The thermal properties of water and ice mean that moistor wet ground has a much shallower active layer than dry ground under otherwisesimilar environmental conditions. Ice is the major constituent causing the formationof most of the characteristic, unique landforms found in permafrost regions, e.g., rockglaciers and peat mounds. As a result, different landforms are found in dry permafrostareas to those found in poorly drained areas.
When the temperatures rise in the spring, the temperatures in the snow packbecome isothermal at 0◦C. As the snow slowly changes to water, the latter moves tothe bottom of the snow pack, where it commences to flow down any available slope.The water-logged zone may be up to 40 cm deep and can have considerable erosive

Dow
nloa
ded
By:
10.
3.98
.104
At:
14:3
1 12
Dec
202
1; F
or: 9
7813
1516
6988
, cha
pter
3, 1
0.43
24/9
7813
1516
6988
-4
Factors affecting permafrost distribution 113
Figure 3.19 Results of placing a road culvert too low in an area of ice-wedges along the DempsterHighway, Yukon Territory, after one year. The hydrological disturbance decreases withdistance from the culvert. © S. A. Harris.
power, even on gentle slopes. Harris (1998c) described low mounds from the roadin the North Fork Pass along the Dempster Highway, which had the normal maturetundra vegetation on the top of the mound but a modified vegetation on the sandysoils in the shallow depressions. The sand consisted of the remains of the sedimenteroded from the underlying sediment by the sub-snowpack flow of water in the springthat had eroded the channels. Where the melt-water moves downslope on the surfaceof the ground in mountains, it warms in the sun and then sinks into the ground, sotransporting extra heat into the active layer. In sediments, this tends to deepen theunderlying active layer at that location, and can actually thaw a temporary verticalchannel through the permafrost (Harris, 1999). The warmer water then drains into theunfrozen zone under the permafrost and the channel quickly refreezes (Figure 3.20).
Dow
nloa
ded
By:
10.
3.98
.104
At:
14:3
1 12
Dec
202
1; F
or: 9
7813
1516
6988
, cha
pter
3, 1
0.43
24/9
7813
1516
6988
-4
114 Geocryology
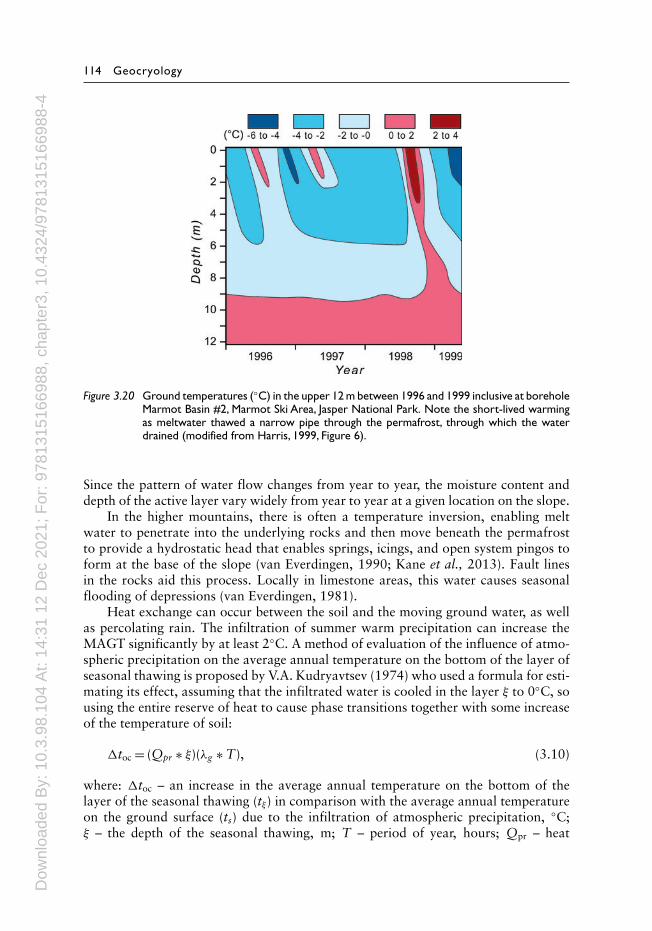
Figure 3.20 Ground temperatures (◦C) in the upper 12 m between 1996 and 1999 inclusive at boreholeMarmot Basin #2, Marmot Ski Area, Jasper National Park. Note the short-lived warmingas meltwater thawed a narrow pipe through the permafrost, through which the waterdrained (modified from Harris, 1999, Figure 6).
Since the pattern of water flow changes from year to year, the moisture content anddepth of the active layer vary widely from year to year at a given location on the slope.
In the higher mountains, there is often a temperature inversion, enabling meltwater to penetrate into the underlying rocks and then move beneath the permafrostto provide a hydrostatic head that enables springs, icings, and open system pingos toform at the base of the slope (van Everdingen, 1990; Kane et al., 2013). Fault linesin the rocks aid this process. Locally in limestone areas, this water causes seasonalflooding of depressions (van Everdingen, 1981).
Heat exchange can occur between the soil and the moving ground water, as wellas percolating rain. The infiltration of summer warm precipitation can increase theMAGT significantly by at least 2◦C. A method of evaluation of the influence of atmo-spheric precipitation on the average annual temperature on the bottom of the layer ofseasonal thawing is proposed by V.A. Kudryavtsev (1974) who used a formula for esti-mating its effect, assuming that the infiltrated water is cooled in the layer ξ to 0◦C, sousing the entire reserve of heat to cause phase transitions together with some increaseof the temperature of soil:
�toc = (Qpr ∗ ξ)(λg ∗ T), (3.10)
where: �toc – an increase in the average annual temperature on the bottom of thelayer of the seasonal thawing (tξ) in comparison with the average annual temperatureon the ground surface (ts) due to the infiltration of atmospheric precipitation, ◦C;ξ – the depth of the seasonal thawing, m; T – period of year, hours; Qpr – heat

Dow
nloa
ded
By:
10.
3.98
.104
At:
14:3
1 12
Dec
202
1; F
or: 9
7813
1516
6988
, cha
pter
3, 1
0.43
24/9
7813
1516
6988
-4
Factors affecting permafrost distribution 115
of atmospheric precipitation coming to the layer of the seasonal thawing ξ, J/m2;λg – effective thermal conductivity of the layer ξ, W/(m ∗ ◦C). The amount of heatcontributed by atmospheric precipitation affecting the layer of the seasonal thawingQpr can be calculated by:
Qpr = Cw
∑Vpr,i ∗ tpr,i (3.11)
where: Vpr,i – the monthly (or decade) sum of summer atmospheric precipitation,kg/m2; tpr,i – the average monthly (or decade average) temperature of precipitation,approximately taken as the temperature of air (in the absence of data), ◦C; Cw – theheat capacity of water, J/(kg ∗ ◦C).
3.3.3 Lakes and water bodies
Aqueous covers have a strong influence on the ground temperature beneath them.Where lakes and rivers do not freeze to the bottom in winter, a talik will be present.Large, shallow water bodies, thinner winter ice and deep winter snow packs resultin a large talik (Feulner & Williams, 1967), as do dark-coloured bottom sediments(Brown & Péwé, 1973). Where the lake is sufficiently shallow to freeze to the bottomin winter, there will be permafrost beneath the lake. Even so, lakes and rivers can causethawing of the surrounding sediments which can result in enlargement of the waterbody in ice-rich sediments, e.g., during the formation of alas valleys in Siberia. Michel(1971) provides diagrams of the temperature regimes of deep (>10 m) and shallowfreshwater lakes (Figure 3.21), based on studies of North American lakes. It assumesthat there are no underground springs present, so the thermal stratification is closelyrelated to depth. Note the effect of the change in density at 4◦C. The energy budget andresultant temperature offset at the surface of lake ice in winter are shown in Figure 3.22(from Liston & Hall, 1995). There are thermal offsets at both surfaces of the snowcover and at the base of the lake ice. Kudryavtsev (1954) used a different diagram andformula for calculating the temperatures below small lakes that freeze to the bottomin winter (see Figure 3.23):
tH = 0.5 ∗[(
1 − HHi
)∗ tmin + tmax
](3.12)
where: H – depth from the surface of the reservoir, m; Hi – the maximum for thisregion thickness of ice, m; tH – annual mean temperature at the depth of H, ◦C; tmin &tmax – respectively minimum average monthly temperature on the surface of ice underthe snow and the maximum average monthly temperature of the water, ◦C.
In deeper lakes and reservoirs, the effect of the water depends on its depth, its gen-esis, lifetime, size, and on the hydrodynamics of underground waters. Heat exchangeat the surface, convective heat transfer due to local heating or wind-induced turbu-lence, and the presence of seasonal ice all affect the result. In deep reservoirs where thelower layers are not affected by convection (i.e., generally deeper than 10–15m), theheat exchange is less important than the annual turnover of the dense 4◦C water in theautumn. Input from underground streams can complicate the situation. In general, thelakes tend to thaw the surrounding permafrost (see Figure 2.12, after Ling et al., 2012).

Dow
nloa
ded
By:
10.
3.98
.104
At:
14:3
1 12
Dec
202
1; F
or: 9
7813
1516
6988
, cha
pter
3, 1
0.43
24/9
7813
1516
6988
-4
116 Geocryology
0°C 4°C A
0°C 4°C A
0°C 4°C A
AY
Y
Y
Temperature
Epilimnion
MetalimnionThermocline
Thermocline
(a) First order lake (very deep)
(b) Second order lake (deep)
(c) Third order lake (shallow)
2
13
2
13
A
213
A
Hypolimnion
Figure 3.21 Temperature regimes in cold, freshwater lakes of different depths in North America (fromMichel, 1971, Figure 30). 1 shows the isothermal condition in fall, 2 the water temperaturesin summer, and 3 the winter conditions.
The depth where the average annual temperature is 0◦C is called the critical depthof lake Hcr:
Hkr = Hi
(1 + tmax
tmin
)(3.13)
If the depth of lake is less than Hkr, then permafrost exists under the lake. If Hexceeds Hkr then average annual temperature will have positive value. In the intervalof depths from Hkr to H bottom deposits will seasonally freeze (Kudryavtsev et al.,1974).

Dow
nloa
ded
By:
10.
3.98
.104
At:
14:3
1 12
Dec
202
1; F
or: 9
7813
1516
6988
, cha
pter
3, 1
0.43
24/9
7813
1516
6988
-4
Factors affecting permafrost distribution 117
Figure 3.22 Energy budget and thermal offsets where lake ice occurs (modified from Liston & Hall,1995).
Figure 3.23 The influence of small lakes on the ground temperature (Dostovalov & Kudryatsev, 1967).
3.3.4 Nature of the soil and rock
There can be tremendous variation in the thermal properties of soil, rock or snow,resulting in considerable variation in permafrost distribution. Permafrost first developsbeneath or within blocks of rock or peat due to the thermal diode effect. Dark coloursabsorb more incoming insolation. Reflectivity may be 90% for snow, 12–15% forrock and 15–40% for bare soil (Brown & Péwé, 1973; Brown, 1973a). This explainswhy there is a substantial change in rate of warming under a given amount of net

Dow
nloa
ded
By:
10.
3.98
.104
At:
14:3
1 12
Dec
202
1; F
or: 9
7813
1516
6988
, cha
pter
3, 1
0.43
24/9
7813
1516
6988
-4
118 Geocryology
insolation once the snow has thawed. In addition, water, ice and snow are translucentwhereas soil and rock are not. Incoming radiation heats a thickness of these forms ofwater instead of merely the surface, hence the more effective heat absorbtion of watercompared with soil (Pavlov, 1999; Harris, 2002a).
Moisture content affects the amount of heat used for evaporation, while the natureof the material determines its ability to store water. The water content greatly modifiesthe freezing rate for a given substrate and the nature of the freezing and thawingprocesses.
Since geothermal heat flow at a given site is fairly constant, the thermal conduc-tivity of the substrate determines the thickness of permafrost and the overlying activelayer if other conditions are equal (Day & Rice, 1964; Tedrow, 1966; Brown, 1973b).In massive rock, the thermal conductivity is very much greater than in sediments. Inthe latter, heat is conducted from grain to grain through the points of contact unlessthe grains are cemented together by ice. On Devon Island, Peters & White (1971, inBrown & Péwé, (1973, p. 790) reported active layer thicknesses of 70 cm on StoneyArctic Brown Soils on beach ridges, 47 cm on Regosols, 34 cm in Arctic Brown soils,24 cm in Gleysols, and 13 cm in peat.
3.3.5 Fire
Many natural fires are started each year within the permafrost areas of the Northernhemisphere, especially in the forested zones (Sykes, 1971; Viereck, 1973). Frequencyof dry lightning strikes can be as frequent as once every 90–120 years along the eastslopes of the Rocky Mountains in Alberta (Masters, 1990; Johnson & Larsen, 1991),and most of the zone of discontinuous permafrost has been burned at least once dur-ing the last 10,000 years. There is a great decrease in fire frequency north of theYukon River in western Yukon Territory. Greatest fire frequency was probably duringthe Altithermal/Hypsithermal warm period about 6,000 years B.P. Fire frequency hasalmost certainly increased with the expansion of Human settlement into the region.The development of increasing MAAT in significantly large areas of continental per-mafrost is expected to increase the fire frequency, as well as lead to a change in both theweather and vegetation in directions that will favour increasing large-scale forest fires(Tchebakova et al., 2009). Fire can smolder for months in the spruce-lichen transi-tion woodlands of the forest-tundra transition zone in Ontario and Québec (Rouse &Kershaw, 1971), but in the wet tundra, there is less woody fuel available and the effectsare greatly reduced (Wein, 1976; Johnson & Viereck, 1983).
There are two kinds of forest fires, viz., crown fires and ground fires. The fastmoving crown fires burn the trees over wet ground, but only the surface vegetation isremoved, so that the peat plateaus and palsas survive. Thus in the Hudson Bay Low-land, only the top 2.5 cm of the vegetation mat is affected by fires and the underlyingpeat protects the icy permafrost (Brown, 1965; 1968).
In a study of 11 boreal forest fires in Interior Alaska, Yoshikawa et al. (2003) foundthat heat transfer to the permafrost by conduction during the fire was not significant.However, immediately following the fire, the ground thermal conductivity may increaseby one order of magnitude and the surface albedo may decrease by 50% in cases ofsubstantial burning of organic matter. The thickness of the remaining organic layerdetermines the effects of the fire. If most of the organic mat remains, or its remaining

Dow
nloa
ded
By:
10.
3.98
.104
At:
14:3
1 12
Dec
202
1; F
or: 9
7813
1516
6988
, cha
pter
3, 1
0.43
24/9
7813
1516
6988
-4
Factors affecting permafrost distribution 119
thickness is greater than 7–12 cm, there is little change in active layer thickness in spiteof the change in albedo. Any significant change in the thickness of the organic layerincreases downward heat flow resulting in an increase of the thickness of the activelayer. After 3–5 years, the active layer will become so deep (up to 4.15 m) that theseasonal refreezing does not reach the base of the previous year’s active layer and atalik develops above the permafrost. The return time of fire in the boreal forest inInterior Alaska is about 29–300 years (Yarie, 1981; Dyrness et al., 1986; Kasischkeet al., 2000) and is probably decreasing.
Swanson (1996) found that the coldest and wettest parts of the landscape in inte-rior Alaska (concave to plane, lower slope positions, and north-facing slopes) usuallyfailed to thaw deeply after fires. In contrast, soils with permafrost on warmer anddrier positions (convexities, crests and shoulders, and east-, west- and south-facingmidslopes) thawed deeply if subjected to severe ground fires. Dry soils on gravel andsand do not redevelop permafrost under the present climate, and these provide lesscover for voles or forage for moose.
Where conditions are dry at the time of the fire, e.g., at Inuvik on 11th August,1968, the vegetation and litter is completely burned, leaving blackened soil at thesurface. Ice-rich frozen ground then thaws, resulting in surface meltwater and con-siderable thermal erosion before freeze-up in mid-September. Fire-breaks bulldozed tothe permafrost table to control the spread of the fire suffer even greater thermal ero-sion. Subsequent studies showed that the greatest increase in depth of thaw occurredalong the fire-breaks and continued deepening for years, in spite of the regeneration ofthe shrub vegetation (Heginbottom, 1971; 1973; Mackay, 1977). Similar effects werereported by Viereck (1982) from Alaska.
Smith et al. (2015) examined the effects of fire in 1985 further south in the centralMackenzie River valley. The intensity of the burn and removal of the vegetation wasgreater in the upper part of the sloping hillsides than in the valley bottoms, resultingin greater damage to the active layer. The removal of trees resulted in greater wintersnow depths, as well as decreasing albedos in summer. The active layer doubled inthickness within three years, after which it stabilized. Active layer temperatures at thetop of the slope started to cool before those at the bottom of the slope, all slopes havingregrown a continuous vegetation cover by 2015. It is estimate that it will require 50years before a full grown forest has redeveloped, and that this is unlikely to be a pureSpruce stand like the cover prior to the fire.
3.3.6 Glaciers
Glaciers develop where there is excessive winter snowfall that exceeds the ablation ofthe snow pack in summer, resulting in the persistence of snow and ice on the groundsurface throughout the year. This snow metamorphoses into ice and as it thickens,it commences flowing downslope. Although it has been suggested that glaciers andpermafrost should be treated as part of a single system (Dobinski, 2012), the dominantprocesses involved are very different. The relationship of glaciers to the mean seasonalfreezing and thawing indices are shown in Figure 3.24 (after Harris, 1981b). Theaccumulation areas of glaciers normally only occur in areas with freezing and thawingindices similar to continuous permafrost. The only exceptions are where avalanches

Dow
nloa
ded
By:
10.
3.98
.104
At:
14:3
1 12
Dec
202
1; F
or: 9
7813
1516
6988
, cha
pter
3, 1
0.43
24/9
7813
1516
6988
-4
120 Geocryology
Figure 3.24 Relationship of the distribution of glaciers to the mean seasonal freezing and thawingindices and permafrost zones (redrawn from Harris, 1981b, Figure 4).
add extra snow to the base of a north-facing slope, e.g., on the west precipitous sideof Mount Chephren, Banff National Park, Canada.
Since the period of winter cold is longer than the summer, the glacier ice can sustainbelow-zero temperatures in both the glacier ice and in the underlying soil or rock ifthe climate is sufficiently cold and the glacier is relatively thin (cold-based glaciers),e.g., the Kunlun Shan, Tien Shan and Tanggula Shan. Elsewhere, the base of the glacieris at the pressure-melting point (warm-based or temperate glaciers), and permafrostwill be absent from the underlying substrate (Figure 3.26). The geothermal heat flowcan vary considerably between tectonically active areas such as Kamchatka and theQinghai-Tibet Plateau and stable, cores of continents, but it is this heat that warmsthe lower layers of glaciers.
The termini can occur inside or outside the permafrost zone depending on the totalsnowfall, size of the glacier and topography. The exact boundary conditions for the

Dow
nloa
ded
By:
10.
3.98
.104
At:
14:3
1 12
Dec
202
1; F
or: 9
7813
1516
6988
, cha
pter
3, 1
0.43
24/9
7813
1516
6988
-4
Factors affecting permafrost distribution 121
Figure 3.25 Permafrost distribution in relation to the Columbia Icefield in Banff National Park,Alberta.The Castleguard Ice Cave has developed in the unfrozen ground protected from extremewinter cold by the warm-based part of the glacier (see Muir & Ford, 1985). In contrast, theouter edge of the Columbia Icefield on the lower slopes of Mount Castleguard appearsto be frozen to the underlying rock, making it a polythermal glacier.
–50
–2800
–2400
–2000
Dep
th, m
–1600
–1200
–800
–400
0
Measured dataGiovinetto [1960]Best fit (1800 to 2810 m)Base
–40 –30
Temperature, °C
–20 –10 0
Figure 3.26 Ground temperatures in the borehole through the Antarctic ice cap beneath theVostockstation inAntarctica (Giovinetto,1960,and Price et al.,2002). Note the significant reductionin the pressure-melting point at the base, and the unusually low surface temperatures.Where mountain ranges are buried in Antarctica, permafrost is usually present beneaththe base of the glacier.
formation of permafrost and glaciers depend on the local microenvironment, but thelower limit of permafrost rises in elevation in mountains where the equilibrium lineon glaciers is at a low elevation (Harris & Brown, 1978). This is due to the insulatingeffect of a thick snow cover protecting the ground from the cold winter temperatures(Figure 3.11). The ice in glaciers often acts as a blanket protecting the underlying
Dow
nloa
ded
By:
10.
3.98
.104
At:
14:3
1 12
Dec
202
1; F
or: 9
7813
1516
6988
, cha
pter
3, 1
0.43
24/9
7813
1516
6988
-4
122 Geocryology
ground from the full effects of the local temperature regime, (Figure 3.25), but icediffers from snow in having a considerably higher thermal conductivity. It is also moretranslucent, so that incoming energy is absorbed through a considerable thickness ofthe ice after it loses its winter snow cover. This also depends on the amount of opaquesediment it is carrying. Above the firn line, the surface consists of snow at all seasons,resulting in reflection back of 80–90% of the incoming radiation.
Tests beneath the Greenland ice sheet, 150 km east of Thule showed a bottomtemperature of −13◦C beneath 1387 m of ice indicating the presence of a cold-basedglacier (Hanson & Langway, 1966; Langway, 1967; Robin, 1972), yet warm-basedglaciers may also be found in the High Canadian Arctic (Müller, 1963). Glaciers withtemperatures regimes that include portions which are cold-based as well as warm-based (polythermal glaciers) have also been described and are probably very common(Blatter, 1990; Blatter & Hutter, 1991). An example of the effect of a glacier on thedistribution of permafrost at 2500 m in the Canadian Rocky Mountains is shown inFigure 3.25.
The actual temperature profile in glaciers can vary greatly in short distances, usu-ally as a result of advection of heat due to meltwater flowing through tunnels andcracks, or through different snow and ice densities (Lüthi & Funk, 2001). Where themeltwater flows near the base of the snout of a glacier, it can thaw the permafrost closeto its path (Moorman, 2003) in otherwise continuous permafrost.
Glaciers are very sensitive to changes in precipitation or temperature, either orboth. Variations in weather can create considerable differences in the temperatureprofile of small, thin glaciers. Snowpack evolution and ice surface temperatures werestudied on the Indren glacier (Northwestern Alps, Italy), for two winter seasons. Itappeared that a deep snow cover of at least 100 cm was able to maintain the snow/icetemperature at around −5◦C until the snow cover reached isothermal conditions,whereas, during the winter, the shallow depth of snow did not allow basal temperatureto reach an equilibrium value, so the temperature at the snow-ice interface oscillatedbetween −2 and −8◦C (Maggioni et al., 2009). In Western Canada, the glaciers arerapidly retreating although the mean annual air temperature is scarcely changing.However the winter snowfall has decreased substantially since the Last Neoglacialevent.
Judge (1973) suggested that the present ground temperatures in Northern Canadaare lower than the ice-bottom temperatures during the Pleistocene, based on an esti-mated thickness of the Laurentide Ice Sheet of more than 1200 m. During deglaciation,the permafrost in areas inundated by pro-glacial lakes would probably have thawedany remaining ground ice that was present. However, areas such as Plateau Mountainthat were not protected by Pleistocene ice sheets developed deep, cold permafrost thatcould not be formed under the present climate.
3.3.7 The effects of Man
Modern living outside areas of permafrost involves considerable manipulation of theadjacent landscape. This is not compatible with preservation of permafrost. As a result,use of permafrost lands involves considerable modification of methods of constructionof buildings, roads, railways and pipelines (Harris, 1986a). Extraction of minerals isalso more difficult. Examples of the methods used are given in Part 3 of this book.