Embed Size (px)
Citation preview
GEO 241: GEOGRAPHIC INFORMATION SYSTEMS I
Week 7: Spatial Analysis II: Buffer Analysis, Geocoding
Geographic Information Systems I | Department of Geography, DePaul University. Nandhini Gulasingam

ArcGIS Software
Geographic Information Systems I | Department of Geography, DePaul University. Nandhini Gulasingam 2
ArcViewv 10
ArcEditorv 10
ArcInfov 10
ArcMap ArcToolboxArcCatalog
To create maps, map layouts
For data manipulation, create organize
shapefiles, folders etc.
For functions, analytical tools, etc.

ArcGIS Software
Geographic Information Systems I | Department of Geography, DePaul University. Nandhini Gulasingam 3
ArcViewv 10
ArcEditorv 10
ArcInfov 10
ArcMap ArcToolboxArcCatalog
To create maps, map layouts
For data manipulation, create organize
shapefiles, folders etc.
For functions, analytical tools, etc.

Buffer Analysis
• Buffer analysis is used for identifying areas surrounding geographic features
• The process involves generating a buffer around existing geographic features and then identifying or selecting features based on whether they fall inside or outside the boundary of the buffer
• Creates a new polygon
Geographic Information Systems - I | Department of Geography, DePaul University. Nandhini Gulasingam 4
Buffer Analysis (Contd.)
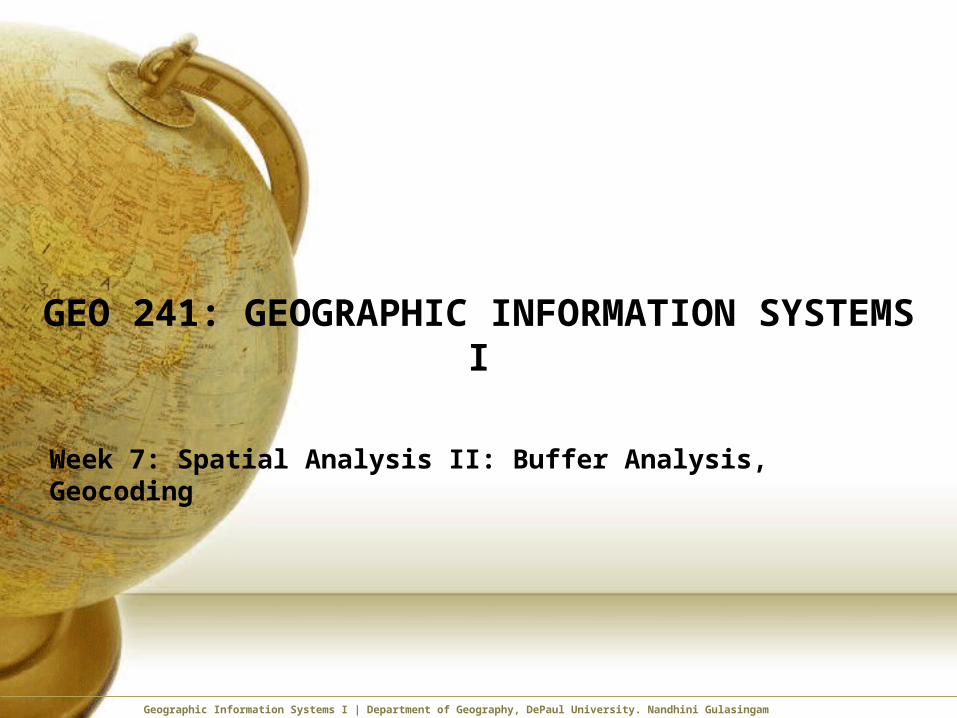
• Applied to points, lines, or polygons
Geographic Information Systems - I | Department of Geography, DePaul University. Nandhini Gulasingam 5
½ mile buffer around schools
¼ mile buffer around Pink CTA line
¼ mile buffer Around Humboldt Park neighborhood

Buffer Analysis (Contd.)
• Setting dissolve type
Geographic Information Systems - I | Department of Geography, DePaul University. Nandhini Gulasingam 6
Buffer Analysis (Contd.)
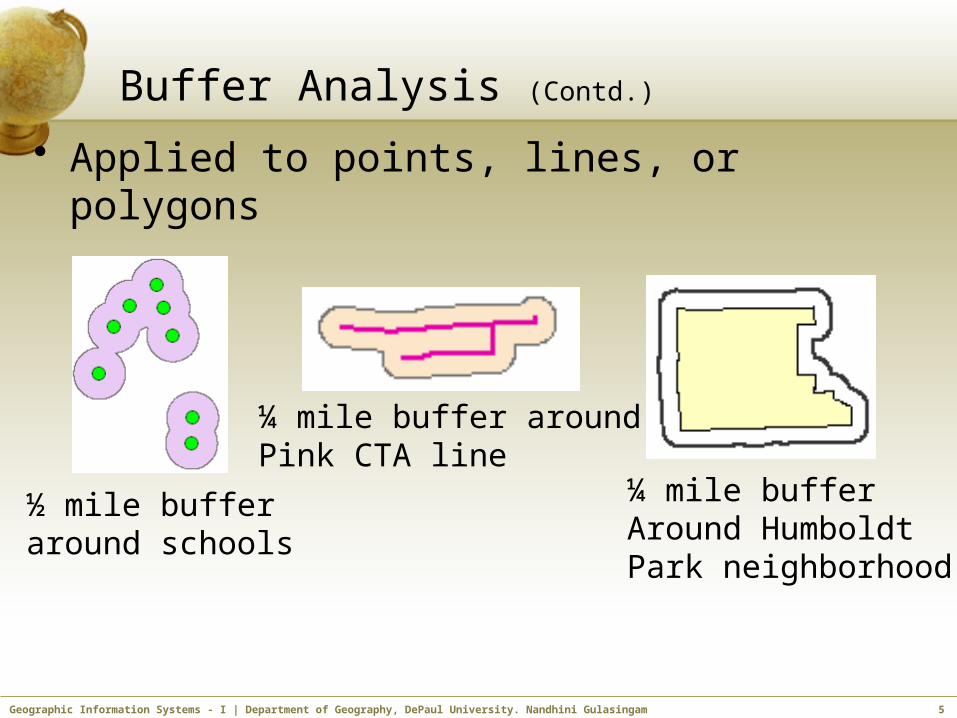
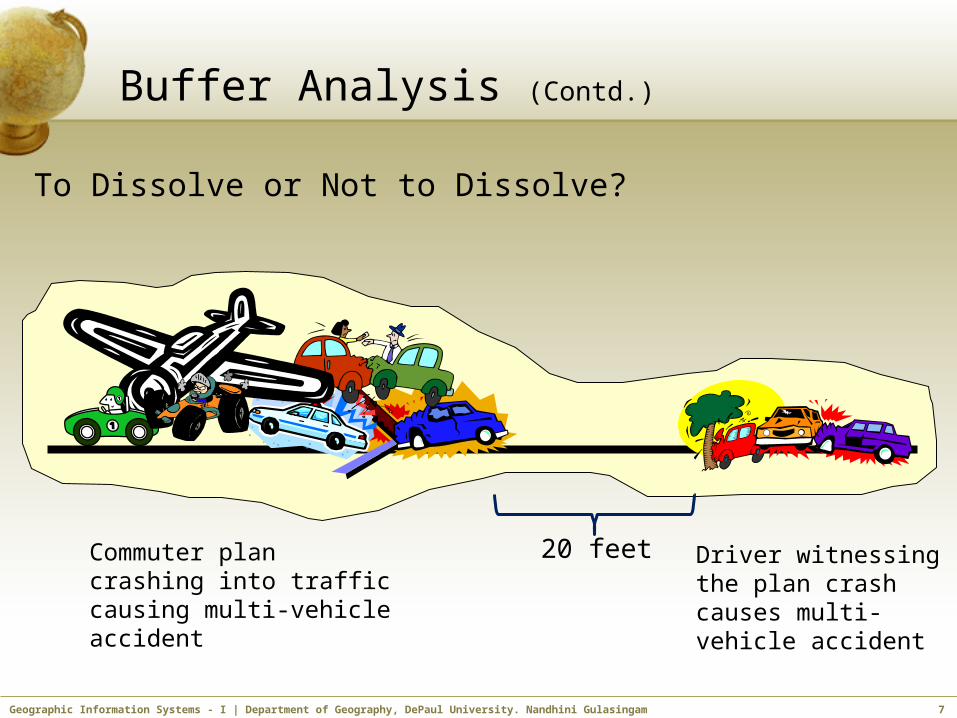
To Dissolve or Not to Dissolve?
Geographic Information Systems - I | Department of Geography, DePaul University. Nandhini Gulasingam 7
20 feetCommuter plan crashing into traffic causing multi-vehicle accident
Driver witnessing the plan crash causes multi- vehicle accident

Buffer Analysis (Contd.)
Types of Buffers(1)Single ring buffer
(1)Outside buffer(2) Inside buffer
(2) Multiple ring buffer
Geographic Information Systems - I | Department of Geography, DePaul University. Nandhini Gulasingam 8

Buffer Analysis (Contd.)
Single ring buffer
(1) Outside buffer: To identify what features are in the outside buffer polygon?
(2) Inside buffer: To identify what features are in the inside buffer polygon?
Geographic Information Systems - I | Department of Geography, DePaul University. Nandhini Gulasingam 9
LakeBuffer outside
Lake
Inside bufferLake

Buffer Analysis (Contd.)
Multiple ring buffer• To identify features within each of the buffer areas
• Could be multiple inside buffers or multiple outside buffers
Geographic Information Systems - I | Department of Geography, DePaul University. Nandhini Gulasingam 10

Buffer Analysis (Contd.)
• Examples
Geographic Information Systems - I | Department of Geography, DePaul University. Nandhini Gulasingam 11

Buffer Analysis (Contd.)
• Examples
Geographic Information Systems - I | Department of Geography, DePaul University. Nandhini Gulasingam 12
0-4 Mile 0-8 Mile 0-12 Mile
Total Population 185,517 831,254 2,068,803
College Education 4 or More Years 24,078 98,378 241,017
Number of Enrolled High School Students 8,718 42,712 114,882
Total Households 72,819 310,352 741,472
$60,000 - $100,000 19,341 30,308 180,386
$100,000 or more 12,360 50,495 123,557

Buffer Analysis (Contd.)
• Examples…• If we know that a chemical spill will cause harm to
anyone within 1 mile of its release site, we could buffer the places that chemical is stored, and use that information to plan our emergency response system
• If we want to assess the number of commuters affected within a 4-block radius of a CTA station closing, we could create a buffer area around the particular CTS station and compute the number of commuters who will be affected by this closing
• If we want to know the crime rate within 1-block radius of all CTA stations, a buffer area could be created around the CTA train stations and the number of crime committed within the buffer area could be calculated
Geographic Information Systems - I | Department of Geography, DePaul University. Nandhini Gulasingam 13

Buffer Analysis (Contd.)
• Process
Geographic Information Systems - I | Department of Geography, DePaul University. Nandhini Gulasingam 14
Dissolve Type(see lab activity)
Feature aroundwhich you want to create the buffer area
File name of the buffer area
Buffer distance

Buffer Analysis (Contd.)
Important• Map MUST have units of measurement• Georeference should be accurate otherwise
the buffer distance will be inaccurate causing incorrect buffer distances
Geographic Information Systems - I | Department of Geography, DePaul University. Nandhini Gulasingam 15
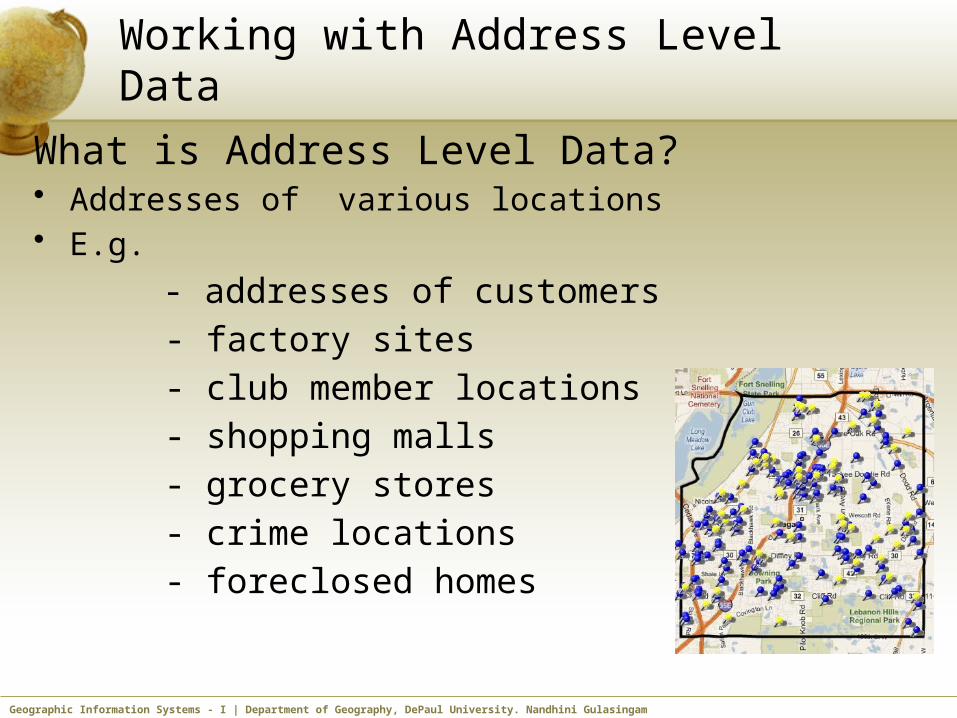
Working with Address Level Data
What is Address Level Data?• Addresses of various locations• E.g.
- addresses of customers - factory sites - club member locations - shopping malls - grocery stores - crime locations - foreclosed homes
Geographic Information Systems - I | Department of Geography, DePaul University. Nandhini Gulasingam 16

Working with Address Level Data
Why is it difficult to obtain Address Level shapefiles?• Most often the Address Level data is specific to
a particular organization/industry E.g.
• Customer location of KHOLS• Foreclosed properties owned by a particular bank
• They are not static, they change all the timeE.g.
• Crime locations• Homes listed for sale
Geographic Information Systems - I | Department of Geography, DePaul University. Nandhini Gulasingam 17
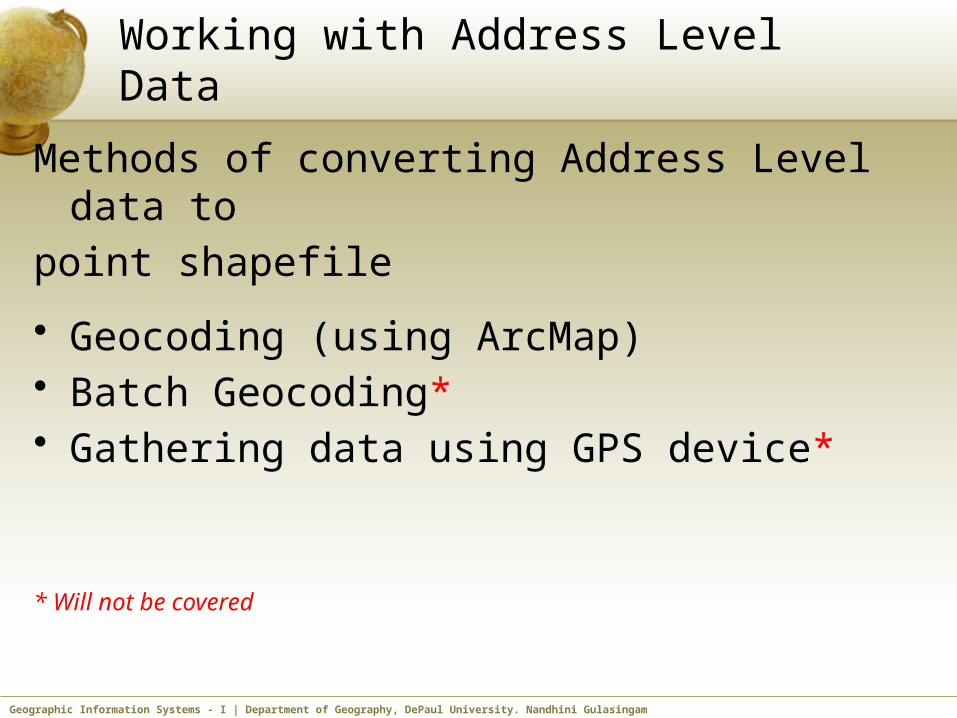
Working with Address Level Data
Methods of converting Address Level data to
point shapefile
• Geocoding (using ArcMap)• Batch Geocoding*• Gathering data using GPS device*
* Will not be covered
Geographic Information Systems - I | Department of Geography, DePaul University. Nandhini Gulasingam 18

Geocoding• It is a process of converting address locations to
point shapefiles
Name Address CPS_TypeChicago Vocational 2100 E 87th St VocationalBest Practice 2040 W Adams St General/TechnicalDunbar 3000 S Dr Martin Luther Kin Dr VocationalFlower 3545 W Fulton Blvd VocationalNear North 1450 N Larrabee St High School MagnetJones 606 S State St High School MagnetProsser 2148 N Long Av VocationalRodriguez Apc 630 W Irving Park Rd General/TechnicalPayton 1034 N Wells St General/TechnicalHarvey Apc 2245 N Mc Vicker Av General/Technical
Geographic Information Systems - I | Department of Geography, DePaul University. Nandhini Gulasingam 19

Geocoding
How do we Geocode?• You have an address location and a streets
network• The address location is matched to the street
network• Once matched, it will create a point location
Geographic Information Systems - I | Department of Geography, DePaul University. Nandhini Gulasingam 20

Geocoding
S
RightLeftA
dam
s400
200
02
120
395
201
101
01
N200 N Adams
Step 1. Segment the address200| N | Adams
Step 2. Find the Street
Step 3. Find the direction
Step 4. Find the house# segment
Step 5. Locate the point
Geographic Information Systems - I | Department of Geography, DePaul University. Nandhini Gulasingam 21

Geocoding
Question: Where will each addresses be located on
the street?
1. 200 N Adams
2. 385 N Adams 3. 4 S Adams 4. 122 S Adams 5. 404 N Adams
RightLeft
Ad
am
s
400
200
02
120
395
201
101
01
N
Geographic Information Systems - I | Department of Geography, DePaul University. Nandhini Gulasingam 22
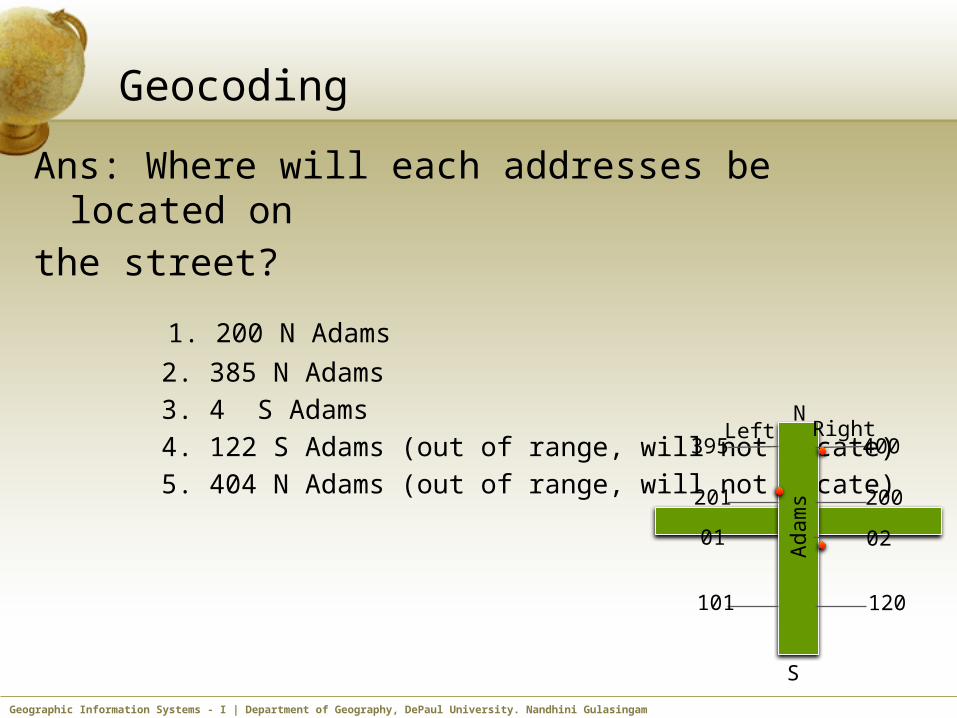
Geocoding
Ans: Where will each addresses be located on the street?
1. 200 N Adams
2. 385 N Adams 3. 4 S Adams 4. 122 S Adams (out of range, will not locate) 5. 404 N Adams (out of range, will not locate)
S
RightLeft
Ada
ms
400
200
02
120
395
201
101
01
N
Geographic Information Systems - I | Department of Geography, DePaul University. Nandhini Gulasingam 23

Geocoding
What do you need to geocode addresses1. Address locations
• Data should be in .dbf or .csv format• If you have data in excel format, “save as” .dbf or .csv file
Should be in this format –i.e. - Field Names on the 1st row - Data starting from 2nd row - Should have an Address field
Geographic Information Systems - I | Department of Geography, DePaul University. Nandhini Gulasingam 24

GeocodingWhat do you need to geocode addresses2. Street network
• Will be used as the reference data file to plot the address locations
Street Network (Shapefile)
Left Hand Side (LHS)From and To Ranges
Right Hand Side (RHS)From and To Ranges
Geographic Information Systems - I | Department of Geography, DePaul University. Nandhini Gulasingam 25

Geocoding
What do you need to geocode addresses
3. Geocoding service or Address Locator• Includes the process or rules as to how the address will be
placed/plotted on the street network. i.e. right or left, etc.• Uses the Street network file (mentioned above) to build the
rules• Predefined or can be defined by the user
Geographic Information Systems - I | Department of Geography, DePaul University. Nandhini Gulasingam 26

GeocodingProcess
1. Right click on .csv file, select Geocode Address
2. Click on “Add” and select the transportation locator. Press OK.
Once added double click on transportation locator
Geographic Information Systems - I | Department of Geography, DePaul University. Nandhini Gulasingam 27

Geocoding
3. Enter the resulting file name. Press OK.
4. Shows matched/ unmatched record counts
5. Rematch to correct unmatched records.
Geographic Information Systems - I | Department of Geography, DePaul University. Nandhini Gulasingam 28

Geocoding
New fields created in the output shapefile• Status
• U – Unmatched• T – Tied• M - Matched
• Score – match score• Side – side of the street the address was matched• ARC_Street – Address information that was geocoded
Geographic Information Systems - I | Department of Geography, DePaul University. Nandhini Gulasingam 29

Geocoding
Pros and Cons of using GeocodingPros:• Takes less time to convert massive amount of address
locations to point shapefile E.g. 2 million address locations takes about 2-3 hours to convert
to address locations
• Requires only ArcMap (and excel to clean up the data) • Can review and correct unmatched records• Can see matched status (Matched, Unmatched, Tied) • Re-geocode unmatched records later
Geographic Information Systems - I | Department of Geography, DePaul University. Nandhini Gulasingam 30
Geocoding
Pros and Cons of using GeocodingCons:• If the streets network file doesn’t have the address range, it
will not convert your address location• If the streets network file is outdated most of
your address points wont be converted
Geographic Information Systems - I | Department of Geography, DePaul University. Nandhini Gulasingam 31

Lab 6
• Create buffers around features and analyze surrounding features
• Create point shapefiles of various address locations using geocoding
• Create maps with the geocoded data and buffers
Geographic Information Systems I | Department of Geography, DePaul University. Nandhini Gulasingam 32

Next Week (Week 8) – IMPORTANT!!!
• Assignment 6 due Friday midnight
Geographic Information Systems I | Department of Geography, DePaul University. Nandhini Gulasingam 33