Embed Size (px)
Citation preview
Genomics and imaging data S Nougaret, MD, PhD, Montpellier, France

• Precision medicine: treating the right patient, with the right drug, at the right time, has become the paradigm of modern medicine
•Genomic is essential to this new paradigm
Oncologic Imaging in the Era of Precision Medicine
• Cancer is a genetically heterogeneous disease undergoing continuous evolution -spatially and temporally
Oncologic Imaging in the Era of Precision Medicine
Vogelstein et al. Cancer Genomic Landscapes. Science 2013 March 29; 339(6127): 1546-1558
• Primary tumors are spatially and temporally heterogeneous
• Metastasis de-differentiate in 50% of cancers & have different biologic features
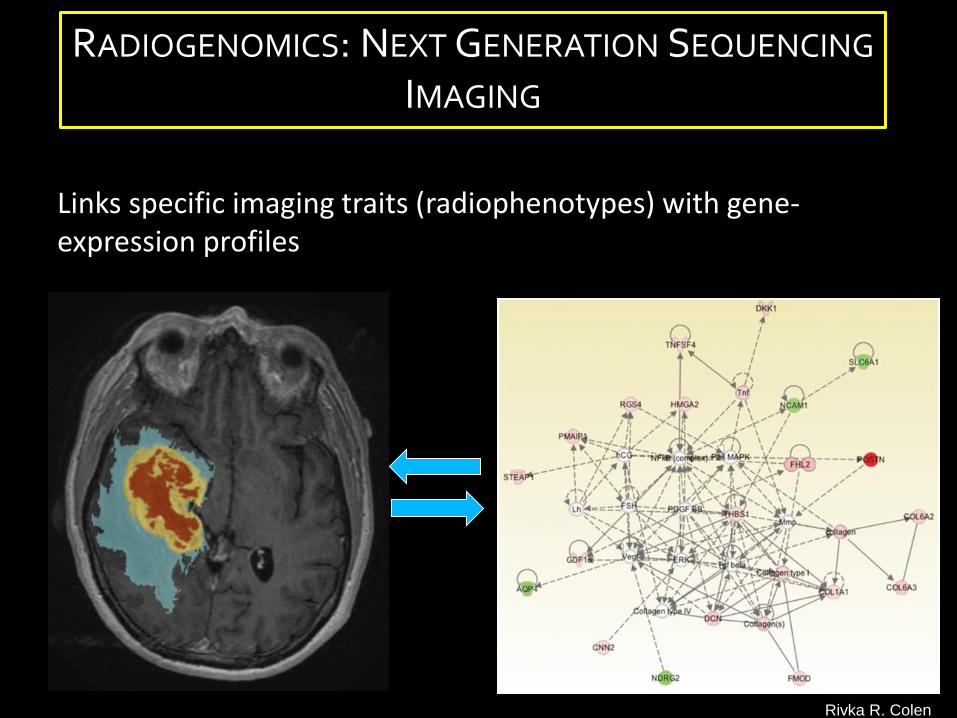
Links specific imaging traits (radiophenotypes) with gene-expression profiles
RADIOGENOMICS: NEXT GENERATION SEQUENCING
IMAGING
Rivka R. Colen
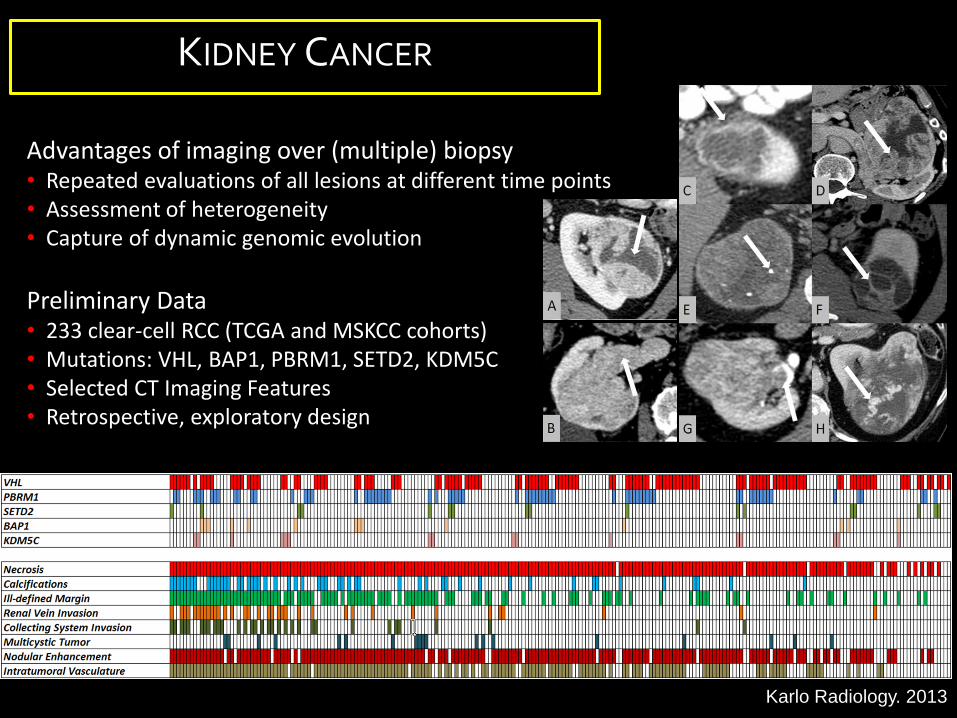
Advantages of imaging over (multiple) biopsy• Repeated evaluations of all lesions at different time points• Assessment of heterogeneity • Capture of dynamic genomic evolution
Preliminary Data• 233 clear-cell RCC (TCGA and MSKCC cohorts)• Mutations: VHL, BAP1, PBRM1, SETD2, KDM5C• Selected CT Imaging Features• Retrospective, exploratory design
Karlo Radiology. 2013
KIDNEY CANCER
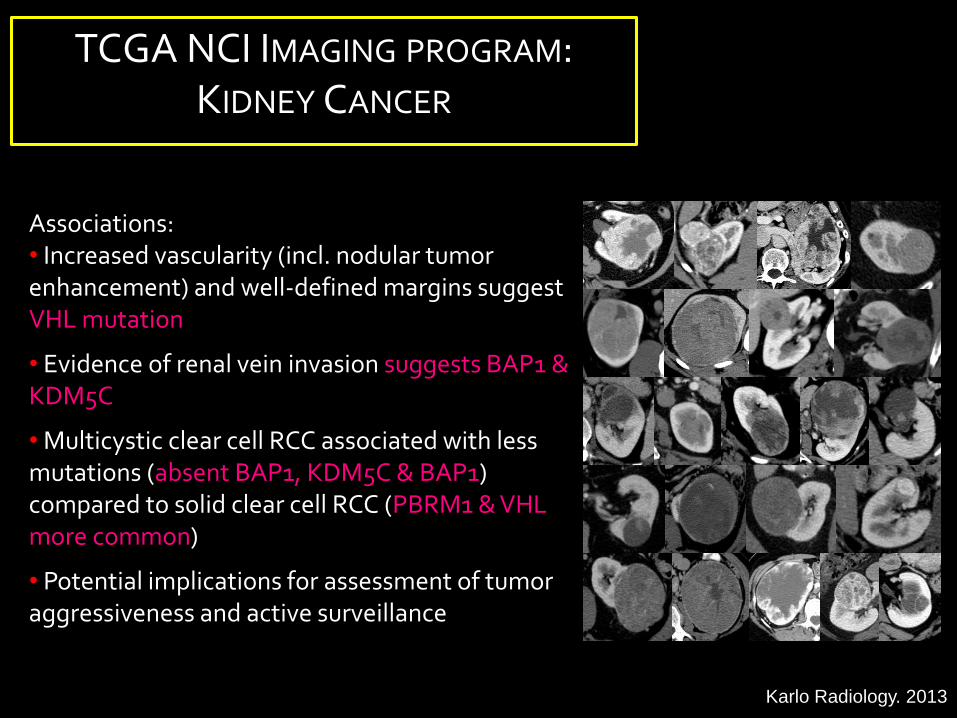
TCGA NCI IMAGING PROGRAM: KIDNEY CANCER
Associations:• Increased vascularity (incl. nodular tumor enhancement) and well-defined margins suggest VHL mutation
• Evidence of renal vein invasion suggests BAP1 & KDM5C
• Multicystic clear cell RCC associated with less mutations (absent BAP1, KDM5C & BAP1) compared to solid clear cell RCC (PBRM1 & VHLmore common)
• Potential implications for assessment of tumor aggressiveness and active surveillance
Karlo Radiology. 2013
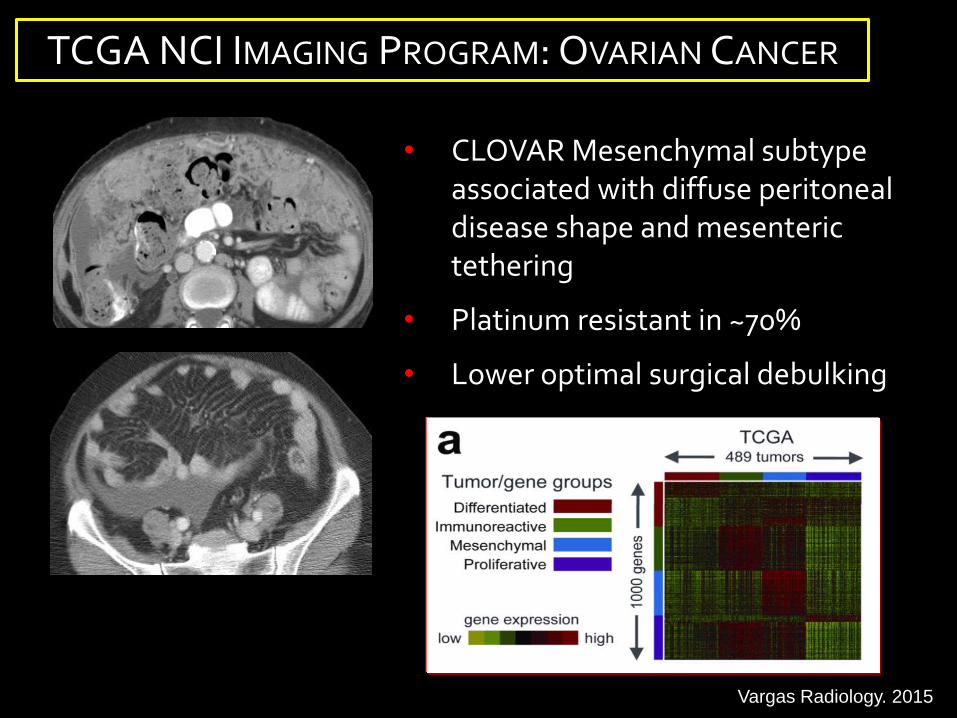
• CLOVAR Mesenchymal subtype associated with diffuse peritoneal disease shape and mesenteric tethering
• Platinum resistant in ~70%
• Lower optimal surgical debulking
Vargas... Sala. Radiology 2014
TCGA NCI IMAGING PROGRAM: OVARIAN CANCER
Vargas Radiology. 2015
High Grade Serous Ovarian Cancer: BRCA Mutation Status and CT Imaging Phenotypes
Acknowledgments Sala E- Lakhman Y- Moskowitz C- Goldman D

BRCA + (15-17%)
Higher response rates to first and subsequent lines of platinum-based Cx Specific chemosensitivity to inhibitors of poly-ADP ribose polymerase Longer relapse free period ? Higher rate of optimal cytoreduction
Rationale
BRCA – (80%)
Lower response rates to first and subsequent lines of platinum-based Cx Shorter relapse free interval
HGSOC

BRCA –
BRCA +
Infiltrative pattern
“Pushing” and round metastases
May be associated with the rate of optimal cytoreduction
Soslow, Modern Pathology, 2014Reyes, Modern Pathology, 2014
To evaluate CT imaging features that may be associated
with presence of BRCA mutations.
Rationale/Objective
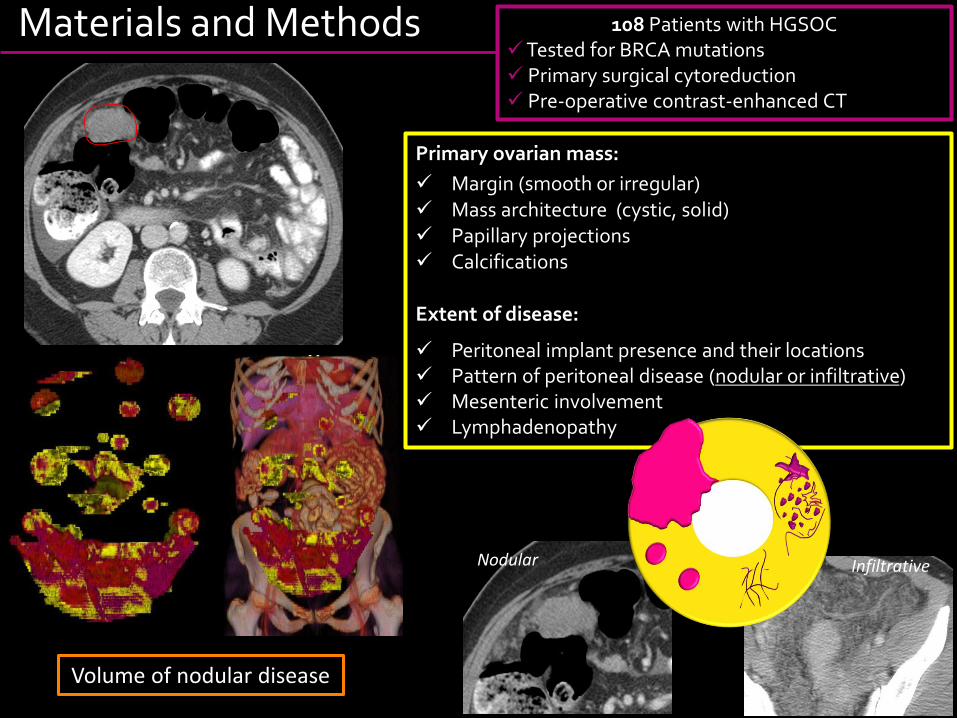
Primary ovarian mass:
Margin (smooth or irregular) Mass architecture (cystic, solid) Papillary projections Calcifications
Extent of disease:
Peritoneal implant presence and their locations Pattern of peritoneal disease (nodular or infiltrative) Mesenteric involvement Lymphadenopathy
Materials and Methods 108 Patients with HGSOC Tested for BRCA mutations Primary surgical cytoreduction Pre-operative contrast-enhanced CT
Volume of nodular disease
Nodular Infiltrative
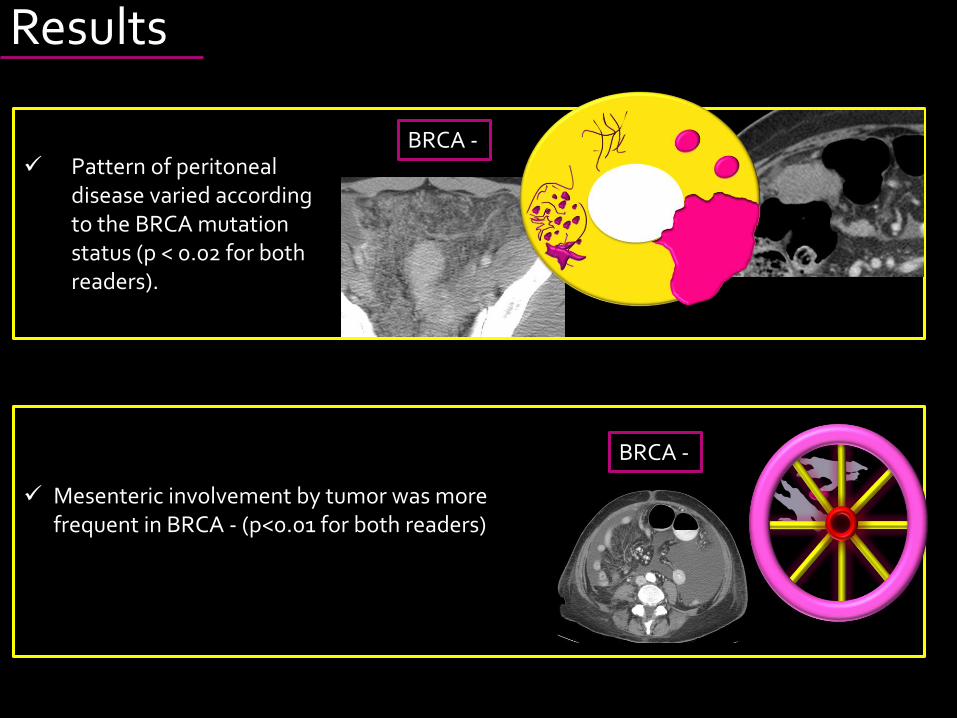
Results
Pattern of peritoneal disease varied according to the BRCA mutation status (p < 0.02 for both readers).
Mesenteric involvement by tumor was more frequent in BRCA - (p<0.01 for both readers)
BRCA -
BRCA -

Rectal Cancer MRIand
Transcriptome Sequencing
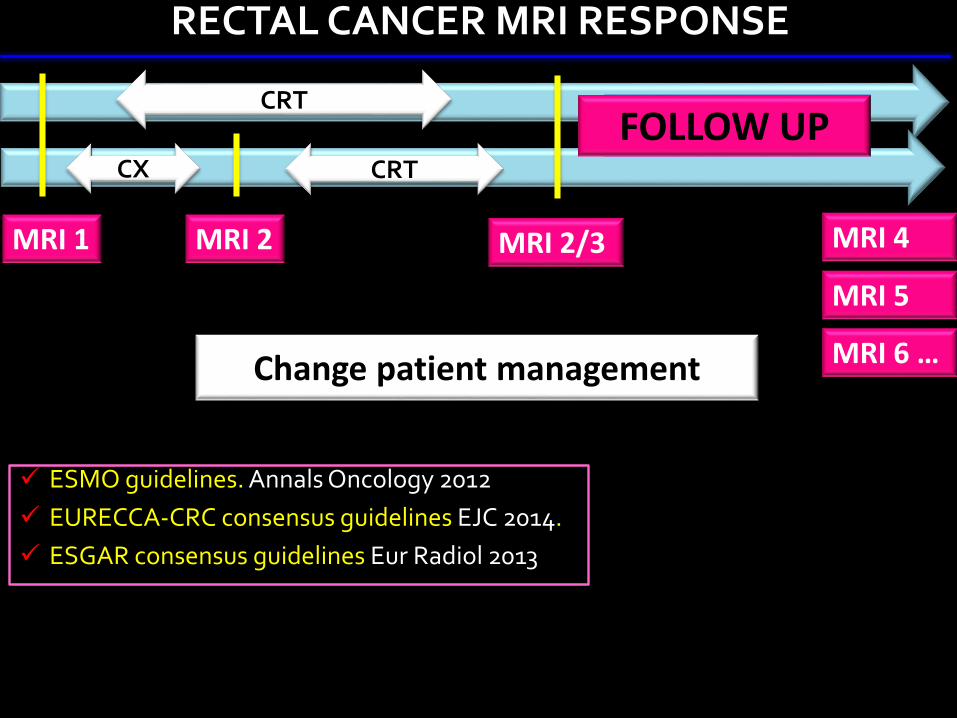
MRI 1 MRI 2 MRI 2/3
RECTAL CANCER MRI RESPONSE
ESMO guidelines. Annals Oncology 2012
EURECCA-CRC consensus guidelines EJC 2014.
ESGAR consensus guidelines Eur Radiol 2013
Change patient management
CRT
CX CRT
SURGERYFOLLOW UP
MRI 4
MRI 6 …
MRI 5
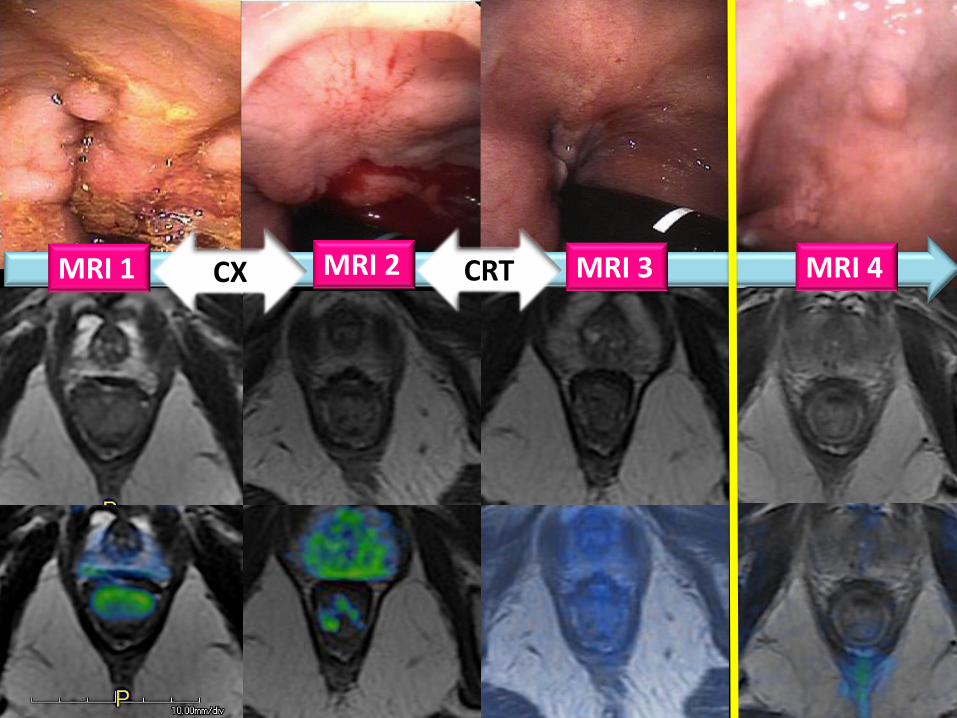
CXMRI 1 MRI 2 MRI 4 CRT MRI 3
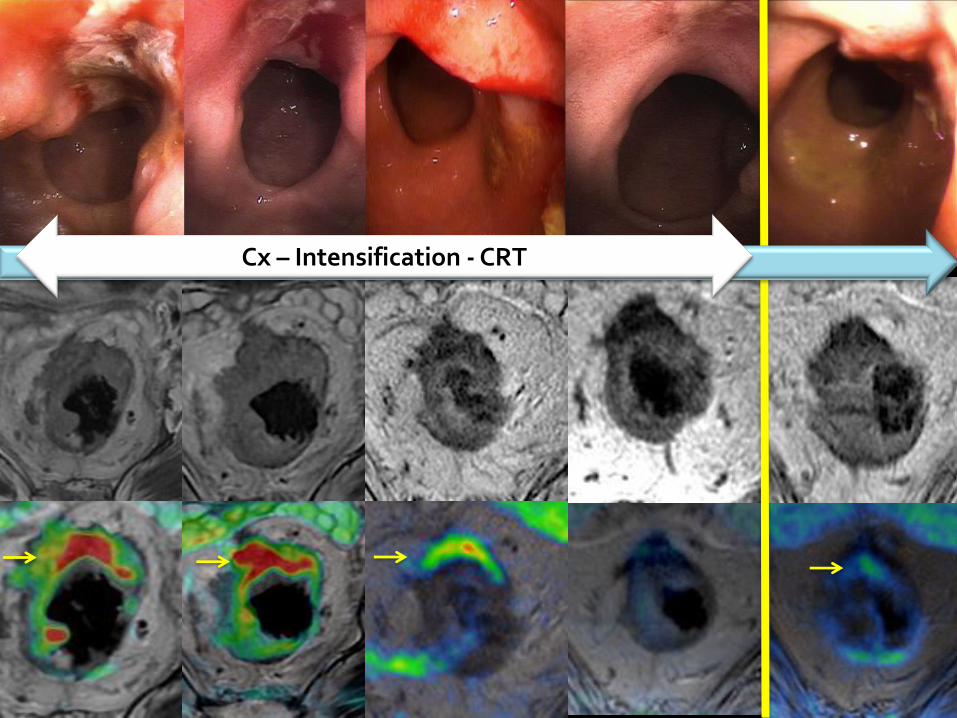
Cx – Intensification - CRT
PoorPrognosis
Bef
ore
CR
TA
fte
r C
RT
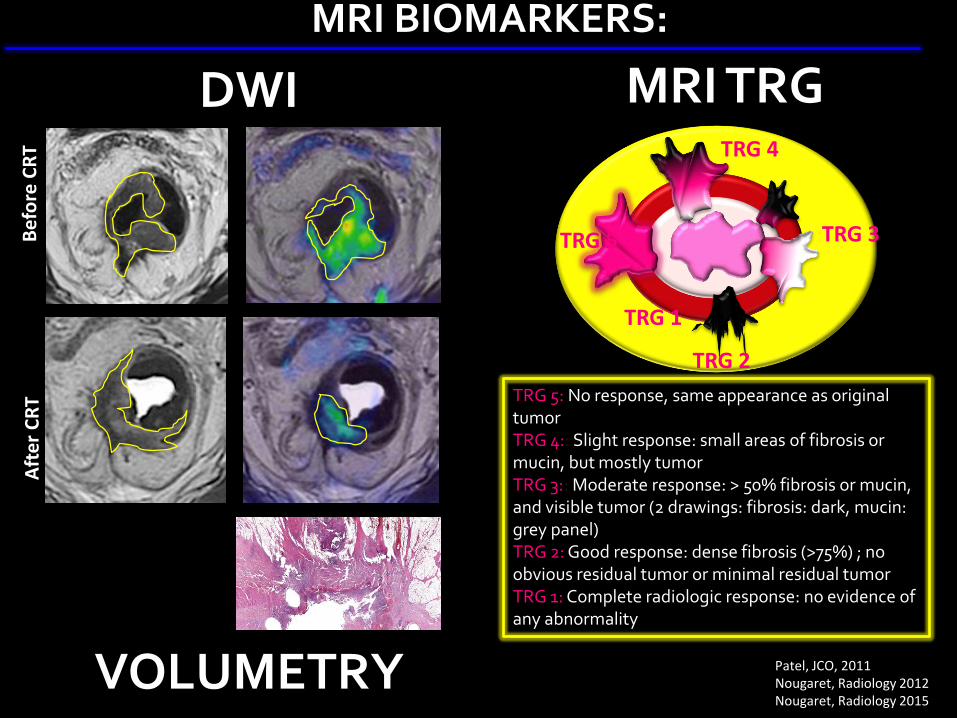
MRI TRG
Tumor
TRG 2
TRG 3
TRG 4
TRG 5
TRG 1
TRG 5: No response, same appearance as original tumorTRG 4:: Slight response: small areas of fibrosis or mucin, but mostly tumorTRG 3:: Moderate response: > 50% fibrosis or mucin, and visible tumor (2 drawings: fibrosis: dark, mucin: grey panel)TRG 2: Good response: dense fibrosis (>75%) ; no obvious residual tumor or minimal residual tumorTRG 1: Complete radiologic response: no evidence of any abnormality
MRI BIOMARKERS:
DWI
VOLUMETRY Patel, JCO, 2011Nougaret, Radiology 2012Nougaret, Radiology 2015
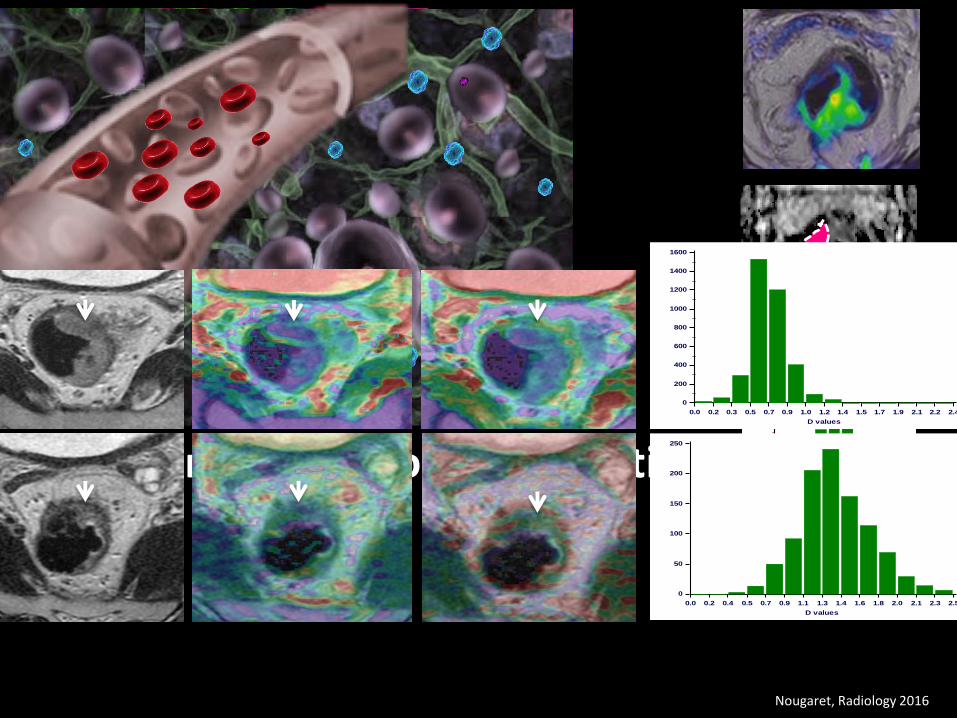
IVIM: Intravoxel incoherent motion 0.0 0.2 0.4 0.6 0.8 1.0 1.2 1.4 1.6 1.8 2.0 2.2 2.4 2.6 2.8 3.0 3.2 3.4 3.6 3.8 4.0
600
500
400
300
200
100
0
D values
Freq
uenc
yNougaret, Radiology 2016
0.0 0.2 0.4 0.5 0.7 0.9 1.1 1.3 1.4 1.6 1.8 2.0 2.1 2.3 2.5
250
200
150
100
50
0
D valuesFr
eque
ncy
0.0 0.2 0.3 0.5 0.7 0.9 1.0 1.2 1.4 1.5 1.7 1.9 2.1 2.2 2.4
1600
1400
1200
1000
800
600
400
200
0
D values
Freq
uenc
y
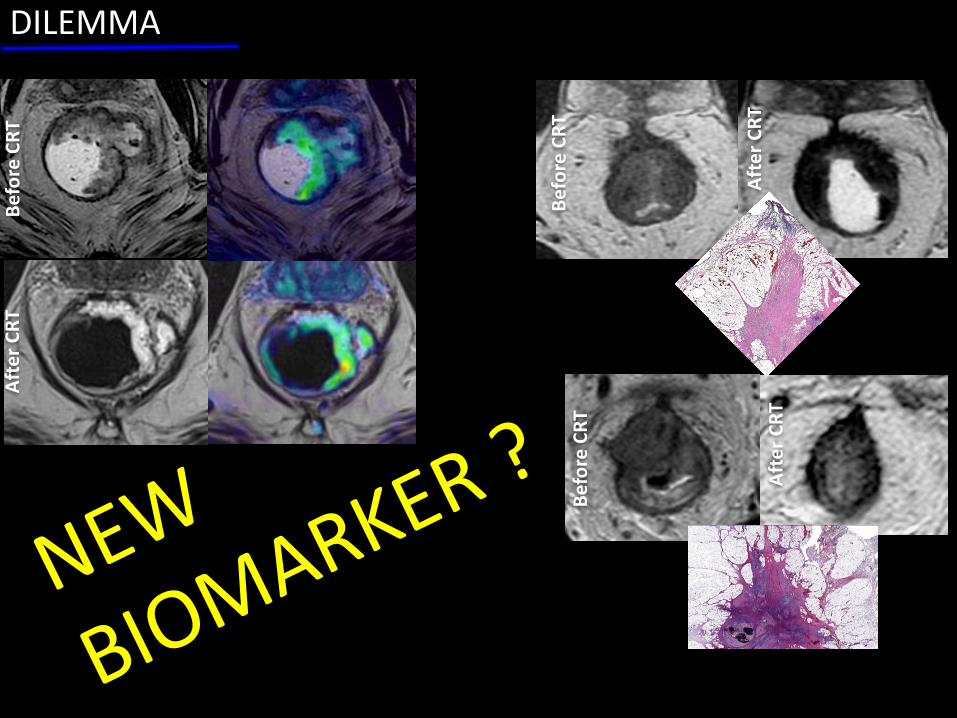
DILEMMA B
efo
re C
RT
Aft
er
CR
T
Bef
ore
CR
T
Aft
er
CR
T
Bef
ore
CR
T
Aft
er
CR
T
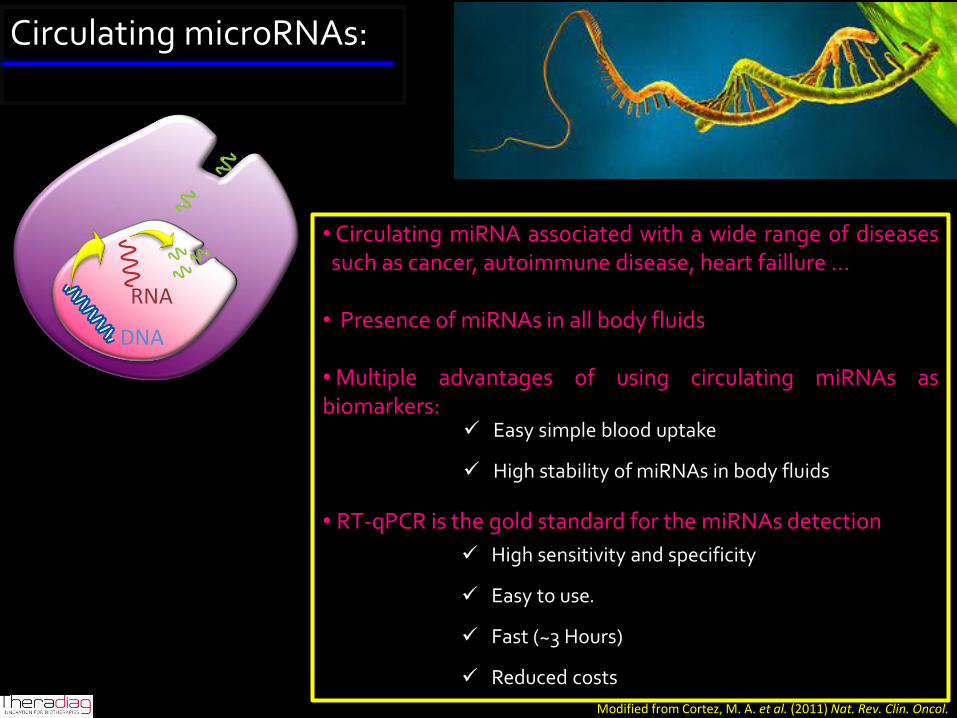
Modified from Cortez, M. A. et al. (2011) Nat. Rev. Clin. Oncol.
Circulating microRNAs:
Easy simple blood uptake
High stability of miRNAs in body fluids
High sensitivity and specificity
Easy to use.
Fast (~3 Hours)
Reduced costs
• Circulating miRNA associated with a wide range of diseasessuch as cancer, autoimmune disease, heart faillure ...
• Presence of miRNAs in all body fluids
• Multiple advantages of using circulating miRNAs asbiomarkers:
• RT-qPCR is the gold standard for the miRNAs detection
DNA
RNA
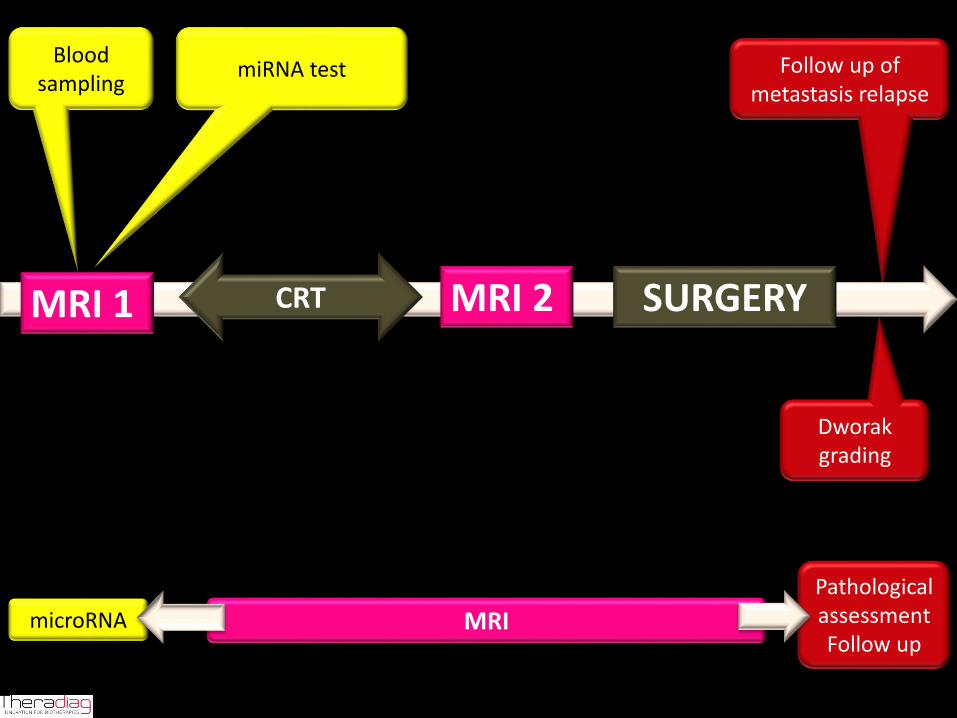
Dworakgrading
Follow up of metastasis relapse
MRI
Adjuvant treatment
PathologicalassessmentFollow up
miRNA test
MRI 2 CRT SURGERY MRI 1
Blood sampling
microRNA
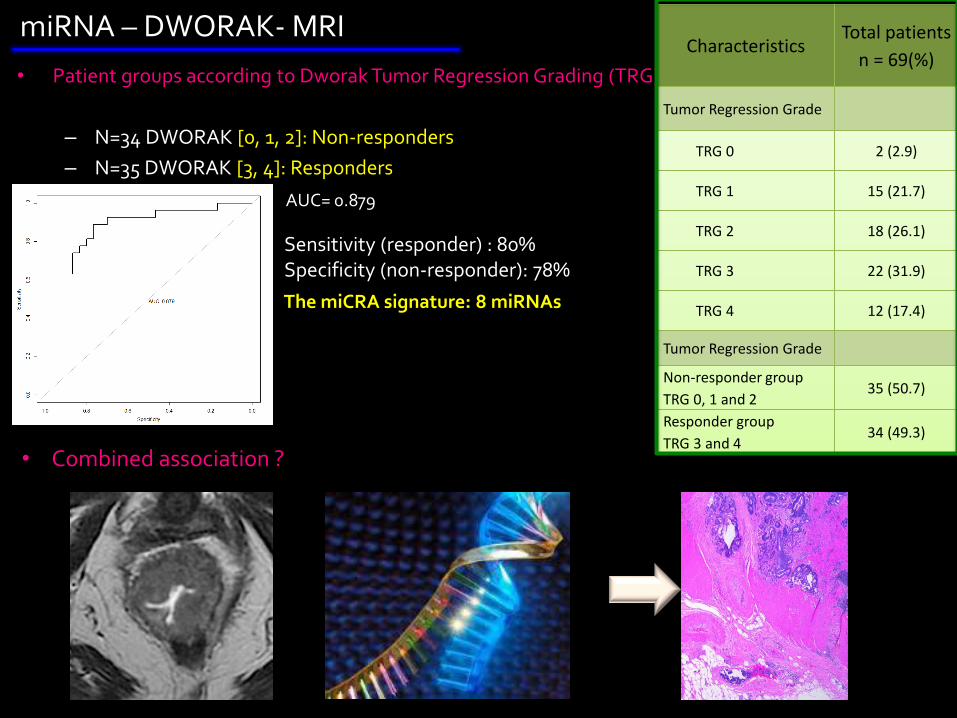
• Patient groups according to Dworak Tumor Regression Grading (TRG) :
– N=34 DWORAK [0, 1, 2]: Non-responders
– N=35 DWORAK [3, 4]: Responders
CharacteristicsTotal patients
n = 69(%)
Tumor Regression Grade
TRG 0 2 (2.9)
TRG 1 15 (21.7)
TRG 2 18 (26.1)
TRG 3 22 (31.9)
TRG 4 12 (17.4)
Tumor Regression Grade
Non-responder group
TRG 0, 1 and 235 (50.7)
Responder group
TRG 3 and 434 (49.3)
Sensitivity (responder) : 80%Specificity (non-responder): 78%
The miCRA signature: 8 miRNAs
AUC= 0.879
miRNA – DWORAK- MRI
• Combined association ?
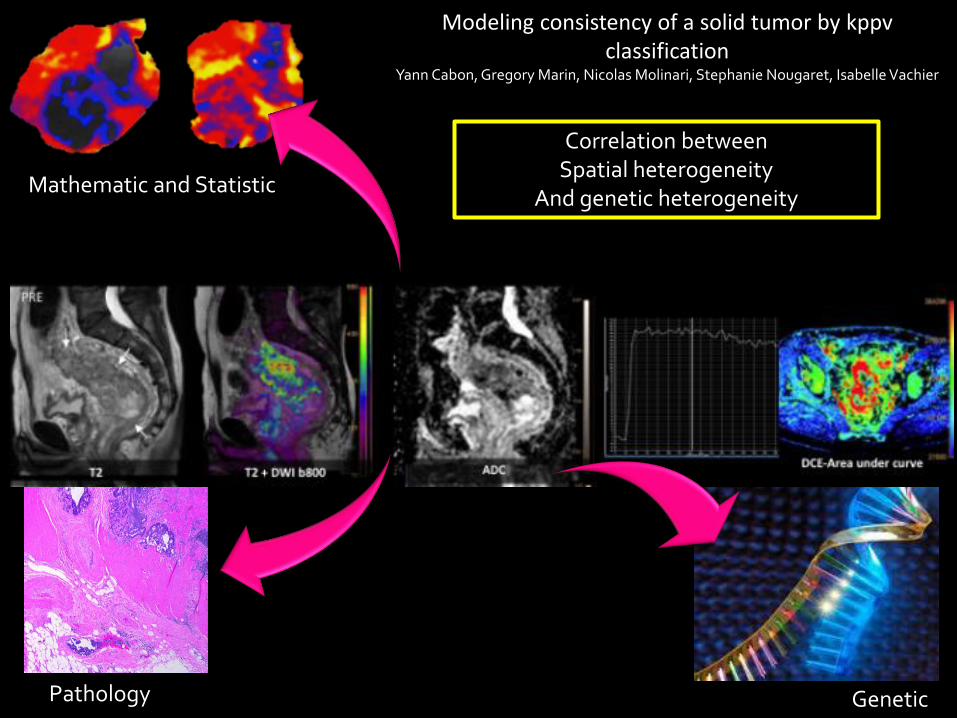
Modeling consistency of a solid tumor by kppvclassification
Yann Cabon, Gregory Marin, Nicolas Molinari, Stephanie Nougaret, Isabelle Vachier
GeneticPathology
Mathematic and Statistic
Correlation betweenSpatial heterogeneity
And genetic heterogeneity