Embed Size (px)
Citation preview
Genome diversity and gene haplotypes in the grapevine (Vitis vinifera L.),as revealed by single nucleotide polymorphisms
Marzia Salmaso1,3,5, Giorgia Faes1,4,5, Cinzia Segala1, Marco Stefanini1,Ilkhom Salakhutdinov2, Eva Zyprian2, Reinhard Toepfer2, M. Stella Grando1 andRiccardo Velasco1,*1Istituto Agrario San Michele all’Adige, via Mach 1, I-38010 San Michele a/A (TN); 2Federal Centre ofBreeding Research on Cultivated Plants, Institute for Grapevine Breeding Geilweilerhof, D-76833Siebeldingen; 3University of Padova, Dept. of Environmental Agronomy and Crop Production, Agripolis,I-35020 Legnaro (PD); 4University of Udine, Dept. of Plant Production, via delle Scienze 208, I-33100 Udine;5these two authors contributed equally to this work; *Author for correspondence (phone: + 39 0461 615314;fax: + 39 0461 650956; e-mail: [email protected])
Received 23 February 2004; accepted in revised form 4 May 2004
Key words: Grape ESTs, Haplotypes, Re-sequencing, SNP development, SSCP
Abstract
EST �expressed sequence tags� sequencing, SNP �single nucleotide polymorphisms� development and haplotypeassessment are powerful tools for the support of marker-assisted selection. The grapevine genome is currentlybeing scavenged in our laboratory using an EST-SNP approach. Nine parental genotypes, used to create fiveinter- or intra-specific hybrids, have been tested to evaluate the degree of polymorphism between Vitis vinifera,Vitis riparia and a further intraspecific hybrid, measuring their nucleotide diversity. The SNPs were analysed oncDNA sequences of 4 functional classes of genes based on homology with genes present in a public database:sugar metabolism, cell signalling, anthocyanin metabolism and defence related. Primer pairs were deduced andused to amplify corresponding genomic sequences. Almost 12,000 bp of DNA have been scanned revealing dif-ferences among genotypes of up to 247 SNPs, with the highest rate of one SNP occurring every 78 bp whenclones of different Vitis species are compared. Re-sequencing allowed the definition of haplotypes in the ninegenotypes studied and these were confirmed by analysing segregating populations. The efficiency of SSCP, incomparison with re-sequencing, was considered for 25 gene fragments of the same 9 genotypes.
Introduction
In the grapevine, as in all woody species, the devel-opment of new varieties is hampered by the long re-productive cycle, the large size of plants and thenegative effect caused by inbreeding depression �Al-leweldt 1997�. It is frequently stated that moleculartools may overcome these difficulties and open theway to new strategies for more efficient breeding. Thepossibility of following the inheritance of singlenucleotide polymorphisms �SNPs� and insertion/dele-
tion mutation �indels�, which represent the most fre-quent genetic differences between members of popu-lations �up to 90% of all human DNApolymorphisms; Collins et al. 1998� has been facili-tated by recent developments in sequence technology�Rafalski 2002�. Additional methods such as DNAfragment resolution based on single strand conforma-tional polymorphisms �SSCP� �Orita et al. 1989� andheteroduplex analysis �HA� �White et al. 1992�, orelectronic SNPs �eSNPs� deduced by computationalscreening and comparison of sequences from librar-
Molecular Breeding 14: 385–395, 2004.© 2004 Kluwer Academic Publishers. Printed in the Netherlands.
385
ies prepared by different individuals �Sachidanandamet al. 2001�, have been also successfully used forgenotyping and for association studies.
SNPs are genetically co-dominant and well adaptedfor integration as informative markers into high reso-lution genetic maps �Cho et al. 1999; Lindblad-Tohet al. 2000�. They have a high level of potential au-tomation, which increases mapping efficiency�Landgreen et al. 1998�, and in some cases correlatewith non-conservative amino acid changes which leadto phenotypic variation and with the consequent de-velopment of reverse genetic screens �McCallum etal. 2000�.
There is also great potential for the use of SNPs inthe detection of associations between alleles and phe-notypes �Rafalski 2002�, such as for example theAPOE �2, �3, �4 alleles in Alzheimer’s disease �Ful-lerton et al. 2000�.
In higher plants, SNP development has not yet beensufficiently implemented, although Arabidopsis map-ping �Cho et al. 1999� highlights the effectiveness ofthe technique. SNP analysis in barley �Kanazin et al.2002�, maize �Tenaillon et al. 2001�, soybean �Zhu etal. 2003� and sugar beet �Schneider et al. 2001� re-veals the frequent occurrence of SNPs and the exist-ence of intragene haplotypes.
The grapevine �Vitis vinifera L.� is one of the mostimportant crops in Mediterranean areas, widespreadin temperate climates and its cultivation is increasingrapidly in different parts of the world. Despite this, asfor most perennial woody plants, not much is knownabout the molecular basis of grapevine genetics andbreeding. Recently, molecular maps have been devel-oped �Dalbo’ et al. 2000; Doligez et al. 2002; Grandoet al. 2003; Fischer et al. 2003; Riaz et al. 2003� cov-ering most of the 475 Mb of the grapevine genome�Lodhi et al. 1995� and stimulating, for the crop, thestart of a new era of marker assisted breeding.
To evaluate the potential use of SNP detection formolecular marker development we are currentlyscavenging the grapevine genome using an EST-can-didate gene approach. A few hundred ESTs belongingto metabolic pathways of interest in terms of grape-vine quality and resistance to disease �sugar metabo-lism, cell signalling, anthocyanin synthesis anddefence related� have been selected. For a subset of50 genes the occurrence of SNPs has been determinedby SSCP analysis in a set of nine genotypes of Vitisvinifera cvs, Vitis riparia and interspecific hybridsparents of five inter- and intra-specific crossing popu-lations. Furthermore, a comparison between the
results obtained by SSCP and the re-sequencing ap-proaches has been performed in the same nine geno-types, considering 25 gene fragments chosen ran-domly from among the 50 genes named above. Thefrequency of SNPs, efficiency of SSCP detection asopposed to re-sequencing polymorphism detectionand the existence and extent of allelic haplotypeshave been determined.
Materials and methods
Plant material
Seven clones of Vitis vinifera L. �cvs ‘Regent’,‘Lemberger’, ‘Moscato bianco’, ‘Teroldego ro-taliano’, ‘Riesling italico’, ‘Pinot noir’, ‘Syrah’�, theclone ‘Freiburg 993-60’ �a complex genotype derivedfrom multiple crosses also involving wild speciessuch as V. rupestris and V. lincecumii; this clone canbe considered, to a certain extent, as a different spe-cies to V. vinifera� and a clone of Vitis riparia Mchx.accession Wr 63 were chosen because they are theparents of five inter- and intra-specific mappingpopulations. In the tables and throughout the paperthe nine genotypes listed above are indicated with theabbreviations M �Moscato�, R �Vitis riparia�, F�Freiburg 993/60�, T �Teroldego�, Ri �Riesling�, P�Pinot�, S �Syrah�, Re �Regent� and Le �Lemberger�.These clones have been used to evaluate the degreeof molecular polymorphisms within and between Vi-tis species. Regent and Lamberger were used at theInstitute of Grapevine Breeding �Geilweilerhof, Ger-many� to generate an F1 population which segregatesdue to resistance to fungal pathogens and other agro-nomic traits. The other seven clones are the parentsof four F1 populations created by the Istituto Agrariodi San Michele all’Adige �Trento, Italy�, to be usedin grapevine marker development and in mappingprograms for resistance and quality traits. In the F1mapping populations, the segregating polymorphicloci are those heterozygous in the parental genopypes.These polymorphisms were partially scored using asmall subset of F1 populations. Following thisapproach, the allelic haplotypes were verified by se-quencing randomly selected amplicons of the segre-gating populations.
386
Extraction of genomic DNA, PCR primers design,PCR amplification
DNA was extracted from leaf tissues of a single plantaccording to Thomas et al. �1993� or Doyle and Doyle�1990�. Based on cDNA sequences from internal da-tabase, 50 gene fragments belonging to 4 functionalclasses were selected: sugar metabolism, cell signal-ling, anthocyanin metabolism and defence related.Gene homology was compared to that of knowngenes present in the public database. Primers weredesigned using Primer3 software �Rozen and Ska-letsky, 2000� with the scope of amplifying fragments300-500 bp long. Primer pairs, putative function andpredicted and obtained fragment size are available atthe web site address www.ismaa.it/GenomVit_B.htm.PCR primers were used to amplify genomic DNA ofthe 9 genotypes. Those primer sets which producedwhat appeared to be a single product were selectedfor further testing. Those that produced no ampliconsor multiple amplicons were further examined usinglower annealing temperatures or higher Mg2� �thosegiving no amplicons� or higher annealing temperatureor lower Mg2� �those giving multiple amplicons�.After this analysis the products from those primer setsproducing what appeared to be a single ampliconwere selected for sequence analysis. All selectedgenes, currently under mapping, had the SNP segre-gating ratio expected from the genotype of the par-ents �data not shown�. For each marker, a few ng ofgenomic DNA were amplified in a PCR reaction con-taining 0.2 mM dNTPs, 1.5 mM MgCl2, 0.2 mM ofeach primer and 0.2 U Taq DNA polymerase �Biotaq,Duotech or Roche, Mannheim, Germany�. Theamplification protocol consisted of 35 cycles of 45 sat 94 °C, 30 s at 55 to 60 °C and 90 s at 72 °C, pre-ceded by denaturation of 4 mins. at 94 °C andfollowed by a 10 min. extension at 72 °C.
SSCP on non-denaturing gel electrophoresis andDNA re-sequencing
Two methods were adopted in polymorphism detec-tion: SSCP �single sequence conformational polymor-phism� and DNA re-sequencing. SSCP was per-formed as in Schneider et al. �1999�, using 0.4 mmthick MDE �Mutation Detection Enhancement� gel�Cambrex Bio Science, USA� or SERDOGEL SSCP�Serva, Heidelberg, Germany�. Gels were fixed to oneglass plate by treating with 0.02% of g-methacrylox-ypropyltrimethoxysilane �Sigma, Milan� in ethanol.
The second plate was covered with repell-silane ES�Amersham Biosciences, Monza, Italy or Freiburg,Germany�. When PCR fragments exceeded 300 bp,they were digested with frequent cutter enzymes�AluI, DdeI, RsaI, HinfI alternatively, MBI Fermen-tas, Milan, Italy� before loading to generate fragmentsmore suitable for SNP detection �Sheffield et al.1993�. Electrophoresis gels of 20 � 20 cm were runat 140 V for 12-15 h and DNA fragments were visua-lised by silver staining �Sanguinetti et al. 1994�.SSCP analysis was performed on all the 50 genefragments in the 9 genotypes.
Re-sequencing of PCR products was performed on25 randomly chosen sequences �among the 50 genefragments used for SSCP analysis� in the 9 genotypes.PCR products were checked on agarose gels, singlebands were purified with exonuclease I and ShrimpAlcaline Phosphatase and directly sequenced fromboth ends to assure accurate sequence determination.An ABI 3700 capillary sequencer using BigDye ter-minator chemistry was employed to sequence �Ap-plied Biosystems, Monza, Italy�. In those cases inwhich the sequence traces appeared to be derivedfrom a single locus, analysis with Pregap4/Gap4 soft-ware from Staden Package �Bonfield et al. 1998� wasused to detect ambiguous base calls that appeared as‘heterozygous’.
Single-nucleotide polymorphism discovery
Methods for detecting mutations by direct sequenc-ing of DNA fragments are based on the alignment andcomparison of the fluorescent traces produced by theautomated sequencing device. DNA sequence analy-sis was performed using Pregap4/Gap4 software fromStaden Package. The software takes batches of tracedata from sequencing analysis and handles allprocessing except base calling �although it can em-ploy third party programs such as Phred for this pro-cess�. This includes file conversions, quality clipping,scanning for mutations and heterzygotes, multiple se-quence alignment, easy visual inspection of traces,production of reports, and the accumulation and stor-age of readings and traces. The two main programsare Pregap4 and Gap4. Pregap4 prepares data andGap4 is used to store the aligned readings, to viewthe sequences and traces, and to produce a report list-ing the observed mutations. Any number of sequencescan be processed in a single run, and for each samplethe operation generally involves two steps. First thetraces are aligned and compared to the reference
387
traces and any possible mutations or heterozygousbases are marked using Pregap4. Secondly, the datais transferred to a Gap4 database, using which userscan visually check the differences between the refer-ence and sample traces. All discrepancies were tabu-lated.
Nucleotide diversity, haplotype definition andpolymorphism information content
DNA variation was evaluated based on the nucleotidediversity � parameter �Nei and Li 1979�. The nucle-otide diversity at the level of a single gene representsthe proportion of nucleotides that differ between twosequences, averaged over all available pairs of geno-type comparisons. For each pair of genotypes, � �K/L, where K is the number of differences per nucle-otide site and L is the gene length in bp. The averagelevel of nucleotide diversity across different genefragments was calculated by dividing the total num-ber of variant sites by the total number of nucleotidessequenced �Li and Sadler 1991�. Allelic haplotypeswere defined by aligning the sequences of the ampli-fied fragments. Clark’s algorithm was applied to se-quenced PCR products for the computational deriva-tion of correct haplotypes �Clark 1990�. For eachgene studied and for each genotype, the combinationof alleles present at each site of polymorphism wasanalysed using this parsimony-based method whichgives a parsimony solution for the deduction of thehaplotypes in a sample set. The algorithm starts bysearching all homozygotes and single SNP heterozy-gotes, defining all clear haplotypes. Subsequently,haplotypes which were still unclear were resolved bycombining ambiguous sites from unsolved cases. Thischain of reasoning was continued until either all hap-lotypes had been recovered, or until no more newhaplotypes could be found. The algorithm fails to re-solve all the haplotypes which may occur if there is aheterozygous individual for two unique haplotypes ascompared to the other analysed genotypes. We wereinterested in deducing the correct number of haplo-types rather than defining them. This algorithm wasvery useful for the purpose, indeed we were able todeduce the total numbers of haplotypes present in ourpool, although for some genotypes it was impossibleto define the two correct alleles.
Polymorphism information content �PIC� indicatesthe capacity of a marker to reveal polymorphic lociin mapping experiments and in assisted breeding ap-proaches �Botstein et al. 1980�. The heterozygosity
was calculated as Nei and Tajima �1981� as H�1�
�ipi2 with �p2 being the sum of each squared allele
frequency. PIC was calculated as1��pi
2��i·j pi2pj
2 with �pi2 being the sum of each
squared allele ith frequency in the population.
Results
SSCP analysis and effıciency of SSCP detection
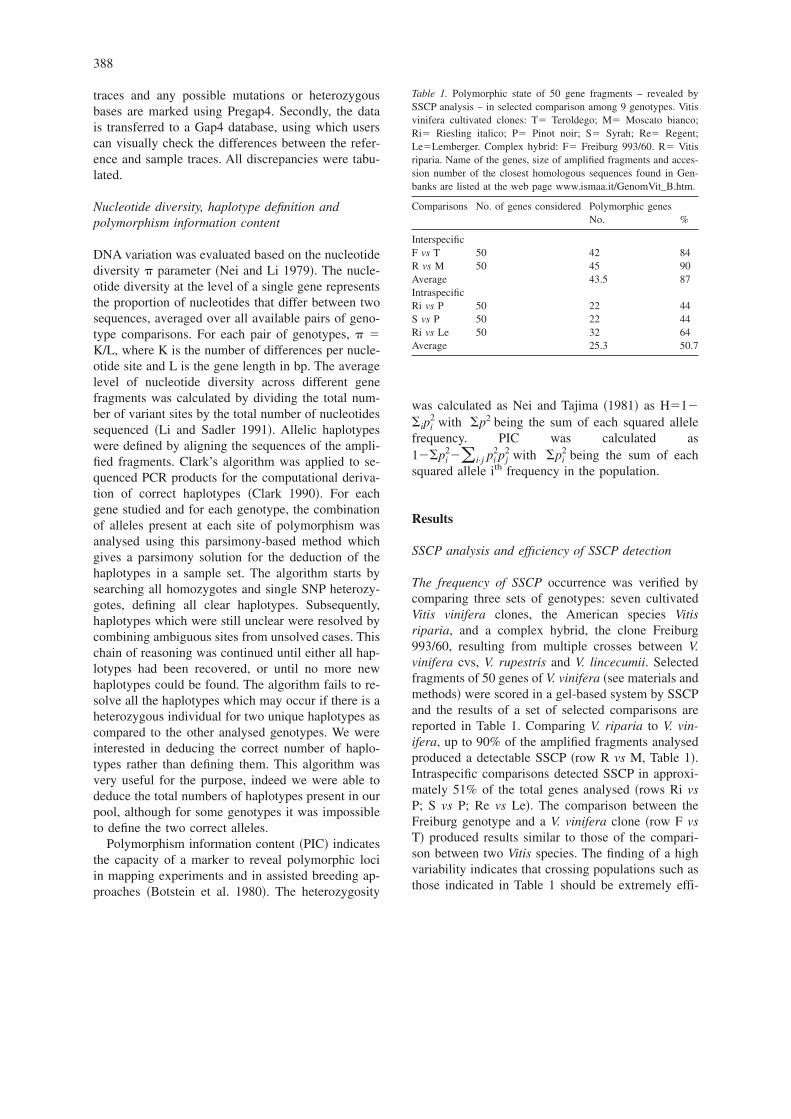
The frequency of SSCP occurrence was verified bycomparing three sets of genotypes: seven cultivatedVitis vinifera clones, the American species Vitisriparia, and a complex hybrid, the clone Freiburg993/60, resulting from multiple crosses between V.vinifera cvs, V. rupestris and V. lincecumii. Selectedfragments of 50 genes of V. vinifera �see materials andmethods� were scored in a gel-based system by SSCPand the results of a set of selected comparisons arereported in Table 1. Comparing V. riparia to V. vin-ifera, up to 90% of the amplified fragments analysedproduced a detectable SSCP �row R vs M, Table 1�.Intraspecific comparisons detected SSCP in approxi-mately 51% of the total genes analysed �rows Ri vsP; S vs P; Re vs Le�. The comparison between theFreiburg genotype and a V. vinifera clone �row F vsT� produced results similar to those of the compari-son between two Vitis species. The finding of a highvariability indicates that crossing populations such asthose indicated in Table 1 should be extremely effi-
Table 1. Polymorphic state of 50 gene fragments – revealed bySSCP analysis – in selected comparison among 9 genotypes. Vitisvinifera cultivated clones: T� Teroldego; M� Moscato bianco;Ri� Riesling italico; P� Pinot noir; S� Syrah; Re� Regent;Le�Lemberger. Complex hybrid: F� Freiburg 993/60. R� Vitisriparia. Name of the genes, size of amplified fragments and acces-sion number of the closest homologous sequences found in Gen-banks are listed at the web page www.ismaa.it/GenomVit_B.htm.
Comparisons No. of genes considered Polymorphic genesNo. %
InterspecificF vs T 50 42 84R vs M 50 45 90Average 43.5 87IntraspecificRi vs P 50 22 44S vs P 50 22 44Ri vs Le 50 32 64Average 25.3 50.7
388
cient for SSCP-based gene mapping. Moreover, theresults demonstrate that, in this genus, amplifying aDNA fragment �between 400 and 1000 nucleotides�and digesting it with restriction enzymes until a con-formational polymorphism is revealed, any genefragment could be easily mapped using between 1 and5 crossing populations.
When considering the nine genotypes and DNA di-gestion with frequent cutter enzymes, the recordedSSCP fragments showed a complex pattern of bands,revealing up to 8 SSCP alleles per locus. In caseswhen fragments were monomorphic when comparingtwo V. vinifera genotypes, the results were in part dueto limitations in the SSCP sensitivity procedure. Infact, as later revealed by DNA re-sequencing, therewere cases of polymorphic sites which did not affectDNA conformation, thus decreasing the SSCP detec-tion capacity. Finally, when the SSCP segregationswere controlled on F1 individuals derived from inter-specific crosses between the genotypes studied �datanot shown�, a mapping efficiency of 62% waspredicted. Considering that polymorphisms in F1 in-dividuals segregate only when at least one parent isheterozygous, 62% is a promising result in favour ofthe SSCP detection method. The potential of SNPsdiscovery based on the SSCP, considering also thelength of the amplified fragments and the number ofvariant alleles recorded, was 1.55 SSCPs for eachthousand base pairs, indicating, for a genome size of475 Mb, the existence of 7.4 � 105 loci detectable bySSCP analysis.
The effıciency of SSCP, in comparison with re-se-quencing �an approach revealing 100% of polymor-phic sites�, was considered using analysis of the 25gene fragments randomly chosen among the 50 genefragments previously scored in 9 genotypes. TheSSCP detection efficiency was 65.2% of the total ef-fective polymorphisms present in the analysed se-quences. Moreover, when comparing to SSCP datathe total number of SNPs observed by resequencing,it was also evident that for each gene fragment morethan one SNPs was present in the SSCP alleles de-tected �data not shown�.
Nature and frequency of SNPs detected bysequencing
Sequence data used to study the efficiency of SSCPwas further used in the 9 genotypes to studyfrequency and type of SNPs, nucleotide diversity,haplotypes, and PIC-value. PCR amplified sequences
and the corresponding cDNAs were aligned to iden-tify exons and introns and DNA sequence variations.In total 11,629 nucleotides were scanned for each ofthe 9 genotypes, of which 7,653 deriving from exons.247 SNPs were found, 177 of which located in cod-ing regions �defined cSNPs; Table 2�. Almost 50% ofexon variations were positioned in the third positionof the codon, but a significant number of non-conser-vative amino acid exchanges were also detected. Wecategorised the SNPs according to their 5� to 3� ori-entation. Transitions �substitution between purines orbetween pyrimidines� and transversions �substitutionof a purine with a pyrimidine� were observed �Table2�. Sixty-one percent of the SNPs were transitions�SNP type 1 and 2 in Table 2�, although they repre-sented one third of the total possible type of muta-tions. Only three genes were found to be representedby a single or two alleles in the nine genotypes stud-ied: – an aldose-1-epimerase, a GHMyb9 �Myb-related protein� and a �-1,4-acetylglucosaminyltrans-ferase. Only one case of indel has been recorded.
The average value across all possible comparisons�Table 3� was 113.79 �77.70 in exons�. Consideringthe comparisons between the seven V. vinifera geno-types, 97.76 SNPs were detected �66.06 in exons�. Asexpected, these values increased in the comparisonsbetween the hybrid clone Freiburg 993/60 and V. vin-ifera clones �119.67; 83.41 in exons� or between theseven clones of V. riparia and V. vinifera �149.49;104.53 in exons� �Table 3�. When the total amount ofnucleotides sequenced is considered, the frequency ofpolymorphisms is one SNP for every 102.20 nucle-otides. On comparing two species the frequency de-creased to one for every 77.79 �R vs Cult�, which roseto one for every 118.95 in intraspecific comparison�Cult vs Cult�. The average level of nucleotide diver-sity across different genes ��-value� was calculatedby dividing the total number of variant sites �K� bythe total number of nucleotides sequenced �L�. Theaverage �-value, considering all genotypes, was 9.79� 10–3, which decreased to 8.41 � 10–3 when con-sidering the seven V. vinifera clones. The � � valuebetween V. riparia and V. vinifera was considerablygreater �12.85 � 10–3� as well as the average valuebetween the hybrid and V. vinifera clones �10.28 �
10–3�. The �-values were quite different fromfragment to fragment, ranging from 0.0 to 30.26 �
10–3 �data not shown�. More differences wereobserved in coding than in non-coding regions �� �10.15 � 10–3 in coding regions, higher than total �� 9.79 � 10–3�. The observed � in the coding region
389

Table 2. SNPs and indels in DNA sequences of 25 genes studied in nine genotypes. Transitions/transversions, corresponding SNP codonpositions and resulting amino acid changes are reported. cSNP � SNP in coding region. Type of SNPs: transitions 1 � C to T; 2 � G to Aexchanges; transvertions 3 � C to G; 4 � T to A; 5 � C to A; 6 � T to G exchanges. DNA fragments were sequenced on both sides; whenoverlapping was not reached, genes are highlighted in italics, indicating with � for and � rev the 5’ and the 3’ of the gene �e.g., CHI-forand CHI-rev, chalcone isomerase forward and reverse respectively�.
GENE Fragmentsize �bp�
Size of codingregion �bp�
Indels �bp� SNP tot cSNP SNP type Codon position
1 2 3 4 5 6 1 2 3 aa modified
CHI-for 598 409 0 5 2 1 2 1 0 1 0 0 2 0 2CHI-rev 550 387 0 8 2 4 3 0 0 1 0 0 0 2 0IA06 357 357 0 7 7 0 3 1 1 0 2 2 3 2 6IB02 481 481 0 19 19 3 8 0 3 4 1 6 4 9 11ID04 419 0 0 12 0 2 4 2 0 3 1 0 0 0 0IE04 425 425 0 15 15 6 1 1 2 3 2 4 6 5 12IF01-for 165 0 0 3 0 1 0 0 1 0 1 0 0 0 0IF01-rev 607 303 0 11 4 4 3 2 0 1 1 1 0 3 1IF08-for 554 335 0 4 3 1 1 1 0 0 1 1 0 2 0IF08-rev 565 170 0 6 2 1 3 1 1 0 0 0 0 2 0IG04 357 138 0 9 6 0 3 2 2 1 1 0 2 4 3IH09 565 565 L del 9 bp 5 5 3 2 0 0 0 0 1 0 4 1
F del 6 bpIIA02 405 108 0 8 5 3 1 1 2 1 0 2 1 2 3IIA05 190 190 0 9 9 3 0 1 0 3 2 2 1 6 4IIB05 533 203 0 20 12 6 6 1 2 3 2 5 4 3 11IIC08 418 418 0 12 12 6 2 0 1 1 2 2 0 10 2IIE02 329 329 0 11 11 6 2 2 1 0 0 4 6 1 10IIG05 258 258 0 1 1 0 1 0 0 0 0 0 0 1 0IIIB08 292 292 0 4 4 0 2 1 0 1 0 2 2 0 4IIIB09 934 174 0 10 1 1 5 1 2 0 1 0 1 0 1IIIC03 228 228 0 25 25 11 8 1 2 0 3 6 9 10 15IIIC08 232 161 0 3 2 0 1 1 1 0 0 1 0 1 1IIIC12 412 241 0 12 7 3 5 2 1 1 0 5 0 2 5IVG10 398 398 0 1 1 0 0 1 0 0 0 0 0 1 0IVH04 276 202 0 2 1 1 0 0 0 1 0 0 0 1 0IVH06 254 107 0 0 0 0 0 0 0 0 0 0 0 0 0IVH09 369 316 0 9 5 2 6 0 0 1 0 0 0 5 0UFGT 458 458 0 16 16 5 5 1 3 2 0 4 5 7 8Total�1� 11629 7653 2 247 177 73 77 24 25 28 20 48 46 83 100Total�2� 104661 68877
�1� No. of bp sequenced � genotype; �2� Total bp sequenced in 9 genoptypes.
Table 3. SNPs and cSNPs present in seven V. vinifera genotypes, V. riparia and the complex genotype Freiburg 993/60 �all genotypes�.Comparisons within cultivated clones �Cult vs Cult�, between cultivated clones and wild clones of V. riparia �R vs Cult�, between cultivatedclones and a complex hybrid �F vs Cult�, are reported. p values of Nei and Li �1979� have been also calculated. SNP frequency is indicatedas total number of nucleotide sequenced/average number of SNPs detected. Cult: V. vinifera genotypes.
Variation in sequenced fragment size Average values of nucleotide variation parameters
Comparisons fragment size of Total of Frequency �-value Total of Frequency �-valuesize coding SNPs found �nucl/SNPs� �10–3� cSNPs found �nucl/cSNPs� �10–3�
total coding
All genotypes from 165 to 934 bp from 0 to 565 bp 113.79 102.20 9.79 77.70 98.49 10.15Cult vs Cult “ “ 97.76 118.95 8.41 66.06 115.85 8.63R vs Cult “ “ 149.49 77.79 12.85 104.53 73.21 13.66F vs Cult “ “ 119.57 97.26 10.28 83.41 91.75 10.90
390
of the other mentioned comparisons were 8.63 � 10–3
among cultivars, 13.66 � 10–3 between V. riparia andV. vinifera, 10.90 � 10–3 between the hybrid and V.vinifera clones.
SNP haplotypes and haplotypes frequency
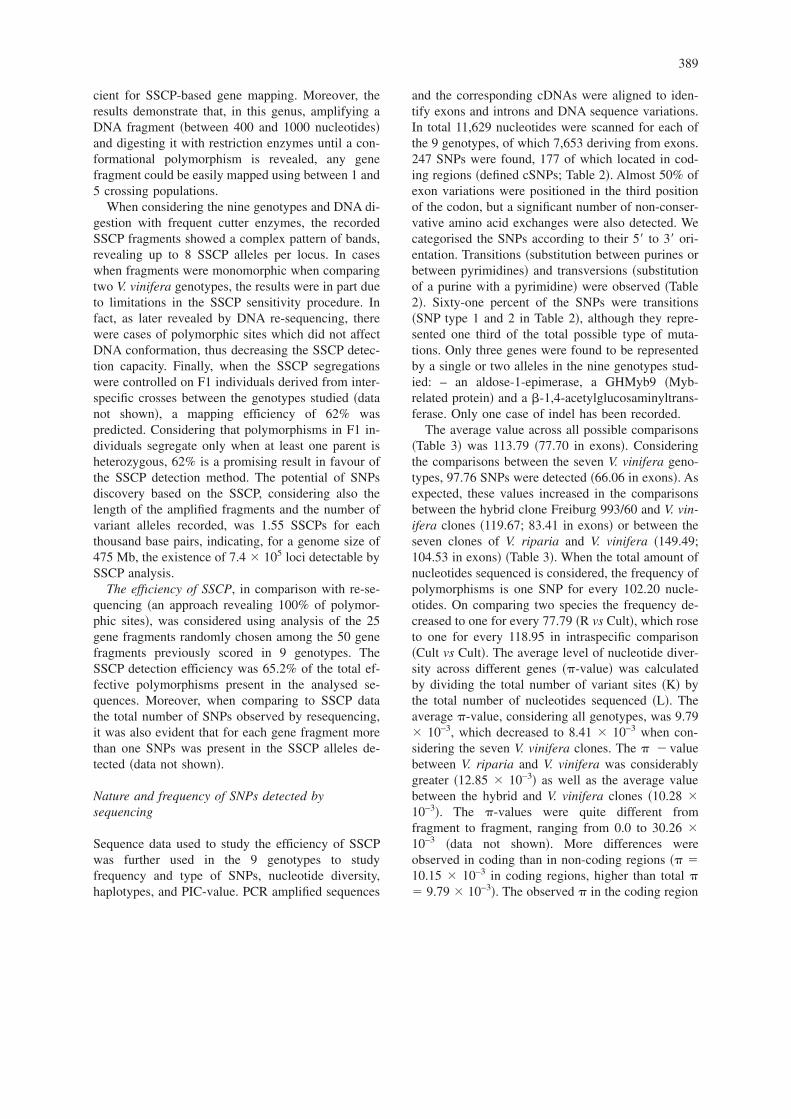
We analysed the distribution of SNP along the frag-ment genes to understand if nucleotide variability inthe genotypes considered was distributed randomlyalong the sequence or organised in haplotypes �seethe example given in Table 4�. Haplotypes were noteasy to identify. Indeed, the sequencing data alonewas difficult to interpret in terms of haplotype struc-ture because in a heterozygous genotype the phase oftwo adjacent SNPs was not immediately apparent. Forexample, if a locus had a C/T polymorphism and theadjacent locus a T/G one, it was not evident if the twohaplotypes were respectively represented by a C �atlocus 1� and T �at locus 2� �haplotype 1� and T �atlocus 1� and G �at locus 2� �haplotype 2�, or if theother two possible combinations were the correctones. The number of haplotypes was estimated usingClark’s algorithm �Clark 1990� �Table 4A�. In thisway we could deduce the total number of haplotypes,although for some it was not possible to determine the
correct allele using this algorithm. In the easiestcases, the correct haplotypes could be deduced bycomparing heterozygous with homozygous geno-types. Nevertheless, in the cases which were not re-solvable, we defined the haplotype status for the genefragment considered by recording their segregation insix F1 individuals derived from the crossing of twospecific genotypes �as reported for the gene IIe02 inTable 4B�. In most of the cases, for each gene weidentified a major haplotype �allele A in Table 5� anda fair number of haplotypes different from the first.The number of different haplotypes was determinedin each of the 25 genes and ranged from 1 to 10.Considering the average fragment size of 415 bp, theaverage number of SNPs per fragment was around 9and the gene diversity, based upon haplotypes, wasequal to 0.64. If we assume that SNPs are randomlyassociated within a gene in an infinitely large popu-lation there would be an average of about 29 possiblehaplotypes per gene fragment, of which a maximumof 18 could have been present in the 9 Vitis clones.Actually, without recombination or recurrent muta-tion, the number of haplotypes should be less than thenumber of SNPs �Clark et al. 1998; Fullerton et al.2000�. The number of haplotypes found was muchlower than 18: we detected an average of 6.04 haplo-
Table 4. A� Identification and frequency of haplotypes determined for the gene IIE02. Haplotypes were deduced by the Clark’s algorithm. B�:Example of haplotypes segregating for the genes IIE02. The haplotypic structure for the gene was obtained by comparing the DNA se-quences of two parental and six segregating F1 individuals. The table illustrates how the data of Table 5 were obtained and presented.
A�Haplotype Nucleotide position in the IIE02 gene Genotype Frequency �%�
112 167 226 236 250 266 275 291 316 329 390I T G C T A C T C G T T M,Rie,P,S,Re,T,F 38.9II T G C A G T C T G C T P,S,T 16.7III T G C T A C T C G T C L,Re 16.7IV T G G A G C C C C C T R,F 11.1V C A G A G C C T C C T R 5.6VI T G C A G T C C G C T M 5.6VII T G G A G C C C C C C Re 5.6
B�Genotype haplotypes Genotype haplotypes
Parental F I,II Parental Ri IParental T I,III Parental P I,IIF1: 134–21 I,III F1: 4–4 I,II121–21 II,III 4–15 I13–21 I 5–5 I15–21 I,II 5–9 I5–22 I,II 6–20 I,II20–22 I,III 6–22 I
391
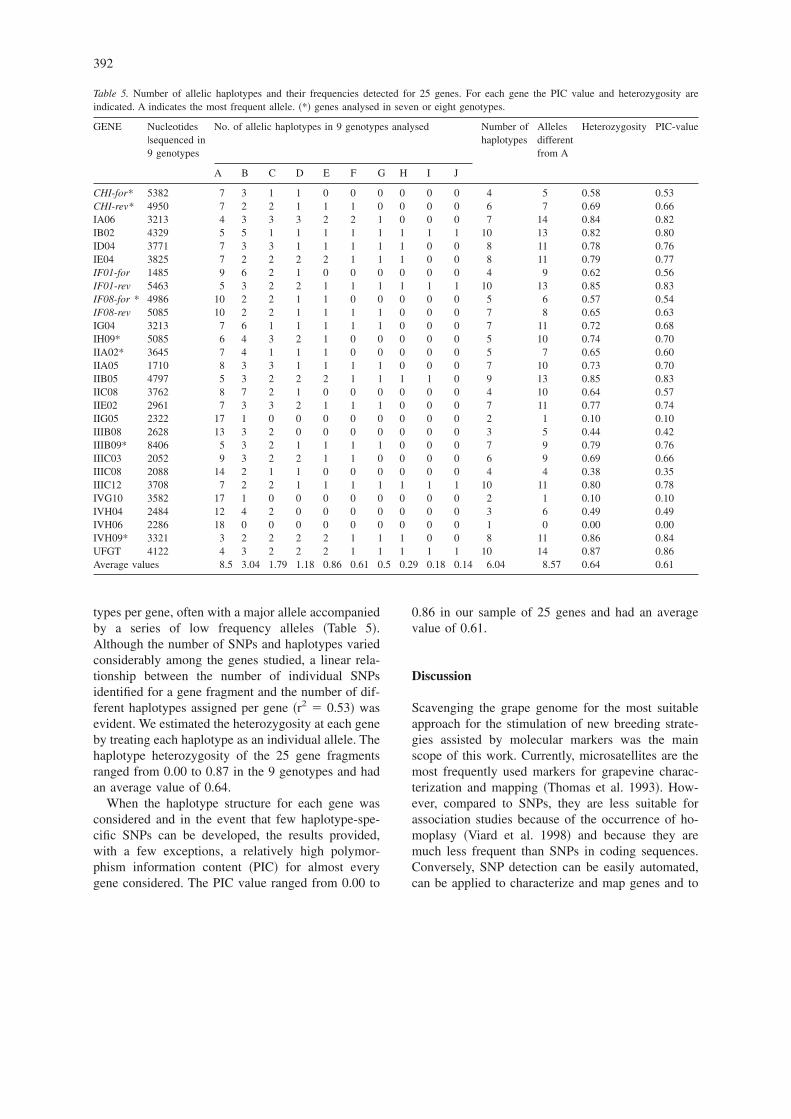
types per gene, often with a major allele accompaniedby a series of low frequency alleles �Table 5�.Although the number of SNPs and haplotypes variedconsiderably among the genes studied, a linear rela-tionship between the number of individual SNPsidentified for a gene fragment and the number of dif-ferent haplotypes assigned per gene �r2 � 0.53� wasevident. We estimated the heterozygosity at each geneby treating each haplotype as an individual allele. Thehaplotype heterozygosity of the 25 gene fragmentsranged from 0.00 to 0.87 in the 9 genotypes and hadan average value of 0.64.
When the haplotype structure for each gene wasconsidered and in the event that few haplotype-spe-cific SNPs can be developed, the results provided,with a few exceptions, a relatively high polymor-phism information content �PIC� for almost everygene considered. The PIC value ranged from 0.00 to
0.86 in our sample of 25 genes and had an averagevalue of 0.61.
Discussion
Scavenging the grape genome for the most suitableapproach for the stimulation of new breeding strate-gies assisted by molecular markers was the mainscope of this work. Currently, microsatellites are themost frequently used markers for grapevine charac-terization and mapping �Thomas et al. 1993�. How-ever, compared to SNPs, they are less suitable forassociation studies because of the occurrence of ho-moplasy �Viard et al. 1998� and because they aremuch less frequent than SNPs in coding sequences.Conversely, SNP detection can be easily automated,can be applied to characterize and map genes and to
Table 5. Number of allelic haplotypes and their frequencies detected for 25 genes. For each gene the PIC value and heterozygosity areindicated. A indicates the most frequent allele. �*� genes analysed in seven or eight genotypes.
GENE Nucleotides|sequenced in9 genotypes
No. of allelic haplotypes in 9 genotypes analysed Number ofhaplotypes
Allelesdifferentfrom A
Heterozygosity PIC-value
A B C D E F G H I J
CHI-for* 5382 7 3 1 1 0 0 0 0 0 0 4 5 0.58 0.53CHI-rev* 4950 7 2 2 1 1 1 0 0 0 0 6 7 0.69 0.66IA06 3213 4 3 3 3 2 2 1 0 0 0 7 14 0.84 0.82IB02 4329 5 5 1 1 1 1 1 1 1 1 10 13 0.82 0.80ID04 3771 7 3 3 1 1 1 1 1 0 0 8 11 0.78 0.76IE04 3825 7 2 2 2 2 1 1 1 0 0 8 11 0.79 0.77IF01-for 1485 9 6 2 1 0 0 0 0 0 0 4 9 0.62 0.56IF01-rev 5463 5 3 2 2 1 1 1 1 1 1 10 13 0.85 0.83IF08-for * 4986 10 2 2 1 1 0 0 0 0 0 5 6 0.57 0.54IF08-rev 5085 10 2 2 1 1 1 1 0 0 0 7 8 0.65 0.63IG04 3213 7 6 1 1 1 1 1 0 0 0 7 11 0.72 0.68IH09* 5085 6 4 3 2 1 0 0 0 0 0 5 10 0.74 0.70IIA02* 3645 7 4 1 1 1 0 0 0 0 0 5 7 0.65 0.60IIA05 1710 8 3 3 1 1 1 1 0 0 0 7 10 0.73 0.70IIB05 4797 5 3 2 2 2 1 1 1 1 0 9 13 0.85 0.83IIC08 3762 8 7 2 1 0 0 0 0 0 0 4 10 0.64 0.57IIE02 2961 7 3 3 2 1 1 1 0 0 0 7 11 0.77 0.74IIG05 2322 17 1 0 0 0 0 0 0 0 0 2 1 0.10 0.10IIIB08 2628 13 3 2 0 0 0 0 0 0 0 3 5 0.44 0.42IIIB09* 8406 5 3 2 1 1 1 1 0 0 0 7 9 0.79 0.76IIIC03 2052 9 3 2 2 1 1 0 0 0 0 6 9 0.69 0.66IIIC08 2088 14 2 1 1 0 0 0 0 0 0 4 4 0.38 0.35IIIC12 3708 7 2 2 1 1 1 1 1 1 1 10 11 0.80 0.78IVG10 3582 17 1 0 0 0 0 0 0 0 0 2 1 0.10 0.10IVH04 2484 12 4 2 0 0 0 0 0 0 0 3 6 0.49 0.49IVH06 2286 18 0 0 0 0 0 0 0 0 0 1 0 0.00 0.00IVH09* 3321 3 2 2 2 2 1 1 1 0 0 8 11 0.86 0.84UFGT 4122 4 3 2 2 2 1 1 1 1 1 10 14 0.87 0.86Average values 8.5 3.04 1.79 1.18 0.86 0.61 0.5 0.29 0.18 0.14 6.04 8.57 0.64 0.61
392
define haplotypes �Rafalski 2002�. The increasingnumber of gene sequences available in databases fa-cilitates the development of a high number of SNPmarkers in model as well as in crop plants.
In this paper we have considered genes participat-ing in sugar metabolism, cell signalling, anthocyaninand defence related pathways to study the possibilityof developing SNP markers for assisted breeding. Itis well known that molecular markers are particularlyuseful only when they have a high PIC value. In thissense, microsatellites are very popular because oftheir high average number of alleles, correspondingto PIC values of 0.6 in soybean �Powell et al. 1996�and 0.77 in maize �Taramino and Tingey 1996�. Asregards this, RFLP and AFLP have also been charac-terised in soybean �Powell et al. 1996�, and have beenshown to have a PIC value of 0.32 and 0.41 respec-tively. Similar parameters were 0.33 and 0.32 inwheat �Bohn et al. 1999� and in maize 0.56 for RFLP�Taramino and Tingey 1996�. In this paper, consider-ing 25 grapevine genes, the PIC values for the SNP-based haplotypes reached 0.86 with an average of0.61. In this sense, SNPs are highly informative whenthey are chosen and adopted to monitor intra-genehaplotypes. Similar results were obtained in sugarbeet �average PIC value of 0.47; Schneider et al.2001�.
Evaluating the possibility of proposing SNP mark-ers for large scale genome analysis and for markerassisted selection, we analysed both the frequency ofgrapevine polymorphisms and the capacity of specificdetection methods to reveal them. The SSCP and re-sequencing approaches were compared in terms ofefficiency and reproducibility. Re-sequencing allowedus to define haplotypes and to propose their use incandidate gene approaches. The SSCP technique re-vealed polymorphisms with a frequency of 1.55 �
10–3, depending on the size of the PCR amplicons andthe number of frequent cutter enzymes used �4 in thispaper�. As expected, SSCP detection was confirmedby re-sequencing. Comparing the ability of SSCP toreveal the SNPs detected by re-sequencing, an effi-ciency of 65.2% was obtained, which would suggesta wider use of the SSCP approach, particularly con-sidering the difference between the two procedures interms of cost. Moreover, recent enhancement in SSCPanalysis is making this technology more sensitive�Hayashi 1999�. Of course, due to the high frequencyof SNP in the grapevine genome, a reduced efficiencyof the SSCP procedure was expected, because mul-tiple bp substitutions present on the same fragment
amplified by PCR are seen as single bands in theSSCP analysis. On the other hand, such distinct SSCPbands have the potential to be highly predictive of theallelic haplotype state at polymorphic loci.
As relatively little is known about the pattern ofDNA sequence variation among grapevine varietiesand different species of Vitis, a systematic discoveryof gene-based sequence variation was undertaken. Intotal, when comparing nine genotypes �seven V. vin-ifera clones, a clone with a complex pedigree and aV. riparia clone�, 247 polymorphic sites in 11629 bpof genomic sequence were discovered with an aver-age of one SNP for every 47 bases �11629 total bp/247 total SNPs�. Considering pairs of genotypes, ourdata showed a frequency of one SNP for every 77.79nucleotides when comparing the two species Vitisvinifera and Vitis riparia; one for every 97.26 nucle-otides when comparing the clone Freiburg 993-60with V. vinifera; and, finally, all the 118.95 nucle-otides when two V. vinifera cultivars were compared.In the V. vinifera genome, the frequency of variantgenotypes which can be extrapolated considering asize of 475 Mb �Lodhi et al. 1995� can be estimatedto affect 4 � 106 SNP loci in a random comparison.These parameters are comparable to the values foundin other plant species such as sugar beet �Schneideret al. 2001� and soybean �Zhu et al. 2003�. More dif-ferences were observed in coding than in non-codingregions �7653/177 � 23.1 SNPs per kb vs 3976/70 �17.6; � � 10.15 in coding region, higher then total �� 9.79�. This nucleotide diversity might be indicativeof the regulatory or splicing function of the noncod-ing perigenic sequence. When only the coding regionsare considered, out of 177 polymorphic sites ob-served, 100 coded for an amino acid change and 77did not, of which half of the coding sequence SNPsresult in a non synonymous codon change. This find-ing should be a matter for further investigation, butalready some of these significant amino acid changescan be supposed to correspond to differences in pro-tein parameters, thus contributing to the extensivephenotypic variability observed between V. viniferacultivars. Gene fragments were selected to search fordefined haplotype structures. A haplotype is the spe-cific combination of nucleotides, one for each of thepolymorphic sites on an individual chromosome�Stephens et al. 2001�. We observed an average ofapproximately 6.04 different haplotypes per gene,which was about 0.7 times the number of individualSNPs identified per gene. Based on these data, therewas no evidence of frequent intragenic recombination
393
or recurrent mutation. As expected, the genotypesconsidered presented a high level of heterozygosity.When grapevine genes will be fully characterized, itwill be interesting to correlate the haplotype combi-nations with phenotypical differences. In this sense,the use of haplotypes in mapping major QTLs by as-sociation should be considered �Thornsberry et al.2001�.
To summarise, SSCP is a useful and relatively ef-ficient tool for SNP detection. In our experience,SSCP analysis can be applied in all laboratories forextensive screening of markers as well as for assistedselection and molecular mapping. In addition, haplo-type definition could strongly support alternatives totraditional mapping such as candidate gene ap-proaches and extensive association mapping.
Acknowledgements
This work has been supported by the Casse di Ris-parmio di Trento e Rovereto Foundation. Particularthanks to Mrs. Rosalba Grillo for her technical sup-port.
References
Alleweldt G. 1997. Genetics of grapevine breeding. Progress inBotany 58: 441–454.
Bohn M., Utz F. and Melchinger A.E. 1999. Genetic similaritiesamong winter wheat cultivars determined on the basis of RFLPs,AFLPs and SSRs and their use for predicting progeny variance.Crop Sci. 39: 228–237.
Bonfield J.K., Rada C. and Staden R. 1998. Automated detectionof point mutations using fluorescent sequence trace subtraction.Nucleic Acids Res. 26: 3404–3409.
Botstein D., White R.L., Skolnick M. and Davis R.W. 1980. Con-struction of a genetic linkage map in man using restriction frag-ment length polymorphisms. Am. J. Hum. Genet. 32: 314–331.
Cho R.J., Mindrinos M., Richards D.R., Sapolsky R.J., AndersonM., Drenkard E., Dewdney J., Reuber T.L., Stammers M., Fed-erspiel N., Theologies A., Yang W.H., Hubbell E., Au M., ChungE.Y., Lashkary D., Lemieux B., Dean C., Lipshutz R.J., AusubelF.M., Davis R.W. and Oefner P.J. 1999. Genome-wide mappingwith biallelic markers in Arabidopsis thaliana. Nature Genet. 23:203–207.
Clark A.G. 1990. Inference of haplotypes from PCR-amplifiedsamples of diploid populations. Mol. Biol. Evol. 7: 111–122.
Clark A.G., Weiss K.M., Nickerson D.A., Taylor S.L., BuchananA., Stengård J., Salomaa V., Vartiainen E., Perola M.,Boerwinkle E. and Sing C.F. 1998. Haplotype structure andpopulation genetic inferences from nucleotide-sequence varia-tion in human lipoprotein lipase. Am. J. Hum. Genet. 63: 595–612.
Collins F.S., Brooks L.D. and Chakravarti A. 1998. A DNA poly-morphism discovery resource for research on human geneticvariation. Genome Res. 8: 1229–1231.
Dalbo’ M.A., Ye G.N., Weeden N.F., Steinkellner H., Sefe K.M.and Reisch B.I. 2000. Gene controlling sex in grapevine placedon a molecular marker-based genetic map. Genome 43�2�: 333–340.
Doligez A., Bouquet A., Danglot Y., Lahogue F., Riaz S., MeredithC.P., Edwards K.J. and This P. 2002. Genetic mapping of grape-vine �Vitis vinifera L.� applied to the detection of QTLs forseedlessness and berry weight. Theor. Appl. Genet. 105: 780–795.
Doyle J.J. and Doyle J.L. 1990. Isolation of plant DNA from freshtissue. Focus Biotech. 12: 13–15.
Fischer B.M., Salakhutdinov I., Akkurt M., Eibach R., EdwardsK.J., Topfer R. and Zyprian E.M. 2003. Quantitative trait locusanalysis of fungal disease resistance factors on a molecular mapof grapevine. Theor. Appl. Genet. Oct. 22: 000.
Fullerton S.M., Clark A.G., Weiss K.M., Nickerson D.A., TaylorS.L., Stengard J.H., Salomaa V., Vartiainen E., Perola M., Boer-winkle E. and Sing C.F. 2000. Apolipoprotein E variation at thesequence haplotype level: implications for the origin and main-tenance of a major human polymorphism. Am. J. Hum. Genet.67: 881–900.
Grando M.S., Bellin D., Edwards K.J., Pozzi C., Stefanini M. andVelasco R. 2003. Molecular linkage maps of Vitis vinifera andVitis riparia. Theor. Appl. Gen. 106: 1213–1224.
Hayashi K. 1999. Recent enhancements in SSCP. Genetic Analy-sis: Biomolecular Engineering 14: 193–196.
Kanazin V., Talbert H., See D., DeCamp P., Nevo E. and Blake T.2002. Discovery and assay of single-nucleotide polymorphismsin barley �Hordeum vulgare�. Plant Mol. Biol. 48: 529–537.
Landgreen U., Nilsson M. and Kwok P.Y. 1998. Reading bits ofgenetic information. Methods for single nucleotide polymor-phism analysis. Genome Res. 8: 769–776.
Li W.H. and Sadler L.A. 1991. Low nucleotide diversity in man.Genetics 129: 513–523.
Lindblad-Toh K., Wibchester E., Daly M.J., Wang D.G., HirchhornJ.N., Laviolette J.P., Ardlie K., Reich D.E., Robinson E., SklarP., Shah N., Thomas D., Fan J.B., Gigeras T., Warrington J., Pa-til N., Hudson T.J. and Lander E.S. 2000. Large-scale discoveryand genotyping of single-nucleotide polymorphisms in themouse. Nature Genet. 24: 381–386.
Lodhi M.A. and Reisch B.I. 1995. Nuclear DNA content of Vitisspecies, cultivars, and other genera of the Vitaceae. Theor. Appl.Genet. 90: 11–16.
McCallum C.M., Comai L., Greene E.A. and Henikoff S. 2000.Targeted screening for induced mutations. Nature Biotech. 18:455–457.
Nei M. and Li W.H. 1979. Mathematical model for studying ge-netic variation in terms of restriction endonucleases. Proc. Natl.Acad. Sci. USA 76: 5269–5273.
Nei M. and Tajima F. 1981. DNA polymorphism detectable by re-striction endonucleases. Genetics 97: 145–163.
Orita M., Iwahana H., Kanazawa H., Hayashi K. and Sekiya T.1989. Detection of polymorphisms of human DNA by gel elec-trophoresis as single strand conformational polymorphisms.Proc. Natl. Acad. Sci. USA 86: 2766–2770.
Powell W., Morgante M., Andre C., Hanafey M., Vogel J., TingeyS.D. and Rafalsky A. 1996. The comparison of RFLP, RAPD,
394
AFLP and SSR �microsatellite� markers for germplasm analysis.Mol. Breed. 2: 225–238.
Rafalski A. 2002. Application of single nucleotide polymorphismsin crop genetics. Curr. Op. Plant Biol. 5: 94–100.
Riaz S., Dangl G.S., Edwards K.J. and Meredith C.P. 2003. A mi-crosatellite based framework linkage map of Vitis vinifera L.Theor. Appl. Genet. Nov 6: 000.
Rozen S. and Skaletsky H.J. 2000. Primer3 on the WWW for gen-eral users and for biologist programmers.. In: Krawetz S., Mis-ener S. �eds�, Bioinformatics Methods and Protocols: Methodsin Molecular Biology. Humana Press, Totowa, New Jersey, pp.365-386.
Sanguinetti C.J., Dias Neto E. and Simpson A.J. 1994. Rapid sil-ver staining and recovery of PCR products separated on poly-acrylamide gels. Biotechniques 17: 914–21.
Sachidanandam R., Weissman D., Schmidt S.C., Kakol J.M., SteinL.D., Marth G., Sherry S., Mulikin J.C., Mortimore B.J. andWilley D.L. 2001. A map of human genome sequence variationcontaining 1.42 million single nucleotide polymorphisms.Nature 409: 928–933.
Sheffield V.C., Beck J.S., Kwitek A.E., Sandstrom D.W. and StoneE.M. 1993. The sensitivity of single strand conformational poly-morphism analysis for the detection of single base substitutions.Genomics 16: 325–332.
Schneider K., Borchardt D., Schaefer-Pregl R., Nagl N., Glass C.,Jeppson A., Gebhardt C. and Salamini F. 1999. PCR-based clon-ing and segregation analysis of functional gene homologues inBeta vulgaris. Mol. Gen. Genet. 262: 515–524.
Schneider K., Weisshaar B., Borchardt D.C. and Salamini F. 2001.SNPs frequency and allelic haplotype structure of Beta vulgarisexpressed genes. Mol. Breed. 8: 63–74.
Stephens J.C., Schneider J.A., Tanguay D.A., Choi J., Acharya T.,Stanley S.E., Jiang R., Messer C.J., Chew A., Han J.H., Duan J.,
Carr J.L., Lee M.S., Koshy B., Kumar A.M., Zhang G., NewellW.R., Windemuth A., Xu C., Kalbfleisch T.S., Shaner S.L., Ar-nold K., Schulz V., Drysdale C.M., Nandabalan K., Judson R.S.,Ruano G. and Vovis G.F. 2001. Haplotype variation and linkagedisequilibrium in 313 human genes. Science 293: 489–493.
Taramino T. and Tingey S.D. 1996. Simple sequence repeats forgermplasm analysis and mapping in maize. Genome 39: 277–287.
Thomas M.R., Matsumoto S., Cain P. and Scott N.S. 1993. Repeti-tive DNA of grapevine: classes present and sequences suitablefor cultivar identification. Theor. Appl. Genet. 86: 286–289.
Thornsberry J.M., Goodman M.M., Doebley J., Kresovich S.,Nielsen D. and Buckler E.S. 2001. Dwarf8 polymorphisms as-sociate with variation in flowering time. Nat. Genet. 28: 286–289.
Tenaillon M.I., Sawkins M.C., Long A.D., Gaut R.L., Doebley J.F.and Gaut B.S. 2001. Patterns of DNA sequence polymorphismalong chromosome 1 of maize �Zea mays ssp. Mays L�. Proc.Natl. Acad. Sci. USA 98: 9161–9166.
Viard F., Frank P., Dubois M.P., Estoup A. and Jarne P. 1998. Vari-ation of microsatellite size homoplasy across electromorphs,loci, and populations in three invertebrate species. J. Mol. Evol.47: 42–51.
White M.B., Carvalho M., Derse D., O’Brien S.J. and Dean M.1992. Detecting single base substitutions as heteroduplex ploy-morphisms. Genomics 12: 301–305.
Zhu Y.L., Song Q.J., Hyten D.L., Van Tassel C.P., MatukumalliL.K., Grimm D.R., Hyatt S.M., Fickus E.W., Young N.D.,Cregan P.B. 2003. Single-Nucleotide Polymorphisms in Soy-bean. Genetics 168: 1123–1134.
395