Embed Size (px)
Citation preview
Genetics and Genomics of Light Response adaptation in Arabidopsis thaliana
Justin BorevitzEcology & EvolutionUniversity of Chicagohttp://naturalvariation.org/

Widely Distributed
http://www.inra.fr/qtlat/NaturalVar/NewCollection.htm
Olivier Loudet

Talk Outline
• Wild Collections– Local Population Sampling/ structure
• Seasonal Growth Chambers– KasC/ VanC RILs
• Whole Genome SNP/Tiling Arrays
– Single Feature Polymorphisms (SFPs)
– 5-Methylcytosine, the 5th base
– Potential deletions/ Copy Number Variants
– Aquilegia
Talk Outline
• Wild Collections– Local Population Sampling/ structure
• Seasonal Growth Chambers– KasC/ VanC RILs
• Whole Genome SNP/Tiling Arrays
– Single Feature Polymorphisms (SFPs)
– 5-Methylcytosine, the 5th base
– Potential deletions/ Copy Number Variants
– Aquilegia

Local Population Variation

Local adaptation
under strong
selection

Seasonal Variation
Matt Horton
Megan Dunning

Collections• 807 Lines from 25 Midwest Populations
– (Diane Byers IL state) – growing!
• 1101 Lines from UK, 51 populations– (Eric Holub Warwick, UK) – growing!
• > 500 lines N and S Sweden (Nordborg)• > 400 Lines France and Midwest (Bergelson)• 400 lines Midwest (Borevitz)• 857 Accessions stock center (Randy Scholl)
– Others welcome…
Will be genotyped with Sequenom 149 SNPs $0.03 per

Variation within a field (web link)

Within and Between Variation
• BAKKER, E. G., STAHL, E. A., TOOMAJIAN, C., NORDBORG, M., KREITMAN, M. & BERGELSON, J.Distribution of genetic variation within and among local populations of Arabidopsis thaliana over its species range.Molecular Ecology 15 (5), 1405-1418.

ME
26
ME
27
KN
15
PN
A 3
3P
NA
37
RM
X 5
5P
2 4
4R
MX
58
RM
X 5
7R
MX
56
P2
51
P2
50
P2
49
P2
47
P2
46
P2
45
ME
30
ME
29
KN
18
KN
17
KN
16
DM
2 9
DM
2 8
DM
2 7
DM
2 4
DM
2 1
DM
2 2
ME
24
ME
28
KN
20
KN
13
KN
14
KN
11
KN
19
ME
31
ME
32
RM
X 5
9R
MX
61
ME
25
ME
23
PN
A 4
0P
2 4
3K
N 1
2D
M2
3D
M2
5M
E 2
1P
NA
42
PN
A 3
9P
NA
38
PN
A 3
5P
NA
36
RM
X 5
3P
NA
41
RM
X 5
4 P2
48
DM
2 6
DM
2 1
0P
NA
34
ME
22
RM
X 6
2R
MX
52
RM
X 6
0
02
46
8
hclust (*, "complete")
He
igh
t
48 Non singleton SNPs of 87 tested Megan Dunning, poster #268
Local Population Structure in the Midwest

2-3
a_
A0
7P
f-0
_E
06
Jet-
0_
H0
1R
RS
-7_
E1
0G
OT
-7_
C0
9L
er_
D0
9B
ay-
0_
D0
1C
al-
0_
G0
9B
ur-
0_
C0
7B
ur-
0_
E0
3K
en
d-L
_H
07
RR
S-1
0_
E1
2E
n-1
_E
04
EC
48
_4
2_
H1
2E
C4
8_
29
_H
11
EC
48
_2
4_
H0
9E
C4
8_
26
_H
10
NIL
_H
04
Co
l-0
_H
06
Co
l-0
_D
12
Co
l-0
_E
11
Cvi
-0_
E0
9E
sc-0
_H
08
Sa
e-0
_G
11
Ll-
2_
E0
5T
s-1
_D
04
Bla
-1_
B0
7S
e-0
_B
11
SF
1_
G1
0 Hh
-0_
B0
8E
st-1
_D
03
Est
-1_
H0
5L
er-
1_
C1
0U
k-3
_H
03
4-1
a_
A1
1G
o-2
_E
02
Ei-
6_
D1
1T
su-1
_D
05
Bo
r-4
_C
12
Dra
-1_
D1
0S
ij-3
_G
08
Ba
s-1
_F
11
Sij-
1_
G0
7K
Z1
0_
B0
9S
ha
kda
ra1
_C
03
Sh
akd
ara
2_
C0
5K
ly-3
_E
08
Ko
z-1
_F
02
Kly
-1_
E0
7K
oz-
3_
F0
3R
ak-
1_
F0
9N
ov_
3_
F0
7R
ak-
3_
F1
0B
as-
3_
F1
2S
ER
_G
01
No
z_F
08
Ch
a-2
_G
03
Ma
s_G
05
Ch
a-1
_G
02
Le
b-3
_F
05
Pa
n_
G0
4B
ij-1
_G
06
Le
b-1
_F
04
No
v_1
_F
06
2-2
a_
A0
66
-7a
_B
04
Wc-
1_
E0
18
-1a
_B
06
2-1
a_
A0
5F
e-1
_C
02
C2
4_
D0
7B
r-0
_C
06
Mir
-0_
B1
2L
ov-
5_
F0
1H
au
-0_
G1
2M
rk-0
_B
10
An
g-1
_D
08
Nfa
-8_
D0
27
-1a
_B
05
1-3
a_
A0
41
-1a
_A
02
1-2
a_
A0
3F
ei-
0_
C1
1U
k-1
_H
02
5-3
a_
B0
25
-3a
_C
04
5-4
a_
B0
35
-2a
_B
01
5-1
a_
A1
23
-3a
_A
10
3-1
a_
A0
83
-2a
_A
09
Nc-
1_
C0
1V
an
-0_
D0
6
02
46
81
01
21
4
hclust (*, "complete")
He
igh
t
120 SNPs of 149 tested including inbred lines Norman Warthmann`
Global Population Structure

Regional/Seasonal Variation
• What is Local Adaptation?
• Predictable Seasonal changes unique to each location.
Tossa Del MarSpain
LundSweden

Seasons in the Growth Chamber
• Changing Day length• Cycle Light Intensity• Cycle Light Colors• Cycle Temperature
Sweden Spain
Seasons in the Growth Chamber
• Changing Day length
• Cycle Light Intensity
• Cycle Light Colors
• Cycle Temperature
Geneva Scientific/ Percival
Day Length
0:00
2:00
4:00
6:00
8:00
10:00
12:00
14:00
16:00
18:00
20:00
22:00
sep
oct
nov
dec
jan
feb
mar
apr
may jun jul
aug
month
hour
s
Sweden
Spain
standard
standard
Light Intensity
0
200
400
600
800
1000
1200
1400se
p
oct
nov
dec
jan
feb
mar
apr
may jun jul
aug
month
W/m
2
Sweden
Spain
standard
Temperature
-10
-5
0
5
10
15
20
25
30
35
sep
oct
nov
dec
jan
feb
mar
apr
may jun jul
aug
month
degr
ees
C
Spain High
Spain Low
Sweden High
Sweden Low
standard
Developmental Plasticity == BehaviorDevelopmental Plasticity == Behavior

Kurt Spokas
Version 2.0a June 2006
USDA-ARS Website Midwest Area (Morris,MN)http://www.ars.usda.gov/mwa/ncscrl

May 1-3rd

I II III IV V
NGA590.0446063542.4T1G116.5NGA639.74460731513.6
4460647619.8MSAT1.123.52160761529.0AthZFPG30.3NGA24833.6
4460796351.7T27K12-SP655.32160754056.12160706561.74460715265.02160705767.9NGA280 2160692871.62160746374.2
2160770083.4
MSAT1.1389.6
NGA69296.82160703099.344606525101.7
1
MSAT2.50.0
NGA11457.9446063229.9CIW213.0
44606142 2160703820.5MSAT2.3823.2
CIW330.42160725931.8THY-136.8PHYB42.74460772748.34460791450.7PLS753.2NGA112660.5MSAT2.4162.34460782468.32160715771.9NGA36175.2MSAT2.775.8NGA16878.34460681080.94460792285.94460676988.94460653391.2
90J19T799.1
2
NGA320.0216074791.9446066078.1446072839.8ATCHIB211.62160717514.14460708719.2Z3081723.0
4460672145.5GL149.52160749654.3
T0410967.2
4460638779.5
2160768385.0
4460633094.6R3002597.4NGA6 44606273101.7
3
MSAT4.390.0
CIW56.0446080288.44460662312.0
NGA821.74460795528.82160760633.7MSAT4.2536.8MSAT4.1545.12160751348.44460754549.8CD3-6952.2MSAT4.1854.32160739456.32160718459.24460628963.8MSAT4.967.5nga113968.14460668870.2MSAT4.3374.0NGA110777.9MSAT4.3779.4
4
446070460.0
446072347.7NGA22511.6NGA24921.02160740222.94460615925.34460724227.84460616729.6MSAT5.1432.24460669633.5NGA13935.82160714839.74460766844.8MSAT5.2249.94460633852.6MI13755.94460645267.4CIW968.8MSAT5.969.54460634670.74460776773.04460780877.3NGA12980.8MSAT5.1287.34460799593.54460650994.64460741399.7LFY3102.4M555111.0
5Genetic map of the Kas-1 x Col-gl1 RIL population
55 markers from Wolyn et al. (2004) & 64 additional SNP markers.

Sweden 1
Col-gl1
Kas1
Sweden 2
Col-gl1
Kas1
Spain 1
Col-gl1
Kas1
Spain 2
Col-gl1
Kas1
Distribution of flowering time among 96 Kas-1/Col-gl1 RILs
Num
ber
of R
ILs
Num
ber
of R
ILs

Kas/Col flowering time QTL
FRI
Chr3 Chr4 Chr5

Kas/Col flowering time QTL GxE
Chr4 FRI
Marker name Chr. position cM QTL QTL x Environment 2a* SE p-value 2a* SE p-value 21607030 chr1.27650179 99.3 -3.1 1.4 0.0353 0.0 2.0 0.9856 21607175 chr3.5140894 14.1 -2.5 1.3 0.0492 -0.7 1.8 0.6864 GL1 chr3.10361870 49.5 2.7 1.3 0.0435 -0.7 1.9 0.7145 MSAT4.39 chr4.89659 0 15.7 2.0 0.0000 -6.3 2.8 0.0289 44607955 chr4.5591486 28.8 3.8 1.3 0.0047 0.9 1.9 0.6497 44607234 chr5.1507224 7.7 2.2 1.4 0.1154 -1.8 1.9 0.3535 21607030 x MSAT4.39† chr1.27650179 x chr4.89659 - 6.6 2.9 0.0226 -1.7 4.0 0.6684 EnviSweden‡ - - 2.1 2.3 0.4586 - - -
1
Chr1 FLM Chr4 FRI

Environment and Epistasis
A B C

768 VanC AIL-RILs149 + 87 SNPsStock Center Release(Evadne Smith)
768 VanC AIL-RILs149 + 87 SNPsStock Center Release(Evadne Smith)
Van no mitochondrial insertion
FLC
Total Leaf Number
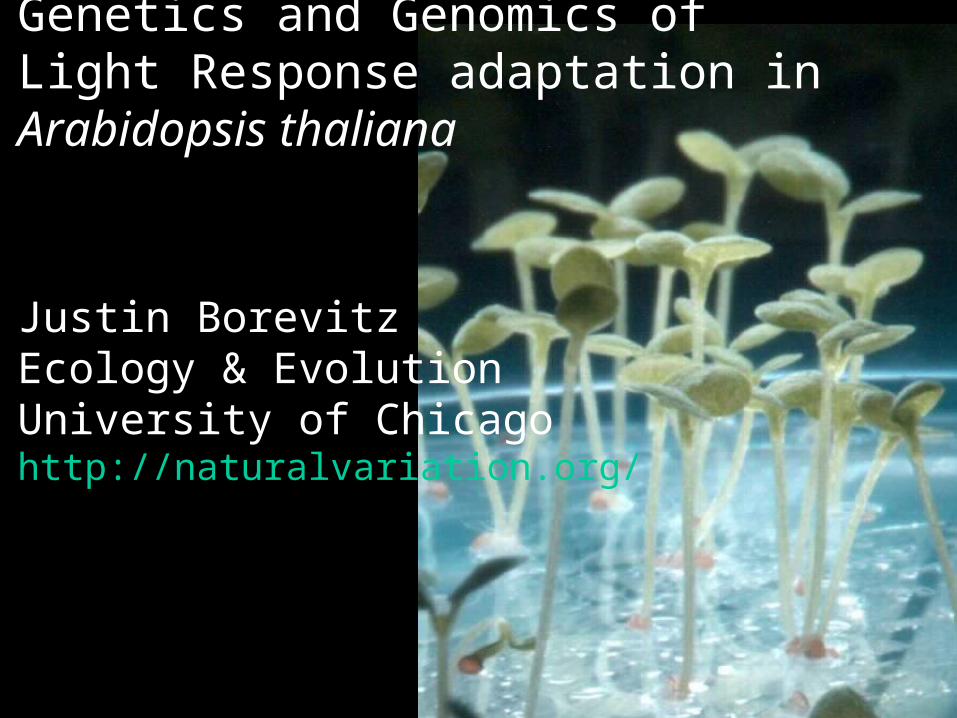
RNA DNA
Universal Whole Genome Array
Transcriptome AtlasExpression levelsTissues specificity
Transcriptome AtlasExpression levelsTissues specificity
Gene/Exon DiscoveryGene model correctionNon-coding/ micro-RNA
Gene/Exon DiscoveryGene model correctionNon-coding/ micro-RNA
Alternative SplicingAlternative Splicing
Comparative GenomeHybridization (CGH)
Insertion/DeletionsCopy Number Polymorphisms
Comparative GenomeHybridization (CGH)
Insertion/DeletionsCopy Number Polymorphisms
MethylationMethylation
ChromatinImmunoprecipitation
ChIP chip
ChromatinImmunoprecipitation
ChIP chip
Polymorphism SFPsDiscovery/Genotyping
Polymorphism SFPsDiscovery/Genotyping
Control for hybridization/genetic polymorphismsto understand TRUE expression variation
RNA ImmunoprecipitationRIP chip
RNA ImmunoprecipitationRIP chip
Antisense transcription
Allele Specific Expression

Which arrays should be used?
cDNA array
Long oligo array
BAC array

Which arrays should be used?
Gene array
Exon array
Tiling array35bp tile, 25mers 10bp gaps

Which arrays should be used?
Tiling/SNP array 2007 250k SNPs, 1.6M tiling probes
SNP array
Ressequencing array
How about multiple species? Microbial communities?

SNP SFP MMMMM MSFP
SFP
MMMMM M
Chromosome (bp)
con
serv
atio
n
SNP
ORFa
start AAAAA
Tra
nsc
ripto
me
Atla
s
ORFb
deletion
Improved Genome Annotation

Potential Deletions

Delta p0 FALSE Called FDR
1.00 0.95 18865 160145 11.2%
1.25 0.95 10477 132390 7.5%
1.50 0.95 6545 115042 5.4%
1.75 0.95 4484 102385 4.2%
2.00 0.95 3298 92027 3.4%
SFP detection Genotype effecton tiling arrays
Intergenic Exon intron
SFPs 60770 23519 17216
total 685575 665524 301648
% 8.86% 3.53% 5.71%
SFPs/gene 0 >=1 >=2 >=3 >=4 >=5
genes 16322 9146 4304 2495 1687 1121

Chip genotyping of a Recombinant Inbred Line
29kb interval

Methods for labeling• Extract genomic 100ng DNA (single leaf)• Digest with either msp1 or hpa2 CCGG• Label with biotin random primers• Hybridize to array• Fit model
0
1
2
3
4
5
6
hpaII mspI
log
inte
nsi
ty
col van col♂xvan♀ van♂xcol♀
Intensity(feature) ~ additive + dominance + maternal + enzyme + add:enz + dom:enz + mat:enz

SFPs and mSFPs
Total Sig Features
+ Sig Features
- Sig Features
Expected from Perm
FDR
additive 237978 91260 146718 2652 0.011
dominant 1039740 590975 448765 13338 0.013
maternal 1038 917 121 19 0.018
enzyme 58207 18968 39239 833 0.014
add : enz 74571 29391 45180 1040 0.014
dom : enz 7760 566 7194 81 0.010
mat : enz 63966 27517 36449 702 0.011
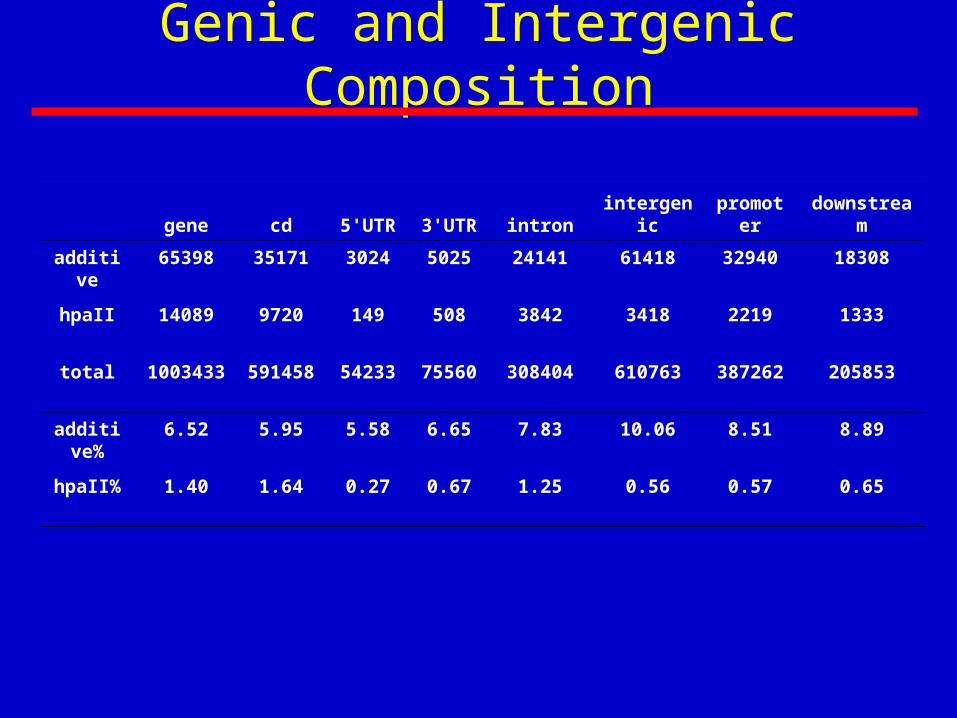
Genic and Intergenic Composition
gene cd 5'UTR 3'UTR intron intergenic promoter downstream
additive 65398 35171 3024 5025 24141 61418 32940 18308
hpaII 14089 9720 149 508 3842 3418 2219 1333
total 1003433 591458 54233 75560 308404 610763 387262 205853
additive%
6.52 5.95 5.58 6.65 7.83 10.06 8.51 8.89
hpaII% 1.40 1.64 0.27 0.67 1.25 0.56 0.57 0.65

CC*GG
ColColColVanVanVan
Col♂ x Van♀ Col♂ x Van♀ Van ♂ x Col ♀ Van ♂ x Col ♀Van ♂ x Col ♀
CC*GG
histidine kinase (AHK3) exon9
CC*GG
0
1
2
3
4
5
6
hpaII mspI
log
in
ten
sit
y
col van col♂xvan♀ van♂xcol♀
EpiTyper CmG

ColColColVanVanVan
Col♂ x Van♀Col♂ x Van ♀
Van♂ x Col♀Van ♂ x Col ♀Van♂ x Col ♀
CC*GG
chromomethylase 2 (CMT2) exon19
0
1
2
3
4
5
6
hpaII mspI
log
in
ten
sit
y
col van col♂xvan♀ van♂xcol♀
CC*GG
mQTL?
EpiTyper CmG

Copy Number Variation (Potential Deletions)
>500 potential deletions45 confirmed by Ler sequence
23 (of 114) transposons
Disease Resistance(R) gene clusters
Single R gene deletions
Genes involved in Secondary metabolism
Unknown genes

Fast Neutron deletions
FKF1 80kb deletion CHR1 cry2 10kb deletion CHR1
Het Sam Hazen (Scripps)

Natural Copy Variation on Tiling Arrays
Segregating self seed from wild ME isolate (Early – Late)

Potential Deletions Suggest Candidate Genes
FLOWERING1 QTL
Chr1 (bp)
Flowering Time QTL caused by a natural deletion in FLM
FLM
FLM natural deletion
(Werner et al PNAS 2005)

Experimental Design of Association Study
• Sample > 3000 wild strains, 149 SNPs
• Select 3*384 less structured reference fine mapping set for SFP resequencing
• Scan Genome for variation/selection
• Measure phenotype in Seasonal Chambers
• Haplotype map/ LD recombination blocks
• Associate Quantitative phenotypes with HapMap

Array Haplotyping
Inbred lines
Low effectiverecombinationdue to partialselfing
Extensive LDblocks
Col Ler Cvi Kas Bay Shah Lz Nd
Chr
omos
ome1
~50
0kb

Aquilegia (Columbines)
Recent adaptive radiation, 350Mb genome
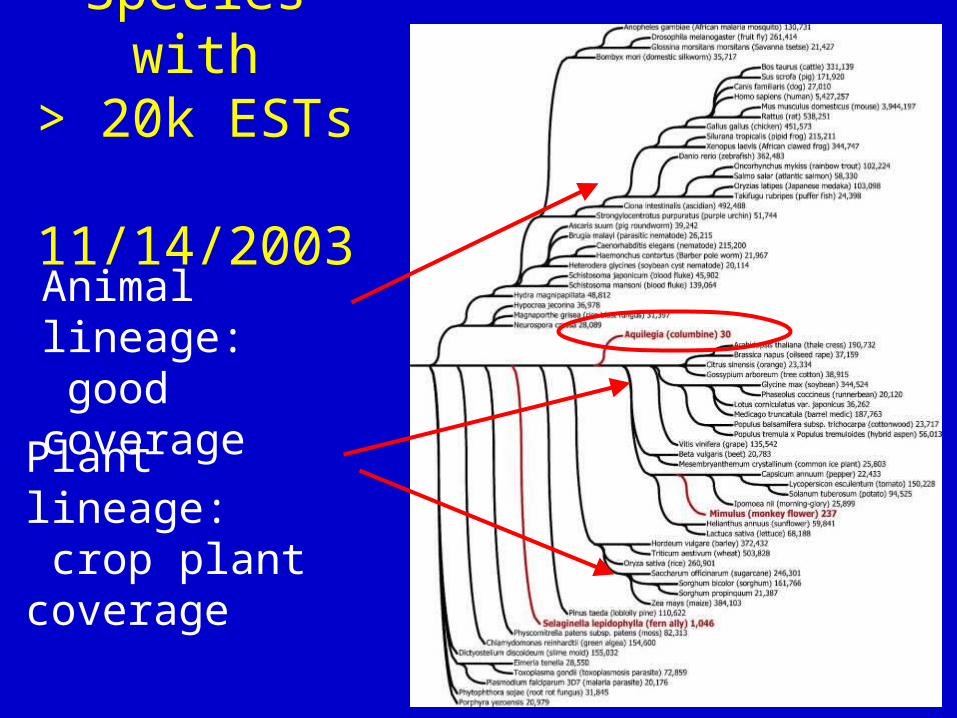
Species with> 20k ESTs 11/14/2003
Animal lineage: good coverage
Plant lineage: crop plant coverage

Genetics of Speciationalong a Hybrid Zone

NSF Genome Complexity
• Microarray development – QTL candidates
• Physical Map (BAC tiling path)– Physical assignment of ESTs
• QTL for pollinator preference – ~400 RILs, map abiotic stress
– QTL fine mapping/ LD mapping
• Develop transformation techniques– VIGS
• Whole Genome Sequencing (JGI?)
Scott Hodges (UCSB)
Elena Kramer (Harvard)
Magnus Nordborg (USC)
Justin Borevitz (U Chicago)
Jeff Tompkins (Clemson)

NaturalVariation.orgNaturalVariation.orgUSC
Magnus NordborgPaul Marjoram
Max Planck
Detlef Weigel
Scripps
Sam Hazen
University of Michigan
Sebastian Zoellner
USC
Magnus NordborgPaul Marjoram
Max Planck
Detlef Weigel
Scripps
Sam Hazen
University of Michigan
Sebastian Zoellner
University of Chicago
Xu ZhangYan Li
Peter RoycewiczEvadne Smith
Michigan State
Shinhan Shiu
PurdueIvan Baxter
University of Chicago
Xu ZhangYan Li
Peter RoycewiczEvadne Smith
Michigan State
Shinhan Shiu
PurdueIvan Baxter

http://www.plosone.org/

Aquilegia (Columbines)

Scott Hodges (UCSB)
Elena Kramer (Harvard)
Magnus Nordborg (USC)
Justin Borevitz (U Chicago)
Jeff Tompkins (Clemson)
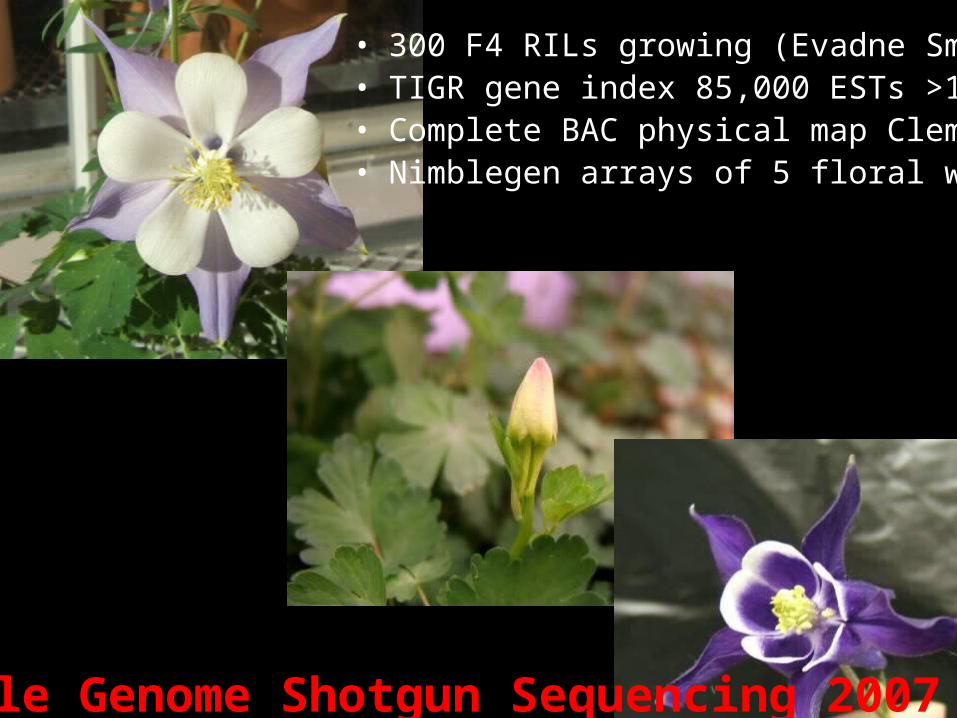
• 300 F4 RILs growing (Evadne Smith)• TIGR gene index 85,000 ESTs >16,00 SNPs• Complete BAC physical map Clemson• Nimblegen arrays of 5 floral whorls
Whole Genome Shotgun Sequencing 2007 JGI