Embed Size (px)
Citation preview

1
Abstract
Methods for assessing the impact of factors and image-
quality metrics for still face images are well-understood.
The extension of these factors and quality measures to faces
in video has not, however, been explored. We present a
specific methodology for carrying out this extension from
still to video. Using the Point-and-Shoot Challenge (PaSC)
dataset, our study investigates the effect of nine factors on
three face recognition algorithms, and identifies the most
important factors for algorithm performance in video. We
also evaluate four factor metrics for characterizing a single
video as well as two comparative metrics for pairs of
videos. For video-based face recognition, the analysis
shows that distribution-based metrics are generally more
effective in quantifying factor values than algorithm-
dependent metrics. For predicting face recognition perfor-
mance in video, we observe that the face detection
confidence and face size factors are potentially useful
quality measures. From our data, we also find that males
are easier to identify than females, and Asians easier to
identify than Caucasians. Finally, for this PaSC video
dataset, face recognition algorithm performance is pri-
marily driven by environment and sensor factors.
1. Introduction
Interest in face recognition from video has grown due to
the broad range of videos now being taken “anytime and
anywhere”; e.g., webcam and mobile devices including cell
phone. Recognizing a person’s face from a wide spectrum
of video domains presents significant challenges. Unlike
static face images, a sequence of video contains multiple
frames of the same face and it can display the same object
from multiple angles, illuminations, and expressions [1].
There are numerous factors that can affect the perfor-
mance of video-based face recognition algorithms. Beyond
facial characteristics, factors include camera types, location
and background, illumination, subject action (e.g., pose),
distance, body-visible, algorithmic parameters, etc.
Factor effect analysis (sensitivity analysis) is the study of
how the output of an algorithm is affected by the properties
of the stimuli (imagery), subjects, and acquisition
conditions. A number of studies on factors that affect
algorithm performance have been conducted [2][3][4][5].
In face recognition from still images, it is well understood
how to assess the impact of factors on algorithm
performance; however, generalizing factors from still
images to video sequences has not been studied. For
example, stating the pose or size of a face in a still image is
straightforward; but, what is the pose or size of a face in a
video sequence? The sensitivity analysis in the video
domain is a relatively new research approach and this paper
introduces problems of face recognition in video.
A major contribution of our study is generalizing still-
based factor value measures to video sequences. The
generalization is based on the distribution of factors
estimated from each frame. We conduct a sensitivity
analysis based on our new methodology, and demonstrate
the methodology with nine factors on three algorithms
using the Point-and-Shoot Challenge (PaSC) video dataset
[6]. The three algorithms are: the open-source Local Region
PCA (LRPCA) [7], the commercial algorithm PittPatt [8],
and the Principal Angle (PA) algorithm [9][10] developed
by Colorado State University (CSU). Two algorithms
(LRPCA and PittPatt) are extensions of still image face
recognition (frame-to-frame matching), while the PA
algorithm is a method based on matching selected sets of
video frames.
Our results demonstrate the effectiveness of our
approach on the two classes of video algorithms. This study
provides a comparative characterization of the algorithms
themselves, and delivers a ranking (and understanding) of
key factors that affect algorithm performance.
Specifically, we address the following questions: (i) How
do we extend factor measures from still to video imagery?
(ii) How do we quantify factors for video? (iii) Are these
video factors suitable for sensitivity analysis? What are the
important factors that affect the performance of face
recognition algorithm in video? (iv) Are these conclusions
about factors robustly true over multiple algorithms? (v)
Can our analysis methods be used to derive quality measure
Generalizing Face Quality and Factor Measures to Video
Yooyoung Lee, P. Jonathon Phillips, James J. Filliben, J. Ross Beveridge, Hao Zhang
National Institute of Standards and Technology, Information Technology Laboratory
100 Bureau Drive, Gaithersburg, MD 20899, USA
Colorado State University, the Computer Science Department, Fort Collins, CO 80523, USA
{yooyoung, jonathon, filliben}@nist.gov, {ross, zhangh}@cs.colostate.edu
2
metrics for predicting general performance of face recogni-
tion algorithms?
The impacts/contributions of this paper are as follows:
(i) Developing a baseline methodology framework for
quantifying/generalizing factor measures for video. (ii)
Characterizing current face recognition technology that
provides guidance for algorithm improvement. (iii)
Leveraging the existing factor studies on stills to the more
challenging videos. (iv) Determining the most important
factors (and interactions) for face recognition in video.
2. Dataset and Algorithm
This section describes the video dataset and the three face
recognition algorithms that are used in our evaluation.
2.1. Dataset
The Point-and-Shoot Challenge (PaSC) dataset was
recently introduced by Beveridge et al. [6]. The dataset
contains both still and video imagery. Since our study
focuses on the video sequences, we describe only the video
portion of the PaSC dataset. PaSC contains videos that were
captured by six different sensors, in six different environ-
mental conditions, with subject movement at a distance.
Sensor types can be divided into two classes; handheld and
tripod-mounted camera (which we call control). Unfortu-
nately, the five handheld sensors are indistinguishably
confounded with the six environments, which means that
sensor and environment effects are inextricably mixed. The
number of videos is 1,401 for handheld and 1,401 for
control.
Figure 1 shows sample images from the (a) FVRT2006
dataset [11] and the (b) PaSC dataset—note the image
quality differences between (a) traditional still-based face
images and (b) near real-world environment video-based
face images. These differences illustrate the challenge of
recognizing a face in less-than-optimal environments, while
further coping with low video quality.
2.2. Algorithm and Performance
We evaluate three face recognition algorithms; Local
Region PCA (LRPCA) [7], Pittsburgh Pattern Recognition
(PittPatt) SDK [6], and Principal Angle (PA) [9][10].
LRPCA is an open-source algorithm developed as a
baseline for face recognition; PittPatt is a black-box
commercial system; PA is a frame-set to frame-set
matching algorithm for video-based face recognition.
LRPCA and PittPatt are still-based benchmark algorithms
used by Beveridge et al. [6].
Algorithm performance is normally assessed by the
comparison of video pairs, which we call the query (input)
and the target (reference) video. The first step in video-
based face recognition is to detect and extract the face
region in each frame. The PittPatt SDK was utilized
throughout to extract face sub-images within each frame in
a video. A face was not detected in every frame; therefore,
not every frame in a video contributed a face sub-image.
For 62 videos, no faces were detected in any frame, we thus
omitted 42 out of 1401 control videos and 20 out of 1401
handheld videos in this study. Our analysis is thus based on
the 2740 videos where a face was detected in at least one
frame. On average, a face was detected in ~100 frames in
each video.
For videos, the first step for the LRPCA and PittPatt
algorithms is to compare all extracted face region across
two videos (query and target), and compute corresponding
similarity scores. After ranking all frame pairs based on the
scores, the frame pair with the highest similarity score [6]
is then selected. In PA, a random subset of frames from
each query and target video is selected and then similarity
scores are computed by the principle angle between the two
face sub-image sets.
The major difference between the (LRPCA, PittPatt)
algorithms and the PA algorithm is that LPPCA and PittPatt
ultimately use information from the best frame pair to
assess the similarity between two videos, while the PA
algorithm uses multiple information extracted across a set
of randomly sample frames within a video.
The total number of similarity scores calculated for all
possible pairs is approximately 1.87M for both control
(1,359) and handheld (1,381) videos. For the control data,
the PittPatt algorithm has a 48% verification rate (VR) at a
false accept rate (FAR) = 0.01, 23% for PA, and 10% for
LRPCA. For the handheld data, the VR at a FAR = 0.01 is
38% for PittPatt, 19% for PA, and 8% for LRPCA. For both
control and handheld videos, PittPatt has the highest
performance followed by PA and LRPCA.
3. Method
Measuring characteristics of an algorithm assist in the
understanding and improvement of already-developed as
(a) FVRT2006
(b) Sub-images from the PaSC video dataset
Figure 1 Comparison of (a) traditional face image and (b)
challenging face images from PaSC

3
well as future algorithms [12][13]. We introduce factor
measures for quantifying the performance of face
recognition algorithms in a video. The goal of the analysis
is to provide developers/researchers of face recognition
system insight via a ranking of the factors that affect
algorithm performance.
3.1. Factors
Out of the many potential factors that can affect
algorithm performance, we focus on nine. The factors are
based on experience with analyzing the performance of face
recognition on still images.
The nine factors are:
1) Face pose yaw (Yaw)
The pose yaw is the horizontal face rotational angle in
degrees to the left and right. The range of the angles is
approximately -40 to 40.
2) Face pose roll (Roll)
The pose roll is the angle of rolling/tilting the head to the
shoulder. The PaSC video dataset has a range of -30 to 30—
outliers exist for this factor (less than 0.001%), which we
omitted from our study.
3) Face size (Size)
The face size is an approximation of face size as reported
by the PittPatt SDK [8]. The raw units for this factor range
are 0 to 16 on a logarithmic scale.
4) Face detection confidence (Confidence)
The face detection confidence is the PittPatt SDK’s self-
assessment of correct face detection [8] with a range of 0 to
10.
5) Environment with Activity (Environment)
The PaSC video dataset has six different environment
settings (namely, ball, phone, paper, easel, canopy, and
bubble). This factor is associated with multiple factors.
Four key contributing factors are subject activity, back-
ground, indoor/outdoor, and lighting condition—in this
study, we combine these variables into a single environ-
ment factor. For example, in videos taken of the scene ball,
a person walks and bounces a ball indoors in front of a
complex background.
6) Sensor
The PaSC video dataset was collected by six different
cameras as shown in Table 1.
Table 1 Sensor (camera) information
Code Type Sensor Model Size Env. Code
C Control Panasonic HD700 1920x1080 All
H1 Handheld Flip Mino F360B 640x480 canopy
H2 Handheld Kodak Zi8 1280x720 phone, canopy
H3 Handheld Samsung M. CAM 1280x720 paper
H4 Handheld Sanyo Xacti 1280x720 easel, bubble
H5 Handheld Nexus Phone 720x480 ball
The Panasonic HD HS 700 (coded as C) is only the
stationary control camera, while the remaining entries are a
handheld camera. The control camera was used in all six
environments while the handheld cameras were used in one
or two environments. The PaSC dataset has the property
that the environment and sensor factors are confounded.
7) SubjectID (Individual)
The PaSC data are from 265 individuals. The average
number of videos per person is approximately 22.
8) Gender
Out of 265 subjects, the gender is fairly balanced
between males (55%) and females (45%).
9) Race
The PaSC videos contain five different races: Caucasian,
Asian-pacific, Black-American, Hispanic, and Unknown.
The population is mainly driven by Caucasians (81%)
followed by Asian-pacific (12%). The remaining races
don’t have a sufficient number of subjects for evaluation;
we therefore include only Caucasian (White) and Asian-
pacific (Asian) in our race study.
The nine factors can be divided by three groups; 1)
image/video, 2) environment, and 3) subject. The four
factors (yaw, roll, size, and confidence) are the image/video
group. The environment group consists of two factors
(environment and sensor) and the subject group consists of
the three factors (subjectID, gender, and race).
Another grouping of the nine factors is “local” vs.
“global”. A local factor is a measurable (typically,
continuous and ordinal) quantity which describes a feature
or characteristic of an image/video that can be predictive of
the performance of a recognition algorithm. A global factor
is a non-measurable variable (typically, discrete and
categorical). For video, local factor values usually change
frame-by-frame; whereas global factors normally remain
constant over the set of frames or the entire video sequence.
In our case, the image/video factors are local; the
remaining five factors from the environment and subject
group are global.
We choose these nine factors because most of them have
been investigated for still face images, and because they
serve as a useful subset to demonstrate our analysis
methodology.
3.2. Factor Measures
For the nine factors, we have constructed metrics based
on the four factors of the image/video group. We first
describe how these factor metrics apply to still images and
then discuss their extension to video.
A. Still Image Metrics
Let 𝑞 (query) and 𝑡 (target) be two still face images.
Given 𝑞 and 𝑡 , an algorithm 𝐴 returns a similarity score
4
𝑆𝐴(𝑞, 𝑡), where a high score indicates that the subjects from
the two face images are likely the same person.
Let 𝑋𝑘 denote factor 𝑘 from a set of factors under
consideration. For our study, 𝑋𝑘 is yaw, roll, size, and
confidence. 𝑋𝑘(𝑞) and 𝑋𝑘(𝑡) are factor 𝑘 values from
images 𝑞 and 𝑡 , respectively. A goal of this study is to
characterize and predict algorithm performance 𝑆𝐴(𝑞, 𝑡) by
𝑋𝑘(𝑞) and 𝑋𝑘(𝑡).
Since a similarity score 𝑆𝐴(𝑞, 𝑡) is based on a pair of
images, the similarity score not only is related to 𝑋𝑘(𝑞) and
𝑋𝑘(𝑡) individually, but also to 𝑋𝑘(𝑞) and 𝑋𝑘(𝑡) jointly. To
measure such behavior of a pair of 𝑋𝑘(𝑞) and 𝑋𝑘(𝑡), we
construct a comparative metric. The comparative metric is
a function of image factors that produces a quantitative
evaluation of the similarity of the two images with respect
to that factor. We denote the comparative metric as:
𝑀𝑘(𝑞, 𝑡) = 𝑔(𝑋𝑘(𝑞), 𝑋𝑘(𝑡))
To return a comparative score 𝑀𝑘(𝑞, 𝑡), we use examples
of 𝑔 as follows:
1) Absolute difference (∆):
|𝑋𝑘(𝑞) − 𝑋𝑘(𝑡)|
2) Extremum (𝑚𝑎𝑥/𝑚𝑖𝑛):
| 𝑚𝑎𝑥(𝑋𝑘(𝑞), 𝑋𝑘(𝑡)) | or 𝑚𝑖𝑛(𝑋𝑘(𝑞), 𝑋𝑘(𝑡))
For absolute difference ( ∆) , a near-zero comparative
score indicates that factor 𝑘 values are near-identical
between images 𝑞 and 𝑡. This absolute difference is used
for all four factors. For example, for yaw, a face pose
direction from images 𝑞 and 𝑡 is near equivalent if ∆ is
near-zero.
Before discussing the extremum approach, note that two
images would be considered “ideal” for comparison if the
following four conditions hold 1) both yaw values are near-
frontal (near-zero angle), 2) both roll values are near-
frontal, 3) both size values are large (higher resolution is
better than smaller resolution), and 4) both confidence
values are large (higher face detection confidence is better
than smaller confidence).
In this light, the extremum ( 𝑚𝑎𝑥/𝑚𝑖𝑛 ) approach
provides the poorer value out of the two images. The choice
of 𝑚𝑎𝑥 and 𝑚𝑖𝑛 depends on the factor; 𝑚𝑎𝑥 is used for
factors yaw and roll, and 𝑚𝑖𝑛 for factors size and confi-
dence. A small 𝑚𝑎𝑥 and a large 𝑚𝑖𝑛 indicate that factor 𝑘
between images 𝑞 and 𝑡 has the ideal factor characteristics.
B. Extension to Video
This section describes how we extend still-based
algorithms to video and encompass 𝑋𝑘 from still to video.
Let 𝑞 = {𝑞1, 𝑞2, … , 𝑞𝑄) frames and 𝑡 = {𝑡1, 𝑡2, … , 𝑡𝑇}
frames be sets of face extracted images from the query and
target video, respectively. To extend still-based algorithms
to video, we first compute similarity scores 𝑆𝐴(𝑞𝑖 , 𝑡𝑗) for all
frame-to-frame pairs ( 𝑞𝑖 , 𝑡𝑗) , and then provide a final
similarity score 𝑆𝐴(𝑞, 𝑡) as follow:
𝑆𝐴(𝑞, 𝑡) = 𝑓(𝑆𝐴(𝑞𝑖 , 𝑡𝑖))
Usually, 𝑓 𝑖𝑠 the max, medium, mean, or 90th percentile.
Let frame 𝑞∗ and 𝑡∗ be the best frame pair such that:
𝑆𝐴(𝑞, 𝑡) = 𝑆𝐴(𝑞∗, 𝑡∗)
For a specific algorithm 𝐴, the similarity score 𝑆𝐴(𝑞, 𝑡)
is thus provided by that particular frame pair (𝑞∗, 𝑡∗), where
the similarity score was obtained by the 𝑓 function. For
example, LRPCA and PittPatt are still-based face recog-
nition algorithms. To return a similarity score for videos 𝑞
and 𝑡, LRPCA uses the max rule and PittPatt uses the 90th
percentile rule [6].
To demonstrate extending 𝑋𝑘 from still to video, we look
at four single-video metrics; 1) LRPCA best frame pair, 2)
PittPatt best frame pair, 3) mean, and 4) sum of mean and
standard deviation. The LRPCA and Pittpatt best frame pair
are algorithm-dependent metrics, while the other two (mean
and sum of mean and standard deviation) are distribution-
attribute metrics.
1) Algorithm-dependent
For a single video, the algorithm-dependent metrics
provide a factor value from one frame pair out of all frame-
to-frame pairs used by a specific algorithm.
To extend 𝑋𝑘 from still to video, the factor values 𝑋𝑘(𝑞)
and 𝑋𝑘(𝑡) are computed from corresponding frame 𝑞∗ for
the query video and 𝑡∗ for the target video. The best frame
pair method is:
𝑋𝑘(𝑞) = 𝑋𝑘,𝐴(𝑞∗) and 𝑋𝑘(𝑡) = 𝑋𝑘,𝐴(𝑡∗)
where 𝐴 is an algorithm for face recognition, and 𝑞∗ and 𝑡∗
are particular frame pairs provided by algorithm 𝐴 . For
example, for the best frame pair for the LRPCA algorithm,
we denote the factor yaw values as 𝑌𝑎𝑤𝑙𝑟𝑝𝑐𝑎(𝑞∗) and
𝑌𝑎𝑤𝑙𝑟𝑝𝑐𝑎(𝑡∗), and for the PittPatt algorithm as 𝑌𝑎𝑤𝑝𝑖𝑡𝑡(𝑞∗)
and 𝑌𝑎𝑤𝑝𝑖𝑡𝑡(𝑡∗).
2) Distribution-attribute
A distribution-attribute metric provides a representative
factor value that is derived from the distribution of all
frames within a video; thus:
𝑋𝑘(𝑞) = ℎ(𝑞1, 𝑞2, … , 𝑞𝑄) and 𝑋𝑘(𝑡) = ℎ(𝑡1, 𝑡2, … , 𝑡𝑇)
Examples of ℎ are the mean (𝜇) and the sum of mean and
standard deviation (𝜇 + 𝜎). 𝜇 is a location-based metric and
𝜇 + 𝜎 combines a location-based metric and a spread-
sensitive metric.
The comparative metric for videos 𝑞 and 𝑡 is:
𝑀𝑘(𝑞, 𝑡) = 𝑔(ℎ(𝑞1, 𝑞2, … , 𝑞𝑄), ℎ(𝑡1, 𝑡2, … , 𝑡𝑇))
where the 𝑔 function for videos is the same as the still
cases.
For each of these four metrics, we shall consider two
functions 𝑔 (∆ and 𝑚𝑎𝑥/𝑚𝑖𝑛 )—this thus leads to a total of
eight metrics for each factor (See Table 2 for further
details).
5
4. Analyses and Results
This section discusses the analysis methods and results
for the nine factors for each of the three algorithms (PittPatt,
PA, and LRPCA). We first examine the eight factor metrics
(four single-video metrics times two comparative metrics)
for each of yaw, roll, size, and confidence within the
image/video group. Second, we investigate the cross-
domain analysis for the environment group factors
(environment and sensor). Third, we present results for the
subject group factors (subjectID, gender, and race). Finally,
for the nine factors, we carry out a sensitivity analysis and
provide a ranked list of factors based on their relative im-
portance to the performance of face recognition algorithms
in video.
4.1. Yaw, Roll, Size, and Confidence Analysis
The factor metrics introduced in Section 3.2 can be
applied to only the local (image/video) factors since these
factor values are measurable and change frame-by-frame
basis. We choose the four single-video metrics (𝑙𝑟𝑝𝑐𝑎𝑏𝑒𝑠𝑡,
𝑝𝑖𝑡𝑡𝑝𝑎𝑡𝑡𝑏𝑒𝑠𝑡 , 𝜇 , and 𝜇 + 𝜎 ) and the two comparative
metrics (∆ and 𝑚𝑖𝑛/𝑚𝑎𝑥) for our experiment. For each of
the four factors, Table 2 summarizes the 8 (4 x 2) metrics.
Table 2 Factor metric designations for each of the four factors
Factors 𝑀𝑘(𝑞, 𝑡)
Algorithm-dependent Distribution-attribute
LRPCA Best
Frame Pair
(𝑙𝑟𝑝𝑐𝑎𝑏𝑒𝑠𝑡)
PittPatt Best
Frame Pair
(𝑝𝑖𝑡𝑡𝑝𝑎𝑡𝑡𝑏𝑒𝑠𝑡)
Mean
(𝜇)
Mean+SD
(𝜇 + 𝜎)
Yaw ∆𝑌 ∆𝑌𝑙𝑟𝑝𝑐𝑎 ∆𝑌𝑝𝑖𝑡𝑡 ∆𝑌𝜇 ∆𝑌𝜇+𝜎
𝑚𝑎𝑥𝑌 𝑚𝑎𝑥𝑌𝑙𝑟𝑝𝑐𝑎 𝑚𝑎𝑥𝑌𝑝𝑖𝑡𝑡 𝑚𝑎𝑥𝑌𝜇 𝑚𝑎𝑥𝑌𝜇+𝜎
Roll ∆𝑅 ∆𝑅𝑙𝑟𝑝𝑐𝑎 ∆𝑅𝑝𝑖𝑡𝑡 ∆𝑅𝜇 ∆𝑅𝜇+𝜎
𝑚𝑎𝑥𝑅 𝑚𝑎𝑥𝑅𝑙𝑟𝑝𝑐𝑎 𝑚𝑎𝑥𝑅𝑝𝑖𝑡𝑡 𝑚𝑎𝑥𝑅𝜇 𝑚𝑎𝑥𝑅𝜇+𝜎
Size ∆𝑆 ∆𝑆𝑙𝑟𝑝𝑐𝑎 ∆𝑆𝑝𝑖𝑡𝑡 ∆𝑆𝜇 ∆𝑆𝜇+𝜎
𝑚𝑖𝑛𝑆 𝑚𝑖𝑛𝑆𝑙𝑟𝑝𝑐𝑎 𝑚𝑖𝑛𝑆𝑝𝑖𝑡𝑡 𝑚𝑖𝑛𝑆𝜇 𝑚𝑖𝑛𝑆𝜇+𝜎
Conf. ∆𝐶 ∆𝐶𝑙𝑟𝑝𝑐𝑎 ∆𝐶𝑝𝑖𝑡𝑡 ∆𝐶𝜇 ∆𝐶𝜇+𝜎
𝑚𝑖𝑛𝐶 𝑚𝑖𝑛𝐶𝑙𝑟𝑝𝑐𝑎 𝑚𝑖𝑛𝐶𝑝𝑖𝑡𝑡 𝑚𝑖𝑛𝐶𝜇 𝑚𝑖𝑛𝐶𝜇+𝜎
To assess the relative importance of the 32 (factor,
metric) combinations of Table 2, we sort and plot them
based on the |correlation coefficients| (%) with the
matching scores. Higher correlations indicate greater
predictability of algorithm performance.
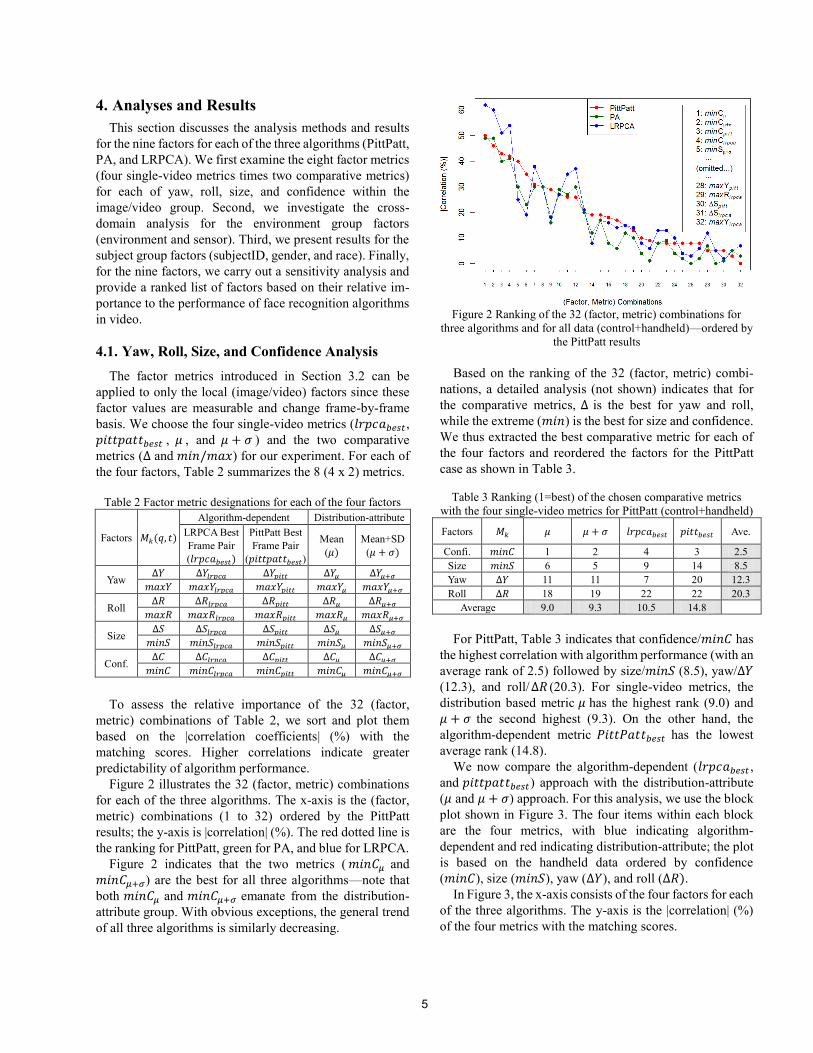
Figure 2 illustrates the 32 (factor, metric) combinations
for each of the three algorithms. The x-axis is the (factor,
metric) combinations (1 to 32) ordered by the PittPatt
results; the y-axis is |correlation| (%). The red dotted line is
the ranking for PittPatt, green for PA, and blue for LRPCA.
Figure 2 indicates that the two metrics ( 𝑚𝑖𝑛𝐶𝜇 and
𝑚𝑖𝑛𝐶𝜇+𝜎) are the best for all three algorithms—note that
both 𝑚𝑖𝑛𝐶𝜇 and 𝑚𝑖𝑛𝐶𝜇+𝜎 emanate from the distribution-
attribute group. With obvious exceptions, the general trend
of all three algorithms is similarly decreasing.
Figure 2 Ranking of the 32 (factor, metric) combinations for
three algorithms and for all data (control+handheld)—ordered by
the PittPatt results
Based on the ranking of the 32 (factor, metric) combi-
nations, a detailed analysis (not shown) indicates that for
the comparative metrics, ∆ is the best for yaw and roll,
while the extreme (𝑚𝑖𝑛) is the best for size and confidence.
We thus extracted the best comparative metric for each of
the four factors and reordered the factors for the PittPatt
case as shown in Table 3.
Table 3 Ranking (1=best) of the chosen comparative metrics
with the four single-video metrics for PittPatt (control+handheld)
Factors 𝑀𝑘 𝜇 𝜇 + 𝜎 𝑙𝑟𝑝𝑐𝑎𝑏𝑒𝑠𝑡 𝑝𝑖𝑡𝑡𝑏𝑒𝑠𝑡 Ave.
Confi. 𝑚𝑖𝑛𝐶 1 2 4 3 2.5
Size 𝑚𝑖𝑛𝑆 6 5 9 14 8.5
Yaw ∆𝑌 11 11 7 20 12.3
Roll ∆𝑅 18 19 22 22 20.3
Average 9.0 9.3 10.5 14.8
For PittPatt, Table 3 indicates that confidence/𝑚𝑖𝑛𝐶 has
the highest correlation with algorithm performance (with an
average rank of 2.5) followed by size/𝑚𝑖𝑛𝑆 (8.5), yaw/∆𝑌
(12.3), and roll/ ∆𝑅 (20.3). For single-video metrics, the
distribution based metric 𝜇 has the highest rank (9.0) and
𝜇 + 𝜎 the second highest (9.3). On the other hand, the
algorithm-dependent metric 𝑃𝑖𝑡𝑡𝑃𝑎𝑡𝑡𝑏𝑒𝑠𝑡 has the lowest
average rank (14.8).
We now compare the algorithm-dependent (𝑙𝑟𝑝𝑐𝑎𝑏𝑒𝑠𝑡 ,
and 𝑝𝑖𝑡𝑡𝑝𝑎𝑡𝑡𝑏𝑒𝑠𝑡) approach with the distribution-attribute
(𝜇 and 𝜇 + 𝜎) approach. For this analysis, we use the block
plot shown in Figure 3. The four items within each block
are the four metrics, with blue indicating algorithm-
dependent and red indicating distribution-attribute; the plot
is based on the handheld data ordered by confidence
(𝑚𝑖𝑛𝐶), size (𝑚𝑖𝑛𝑆), yaw (∆𝑌), and roll (∆𝑅).
In Figure 3, the x-axis consists of the four factors for each
of the three algorithms. The y-axis is the |correlation| (%)
of the four metrics with the matching scores.
6
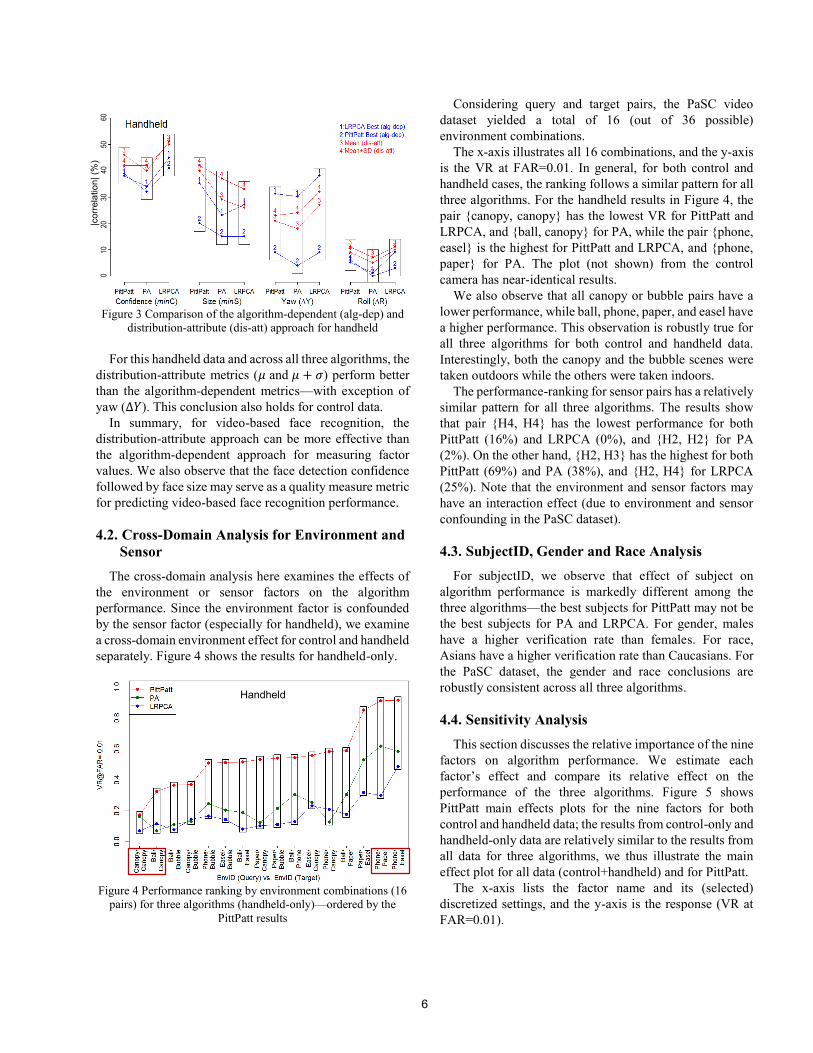
Figure 3 Comparison of the algorithm-dependent (alg-dep) and
distribution-attribute (dis-att) approach for handheld
For this handheld data and across all three algorithms, the
distribution-attribute metrics (𝜇 and 𝜇 + 𝜎) perform better
than the algorithm-dependent metrics—with exception of
yaw (∆𝑌). This conclusion also holds for control data.
In summary, for video-based face recognition, the
distribution-attribute approach can be more effective than
the algorithm-dependent approach for measuring factor
values. We also observe that the face detection confidence
followed by face size may serve as a quality measure metric
for predicting video-based face recognition performance.
4.2. Cross-Domain Analysis for Environment and
Sensor
The cross-domain analysis here examines the effects of
the environment or sensor factors on the algorithm
performance. Since the environment factor is confounded
by the sensor factor (especially for handheld), we examine
a cross-domain environment effect for control and handheld
separately. Figure 4 shows the results for handheld-only.
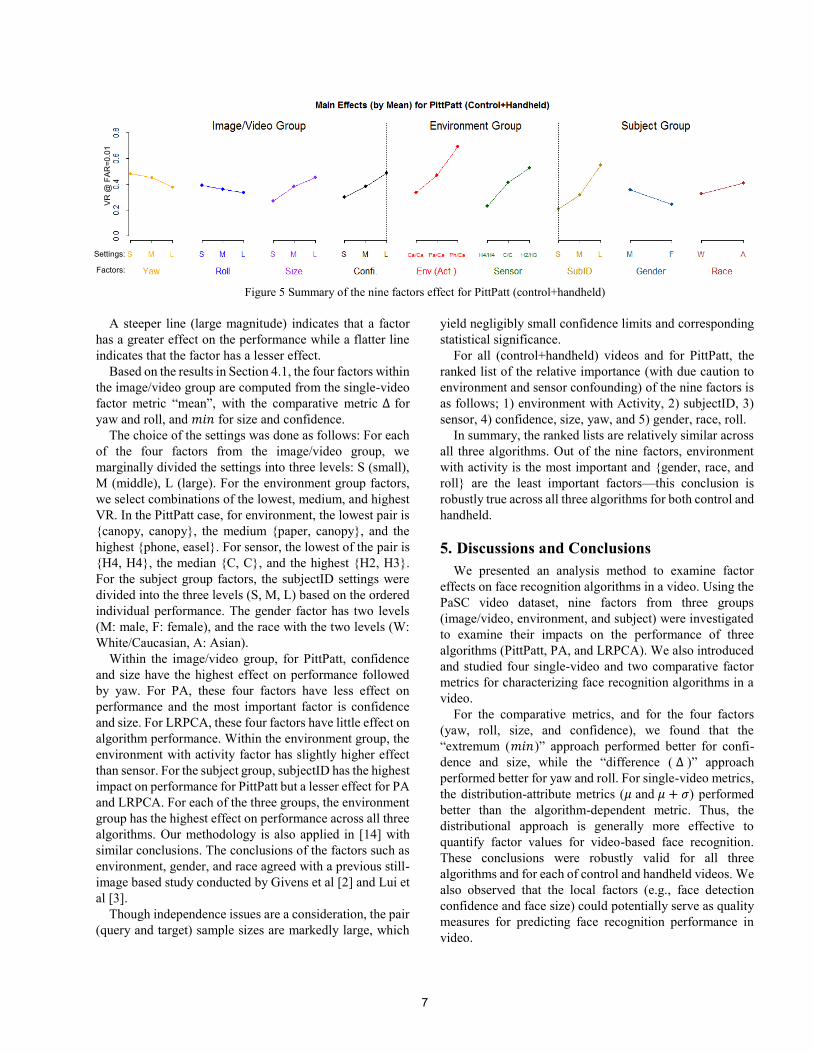
Figure 4 Performance ranking by environment combinations (16
pairs) for three algorithms (handheld-only)—ordered by the
PittPatt results
Considering query and target pairs, the PaSC video
dataset yielded a total of 16 (out of 36 possible)
environment combinations.
The x-axis illustrates all 16 combinations, and the y-axis
is the VR at FAR=0.01. In general, for both control and
handheld cases, the ranking follows a similar pattern for all
three algorithms. For the handheld results in Figure 4, the
pair {canopy, canopy} has the lowest VR for PittPatt and
LRPCA, and {ball, canopy} for PA, while the pair {phone,
easel} is the highest for PittPatt and LRPCA, and {phone,
paper} for PA. The plot (not shown) from the control
camera has near-identical results.
We also observe that all canopy or bubble pairs have a
lower performance, while ball, phone, paper, and easel have
a higher performance. This observation is robustly true for
all three algorithms for both control and handheld data.
Interestingly, both the canopy and the bubble scenes were
taken outdoors while the others were taken indoors.
The performance-ranking for sensor pairs has a relatively
similar pattern for all three algorithms. The results show
that pair {H4, H4} has the lowest performance for both
PittPatt (16%) and LRPCA (0%), and {H2, H2} for PA
(2%). On the other hand, {H2, H3} has the highest for both
PittPatt (69%) and PA (38%), and {H2, H4} for LRPCA
(25%). Note that the environment and sensor factors may
have an interaction effect (due to environment and sensor
confounding in the PaSC dataset).
4.3. SubjectID, Gender and Race Analysis
For subjectID, we observe that effect of subject on
algorithm performance is markedly different among the
three algorithms—the best subjects for PittPatt may not be
the best subjects for PA and LRPCA. For gender, males
have a higher verification rate than females. For race,
Asians have a higher verification rate than Caucasians. For
the PaSC dataset, the gender and race conclusions are
robustly consistent across all three algorithms.
4.4. Sensitivity Analysis
This section discusses the relative importance of the nine
factors on algorithm performance. We estimate each
factor’s effect and compare its relative effect on the
performance of the three algorithms. Figure 5 shows
PittPatt main effects plots for the nine factors for both
control and handheld data; the results from control-only and
handheld-only data are relatively similar to the results from
all data for three algorithms, we thus illustrate the main
effect plot for all data (control+handheld) and for PittPatt.
The x-axis lists the factor name and its (selected)
discretized settings, and the y-axis is the response (VR at
FAR=0.01).
|corr
ela
tio
n| (%
) 0
1
0
20
30
4
0
50
60
Handheld
7
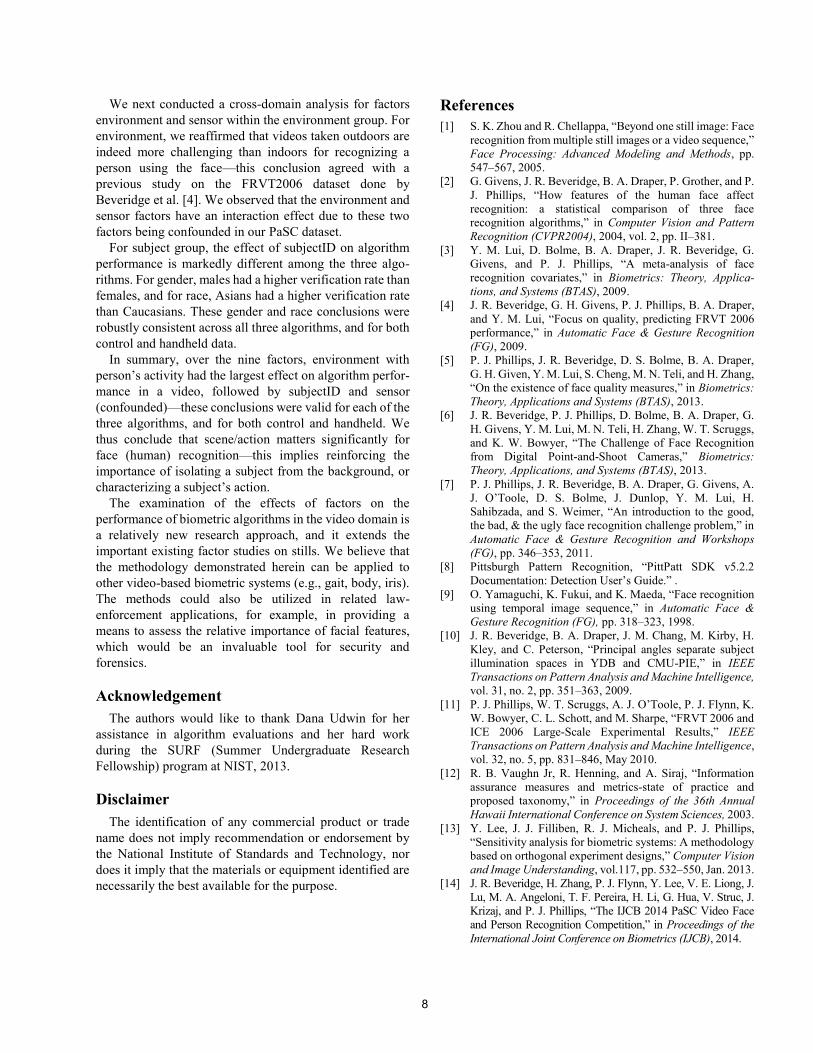
Figure 5 Summary of the nine factors effect for PittPatt (control+handheld)
A steeper line (large magnitude) indicates that a factor
has a greater effect on the performance while a flatter line
indicates that the factor has a lesser effect.
Based on the results in Section 4.1, the four factors within
the image/video group are computed from the single-video
factor metric “mean”, with the comparative metric ∆ for
yaw and roll, and 𝑚𝑖𝑛 for size and confidence.
The choice of the settings was done as follows: For each
of the four factors from the image/video group, we
marginally divided the settings into three levels: S (small),
M (middle), L (large). For the environment group factors,
we select combinations of the lowest, medium, and highest
VR. In the PittPatt case, for environment, the lowest pair is
{canopy, canopy}, the medium {paper, canopy}, and the
highest {phone, easel}. For sensor, the lowest of the pair is
{H4, H4}, the median {C, C}, and the highest {H2, H3}.
For the subject group factors, the subjectID settings were
divided into the three levels (S, M, L) based on the ordered
individual performance. The gender factor has two levels
(M: male, F: female), and the race with the two levels (W:
White/Caucasian, A: Asian).
Within the image/video group, for PittPatt, confidence
and size have the highest effect on performance followed
by yaw. For PA, these four factors have less effect on
performance and the most important factor is confidence
and size. For LRPCA, these four factors have little effect on
algorithm performance. Within the environment group, the
environment with activity factor has slightly higher effect
than sensor. For the subject group, subjectID has the highest
impact on performance for PittPatt but a lesser effect for PA
and LRPCA. For each of the three groups, the environment
group has the highest effect on performance across all three
algorithms. Our methodology is also applied in [14] with
similar conclusions. The conclusions of the factors such as
environment, gender, and race agreed with a previous still-
image based study conducted by Givens et al [2] and Lui et
al [3].
Though independence issues are a consideration, the pair
(query and target) sample sizes are markedly large, which
yield negligibly small confidence limits and corresponding
statistical significance.
For all (control+handheld) videos and for PittPatt, the
ranked list of the relative importance (with due caution to
environment and sensor confounding) of the nine factors is
as follows; 1) environment with Activity, 2) subjectID, 3)
sensor, 4) confidence, size, yaw, and 5) gender, race, roll.
In summary, the ranked lists are relatively similar across
all three algorithms. Out of the nine factors, environment
with activity is the most important and {gender, race, and
roll} are the least important factors—this conclusion is
robustly true across all three algorithms for both control and
handheld.
5. Discussions and Conclusions
We presented an analysis method to examine factor
effects on face recognition algorithms in a video. Using the
PaSC video dataset, nine factors from three groups
(image/video, environment, and subject) were investigated
to examine their impacts on the performance of three
algorithms (PittPatt, PA, and LRPCA). We also introduced
and studied four single-video and two comparative factor
metrics for characterizing face recognition algorithms in a
video.
For the comparative metrics, and for the four factors
(yaw, roll, size, and confidence), we found that the
“extremum (𝑚𝑖𝑛)” approach performed better for confi-
dence and size, while the “difference ( ∆ )” approach
performed better for yaw and roll. For single-video metrics,
the distribution-attribute metrics (𝜇 and 𝜇 + 𝜎) performed
better than the algorithm-dependent metric. Thus, the
distributional approach is generally more effective to
quantify factor values for video-based face recognition.
These conclusions were robustly valid for all three
algorithms and for each of control and handheld videos. We
also observed that the local factors (e.g., face detection
confidence and face size) could potentially serve as quality
measures for predicting face recognition performance in
video.
VR
@ F
AR
=0
.01
Settings:
Factors:
8
We next conducted a cross-domain analysis for factors
environment and sensor within the environment group. For
environment, we reaffirmed that videos taken outdoors are
indeed more challenging than indoors for recognizing a
person using the face—this conclusion agreed with a
previous study on the FRVT2006 dataset done by
Beveridge et al. [4]. We observed that the environment and
sensor factors have an interaction effect due to these two
factors being confounded in our PaSC dataset.
For subject group, the effect of subjectID on algorithm
performance is markedly different among the three algo-
rithms. For gender, males had a higher verification rate than
females, and for race, Asians had a higher verification rate
than Caucasians. These gender and race conclusions were
robustly consistent across all three algorithms, and for both
control and handheld data.
In summary, over the nine factors, environment with
person’s activity had the largest effect on algorithm perfor-
mance in a video, followed by subjectID and sensor
(confounded)—these conclusions were valid for each of the
three algorithms, and for both control and handheld. We
thus conclude that scene/action matters significantly for
face (human) recognition—this implies reinforcing the
importance of isolating a subject from the background, or
characterizing a subject’s action.
The examination of the effects of factors on the
performance of biometric algorithms in the video domain is
a relatively new research approach, and it extends the
important existing factor studies on stills. We believe that
the methodology demonstrated herein can be applied to
other video-based biometric systems (e.g., gait, body, iris).
The methods could also be utilized in related law-
enforcement applications, for example, in providing a
means to assess the relative importance of facial features,
which would be an invaluable tool for security and
forensics.
Acknowledgement
The authors would like to thank Dana Udwin for her
assistance in algorithm evaluations and her hard work
during the SURF (Summer Undergraduate Research
Fellowship) program at NIST, 2013.
Disclaimer
The identification of any commercial product or trade
name does not imply recommendation or endorsement by
the National Institute of Standards and Technology, nor
does it imply that the materials or equipment identified are
necessarily the best available for the purpose.
References
[1] S. K. Zhou and R. Chellappa, “Beyond one still image: Face
recognition from multiple still images or a video sequence,”
Face Processing: Advanced Modeling and Methods, pp.
547–567, 2005.
[2] G. Givens, J. R. Beveridge, B. A. Draper, P. Grother, and P.
J. Phillips, “How features of the human face affect
recognition: a statistical comparison of three face
recognition algorithms,” in Computer Vision and Pattern
Recognition (CVPR2004), 2004, vol. 2, pp. II–381.
[3] Y. M. Lui, D. Bolme, B. A. Draper, J. R. Beveridge, G.
Givens, and P. J. Phillips, “A meta-analysis of face
recognition covariates,” in Biometrics: Theory, Applica-
tions, and Systems (BTAS), 2009.
[4] J. R. Beveridge, G. H. Givens, P. J. Phillips, B. A. Draper,
and Y. M. Lui, “Focus on quality, predicting FRVT 2006
performance,” in Automatic Face & Gesture Recognition
(FG), 2009.
[5] P. J. Phillips, J. R. Beveridge, D. S. Bolme, B. A. Draper,
G. H. Given, Y. M. Lui, S. Cheng, M. N. Teli, and H. Zhang,
“On the existence of face quality measures,” in Biometrics:
Theory, Applications and Systems (BTAS), 2013.
[6] J. R. Beveridge, P. J. Phillips, D. Bolme, B. A. Draper, G.
H. Givens, Y. M. Lui, M. N. Teli, H. Zhang, W. T. Scruggs,
and K. W. Bowyer, “The Challenge of Face Recognition
from Digital Point-and-Shoot Cameras,” Biometrics:
Theory, Applications, and Systems (BTAS), 2013.
[7] P. J. Phillips, J. R. Beveridge, B. A. Draper, G. Givens, A.
J. O’Toole, D. S. Bolme, J. Dunlop, Y. M. Lui, H.
Sahibzada, and S. Weimer, “An introduction to the good,
the bad, & the ugly face recognition challenge problem,” in
Automatic Face & Gesture Recognition and Workshops
(FG), pp. 346–353, 2011.
[8] Pittsburgh Pattern Recognition, “PittPatt SDK v5.2.2
Documentation: Detection User’s Guide.” .
[9] O. Yamaguchi, K. Fukui, and K. Maeda, “Face recognition
using temporal image sequence,” in Automatic Face &
Gesture Recognition (FG), pp. 318–323, 1998.
[10] J. R. Beveridge, B. A. Draper, J. M. Chang, M. Kirby, H.
Kley, and C. Peterson, “Principal angles separate subject
illumination spaces in YDB and CMU-PIE,” in IEEE
Transactions on Pattern Analysis and Machine Intelligence,
vol. 31, no. 2, pp. 351–363, 2009.
[11] P. J. Phillips, W. T. Scruggs, A. J. O’Toole, P. J. Flynn, K.
W. Bowyer, C. L. Schott, and M. Sharpe, “FRVT 2006 and
ICE 2006 Large-Scale Experimental Results,” IEEE
Transactions on Pattern Analysis and Machine Intelligence,
vol. 32, no. 5, pp. 831–846, May 2010.
[12] R. B. Vaughn Jr, R. Henning, and A. Siraj, “Information
assurance measures and metrics-state of practice and
proposed taxonomy,” in Proceedings of the 36th Annual
Hawaii International Conference on System Sciences, 2003.
[13] Y. Lee, J. J. Filliben, R. J. Micheals, and P. J. Phillips,
“Sensitivity analysis for biometric systems: A methodology
based on orthogonal experiment designs,” Computer Vision
and Image Understanding, vol.117, pp. 532–550, Jan. 2013.
[14] J. R. Beveridge, H. Zhang, P. J. Flynn, Y. Lee, V. E. Liong, J.
Lu, M. A. Angeloni, T. F. Pereira, H. Li, G. Hua, V. Struc, J.
Krizaj, and P. J. Phillips, “The IJCB 2014 PaSC Video Face
and Person Recognition Competition,” in Proceedings of the
International Joint Conference on Biometrics (IJCB), 2014.