Embed Size (px)
Citation preview


General Meeting 710.19.2013

• Announcements• Portfolio Update•Market Update• Lecture: Asset Pricing• Pitch- ALJ• Important Dates
Meeting Agenda

Announcements

Announcements

Announcements


Announcements
Announcements
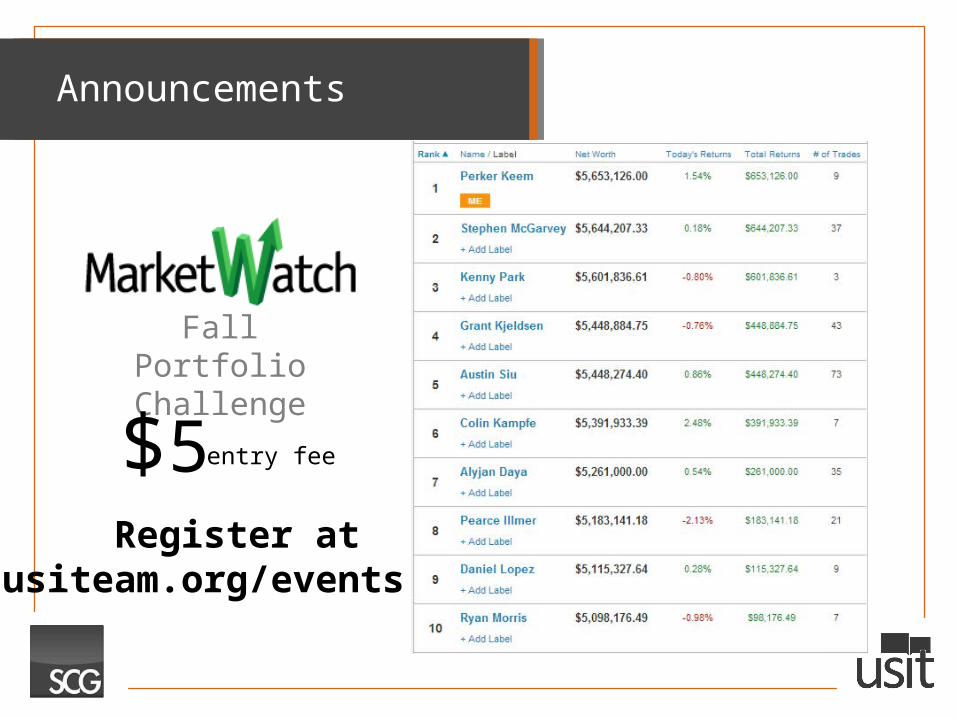
Register at usiteam.org/events
Fall Portfolio Challenge
$5 entry fee

Announcements
Frisbee with the Board
TODAY at 8:30 after meetingSouth Mall Lawn

Announcements
Technical WorkshopsEvery Thursday 7-8SAC2.120
This Week:Business Quality

Portfolio UpdatePortfolio SummarySector Exposures Dollar Amount % AllocationInformation Technology $2,154.67 30%Energy $0.00 0%Consumer Services $0.00 0%Consumer Goods $0.00 0%Financials $1,232.50 17%Industrials $539.50 7%Health Care $1,238.50 17%Utilities $0.00 0%Telecommunication Services $1,502.25 21%Basic Materials $582.10 8%
Sector Exposures + CashInformation Technology $2,154.7 15%Energy $0.0 0%Consumer Services $0.0 0%Consumer Goods $0.0 0%Financials $1,232.5 9%Industrials $539.5 4%Health Care $1,238.5 9%Utilities $0.0 0%Telecommunication Services $1,502.3 10%Basic Materials $582.1 4%Cash $7,120.9 50%
Historical PerformanceInvested Capital Cash Exposure AUM Weekly Portfolio Return Cumulative Return Since 8/30/13 Exp-Adj Weekly Return Exp-Adj Cum. Return
8/30/2013 $4,396.8 $9,716.0 31.2% $14,112.8 - 0.0% 0.0%9/6/2013 $7,739.3 $6,556.9 54.1% $14,296.2 1.3% 1.3% 2.40% 2.4%9/13/2013 $4,328.6 $9,922.9 30.4% $14,251.5 (0.3%) 1.0% (1.03%) 1.3%9/20/2013 $4,381.9 $9,922.9 30.6% $14,304.8 0.4% 1.4% 1.22% 2.6%9/27/2013 $5,911.2 $8,226.2 41.8% $14,137.4 (1.17%) 0.17% (2.80%) (0.3%)10/4/2013 $5,847.4 $8,226.2 41.5% $14,073.6 (0.45%) (0.28%) (1.09%) (1.4%)10/11/2013 $7,037.0 $7,120.9 49.7% $14,157.8 0.60% 0.32% 1.20% (0.2%)10/18/2013 $7,249.5 $7,120.9 50.4% $14,370.4 1.50% 1.83% 2.98% 2.8%
15%
0%
0%
0%
9%
4%
9%
0% 10%
4%
50%
Information Technology
Energy
Consumer Services
Consumer Goods
Financials
Industrials
Health Care
Utilities
Telecommunication Services
Basic Materials
Cash

Portfolio Update
Current PositionsTicker Shares Cost Per Share Total Cost Basis Purchase Date PX_LAST Total Market Value Gain/Loss Gain/Loss % Sector Position SizeAAPL US Equity 3 $486.11 $1,458.32 8/13/2013 $508.89 $1,526.67 $68.35 4.7% Information Technology 10.6%ADNC US Equity 50 $10.51 $525.50 8/13/2013 $12.56 $628.00 $102.50 19.5% Information Technology 4.4%CBRX US Equity 125 $6.82 $852.13 8/14/2013 $7.14 $892.50 $40.38 4.7% Health Care 6.2%ENZN US Equity 200 $1.96 $391.00 8/13/2013 $1.73 $346.00 ($45.00) -11.5% Health Care 2.4%IDT US Equity 75 $18.00 $1,349.65 8/14/2013 $20.03 $1,502.25 $152.60 11.3% Telecommunication Services 10.5%SWKH US Equity 400 $1.13 $450.00 8/13/2013 $1.12 $448.00 ($2.00) -0.4% Financials 3.1%U CN Equity 125 $4.64 $579.68 8/28/2013 $4.66 $582.10 $2.43 0.4% Basic Materials 4.1%AGX US Equity 25 $21.67 $541.75 9/26/2013 $21.58 $539.50 ($2.25) -0.4% Industrials 3.8%AIG US Equity 15 $49.37 $740.55 10/10/2013 $52.30 $784.50 $43.95 5.9% Financials 5.5%Historical Performance
Invested Capital Cash Exposure AUM Weekly Portfolio Return Cumulative Return Since 8/30/13 Exp-Adj Weekly Return Exp-Adj Cum. Return8/30/2013 $4,396.8 $9,716.0 31.2% $14,112.8 - 0.0% 0.0%9/6/2013 $7,739.3 $6,556.9 54.1% $14,296.2 1.3% 1.3% 2.40% 2.4%9/13/2013 $4,328.6 $9,922.9 30.4% $14,251.5 (0.3%) 1.0% (1.03%) 1.3%9/20/2013 $4,381.9 $9,922.9 30.6% $14,304.8 0.4% 1.4% 1.22% 2.6%9/27/2013 $5,911.2 $8,226.2 41.8% $14,137.4 (1.17%) 0.17% (2.80%) (0.3%)10/4/2013 $5,847.4 $8,226.2 41.5% $14,073.6 (0.45%) (0.28%) (1.09%) (1.4%)10/11/2013 $7,037.0 $7,120.9 49.7% $14,157.8 0.60% 0.32% 1.20% (0.2%)10/18/2013 $7,249.5 $7,120.9 50.4% $14,370.4 1.50% 1.83% 2.98% 2.8%
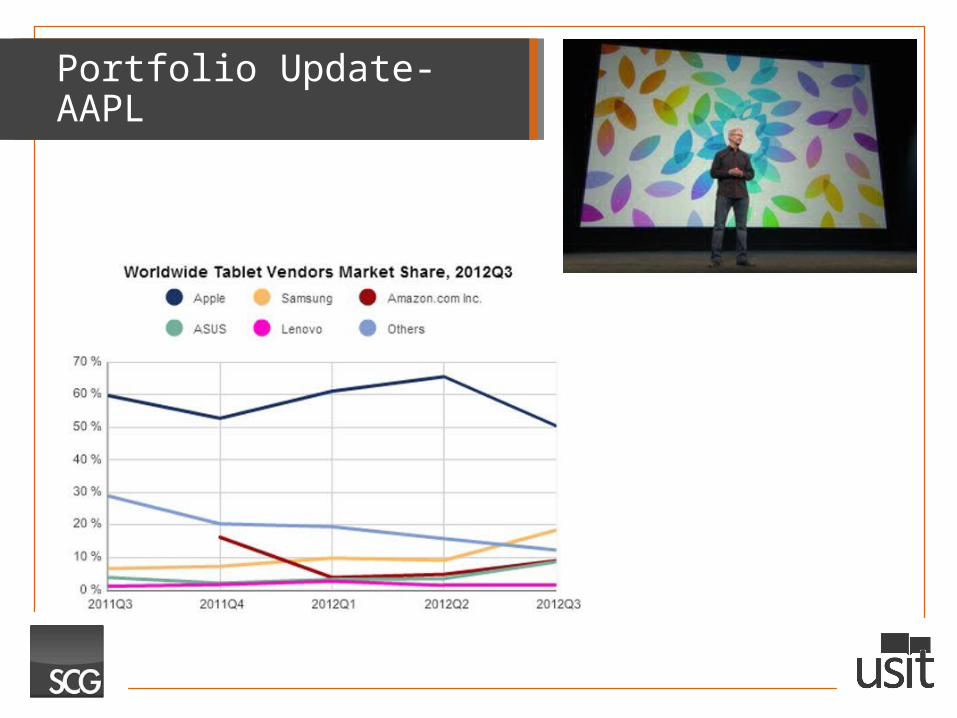
Portfolio Update- AAPL
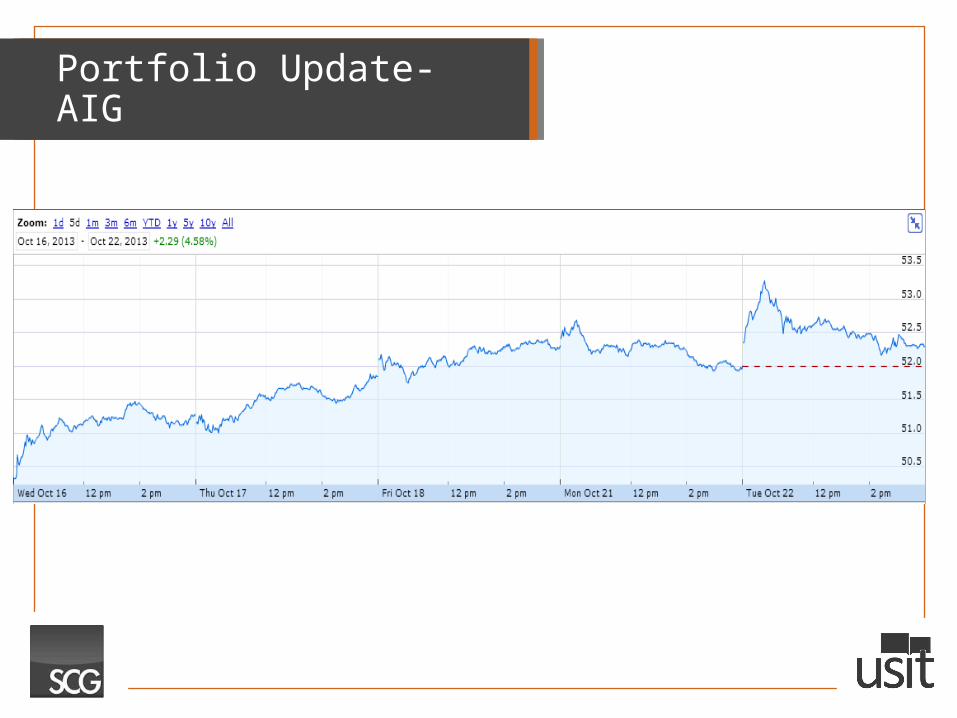
Portfolio Update- AIG
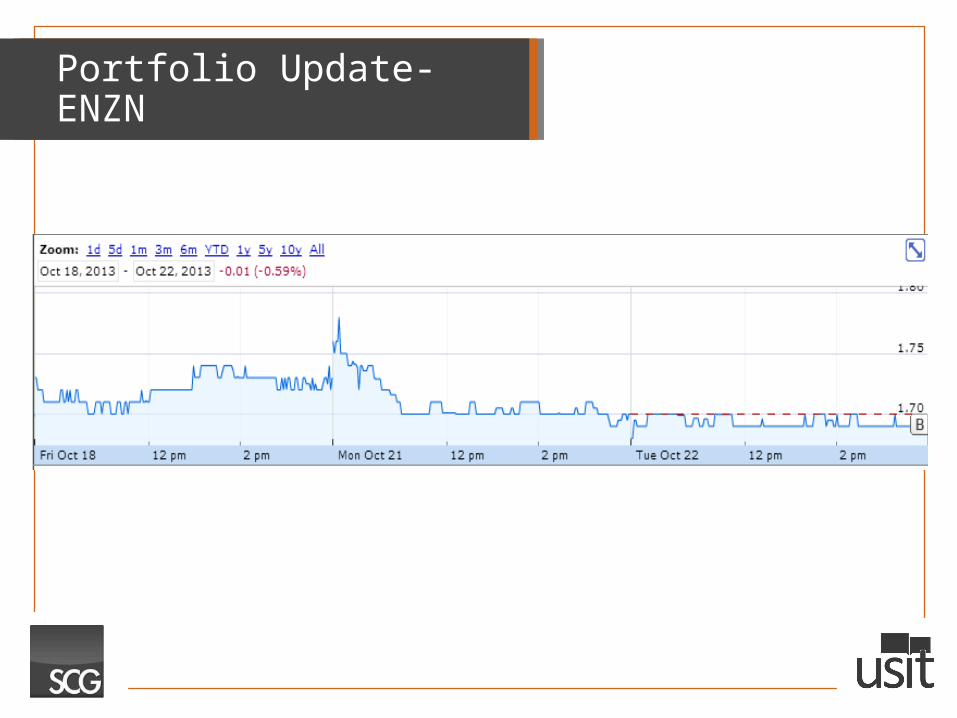
Portfolio Update- ENZN

Portfolio Update- ADNC & IDT
ADNC: +21.8%
IDT: +11.5%

Stupid Stock Chart of the Day
+9%-9%
-9%

Market Update
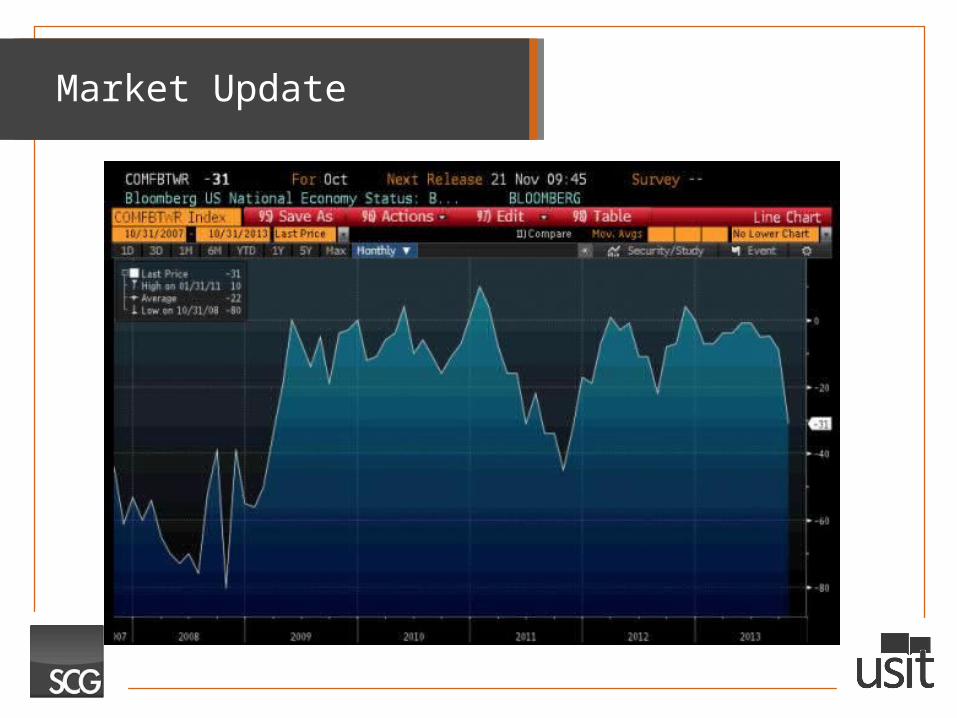
Market Update

Asset Pricing
Asset Pricing
2013 2014 2015
∞?

Asset Pricing
Firm Value = Cash Flow Next Year + Cash Flow The Year After +
Cash Flow The Year After + Cash Flow The Year After +
Cash Flow The Year After + Etc.
*EXPECTED*
Expected growth rate of 5% for 2013
Company reports an actual growth rate of 4% at the end of 2013, what happens?
All things held equal, stock price will go down
Why? Because if a company’s stock value is just the sum of its future cash flows, then the future cash flows just became smaller, so stock value goes
down.
Asset Pricing
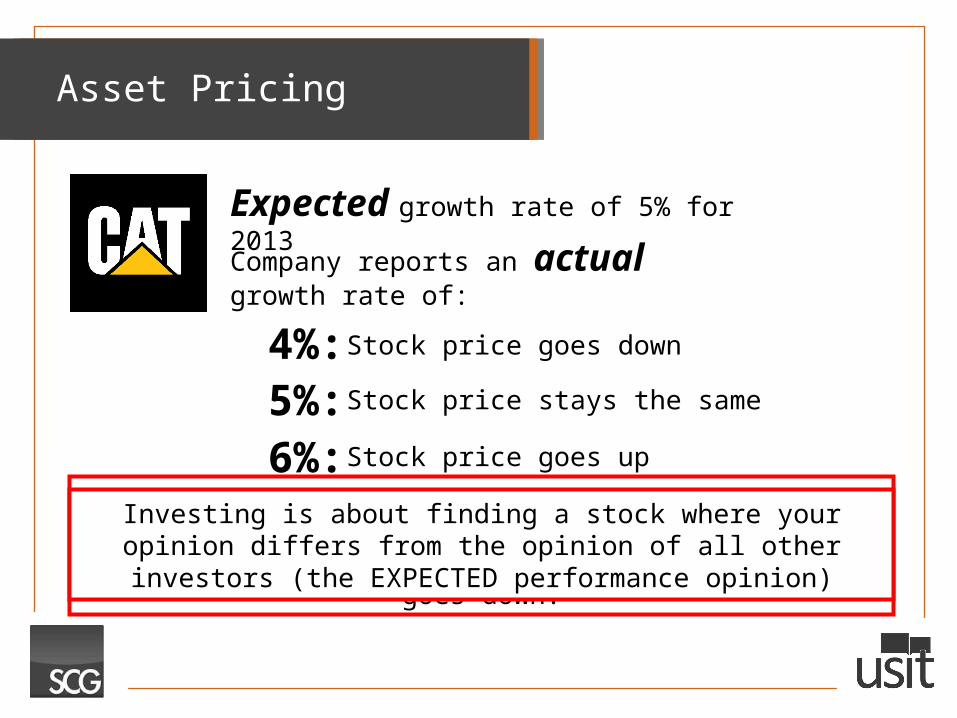
Expected growth rate of 5% for 2013
Company reports an actual growth rate of:
4%:5%:6%:
Stock price goes down
Stock price stays the same
Stock price goes up
Investing is about finding a stock where your opinion differs from the opinion of all other investors (the EXPECTED performance opinion)

Asset Pricing
So if I have to understand a company better than the experts to find a 6% growth rate when the experts expect 5%, how can I hope to compete as a college student?
There aren’t an infinite number of experts – small companies aren’t as intensely followed
Accounting has major flaws that hide value that not everyone has the time to sift through
You are the expert
Pension accountingTax Accounting
GAAP Accounting

Asset Pricing Sanity Check
1.) The value of a firm, and thus the firm’s stock is determined by EXPECTED future cash flows for the rest of its life
2.) We look for investments where we have an edge on everyone
else to find investments where the reality is going to be better than the expectation
2013 2018
We’ll walk through an easy example of cheating GAAP accounting to find hidden value
Asset Pricing
Investing is all about having a variant view- thinking differently than everyone else.
MATADOR
INVESTMENTSANN CAI • NIRAJ PAREKH • MATTHEW RINDELAUB •
ANDREW SMITH
(NYSE: ALJ)

Investment Thesis
1. Undervaluation – Intrinsic & Relative Undervaluation
2. Tax Advantage (MLP)3. Strategic Placement
Opera
tions
Stra
tegy
Financia
lsO
verv
iew

Investment Strategy
Opera
tions
Stra
tegy
Financia
ls
Overv
iew
Time Horizon: One year
Buy at current market price: $11.49
Stop-Loss at 20%: $9.19
Exit on oil price or technicals

Company Overview
Opera
tions
Stra
tegy
Financia
ls
Overv
iew
Alon USA Energy, Inc.Alon USA Partners,
LP
Master Limited Partnership (MLP)• Tax Shield• Lower cost of capital

OPERATIONS
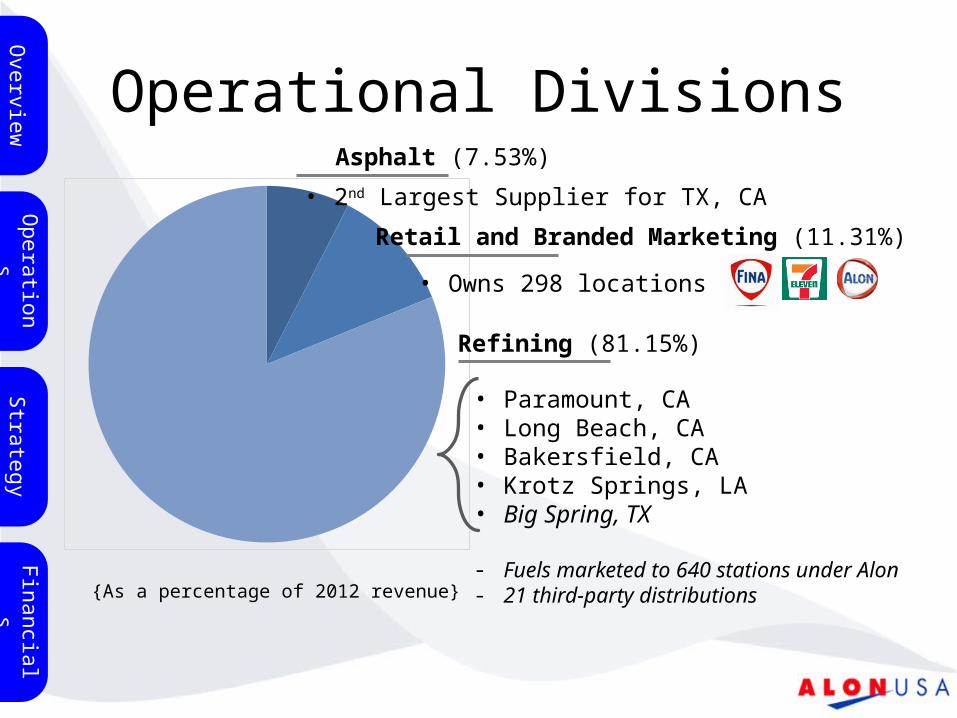
Operational Divisions
Overv
iew
Stra
tegy
Financia
ls
{As a percentage of 2012 revenue}
Refining (81.15%)
• Paramount, CA• Long Beach, CA• Bakersfield, CA• Krotz Springs, LA• Big Spring, TX
- Fuels marketed to 640 stations under Alon- 21 third-party distributions
Asphalt (7.53%)
• 2nd Largest Supplier for TX, CA
Retail and Branded Marketing (11.31%)
• Owns 298 locations
Opera
tions
Gross Margin
Overv
iew
Stra
tegy
Financia
ls
Opera
tions
Big Spring60%
Krotz Springs
22%
California1%
Asphalt4%
Retail13%
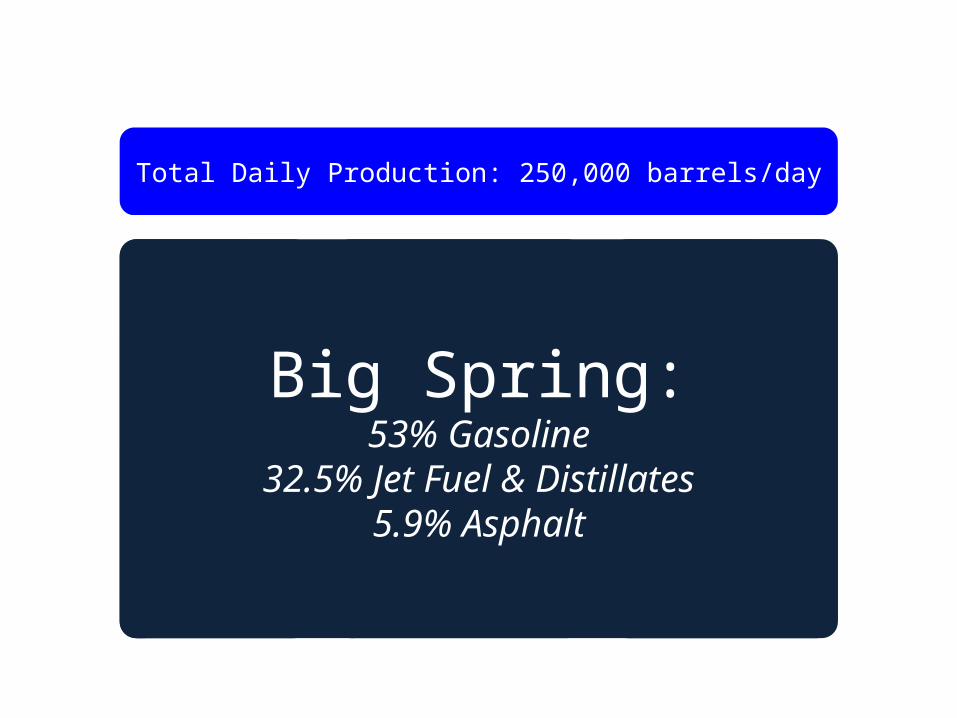
Total Daily Production: 250,000 barrels/day
California (combined):
70,000
Krotz Springs:74,000
Big Spring:70,000
Big Spring:53% Gasoline
32.5% Jet Fuel & Distillates5.9% Asphalt

STRATEGY

Porter’s Five Forces
Opera
tions
Financia
lsO
verv
iew
Rivalry
Threat of Entrants
Buyer Bargaining
Power
Supplier Bargaining Power
Threat of Substitutes
Stra
tegy

Strategic Positioning
1. Big Spring Refinery- Midland Locational Advantage- Inexpensive Sour Crude Refining
Technology
2. Diversification- C-Store Revenue Streams- California Refineries
Overv
iew
Opera
tions
Financia
ls
Stra
tegy
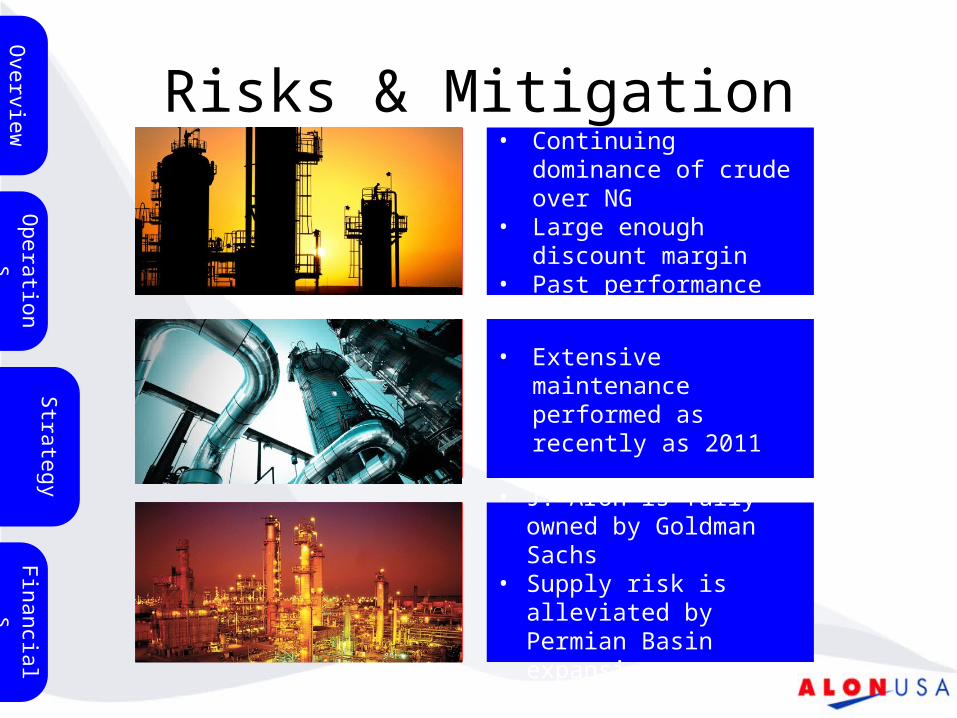
Risks & Mitigation
Opera
tions
Stra
tegy
Financia
lsO
verv
iew
Volatility of Crude Prices
Single Refinery = 60% of Gross
Margin
Largest Supplier & Customer is J. Aron
• Continuing dominance of crude over NG
• Large enough discount margin
• Past performance
• Extensive maintenance performed as recently as 2011
• J. Aron is fully owned by Goldman Sachs
• Supply risk is alleviated by Permian Basin expansion

FINANCIALS

Comparables
Overv
iew
Opera
tions
Stra
tegy
Financia
ls
CVI HFC MRO VLO WNR ALJ0.0x2.0x4.0x6.0x8.0x
10.0x12.0x14.0x16.0x18.0x
Market Cap/Levered FCF
CVI HFC MRO TSO VLO WNR ALJ0.0x
0.5x
1.0x
1.5x
2.0x
2.5x
3.0x
3.5x
P/TangBV
CVI HFC MRO TSO VLO WNR ALJ0.0x2.0x4.0x6.0x8.0x
10.0x12.0x14.0x16.0x18.0x
P/E
CVI HFC MRO TSO VLO WNR ALJ0.0x1.0x2.0x3.0x4.0x5.0x6.0x7.0x8.0x
TEV/EBIT

Comparables
Overv
iew
Opera
tions
Stra
tegy
CVI HFC MRO VLO WNR ALJ
TEV/Unlevered FCF
6.1x 5.4x 19.2x 11.6x 5.3x 3.9x
Mkt Cap/Levered FCF
6.0x 5.9x 17.0x 10.5x 5.2x 2.6x
CVI HFC MRO TSO VLO WNR ALJ
TEV/Revenues 0.4x 0.4x 1.9x 0.3x 0.2x 0.3x 0.2x
TEV/EBITDA 2.7x 2.8x 3.1x 5.6x 3.8x 3.1x 2.4x
TEV/EBIT 3.0x 3.1x 4.7x 6.8x 4.7x 3.4x 3.2x
P/E 5.8x 5.5x 15.6x 9.9x 7.4x 7.7x 5.2x
P/TangBV 2.7x 2.3x 1.3x 1.5x 1.1x 3.0x 1.3x
Companies Ticker: Alon USA Energy, Inc. ALJCVR Energy, Inc. CVIHollyFrontier Corporation HFCMarathon Oil Corporation MROTesoro Corporation TSOValero Energy Corporation VLOWestern Refining, Inc. WNR
ALJMedia
n
Implied Price
TEV/Revenues 0.20x 0.30x $ 17.24
TEV/EBITDA 2.40x 3.10x $ 14.84
TEV/EBIT 3.20x 3.40x $ 12.21
P/E 5.20x 7.40x $ 16.35
P/TangBV 1.30x 1.50x $ 13.26
TEV/Unlevered FCF 3.90x 5.75x $ 16.94
Mkt Cap/Levered FCF
2.60x 5.95x $ 26.29
Average Implied Price: $ 16.73 ALJ Current Price: $ 11.49
Discount: 46%
Financia
ls
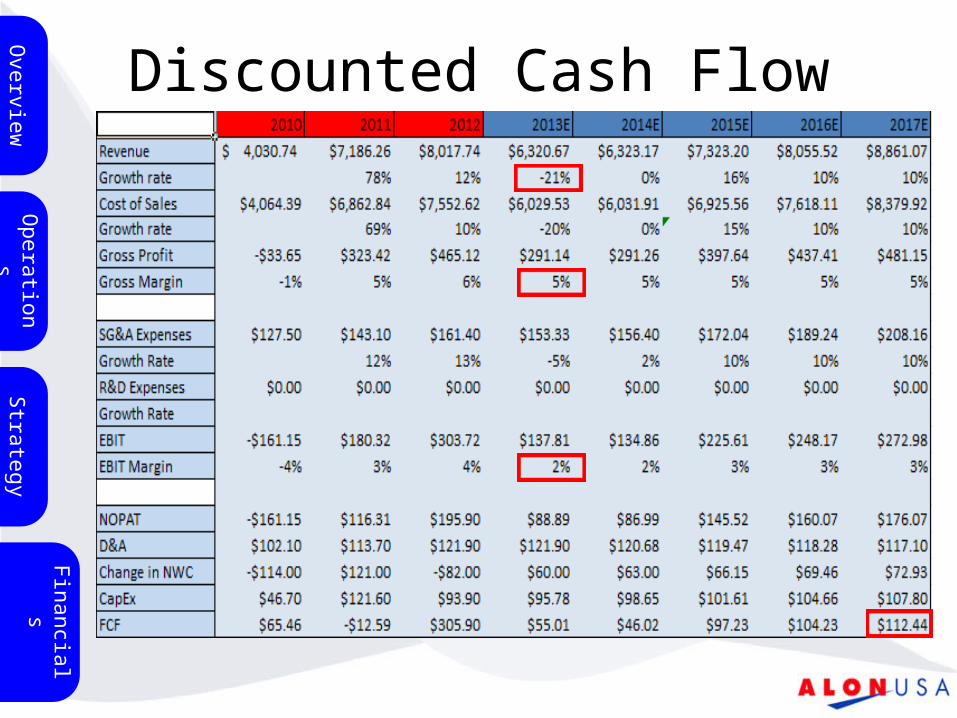
Discounted Cash Flow
Overv
iew
Opera
tions
Stra
tegy
Financia
ls

Financial Analysis
Overv
iew
Opera
tions
Stra
tegy
Financia
ls

MATADOR
INVESTMENTSQUESTIONS

Pitch Sign-Ups