Embed Size (px)
Citation preview
General Enquiries on the form should be made to:Defra, Procurements and Commercial Function (Evidence Procurement Team)E-mail: [email protected]
Evidence Project Final Report
NoteIn line with the Freedom of Information Act 2000, Defra aims to place the results of its completed research projects in the public domain wherever possible. The Evidence Project Final Report is designed to capture the information on the results and outputs of Defra-funded research in a format that is easily publishable through the Defra websiteAn Evidence Project Final Report must be completed for all projects.
This form is in Word format and the boxes may be expanded, as appropriate.
ACCESS TO INFORMATIONThe information collected on this form will be stored electronically and may be sent to any part of Defra, or to individual researchers or organisations outside Defra for the purposes of reviewing the project. Defra may also disclose the information to any outside organisation acting as an agent authorised by Defra to process final research reports on its behalf. Defra intends to publish this form on its website, unless there are strong reasons not to, which fully comply with exemptions under the Environmental Information Regulations or the Freedom of Information Act 2000.Defra may be required to release information, including personal data and commercial information, on request under the Environmental Information Regulations or the Freedom of Information Act 2000. However, Defra will not permit any unwarranted breach of confidentiality or act in contravention of its obligations under the Data Protection Act 1998. Defra or its appointed agents may use the name, address or other details on your form to contact you in connection with occasional customer research aimed at improving the processes through which Defra works with its contractors.
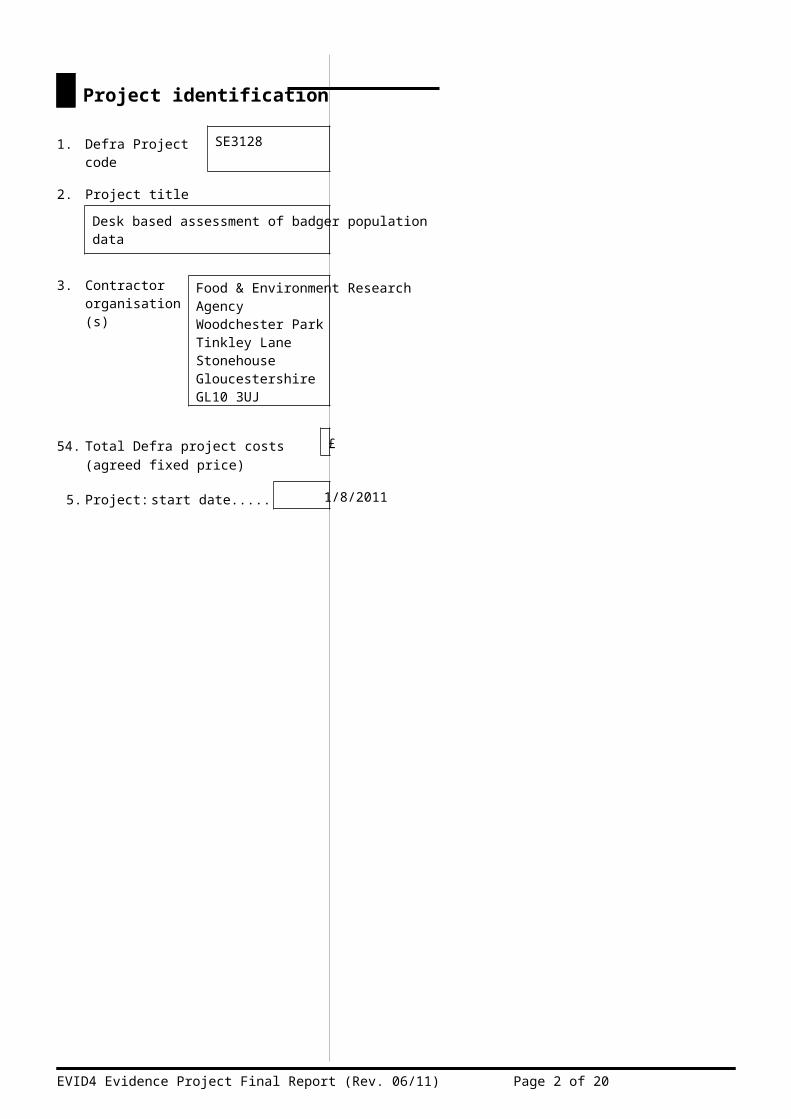
Project identification
1. Defra Project code SE3128
2. Project title
Desk based assessment of badger population data
3. Contractororganisation(s)
Food & Environment Research AgencyWoodchester ParkTinkley LaneStonehouse GloucestershireGL10 3UJ
54. Total Defra project costs £ 20348.20(agreed fixed price)
5. Project: start date................. 1/8/2011
EVID4 Evidence Project Final Report (Rev. 06/11) Page 1 of 14
end date.................. 31/10/2011
EVID4 Evidence Project Final Report (Rev. 06/11) Page 2 of 14

6. It is Defra’s intention to publish this form. Please confirm your agreement to do so...................................................................................YES NO (a) When preparing Evidence Project Final Reports contractors should bear in mind that Defra intends that
they be made public. They should be written in a clear and concise manner and represent a full account of the research project which someone not closely associated with the project can follow.Defra recognises that in a small minority of cases there may be information, such as intellectual property or commercially confidential data, used in or generated by the research project, which should not be disclosed. In these cases, such information should be detailed in a separate annex (not to be published) so that the Evidence Project Final Report can be placed in the public domain. Where it is impossible to complete the Final Report without including references to any sensitive or confidential data, the information should be included and section (b) completed. NB: only in exceptional circumstances will Defra expect contractors to give a "No" answer.In all cases, reasons for withholding information must be fully in line with exemptions under the Environmental Information Regulations or the Freedom of Information Act 2000.
(b) If you have answered NO, please explain why the Final report should not be released into public domain
Executive Summary7. The executive summary must not exceed 2 sides in total of A4 and should be understandable to the intelligent
non-scientist. It should cover the main objectives, methods and findings of the research, together with any other significant events and options for new work.
No large scale study of the badger population in Great Britain has been undertaken since the National Badger Survey in 1997. Therefore, there is no reliable evidence to support or refute claims of changes in badger abundance. The aim of this project was to collate data from a range of recent surveys of badger activity, collected for a range of research purposes from across England and Wales. These data were then to be evaluated for suitability for inferring badger abundance and, where possible, comparing and revising estimates in the same areas from the 1997 National Badger Survey.
Of six studies reviewed, three contained data that were suitable for these purposes. However, these were restricted to one county, and data on main sett densities and social group sizes were collected in slightly different ways across the studies. Hence the data was not suitable for extrapolation to areas beyond the locations of the specific studies, or for comparison with reported badger abundance figures from previous national surveys. Estimates of badger social group density derived from these studies were significantly higher than reported for comparable landscapes from the 1997 national badger survey. Rather than a reliable indication of a real increase in badger abundance, it is likely to be primarily due to the different ways that the estimates were calculated. The surveys reviewed here from which estimates of social group density could be made were proactively selected to be in areas with high badger density, whereas the national badger surveys were based on a random sample of survey plots that included areas that were less suitable for badgers. Valid estimates of regional and national badger abundance and comparisons with previous estimates would only be achievable by repeating previous stratified random surveys, using the same protocol.
The mean group size estimated from the studies reviewed, of approximately 7 badgers, could in principle be used, in combination with data on main sett density, to derive regional and national estimates of badger abundance. However, this was derived from data from research projects in one county only, where badger densities are known to be high. Badger social group sizes are known to vary considerably, and typical group sizes in different regions or landscapes may differ. Therefore, there is a need for more widely applicable estimates of badger group size, based on larger numbers of social groups sampled from a wider range of geographical areas
EVID4 Evidence Project Final Report (Rev. 06/11) Page 3 of 14
and landscape types.
Project Report to Defra8. As a guide this report should be no longer than 20 sides of A4. This report is to provide Defra with details of
the outputs of the research project for internal purposes; to meet the terms of the contract; and to allow Defra to publish details of the outputs to meet Environmental Information Regulation or Freedom of Information obligations. This short report to Defra does not preclude contractors from also seeking to publish a full, formal scientific report/paper in an appropriate scientific or other journal/publication. Indeed, Defra actively encourages such publications as part of the contract terms. The report to Defra should include: the objectives as set out in the contract; the extent to which the objectives set out in the contract have been met; details of methods used and the results obtained, including statistical analysis (if appropriate); a discussion of the results and their reliability; the main implications of the findings; possible future work; and any action resulting from the research (e.g. IP, Knowledge Exchange).
Introduction
Badgers contribute to the persistence of bovine tuberculosis (TB) in the UK cattle population and are implicated in cases of structural damage in the urban environment, both of which pose management issues for government. National badger sett surveys were carried out in the 1980s and in the 1990s. The number of badger social groups in Britain increased by an estimated 24% and the mean social group size increased by an estimated 47% between these two surveys (Wilson et al. 1997). No large scale survey of the national badger population has been undertaken since the National Badger Sett Survey in 1997. There is a commonly held perception that the badger population has increased further since the last national survey and that this population growth may exacerbate both disease transmission and the spread of the badger population into areas where they had not previously been numerous.
With the exception of the Scottish Badger Distribution Survey, which took place between 2007 and 2009, badger surveys carried out in Great Britain in the period since the last national survey in 1997 have been at a small scale. Furthermore, the majority of these have been in high density areas within a limited geographical area, mainly the south-west of England and in Wales and none had the specific aim of determining the size of the badger population. The only regularly monitored populations of wild badgers are those in Woodchester Park in Gloucestershire and Wytham Woods in Oxfordshire. At Woodchester Park the population more than doubled between 1978 and 1990 (Rogers et al. 1997), remained relatively constant between 1990 and 1997, reaching a peak in 1999 and declining year on year until 2004 (Vicente et al. 2007). The population at Wytham Woods also more than doubled between 1987 and 1996, decreased in the late 1990s and showed a slight upward trend from 2000 to 2002 (MacDonald et al. 2009). However, these are both small study sites and high density populations, and it is unknown whether the same trends have been experienced elsewhere.
The abundance of badgers is a function of both the number of social groups, and the number of animals within each social group. Changes in badger population size can take place via changes in either one of these components, or both. Rogers et al. (1997) found that the large increase in badger numbers at Woodchester Park was represented primarily by an increase in social group size rather than the number of social groups. Furthermore, Wilson et al. (1997) estimated that there had been significant increases in social group size across Britain as a whole between the surveys in the 80s and 90s. Therefore, when estimating the size of the badger population using the number of main setts as a proxy for the number of social groups, it is also necessary to have reliable estimates of the social group size.
The purpose of this study was to review recent badger research and management studies in order to collate information on badger main sett densities and social group sizes. Then, if the data was of sufficient quality, examine whether populations had changed since the last national survey
EVID4 Evidence Project Final Report (Rev. 06/11) Page 4 of 14
report in 1997.
Aims & ObjectivesThe main aims of the project are:
i. Review and collate available data on main sett densities and social group size from recent badger research and management studies.
ii. Evaluate the suitability of these data for inferring badger abundance.iii. Produce an mean number of main setts per kilometre square for the land class groups for
which we have sufficient dataiv. Compare (ii) above to the results presented in the 1997 national badger survey report, and
assess whether there have been any detectable changes since then in those land class groups.
v. If possible, estimate the mean social group size for these land class groups.
MethodsEvaluation of data suitabilityData were collated from badger surveys carried out as part of recent research and management projects, and evaluated for their suitability and availability for this project.
Woodchester Park
The Woodchester Park long term epidemiological study of badgers and TB is ongoing. Intensive live-trapping effort continues to be deployed, as well as annual bait marking exercises to delineate social group territories. Therefore the study provided contemporary data that was suitable for this project both in terms of social group densities and social group sizes.
Badger Vaccine Safety Study
The badger vaccine safety study (BVS) was carried out between the years 2006 and 2009 inclusive, and was considered sufficiently recent. The study area was subject to annual baitmarking to define social groups, and live-trapping was carried out twice each year across the 55 km2 study area. Therefore this study provided suitable data for social group densities and social group size.
Randomised Badger culling Trial
The project proposal suggested the inclusion of data from the Randomised Badger Culling Trial (RBCT) surveys and bait-marking operations. However, on inspection, it became apparent that despite the culling operations of the RBCT continuing until 2005, the initial surveys of the RBCT study areas were carried out between 1999 and 2002 (Bourne et al. 2007). It is the original survey data on the undisturbed populations that have value in this context. Hence these data were derived closer to the time of the last national badger survey than the present, and could not therefore be part of a comparison of the present situation with 1997.
Intensive Action Area
The Intensive Action Area (IAA) has data on the density of main setts over a large area (266km2) in Wales. We requested access to the survey data from the Welsh Government. However, the data were unavailable owing to Data Protection sensitivities.
Oral Bait Deployment Project
A significant number of badger setts have been the subject of research into developing optimum
EVID4 Evidence Project Final Report (Rev. 06/11) Page 5 of 14

strategies for deploying BCG vaccination by means of an oral bait, and in total 14.1km2 of land has been surveyed for badger setts to study. The study protocol involved selection of main setts, followed by surveying a circle of radius 300m around, in order to find other setts that might be used by the target badgers. The selective nature of this protocol means that it was not possible to use this data to calculate values for main setts/km2. Additionally, because the protocol did not require baitmarking to delineate social group territories, it was not possible to be fully confident that all badgers caught within this 300m radius belonged to the same social group, therefore it was not considered possible to calculate reliable social group size data from this dataset. Hence, these data were not included in these analyses.
Badger Vaccine Deployment Project
The Badger Vaccine Deployment Project (BVDP) was initially conceived to be a substantial project to learn lessons about the practicalities of deploying injectable BCG to badgers, and also to build capacity within the industry to deliver vaccination. The project initially included six areas of approximately 100km2, and these were surveyed to map the location of badger setts. This work was carried out between 2009 and 2011 and was therefore sufficiently recent to be included in this analysis.
Identification of main settsMain sett densities from Woodchester Park and the BVS were straightforward to extract. Due to the detailed knowledge held on these intensively studies sites, data on numbers of main setts, and the area surveyed were accessible, and a value for main setts/km2 could be calculated simply as number of main setts divide by area surveyed.
The protocol for the BVDP did not require that setts were classified as ‘main’ or otherwise, although data on the number of well-used, partially used and disused entrance holes at each sett was collected. Therefore there was no easily accessible data on social group densities in this dataset. Following a review of the badger research and management programme after the general election in 2010, this project’s scope was reduced to one area, near Stroud, in which badgers have been trapped and vaccinated in 2010 and 2011. For the purposes of this project, main setts were subjectively identified from the sett data using expert opinion based on the following information:
I. The number of animals, particularly cubs, caught. A main sett is generally where most of the social group are typically resident, and it is often the breeding sett. Therefore the presence of cubs trapped can help indicate that it is a main sett.
II. Main setts tend to be characteristically large. The total number of active, partially used and disused holes can be used to determine the likelihood of a sett being a main sett. Size of sett was used in the national badger survey to indicate a main setts and hence a social group. It is acknowledged that there will be a component of error around such subjective assessments.
III. Sett location relative to other active setts.IV. Knowledge of the study area, and distribution of badger activity signs.
Such detailed information was not held for the other five original BVDP areas that were not ultimately trapped and vaccinated. Given that around 1900 setts were identified in these areas, it was not possible within the timescale of this study to make a detailed subjective assessment of each sett’s size, location, proximity to other setts etc., in order to categorise them as main or other. We therefore analysed the sett characteristics of the other studies for which sett categorisation was held (BVS, OBDS, BVDP Stroud area). Over 75% (154/201) of main setts in the other studies had five or more entrance holes. We used this as a simple rule to apply to the 1900 setts in the BVDP areas, to determine which of these were main setts. Although this is consistent with the guidelines for classification of main setts in the national badger surveys (Cresswell et al, 1990; Wilson et al, 1997), the implications of such assumptions are discussed below.
EVID4 Evidence Project Final Report (Rev. 06/11) Page 6 of 14

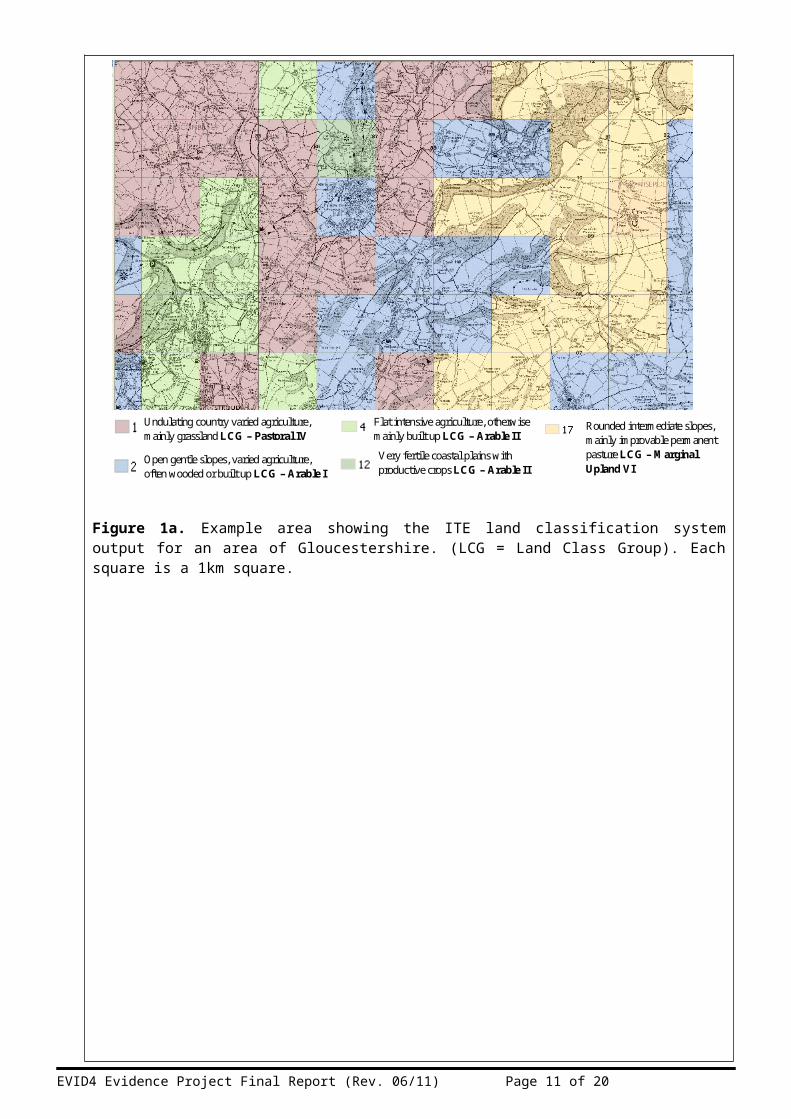
Land Class System / habitat dataThe initial proposal assumed the use of the Institute for Terrestrial Ecology’s (ITE – now Centre for Hydrology and Ecology (CEH)) Land Class System (Bunce et al. 1996) in order to make comparisons with output from the national badger surveys. The Land Class System assigns each 1km square in Britain to one of 32 Land Classes, based on the predominant landscape variables in each square, incorporating botanical, geological and topographical features (Figure 1a.). These 32 land classes were further grouped into seven broader land class groups, which represent a broad description of the landscape in the square. The system provides a standardised way of stratifying large scale ecological or environmental surveys, based on the assumption that there is likely to be associations between the environmental characteristics of the land and its ecological parameters. This system was the basis for the sampling strategy and analyses for the national badger surveys (Cresswell et al. 1991; Wilson et al. 1997), and therefore basing comparisons between current and past badger abundance parameters based within Land Class would have been a valid approach. However, on enquiry, it was found that the Land Class system is no longer maintained or available from CEH and has been superseded by the Land Cover Map 2000 system (LCM2000).
In order to use the most up-to-date habitat data available, we obtained the CEH Land Cover Map 2000 (LCM2000), to establish whether the previous and current habitat classification systems were comparable i.e. whether a Land Class Group could be assigned to a 1km square on the basis of the habitat data held for each square within the LCM2000 system. Achieving this would have allowed direct comparison of sett density data for the study areas for which we had contemporary sett density data from the previous national surveys, by Land Class Group. The LCM2000 is based on the Biodiversity Action Plan’s Broad Habitats, modified by what it was possible to analyse from satellite imagery. It provides detail of land use and habitat distribution at a much finer scale than the old Land Classification system (Figure 1b).
Significant resources, including experts in geographic systems both inside and out of Fera, were deployed in an attempt to reconcile the data from the two habitat systems for the study areas of interest. Approaches to achieving this included:
1. Extracting and comparing data from both systems to determine if there were any comparable factors
2. Utilising the intermediary of the Land Cover Map 1990, to determine if that dataset were comparable to the ITE Land Class system and LCM2000
3. Investigating whether an amalgamation of the habitat data to produce one main habitat type for the entire 1 km square resulted in information that could be compared to the old Land Class Groups.
These approaches were not successful in matching 1km squares based on the environmental data held in the two systems. This is likely to be due to the fact that the old Land Class system included a large number of environmental and landscape variables in additional to habitat, in the classification of squares. An illustration of how the landscape is classified in the two systems is shown in Figure 1. In order to carry out the analyses as proposed, it was necessary to use a version of the land class dataset from the personal archive of a Woodchester staff member who had previously worked with the data.
In addition to the primary aims of this project, we investigated the potential for utilising the LCM2000 data to explore the relationship between habitat characteristics and badger abundance and distribution.
EVID4 Evidence Project Final Report (Rev. 06/11) Page 7 of 14
Undulating country varied agriculture, mainly grassland LCG – Pastoral IV
Open gentle slopes, varied agriculture, often wooded or built up LCG – Arable I
Flat intensive agriculture, otherwise mainly built up LCG – Arable II
Rounded intermediate slopes, mainly improvable permanent pasture LCG – Marginal Upland VI
Very fertile coastal plains with productive crops LCG – Arable II
Figure 1a. Example area showing the ITE land classification system output for an area of Gloucestershire. (LCG = Land Class Group). Each square is a 1km square.
EVID4 Evidence Project Final Report (Rev. 06/11) Page 8 of 14

Broad-leaved woodland Coniferous Woodland Arable and Horticultural Improved Grassland Neutral Grassland Calcareous Grassland Standing Water/Canals Inland Rock Built Up Areas, Gardens
Figure 1b. Example of the CEH Land Cover Map 2000 for the same area of Gloucestershire.
Calculation of main sett densitiesInformation on main sett locations and areas surveyed from the reviewed studies, and the archived ITE Land Class data were imported into ArcMap 10 (ESRI, Redlands, California, USA) a Geographical Information System. Location data for setts, and the size of survey areas calculated by the GIS were then used to determine the number of setts per land class, the area of each land class surveyed (km2) and the mean sett density per km2.
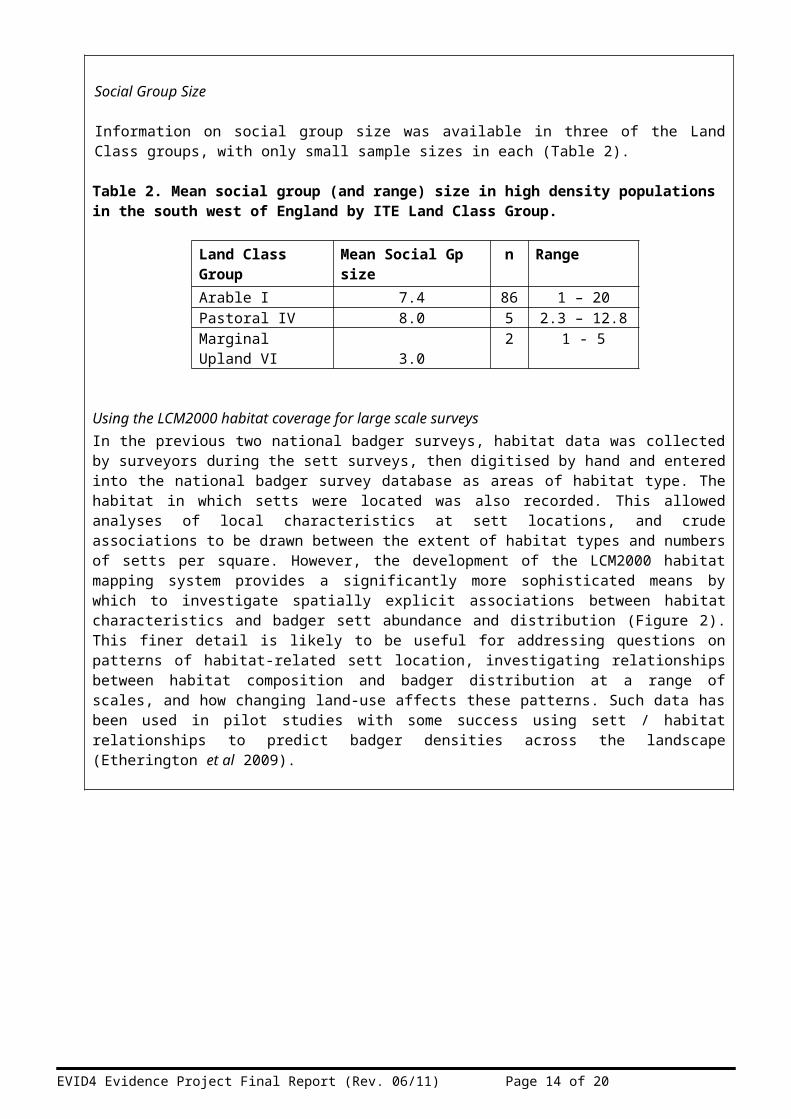
Calculation of social group sizeIn order to reliably estimate average badger social group size, it is necessary to know where the boundaries of the group territories are, such that the residents of all setts within the territory are considered when estimating group size. It is then necessary to estimate the number of badgers that are resident, using a robust method employing sufficient effort to produce an accurate and precise estimate. This has been achieved in the past through live-trapping, direct observations, and remote sampling of DNA. Of the studies available in this review, social group size data that met these criteria was only available from two of the projects, Woodchester Park and the BVS. These data were used to calculate mean group sizes by land class. These are clearly extremely limited in geographical distribution and sample size, and the implications of this for the results are discussed. Social group sizes at Woodchester Park were calculated using the Minimum Number Alive (MNA) index for each social group. MNA incorporates the number of individuals caught in year X, plus those that were not caught at that time point, but were caught in years X-1 and X+1, and therefore could be assumed to be alive in year X. The Woodchester Park population is trapped four times a year, and the MNA calculations included animals caught during a given year, and the previous and subsequent years (i.e. to get the social group size estimate for the year 2009, those individuals caught in any of the four trapping sessions that year plus any that were caught in 2008 and 2010, but not in 2009 were included). Information on group size from 2009 for
EVID4 Evidence Project Final Report (Rev. 06/11) Page 9 of 14
the BVS was estimated from the number of different individuals caught within each social group at any trapping event during that year. The MNA approach to estimating social group sizes could not be applied to the BVS data because of the trapping sequence ended in 2009. Trapping effort in the BVS was substantial and it is estimated that a high proportion of the resident badger population was trapped over the two trap-ups in 2009. It is acknowledged that calculating group size using different methods is problematic, however, although trapping protocols at Woodchester Park and in the BVS were not identical, data from these two sources are probably roughly comparable.
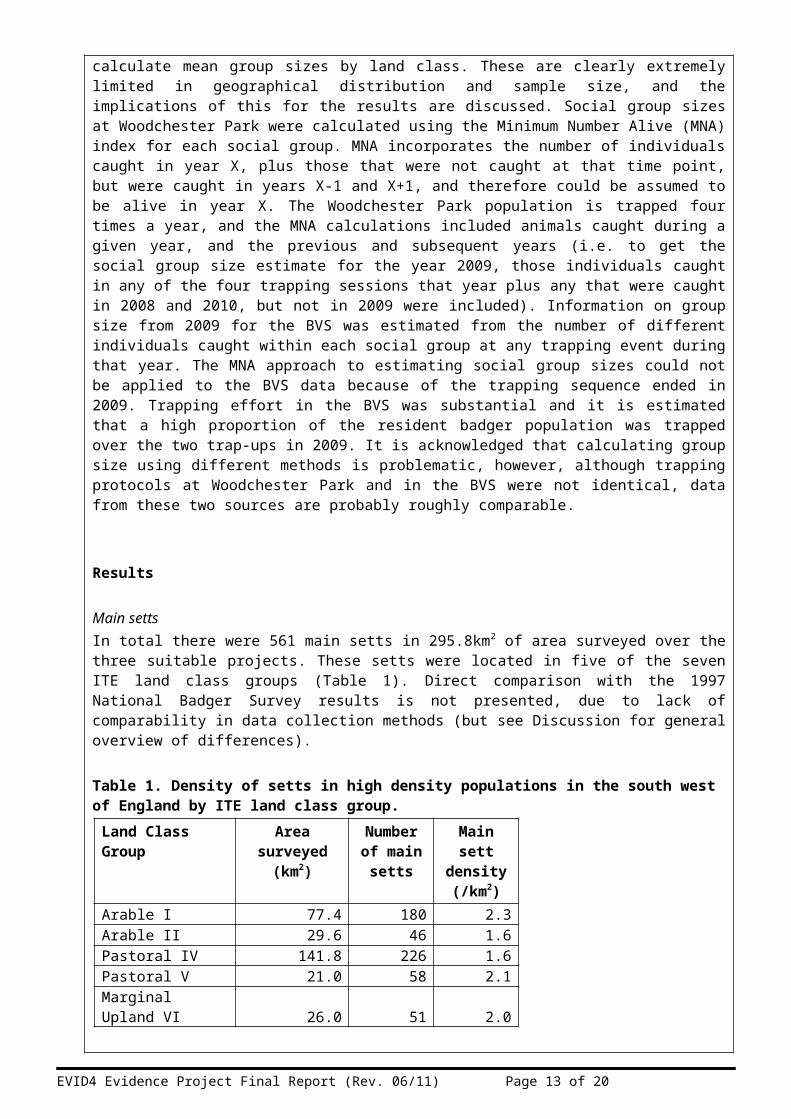
Results
Main settsIn total there were 561 main setts in 295.8km2 of area surveyed over the three suitable projects. These setts were located in five of the seven ITE land class groups (Table 1). Direct comparison with the 1997 National Badger Survey results is not presented, due to lack of comparability in data collection methods (but see Discussion for general overview of differences).
Table 1. Density of setts in high density populations in the south west of England by ITE land class group.
Land Class Group Area surveyed
(km2)
Number of main
setts
Main sett density (/km2)
Arable I 77.4 180 2.3Arable II 29.6 46 1.6Pastoral IV 141.8 226 1.6Pastoral V 21.0 58 2.1Marginal Upland VI 26.0 51 2.0
Social Group Size
Information on social group size was available in three of the Land Class groups, with only small sample sizes in each (Table 2).
Table 2. Mean social group (and range) size in high density populations in the south west of England by ITE Land Class Group.
Land Class Group Mean Social Gp size n RangeArable I 7.4 86 1 – 20Pastoral IV 8.0 5 2.3 – 12.8Marginal Upland VI 3.0 2 1 - 5
Using the LCM2000 habitat coverage for large scale surveysIn the previous two national badger surveys, habitat data was collected by surveyors during the sett surveys, then digitised by hand and entered into the national badger survey database as areas of habitat type. The habitat in which setts were located was also recorded. This allowed analyses of local characteristics at sett locations, and crude associations to be drawn between the extent of habitat types and numbers of setts per square. However, the development of the LCM2000 habitat mapping system provides a significantly more sophisticated means by which to investigate spatially explicit associations between habitat characteristics and badger sett abundance and distribution (Figure 2). This finer detail is likely to be useful for addressing questions on patterns of habitat-related sett location, investigating relationships between habitat composition and badger distribution at a range of scales, and how changing land-use affects these patterns. Such data has been used in pilot studies with some success using sett / habitat
EVID4 Evidence Project Final Report (Rev. 06/11) Page 10 of 14
relationships to predict badger densities across the landscape (Etherington et al 2009).
Broad-leaved woodland
Coniferous Woodland
Arable & Horticulture
Improved Grassland
Calcareous Woodland
● Main sett
Figure 2. Example of the broad habitat detail laid over sett survey data within a 1km square using the CEH Land Cover Map 2000.
Discussion
The primary aims of this study were to review whether recent badger research and management
EVID4 Evidence Project Final Report (Rev. 06/11) Page 11 of 14

studies contained suitable data on badger main sett densities and social group sizes that could be extrapolated to estimate badger abundance more widely, and to compare these estimates with the last national survey estimates. When evaluated independently and collectively, it became apparent that these studies have limited utility for estimating badger social group density that could be reliably extrapolated across a wider area.
The BVS, Woodchester Park study and the BVDP had suitable data for investigating main sett densities, but these data were heavily skewed toward the lowland pastoral and arable land class groups. This is due to the fact that these study sites were positively selected to cover areas with both endemic TB and high badger densities, to meet with their research aims. Only the BVS and Woodchester Park datasets contained reliable social group size data. It is very clear that these represent a modest sample size at best, that is very geographically limited. In addition, the differences in methodology between studies from which the data were derived also pose problems for comparison and extrapolation. The data here was dominated by the BVDP, in which certain assumptions had to be made to retrospectively identify main setts from the survey data. This is clearly prone to possible bias, and relatively small changes to the rules applied to discriminate main setts could have made differences to mean main sett densities.
The mean density of main setts for the 5 Land Class Groups where data were available was substantially higher than reported in the last national survey in the same Land Class Groups. This ranged from an 83% increase in Pastoral IV to over a five-fold increase in Arable I and Marginal Upland VI. Rather than reliably indicating a real and very large increase in badger abundance, however, these results are most likely to be largely an artefact of the different ways that the values were derived. The national survey was based on a randomly distributed sample of 1km squares. Naturally, a significant proportion of these covered areas which were less suitable for badgers, and did not have badger main setts. By contrast, the studies reviewed here were proactively chosen on the basis that they were likely to have large badger populations, in order to meet their project goals. Therefore it is not possible to extrapolate the results on mean main sett density to rest of the landscape covered by these Land Class Groups.
A similar conclusion is drawn on the estimates of mean social group size. The two studies providing data on social group size covered land represented by only three Land Class Groups (Arable I, Pastoral IV and two setts in Marginal Upland VI). The mean group size of 7.4 badgers, from a sample of 86 social groups in Land Class Group Arable I, may be realistic for that land class. However, because the data were derived solely from a small geographical area where badger density was high, and from a single Land Class, they may not be representative of other geographical regions or Land Class categories.
It is clear from this review that it is not possible to produce predictions of badger abundance across either the region, or the country, owing to the geographically limited and selective nature of the studies from which data is available. Valid estimates of regional and national badger social group abundance, and comparisons with previous estimates can only be achieved via stratified random surveys, using a comparable protocol to that used in previous national surveys. This is now underway in England and Wales. In addition, in order to translate estimates of numbers of social groups in England and Wales into estimates of numbers of badgers, it may be necessary to collect additional data on social group sizes representing different regions and landscapes.
The ITE Land Class system of 1km squares in the United Kingdom, as used in the previous national badger surveys is no longer maintained. This system has been replaced with the Land Cover Map, a finer scale habitat mapping tool. It was not possible to reconcile the new system with the old Land Class such that a 1km square’s Land Class could be predicted from its LCM2000 habitat data. However, this system remains valid as a basis on which to repeat the national badger surveys, using the archived Land Class data. Estimates of badger abundance (and changes in badger abundance) at a country scale will still benefit in terms of smaller confidence intervals if the sample squares are stratified by Land Class. The substantial differences in the abundance of badgers, both regionally and between Land Class groups identified in the previous two surveys, further supports the stratified random sampling using optimal allocation of sample squares based on Land Class groups proposed for the recently commissioned Badger Survey of England and Wales.
EVID4 Evidence Project Final Report (Rev. 06/11) Page 12 of 14
We were able to use this project to investigate the potential benefits to the proposed Badger Survey of England and Wales in utilising the more up-to-date and finer scale habitat data that are now available. The new system enables accurate, fine grain habitat assignment over very large areas. With regard to the Badger Survey of England and Wales, the ability to overlay sett locations on to detailed habitat maps at such a scale for the first time has significant potential as a research resource. Possibilities include refinement of models to predict badger abundance and distribution on the basis of habitat composition, and monitoring the response of badger populations to changing land-use.
Conclusions
1. The estimates of mean main sett density derived from the available datasets are not suitable for comparison with values from the previous national surveys, or extrapolation to the wider countryside.
2. In order to estimate badger abundance and distribution, and compare these with previously reported figures, a repeat of previous national surveys is required, using a comparable protocol i.e., surveying a random sample of 1km squares, stratified by Land Class.
3. The mean group size estimated from the reviewed studies was 7.4. However, these studies were from one county only. It is not known how representative this value for group size is of other landscapes or geographical areas.
Implications for future work
The ongoing badger survey of England and Wales will produce estimates of the number of badger setts and social groups in the two countries. To produce estimates of badger abundance, it will be necessary to multiply the estimated number of badger social groups by badger social group size. It is clear from this current study that reliable data on badger social group size is held from a relatively limited geographical area.
Hence, in order to estimate the abundance of badgers, and minimise the potential bias introduced by use of a group size value that may not be representative of much the wider countryside, it may be necessary to estimate group size in a range of different geographic locations and landscapes. This data would allow the proper incorporation of the range of variation in social group sizes that exists, to produce unbiased estimates of badger abundance regionally and nationally.
EVID4 Evidence Project Final Report (Rev. 06/11) Page 13 of 14
References to published material9. This section should be used to record links (hypertext links where possible) or references to other
published material generated by, or relating to this project.
Bourne, F. J., Donnelly, C., Cox D., Gettinby, G., McInerney, J., Morrison, I. & Woodroffe, R. (2007) Bovine TB: The Scientific Evidence, A Science Base for a Sustainable Policy to Control TB in Cattle, An Epidemiological Investigation into Bovine Tuberculosis. Final Report of the Independent Scientific Group on Cattle TB. London: Department for Environment, Food and Rural Affairs.
Bunce R. G. H., Barr C. J., Clarke R. T., Howard D. C. & Lane A. M. J. (1996) Land Classification for Strategic Ecological Survey. Journal of Environmental Management 47, 37 – 60.
Cresswell P., Harris S. & Jefferies D. J. (1990) The History, Distribution, Status And Habitat Requirements Of The Badger In Britain. Nature Conservancy Council, Peterborough, UK.
Etherington, T.R., Ward, I., Smith, G.C., Pietravalle, S. & Wilson, G.J. (2009) Using the Mahalanobis distance statistic with unplanned presence-only survey data for biogeographical models of species distribution and abundance: a case study of badger setts. Journal of Biogeography 36, 845-853.
Macdonald D. W., Newman C., Nouvellet P. M. & Buesching C. D. (2009) An Analysis of Eurasian Badger (Meles meles) Population Dynamics: Implications for Regulatory Mechanisms. Journal of Mammalogy 90(6), 1392 – 1403. Rogers L. M., Cheeseman C. L. & Mallinson P. J. (1997) The demography of a high density badger (Meles meles) population in the west of England. Journal of Zoology London 242, 705 – 728.
Vicente J., Delahay R. J., Walker N. J. & Cheeseman C. L. (2007) Social Organisation and Movement Influence the Incidence of Bovine Tuberculosis in an Undisturbed High-Density badger Meles meles population. Journal of Animal Ecology 76, 348 – 360.
Wilson G., Harris S. & McLaren G. (1997) Changes in the British Badger Population 1988 to 1997. PTES, London.
EVID4 Evidence Project Final Report (Rev. 06/11) Page 14 of 14