Embed Size (px)
Citation preview
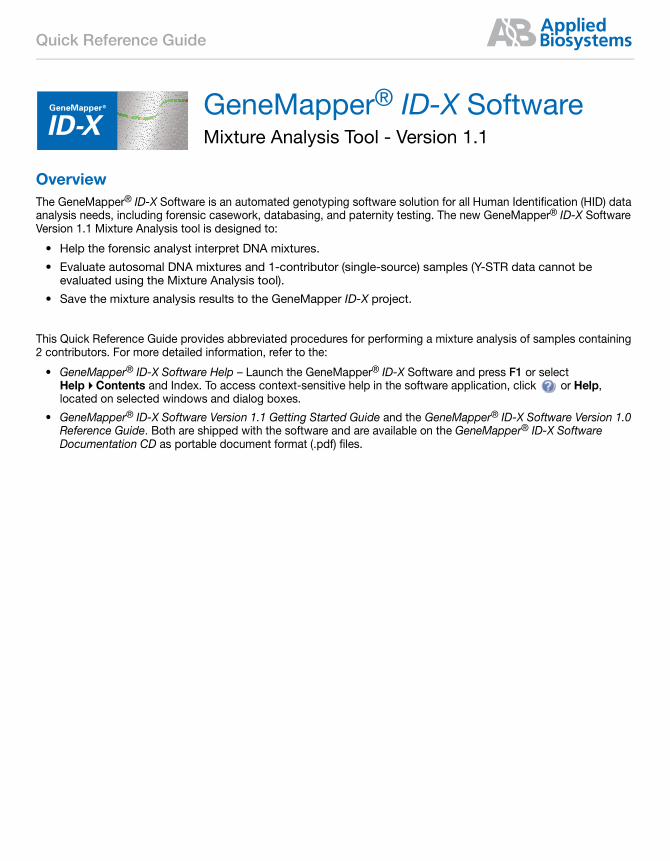
GeneMapper® ID-X SoftwareMixture Analysis Tool - Version 1.1
OverviewThe GeneMapper® ID-X Software is an automated genotyping software solution for all Human Identification (HID) data analysis needs, including forensic casework, databasing, and paternity testing. The new GeneMapper® ID-X Software Version 1.1 Mixture Analysis tool is designed to:
• Help the forensic analyst interpret DNA mixtures.
• Evaluate autosomal DNA mixtures and 1-contributor (single-source) samples (Y-STR data cannot be evaluated using the Mixture Analysis tool).
• Save the mixture analysis results to the GeneMapper ID-X project.
This Quick Reference Guide provides abbreviated procedures for performing a mixture analysis of samples containing 2 contributors. For more detailed information, refer to the:
• GeneMapper® ID-X Software Help – Launch the GeneMapper® ID-X Software and press F1 or select Help Contents and Index. To access context-sensitive help in the software application, click or Help, located on selected windows and dialog boxes.
• GeneMapper® ID-X Software Version 1.1 Getting Started Guide and the GeneMapper® ID-X Software Version 1.0 Reference Guide. Both are shipped with the software and are available on the GeneMapper® ID-X Software Documentation CD as portable document format (.pdf) files.
Quick Reference Guide
Page 2
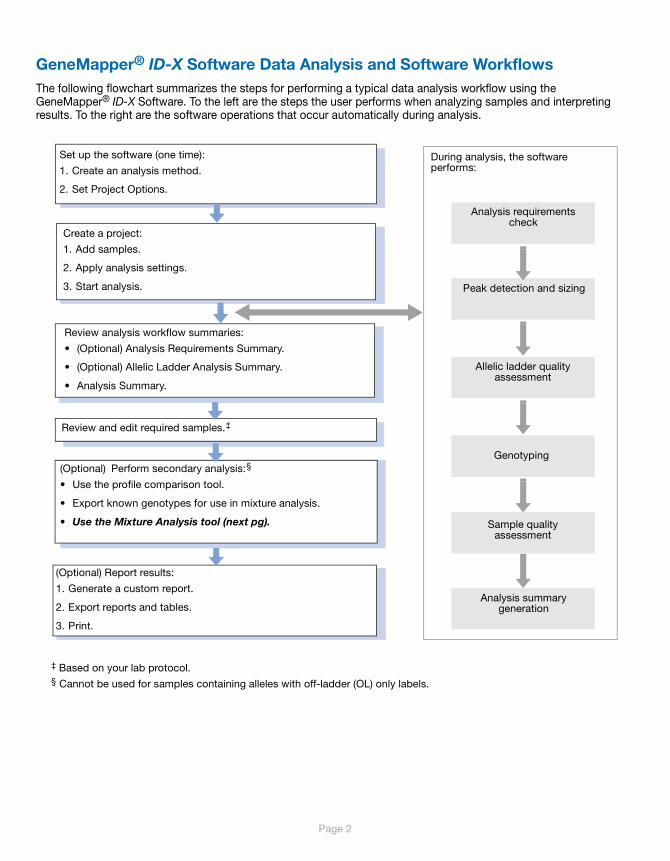
GeneMapper® ID-X Software Data Analysis and Software WorkflowsThe following flowchart summarizes the steps for performing a typical data analysis workflow using the GeneMapper® ID-X Software. To the left are the steps the user performs when analyzing samples and interpreting results. To the right are the software operations that occur automatically during analysis.
Review analysis workflow summaries:
• (Optional) Analysis Requirements Summary.
• (Optional) Allelic Ladder Analysis Summary.
• Analysis Summary.
Create a project:
1. Add samples.
2. Apply analysis settings.
3. Start analysis.
Set up the software (one time):
1. Create an analysis method.
2. Set Project Options.
Review and edit required samples.‡
(Optional) Report results:
1. Generate a custom report.
2. Export reports and tables.
3. Print.
(Optional)‡Perform secondary analysis:§
• Use the profile comparison tool.
• Export known genotypes for use in mixture analysis.
• Use the Mixture Analysis tool (next pg).
During analysis, the software performs:
Analysis summary generation
Sample quality assessment
Genotyping
Allelic ladder quality assessment
Peak detection and sizing
Analysis requirements check
‡ Based on your lab protocol.§ Cannot be used for samples containing alleles with off-ladder (OL) only labels.

Page 3
Mixture Analysis WorkflowThis flowchart summarizes the steps for performing mixture analysis using the GeneMapper® ID-X Software.
Prepare for mixture analysis:
1. (Optional) Open the GeneMapper ID-X project containing samples for mixture analysis.
2. Select Mixture Analysis from the Tools menu.
3. (Optional) Create mixture analysis methods.
4. (Optional) Import population databases to be used for statistical calculations.
5. Select samples and mixture analysis methods.
(Optional) Export results, then print.
View previously saved mixture analysis results.
2 contributors
Software segregates...eligible samples
Review analysis results (per sample):
1. Review genotype combinations and (optional) known matches.
2. Display plots and view peak data.
3. Select genotype combinations for statistical calculations.
4. Select Sample Review Complete.
Calculate statistics:
1 and 2 contributors
Review RMP statistics.
2 and ≥ 3 contributors
Review CPI/CPE statistics.
1 and 2 contributors
Review LR statistics.
Select population database(s).
≥ 3 contributors1 contributor
Select analysis options for statistical calculations (per marker).
Software identifies the most likely genotype combinations for each contributor profile
Begin new analysis:1. (Optional) Import known genotypes.
2. Extract contributors.
(Optional) Merge sample analysis results (≥1 panel):
1. Select one panel per marker.
2. Review merged marker data for statistical calculations.
Software identifies samples with the same sample name and automatically merges marker data (when possible)
Select reference(s) and hypotheses.
Page 4
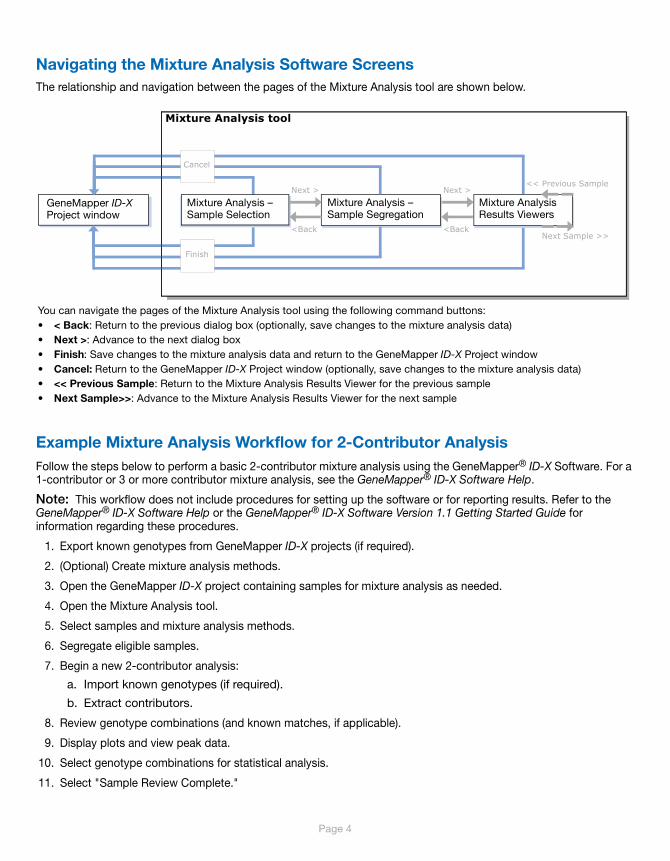
Navigating the Mixture Analysis Software ScreensThe relationship and navigation between the pages of the Mixture Analysis tool are shown below.
Example Mixture Analysis Workflow for 2-Contributor AnalysisFollow the steps below to perform a basic 2-contributor mixture analysis using the GeneMapper® ID-X Software. For a 1-contributor or 3 or more contributor mixture analysis, see the GeneMapper® ID-X Software Help.
Note: This workflow does not include procedures for setting up the software or for reporting results. Refer to the GeneMapper® ID-X Software Help or the GeneMapper® ID-X Software Version 1.1 Getting Started Guide for information regarding these procedures.
1. Export known genotypes from GeneMapper ID-X projects (if required).
2. (Optional) Create mixture analysis methods.
3. Open the GeneMapper ID-X project containing samples for mixture analysis as needed.
4. Open the Mixture Analysis tool.
5. Select samples and mixture analysis methods.
6. Segregate eligible samples.
7. Begin a new 2-contributor analysis:
a. Import known genotypes (if required).
b. Extract contributors.
8. Review genotype combinations (and known matches, if applicable).
9. Display plots and view peak data.
10. Select genotype combinations for statistical analysis.
11. Select "Sample Review Complete."
Mixture Analysis tool
GeneMapper ID-X Project window
Mixture Analysis – Sample Segregation
Mixture Analysis – Sample Selection
Next >
<Back
Next >
<Back
<< Previous Sample
Next Sample >>
Mixture Analysis Results Viewers
Cancel
Finish
You can navigate the pages of the Mixture Analysis tool using the following command buttons:• < Back: Return to the previous dialog box (optionally, save changes to the mixture analysis data)• Next >: Advance to the next dialog box• Finish: Save changes to the mixture analysis data and return to the GeneMapper ID-X Project window• Cancel: Return to the GeneMapper ID-X Project window (optionally, save changes to the mixture analysis data)• << Previous Sample: Return to the Mixture Analysis Results Viewer for the previous sample• Next Sample>>: Advance to the Mixture Analysis Results Viewer for the next sample
Page 5
12. (Optional) Review and merge the mixture analysis results from one or more panels:
a. Review the merged marker data.
b. Select markers for statistical analysis.
13. Calculate and review statistics:
a. Select population database(s).
b. Review the Combined Probability of Inclusion/Exclusion (CPI/CPE) results. or Review the Random Match Probability (RMP) results.
And/or
a. Select population database(s).
b. Specify references and select hypotheses for Likelihood Ratio calculations.
c. Review the Likelihood Ratio (LR) results for samples containing 1 and 2 contributors.
14. (Optional) Export and print results.
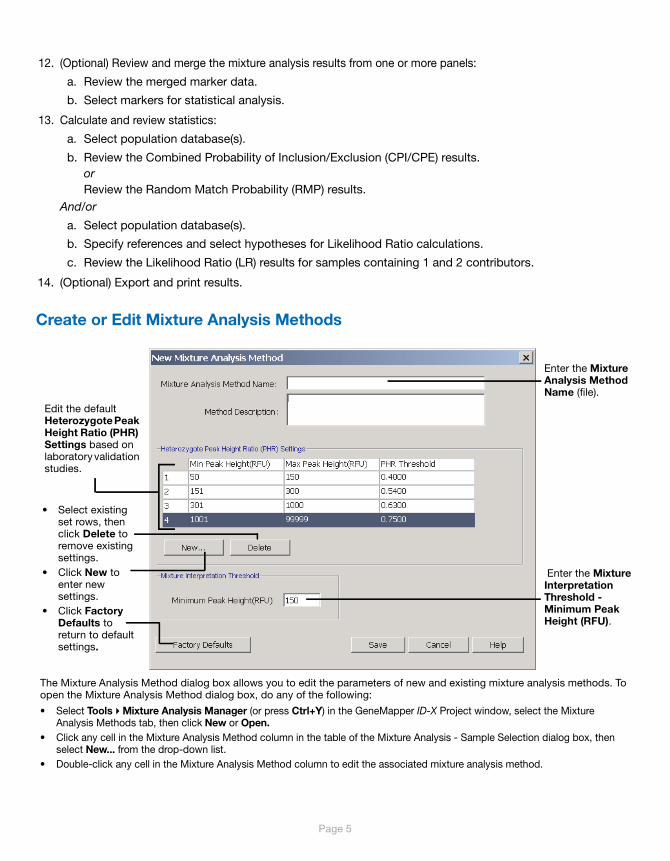
Create or Edit Mixture Analysis Methods
• Select existing set rows, then click Delete to remove existing settings.
• Click New to enter new settings.
• Click Factory Defaults to return to default settings.
Enter the Mixture Interpretation Threshold - Minimum Peak Height (RFU).
Edit the default Heterozygote Peak Height Ratio (PHR) Settings based on laboratory validation studies.
The Mixture Analysis Method dialog box allows you to edit the parameters of new and existing mixture analysis methods. To open the Mixture Analysis Method dialog box, do any of the following:
• Select Tools Mixture Analysis Manager (or press Ctrl+Y) in the GeneMapper ID-X Project window, select the Mixture Analysis Methods tab, then click New or Open.
• Click any cell in the Mixture Analysis Method column in the table of the Mixture Analysis - Sample Selection dialog box, then select New... from the drop-down list.
• Double-click any cell in the Mixture Analysis Method column to edit the associated mixture analysis method.
Enter the Mixture Analysis Method Name (file).
Page 6
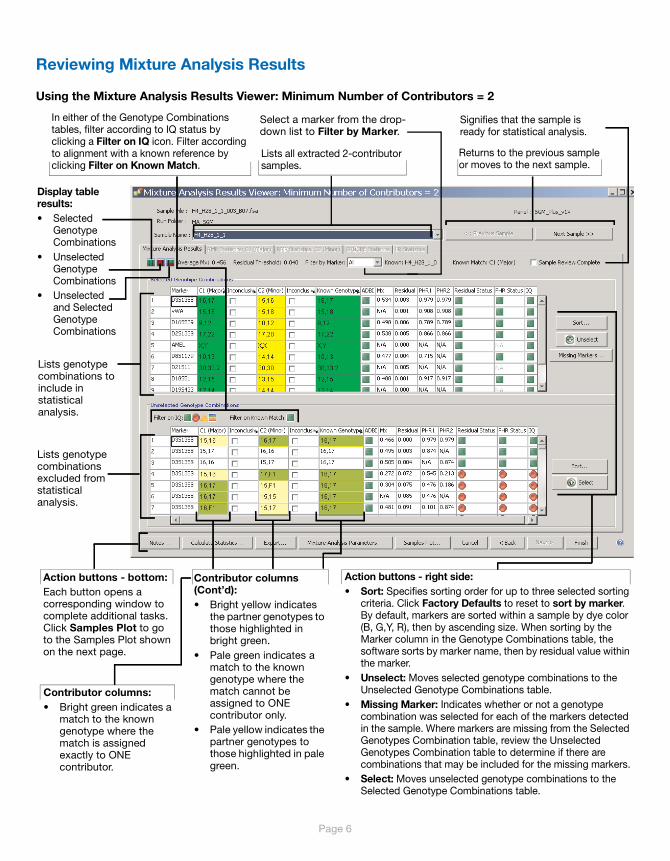
Reviewing Mixture Analysis Results
Using the Mixture Analysis Results Viewer: Minimum Number of Contributors = 2
Lists genotype combinations to include in statistical analysis.
Returns to the previous sample or moves to the next sample.
Lists genotype combinations excluded from statistical analysis.
Display table results:• Selected
Genotype Combinations
• Unselected Genotype Combinations
• Unselected and Selected Genotype Combinations
Action buttons - right side:• Sort: Specifies sorting order for up to three selected sorting
criteria. Click Factory Defaults to reset to sort by marker. By default, markers are sorted within a sample by dye color (B, G,Y, R), then by ascending size. When sorting by the Marker column in the Genotype Combinations table, the software sorts by marker name, then by residual value within the marker.
• Unselect: Moves selected genotype combinations to the Unselected Genotype Combinations table.
• Missing Marker: Indicates whether or not a genotype combination was selected for each of the markers detected in the sample. Where markers are missing from the Selected Genotypes Combination table, review the Unselected Genotypes Combination table to determine if there are combinations that may be included for the missing markers.
• Select: Moves unselected genotype combinations to the Selected Genotype Combinations table.
Action buttons - bottom:Each button opens a corresponding window to complete additional tasks. Click Samples Plot to go to the Samples Plot shown on the next page.
Lists all extracted 2-contributor samples.
Contributor columns(Cont’d):• Bright yellow indicates
the partner genotypes to those highlighted in bright green.
• Pale green indicates a match to the known genotype where the match cannot be assigned to ONE contributor only.
• Pale yellow indicates the partner genotypes to those highlighted in pale green.
In either of the Genotype Combinations tables, filter according to IQ status by clicking a Filter on IQ icon. Filter according to alignment with a known reference by clicking Filter on Known Match.
Select a marker from the drop-down list to Filter by Marker.
Signifies that the sample is ready for statistical analysis.
Contributor columns:• Bright green indicates a
match to the known genotype where the match is assigned exactly to ONE contributor.
Page 7
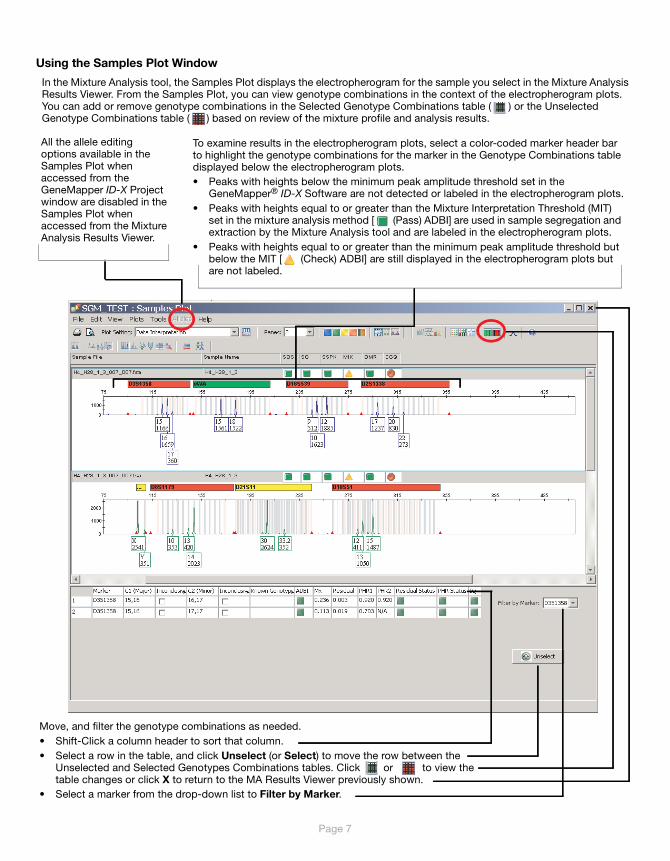
Using the Samples Plot Window
In the Mixture Analysis tool, the Samples Plot displays the electropherogram for the sample you select in the Mixture Analysis Results Viewer. From the Samples Plot, you can view genotype combinations in the context of the electropherogram plots. You can add or remove genotype combinations in the Selected Genotype Combinations table ( ) or the Unselected Genotype Combinations table ( ) based on review of the mixture profile and analysis results.
All the allele editing options available in the Samples Plot when accessed from the GeneMapper ID-X Project window are disabled in the Samples Plot when accessed from the Mixture Analysis Results Viewer.
Move, and filter the genotype combinations as needed. • Shift-Click a column header to sort that column.• Select a row in the table, and click Unselect (or Select) to move the row between the
Unselected and Selected Genotypes Combinations tables. Click or to view the table changes or click X to return to the MA Results Viewer previously shown.
• Select a marker from the drop-down list to Filter by Marker.
To examine results in the electropherogram plots, select a color-coded marker header bar to highlight the genotype combinations for the marker in the Genotype Combinations table displayed below the electropherogram plots.• Peaks with heights below the minimum peak amplitude threshold set in the
GeneMapper® ID-X Software are not detected or labeled in the electropherogram plots.• Peaks with heights equal to or greater than the Mixture Interpretation Threshold (MIT)
set in the mixture analysis method [ (Pass) ADBI] are used in sample segregation and extraction by the Mixture Analysis tool and are labeled in the electropherogram plots.
• Peaks with heights equal to or greater than the minimum peak amplitude threshold but below the MIT [ (Check) ADBI] are still displayed in the electropherogram plots but are not labeled.
Page 8
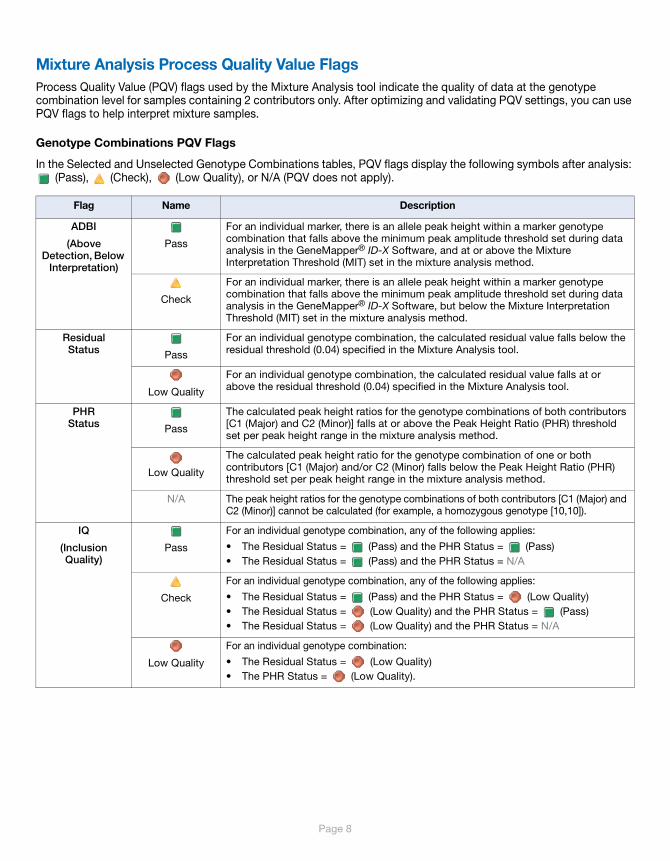
Mixture Analysis Process Quality Value Flags Process Quality Value (PQV) flags used by the Mixture Analysis tool indicate the quality of data at the genotype combination level for samples containing 2 contributors only. After optimizing and validating PQV settings, you can use PQV flags to help interpret mixture samples.
Genotype Combinations PQV Flags
In the Selected and Unselected Genotype Combinations tables, PQV flags display the following symbols after analysis: (Pass), (Check), (Low Quality), or N/A (PQV does not apply).
Flag Name Description
ADBI
(Above Detection, Below
Interpretation)
Pass
For an individual marker, there is an allele peak height within a marker genotype combination that falls above the minimum peak amplitude threshold set during data analysis in the GeneMapper® ID-X Software, and at or above the Mixture Interpretation Threshold (MIT) set in the mixture analysis method.
Check
For an individual marker, there is an allele peak height within a marker genotype combination that falls above the minimum peak amplitude threshold set during data analysis in the GeneMapper® ID-X Software, but below the Mixture Interpretation Threshold (MIT) set in the mixture analysis method.
Residual Status
Pass
For an individual genotype combination, the calculated residual value falls below the residual threshold (0.04) specified in the Mixture Analysis tool.
Low Quality
For an individual genotype combination, the calculated residual value falls at or above the residual threshold (0.04) specified in the Mixture Analysis tool.
PHR Status
Pass
The calculated peak height ratios for the genotype combinations of both contributors [C1 (Major) and C2 (Minor)] falls at or above the Peak Height Ratio (PHR) threshold set per peak height range in the mixture analysis method.
Low Quality
The calculated peak height ratio for the genotype combination of one or both contributors [C1 (Major) and/or C2 (Minor) falls below the Peak Height Ratio (PHR) threshold set per peak height range in the mixture analysis method.
N/A The peak height ratios for the genotype combinations of both contributors [C1 (Major) and C2 (Minor)] cannot be calculated (for example, a homozygous genotype [10,10]).
IQ
(Inclusion Quality)
Pass
For an individual genotype combination, any of the following applies:
• The Residual Status = (Pass) and the PHR Status = (Pass) • The Residual Status = (Pass) and the PHR Status = N/A
Check
For an individual genotype combination, any of the following applies:
• The Residual Status = (Pass) and the PHR Status = (Low Quality)• The Residual Status = (Low Quality) and the PHR Status = (Pass) • The Residual Status = (Low Quality) and the PHR Status = N/A
Low Quality
For an individual genotype combination:
• The Residual Status = (Low Quality)• The PHR Status = (Low Quality).
Page 9
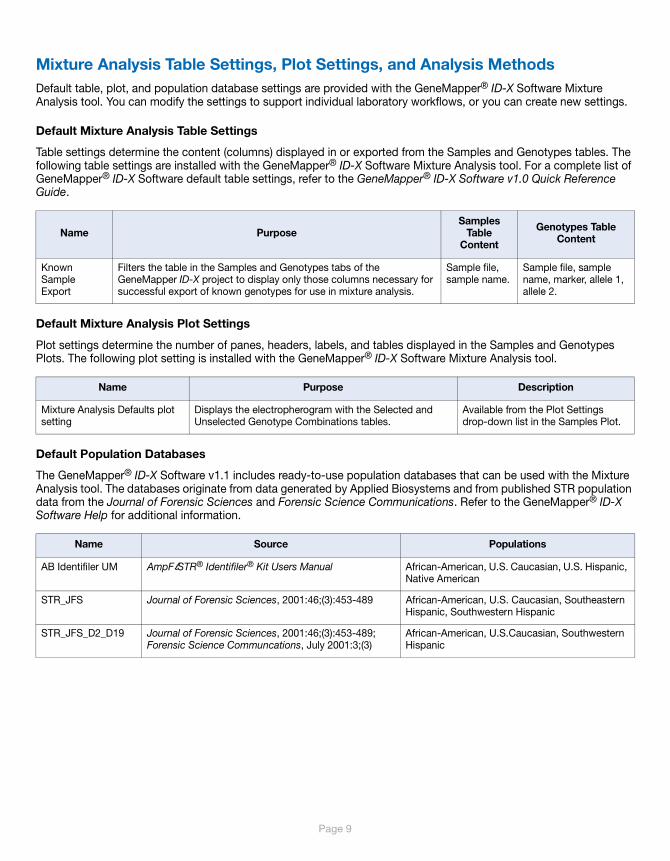
Mixture Analysis Table Settings, Plot Settings, and Analysis MethodsDefault table, plot, and population database settings are provided with the GeneMapper® ID-X Software Mixture Analysis tool. You can modify the settings to support individual laboratory workflows, or you can create new settings.
Default Mixture Analysis Table Settings
Table settings determine the content (columns) displayed in or exported from the Samples and Genotypes tables. The following table settings are installed with the GeneMapper® ID-X Software Mixture Analysis tool. For a complete list of GeneMapper® ID-X Software default table settings, refer to the GeneMapper® ID-X Software v1.0 Quick Reference Guide.
Default Mixture Analysis Plot Settings
Plot settings determine the number of panes, headers, labels, and tables displayed in the Samples and Genotypes Plots. The following plot setting is installed with the GeneMapper® ID-X Software Mixture Analysis tool.
Default Population Databases
The GeneMapper® ID-X Software v1.1 includes ready-to-use population databases that can be used with the Mixture Analysis tool. The databases originate from data generated by Applied Biosystems and from published STR population data from the Journal of Forensic Sciences and Forensic Science Communications. Refer to the GeneMapper® ID-X Software Help for additional information.
Name PurposeSamples
Table Content
Genotypes Table Content
Known Sample Export
Filters the table in the Samples and Genotypes tabs of the GeneMapper ID-X project to display only those columns necessary for successful export of known genotypes for use in mixture analysis.
Sample file, sample name.
Sample file, sample name, marker, allele 1, allele 2.
Name Purpose Description
Mixture Analysis Defaults plot setting
Displays the electropherogram with the Selected and Unselected Genotype Combinations tables.
Available from the Plot Settings drop-down list in the Samples Plot.
Name Source Populations
AB Identifiler UM AmpFlSTR® Identifiler® Kit Users Manual African-American, U.S. Caucasian, U.S. Hispanic, Native American
STR_JFS Journal of Forensic Sciences, 2001:46;(3):453-489 African-American, U.S. Caucasian, Southeastern Hispanic, Southwestern Hispanic
STR_JFS_D2_D19 Journal of Forensic Sciences, 2001:46;(3):453-489; Forensic Science Communcations, July 2001:3;(3)
African-American, U.S.Caucasian, Southwestern Hispanic
Page 10
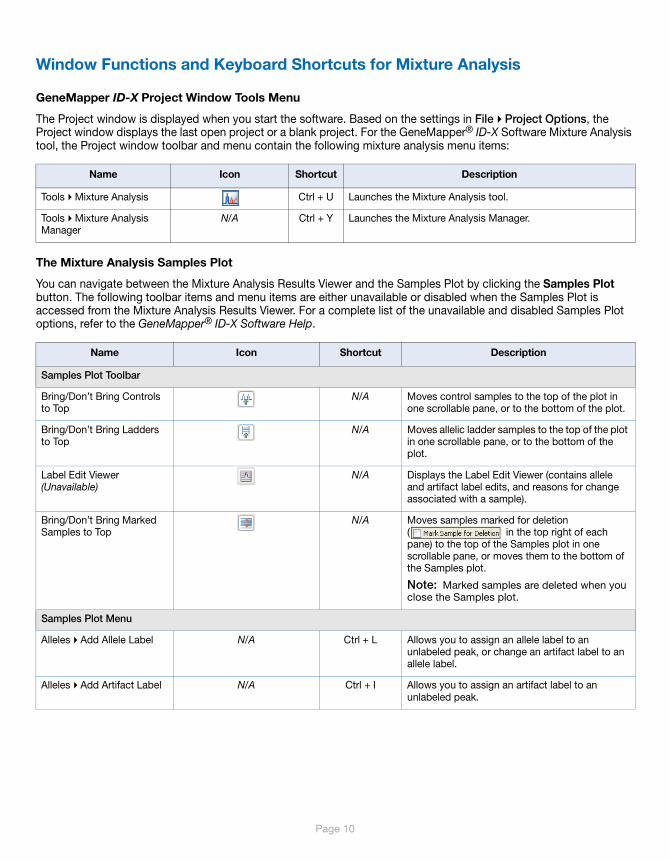
Window Functions and Keyboard Shortcuts for Mixture Analysis
GeneMapper ID-X Project Window Tools Menu
The Project window is displayed when you start the software. Based on the settings in File Project Options, the Project window displays the last open project or a blank project. For the GeneMapper® ID-X Software Mixture Analysis tool, the Project window toolbar and menu contain the following mixture analysis menu items:
The Mixture Analysis Samples Plot
You can navigate between the Mixture Analysis Results Viewer and the Samples Plot by clicking the Samples Plot button. The following toolbar items and menu items are either unavailable or disabled when the Samples Plot is accessed from the Mixture Analysis Results Viewer. For a complete list of the unavailable and disabled Samples Plot options, refer to the GeneMapper® ID-X Software Help.
Name Icon Shortcut Description
Tools Mixture Analysis Ctrl + U Launches the Mixture Analysis tool.
Tools Mixture Analysis Manager
N/A Ctrl + Y Launches the Mixture Analysis Manager.
Name Icon Shortcut Description
Samples Plot Toolbar
Bring/Don’t Bring Controls to Top
N/A Moves control samples to the top of the plot in one scrollable pane, or to the bottom of the plot.
Bring/Don’t Bring Ladders to Top
N/A Moves allelic ladder samples to the top of the plot in one scrollable pane, or to the bottom of the plot.
Label Edit Viewer (Unavailable)
N/A Displays the Label Edit Viewer (contains allele and artifact label edits, and reasons for change associated with a sample).
Bring/Don’t Bring Marked Samples to Top
N/A Moves samples marked for deletion ( in the top right of each pane) to the top of the Samples plot in one scrollable pane, or moves them to the bottom of the Samples plot.
Note: Marked samples are deleted when you close the Samples plot.
Samples Plot Menu
Alleles Add Allele Label N/A Ctrl + L Allows you to assign an allele label to an unlabeled peak, or change an artifact label to an allele label.
Alleles Add Artifact Label N/A Ctrl + I Allows you to assign an artifact label to an unlabeled peak.

Page 11
www.appliedbiosystems.com
© Copyright 2008, Applied Biosystems. All rights reserved.
For Research, Forensic, or Paternity Use Only. Not for use in diagnostic procedures.
Information in this document is subject to change without notice. Applied Biosystems assumes no responsibility for any errors that may appear in this document.
GeneMapper® ID-X Software has undergone a verification process defined by Applied Biosystems. However, human identification laboratories analyzing forensic, paternity, databasing and single-source samples that choose to use GeneMapper ID-X Software for data analysis should perform their own appropriate validation studies.
APPLIED BIOSYSTEMS DISCLAIMS ALL WARRANTIES WITH RESPECT TO THIS DOCUMENT, EXPRESSED OR IMPLIED, INCLUDING BUT NOT LIMITED TO THOSE OF MERCHANTABILITY OR FITNESS FOR A PARTICULAR PURPOSE. IN NO EVENT SHALL APPLIED BIOSYSTEMS BE LIABLE, WHETHER IN CONTRACT, TORT, WARRANTY, OR UNDER ANY STATUTE OR ON ANY OTHER BASIS FOR SPECIAL, INCIDENTAL, INDIRECT, PUNITIVE, MULTIPLE OR CONSEQUENTIAL DAMAGES IN CONNECTION WITH OR ARISING FROM THIS DOCUMENT, INCLUDING BUT NOT LIMITED TO THE USE THEREOF.
Notice to Purchaser: License Disclaimer.
Purchase of this software product alone does not imply any license under any process, instrument or other apparatus, system, composition, reagent or kit rights under patent claims owned or otherwise controlled by Applera Corporation, either expressly, or by estoppel.
TRADEMARKS:
Applied Biosystems, AB (Design), AmpFlSTR, GeneMapper and Identifiler are registered trademarks of Applied Biosystems Inc. or its subsidiaries in the US and/or certain other countries.
This product includes software developed by the Apache Software Foundation.
This product includes software developed by the ExoLab Project.
JNIRegistry is copyrighted © by ICE Engineering, Inc.
Microsoft and Excel are registered trademarks of Microsoft Corporation.
All other trademarks are the sole property of their respective owners.
9/2008
Part Number 4402094 Rev. A