Embed Size (px)
Citation preview

HAL Id: hal-00493484https://hal.archives-ouvertes.fr/hal-00493484
Submitted on 19 Jun 2010
HAL is a multi-disciplinary open accessarchive for the deposit and dissemination of sci-entific research documents, whether they are pub-lished or not. The documents may come fromteaching and research institutions in France orabroad, or from public or private research centers.
L’archive ouverte pluridisciplinaire HAL, estdestinée au dépôt et à la diffusion de documentsscientifiques de niveau recherche, publiés ou non,émanant des établissements d’enseignement et derecherche français ou étrangers, des laboratoirespublics ou privés.
Gene expression profiling of leukemia T-cells resistant tomethotrexate and 7-hydroxymethotrexate reveals
alterations that preserve intracellular levels of folate andnucleotide biosynthesis
Alan Kambiz Fotoohi, Yehuda G. Assaraf, Ali Moshfegh, Jamileh Hashemi,Gerrit Jansen, Godefridus J. Peters, Catharina Larsson, Freidoun Albertioni
To cite this version:Alan Kambiz Fotoohi, Yehuda G. Assaraf, Ali Moshfegh, Jamileh Hashemi, Gerrit Jansen, et al..Gene expression profiling of leukemia T-cells resistant to methotrexate and 7-hydroxymethotrexatereveals alterations that preserve intracellular levels of folate and nucleotide biosynthesis. BiochemicalPharmacology, Elsevier, 2009, 77 (8), pp.1410. �10.1016/j.bcp.2008.12.026�. �hal-00493484�
Accepted Manuscript
Title: Gene expression profiling of leukemia T-cells resistantto methotrexate and 7-hydroxymethotrexate reveals alterationsthat preserve intracellular levels of folate and nucleotidebiosynthesis
Authors: Alan Kambiz Fotoohi, Yehuda G. Assaraf, AliMoshfegh, Jamileh Hashemi, Gerrit Jansen, Godefridus J.Peters, Catharina Larsson, Freidoun Albertioni<ce:footnoteid="fn1"><ce:note-para>These authors have contributedequally to the paper.</ce:note-para></ce:footnote>
PII: S0006-2952(09)00004-5DOI: doi:10.1016/j.bcp.2008.12.026Reference: BCP 10059
To appear in: BCP
Received date: 20-11-2008Revised date: 30-12-2008Accepted date: 30-12-2008
Please cite this article as: Fotoohi AK, Assaraf YG, Moshfegh A, Hashemi J, JansenG, Peters GJ, Larsson C, Albertioni F, Gene expression profiling of leukemia T-cellsresistant to methotrexate and 7-hydroxymethotrexate reveals alterations that preserveintracellular levels of folate and nucleotide biosynthesis, Biochemical Pharmacology(2008), doi:10.1016/j.bcp.2008.12.026
This is a PDF file of an unedited manuscript that has been accepted for publication.As a service to our customers we are providing this early version of the manuscript.The manuscript will undergo copyediting, typesetting, and review of the resulting proofbefore it is published in its final form. Please note that during the production processerrors may be discovered which could affect the content, and all legal disclaimers thatapply to the journal pertain.

Page 1 of 30
Accep
ted
Man
uscr
ipt
1
Gene expression profiling of leukemia T-cells resistant to methotrexate and
7-hydroxymethotrexate reveals alterations that preserve intracellular levels of
folate and nucleotide biosynthesis
Alan Kambiz Fotoohi, 1,* Yehuda G. Assaraf, 2,* Ali Moshfegh, 1,# Jamileh Hashemi, 3, #
Gerrit Jansen, 4 Godefridus J. Peters,5 Catharina Larsson, 3 and Freidoun Albertioni1
1 Department of Oncology and Pathology, Karolinska Institutet, Cancer Center Karolinska, Karolinska University Hospital, Stockholm, Sweden;
2 The Fred Wyszkowski Cancer Research Laboratory, Department of Biology, Technion-Israel Institute of Technology, Haifa, Israel;
3 Department of Molecular Medicine and Surgery, Karolinska Institutet, CMM Karolinska University Hospital, Stockholm, Sweden;
4 Department of Rheumatology, University Hospital Vrije Universteit, Amsterdam, the Netherlands;
5 Department of Medical Oncology, VU University Medical Center, Amsterdam, the Netherlands
*,# These authors have contributed equally to the paper
Key words: Methotrexate, 7-hydroxymethotrexate, resistance, leukemia, folylpolyglutamate synthetase, reduced folate carrier, thymidylate synthase, microarray, real-time quantitative RT-PCR
Running title: Expression profiles of 7-OHMTX and MTX-resistant cells
Abbreviations: MTX, methotrexate; 7-OHMTX, 7-hydroxymethotrexate; IC50, the drug concentration inhibiting cell growth by 50%; DHFR, dihydrofolate reductase; TS, thymidylate synthase; RFC, reduced folate carrier; FPGS, folylpolyglutamate synthetase; FPGH, folylpolyglutamate hydrolase; GARFT, glycinamide ribonucleotide formyltransferase, MRP, multidrug resistance-associated protein.
Grant support: The Children Cancer Foundation, The Cancer and Allergy Foundation, The Cancer Society in Stockholm, The King Gustaf V Jubilee Fund, Swedish Medical Society, Swedish Cancer Foundation, Swedish Research Council, Göran Gustafsson Foundation for Research in Natural Sciences and Medicine, and Karolinska Institutet Foundations
Correspondence and requests for reprints to Freidoun Albertioni, Cancer Center Karolinska, Department of Oncology and Pathology, Karolinska Institutet, Karolinska University Hospital, Stockholm, Sweden, SE-171 76 Stockholm, Sweden.Phone: +46 (0) 8 517 75832; fax: +46 (0) 8 517 75042; e-mail: [email protected]

Page 2 of 30
Accep
ted
Man
uscr
ipt
2
Abstract
In vitro treatment of human T-cell leukemia cells with 7-hydroxymethotrexate , the major
metabolite of methotrexate resulted in acquired resistance as a result of the complete loss of
folypolyglutamate synthetase (FPGS) activity. This was in contradistinction to the major
modality of antifolate resistance of impaired drug transport in leukemia cells exposed to
methotrexate.. To identify the genes associated with methotrexate and 7-
hydroxymethotrexate resistance, we herein explored the patterns of genome-wide expression
profiles in these antifolte-resistant leukemia sublines. mRNA levels of the reduced folate
carrier, the primary influx transporter of folates and antifolates, were down-regulated >2-fold
in methotrexate -resistant cells. The dramatic loss of FPGS activity in 7-hydroxymethotrexate
- resistant cells was associated with alterations in the expression of various genes aimed at
preserving reduced folates and/or enhancing purine nucleotide biosynthesis e.g. methylene
tetrahydrofolate reductase, glycinamide ribonucleotide formyltransferase, adenosine
deaminase, cystathionine β synthase, as well as the ATP-dependent folate exporters
BCRP/ABCG2 and MRP1/ABCC1. The observed changes in gene expression were generally
not paralleled by acquired DNA copy numbers alterations, suggesting transcriptional
regulatory mechanisms. Interestingly, gene expression of DNA/RNA metabolism and
transport genes were more profoundly altered in methotrexate -resistant subline, whereas in
7-hydroxymethotrexate -resistant cells, the most profoundly affected groups of genes were
those encoding for proteins involved in metabolism and cellular proliferation. Thus, the
present investigation provides evidence that 7-hydroxymethotrexate induces gene expression
alterations and an antifolate resistance modality that are distinct from its parent drug
methotrexate.

Page 3 of 30
Accep
ted
Man
uscr
ipt
3
1. Introduction
During the past six decades, the rate of success in curing childhood acute lymphoblastic
leukemia (ALL) has increased from less than 10% to more than 80%. This dramatic
improvement is largely due to optimization of the use of existing chemotherapeutic agents.
Methotrexate (MTX) is the major anti-metabolite (Fig. 1) employed in combination
chemotherapeutic regimens for childhood ALL. Treatment failure is mainly related to
acquired drug resistance or selection of pre-existing molecular alterations facilitating
antifolate resistance.
The mechanisms of action and resistance to MTX and its major metabolite 7-
hydroxymethotrexate (7-OHMTX) have been characterized in some detail [1, 2]. Decreased
cellular uptake via the reduced folate carrier (RFC/SLC19A1) [3] or increased active efflux
mediated by ABC transporters such as the multidrug resistance-associated proteins 1-5 (MRP
1-5), the breast cancer resistance protein (BCRP/ABCG2) [4, 5] and P-glycoprotein (MDR or
ABCB1) [6] can lead to resistance to hydrophilic and lipophilic antifolates. The ability of
cells to accumulate long chain MTX polyglutamates (MTX-PGs) is highly dependent on the
activities of folylpolyglutamate synthetase (FPGS) and folylpolyglutamate hydrolase
(FPGH). Furthermore, the susceptibility of cells to the cytotoxic effect elicited by MTX may
also be influenced by mutations in the dihydrofolate reductase gene (DHFR) that result in a
lower affinity for MTX, by increased activity of thymidylate synthase (TS), as well as by
altered activities of other folate- and one-carbon metabolism enzymes.

Page 4 of 30
Accep
ted
Man
uscr
ipt
4
The metabolite 7-OHMTX (Fig. 1) results from oxidation of MTX primarily by hepatic
aldehyde oxidase. Intracellular conversion of MTX to 7-OHMTX has also been demonstrated
in leukemia cells [7] . Although the affinity of DHFR for 7-OHMTX is markedly lower
(>100-fold) than for MTX [8] , the polyglutamated forms of this metabolite are more potent
inhibitors of this enzyme [9, 10] . Polyglutamated forms of MTX and polyglutamated
conjugates of 7-OHMTX are also capable of inhibiting a number of other folate-dependent
enzymes involved in de novo purine biosynthesis such as TS, glycinamide ribonucleotide
formyltransferase (GARFT) and aminoimidazole carboxamide ribonucleotide
formyltransferase (AICART).
We have recently reported that prolonged exposure of human leukemic T-cells to 7-OHMTX
leads to antifolate resistance that attenuates the efficacy of MTX [11] . While the primary
mechanism of resistance to MTX was a marked reduction in RFC-mediated drug uptake,
resistance to 7-OHMTX was due to a dramatic decrease (>98%) in FPGS activity, which
enhanced resistance to short-term (4 hr) exposure to MTX more than 100-fold. To further
characterize the molecular mechanisms associated with acquired resistance to MTX and 7-
OHMTX in human leukemia cells, we characterized gene expression profiles and alterations
in gene copy numbers using high density microarrays. The results revealed disparate cellular
responses to MTX and 7-OHMTX that may facilitate the identification of novel cellular
targets and modalities of resistance to 7-OHMTX as well as possibly suggesting novel
approaches to overcome antifolate resistance and design individualized antifolate-based drug
therapy of human leukemia.

Page 5 of 30
Accep
ted
Man
uscr
ipt
5
2. Materials and Methods
2.1 Materials
The HG-U133A GeneChip oligonucleotide microarray and all reagents required for microarray analysis were purchased from Affymetrix (Affymetrix Inc., Santa Clara, CA, USA). TaqMan reagents and gene expression assays were obtained from Applied Biosystems (Stockholm, Sweden) including: folylpolyglutamate synthetase (FPGS, No: Hs00191956 m1), folylpolyglutamate hydrolase (FPGH/GGH, No: Hs00608257_m1), the reduced folate carrier (RFC/SLC19A1, No: Hs00161870_m1), glycinamide ribonucleotide transformylase (GART, No: Hs00531926_m1), 5-aminoimidazole-4-carboxamide ribonucleotide formyltransferase (AICART, No: Hs00269671_m1), 5-methyltetrahydrofolate-homocysteine methyltransferase (MTR, No: Hs00165188_m1), 5,10-methylenetetrahydrofolate reductase (MTHFR, No: Hs00195560_m1), multidrug resistance-associated proteins 4 (MRP4, No: Hs00195260), and 5 (MRP5, No: Hs00194701_m1), and glyceraldehyde-3-phosphate dehydrogenase (GAPDH, No: Hs99999905_m1).
2.2 Comparison of plasma MTX and 7-OHMTX levels in MTX treated ALL patients
Plasma levels of MTX and 7-OHMTX previously determined in 49 childhood ALL patients by HPLC [12] . The conditions for sample collections and procedures and HPLC assay applied are according to previously published information [13] . In short, plasma samples were obtained after intravenous infusion of MTX (5-8 g/m2) during 24 hours. Blood samples were collected 20-23 h after beginning of MTX infusion (steady-state concentration), at 36 h and once every 6 hours afterward until plasma-MTX concentration fell below <0.2 M. Samples were generally drawn from a central venous catheter, while the steady-state samples were obtained from a peripheral vein.
2.3 Antifolate-resistant cells and tissue culturingMOLT-4 cells derived from a human T-cell ALL were purchased from American Type
Culture Collection (Rockville, MD, USA). The generation and functional characterization of
drug resistant derivatives have been previously reported [11]. In short, this involved
sequential exposure (12-18 steps each of 4 days) of parental MOLT-4 cells to gradually
increasing concentrations of MTX (1-300 nM) or 7-OHMTX (50-30,000 nM). This resulted
in sub-lines with greater than 50-fold increased resistance to MTX or 7-OHMTX relative to
parental cells. Cells were cultured in RPMI-1640 medium (supplemented with 10% fetal calf
serum, 100 U/ml penicillin, 100 µg/ml streptomycin, and 2 mM L-glutamine) at 37 C under

Page 6 of 30
Accep
ted
Man
uscr
ipt
6
a humidified air containing 5% CO2. For experimental studies cells were cultured in drug-
free-medium for at least 3 passages, and harvested during the logarithmic phase growth at a
density 0.8-1.5x10⁶/ml as determined by cell counting using a Coulter Multi-sizer (Coulter
Electronics, Luton, United Kingdom).
2 . 4 Is o l a t i o n a n d Q u a l i t y V e r i f i c a t i o n o f R N A
Triplicate inoculates of parental and resistant cells were thawed, washed and cultured in a
standard medium (see above) for 4 passages, following which 107 cells of each cell type were
collected by centrifugation. High quality RNA was extracted using the RNeasy Midi kit in
accordance with the manufacturer’s instructions (RNeasy Midi Handbook; Qiagen, KEBO
Lab, Spånga, Sweden). A NanoDrop ND-1000 UV-Vis Spectrophotometer (NanoDrop
Technologies Wilmington, DE) was used to determine RNA concentrations, and to verify its
quality and purity, whereby RNA with an OD ratio of 1.99-2.0 at 260/280 was found
acceptable.
2.5 Experimental Conditions and Analysis of Expression Arrays
The experimental procedures and analyses were in accordance with the instructions of the
manufacturer (Technical manual of Affymetrix GeneChip products). In short,
complementary DNA (cDNA) synthesized from 11 g of total RNA, was used for synthesis
and isolation of biotin-labelled complementary RNA (cRNA), and fragmented to a mean size
of ~ 50-100 nucleotides. Samples were subsequently analyzed in triplicate on Affymetrix
U133A GeneChips containing 22,283 sets of probes for approximately 17,000 different
species of mRNA. After hybridization for 16 h at 45 °C, washing and staining with
streptavidin-R-phycoerythrin, the arrays were scanned in an Agilent Gene Array Scanner

Page 7 of 30
Accep
ted
Man
uscr
ipt
7
(Affymetrix). The arrays were first analyzed using GeneChip Operating Software (GCOS
1.4; Affymetrix), and data files were subsequently analyzed utilizing the GeneSpring 7.2
software. Normalization was performed with the same software employing default
normalization parameters as follows: for each sample the raw data were divided by the 50th
percentile of all measurements, and for each gene the raw data were divided by the median
level of expression of the specific samples in question. Data from sets of probes designed to
detect the expression of genes that failed to fulfil the criteria for detection (labelled "absent"
or "marginal" in all microarrays) and an intensity value less than 50 (to reduce background
signals) were eliminated. For statistical calculations, analysis of variance (ANOVA) were
used (p<0.05), and Benjamin and Hochberg false discovery rate were used for multiple
testing correction. After the filtration steps, 863 probe sets with significantly altered
expression levels between parental and/or MTX resistant and/or 7-OHMTX resistant cells
remained for further analysis (Fig. 3). All microarray data were submitted to
http://www.ncbi.nlm.nih.gov/geo/.
2.6 Quantitative Real-time PCR (qRT-PCR)
qRT-PCR was performed on cDNA samples of parental and resistant cells in three independent experiments to
quantify the expression of FPGS, FPGH/GGH, RFC/SLC19A1, GART, AICART, MTR, MTHFR, MRP4, and
MRP5. GAPDH was analysed as a positive control as well as used for normalization.
qRT-PCR reactions were carried out in 20 µl mixtures containing 9 µl cDNA template, 1 µl TaqMan® Gene
Expression Assay and 10 µl TaqMan Fast Universal PCR Master Mix, No AmpErase UNG concentrated 2-fold.
Amplifications involved 2 min at 50 °C (stage 1), and 10 min at 95 °C (stage 2), followed by 40 cycles of 95 °C
for 15 s and 60 °C for 1 min (stage 3), and were carried out in 96-well optical PCR plates (N 801-0560, Perkin
Elmer) placed in an automated fluorometer (ABI PRISM 7700 Sequence Detection System, Applied

Page 8 of 30
Accep
ted
Man
uscr
ipt
8
Biosystems). The different mRNA species were normalized against GAPDH determined in the same samples.
The values obtained for resistant cells were subsequently divided with the values for parental cells to allow
comparisons. Further details are available in Perkin-Elmer Instruction Manual of 1997.
2.7 Array-based Comparative Genomic Hybridization (array-CGH)
Genomic DNA was extracted from cultured cells using a commercial kit (Gen Elute, Sigma)
and used for analyses of gene copy number alterations by array-CGH. The experimental
procedures and data analyses were according to previously published information [14] . The
tiling 33k or 38k BAC arrays used were produced at the SCIBLU Genomics Centre at Lund
University, Sweden (www.lu.se/sciblu). Microarray slides were hybridized for 72 h at 37 oC
with differentially labeled test and reference DNA (Cy5-dCTP and Cy3-dCTP) in the
presence of Cot-1 DNA, washed under stringent conditions, and nitrogen blow-dried.
Arrays were subsequently scanned using a GenePix 4200A (Axon instruments Inc., Union
City, CA), and images were quantified with GenePix Pro 6.0 (Axon instruments,
Wheatherford TX, USA) and uploaded in BioArray Software Environment, BASE
(http://www.base.thep.lu.se/) [15] . The pin-based LOWESS algorithm [16] was used for
data normalization. Relative copy numbers were determined from normalized log2 ratios, and
altered regions were defined by CGH plotter [17] applying the thresholds >0.25 for gain,
>1.0 for amplification, <-0.25 for loss and <-1.0 for homozygous loss. Mapping information
and cytogenetic localization of clones were according to the UCSC genome browser
(http:/www.genome.ucsc.edu/; July 2004 freeze).

Page 9 of 30
Accep
ted
Man
uscr
ipt
9
3. Results
As shown in Figure 2, as high as 30-40 M concentrations of 7-OHMTX, the primary
catabolite of MTX, are readily attainable in the serum of childhood ALL patients treated
with high-dose MTX [12] . Furthermore, while the parental drug MTX is efficiently
cleared from the serum, relatively high levels (several M) of the catabolite 7-OHMTX
that exceed those of the parent drug by ~10-fold, persist for a long time in the serum.
Accordingly, we explored the pattern of gene expression by leukemic cells that had
acquired resistance to MTX or 7-OHMTX. Wild type MOLT-4 cells and their sublines
selected for resistance to MTX or 7-OHMTX were characterized regarding gene
expression profiles (Fig. 3; Table 1) and DNA copy number alterations (Table 2). Gene
expression levels were compared to gene copy numbers (Table 3) and verified for
selected genes by qRT-PCR (Table 4).
3.1 Expression Profiles of 7-OHMTX and MTX-Resistant cells
Nine separate hybridizations were performed on the Human Genome U133A GeneChip
representing triplicate inoculates of parental, 7-OHMTX- as well as MTX-resistant MOLT-4
cells. In total, 863 probe sets showed 2-fold or more difference in expression levels between
the three lines analysed (Fig. 3). Analysis of the gene expression patterns revealed 176 genes
in MTX-resistant cells and 365 genes in 7-OHMTX-resistant cells, the expression of which
was more than 2-fold different from that in parental cells (p<0.05) (Fig. 3). Forty-eight of
these genes were common to both drug-resistant cell lines. Functional classification revealed
frequent dysregulation of genes encoding signalling proteins in both resistant derivatives
studied (Table 1). In the MTX-resistant subline, the expression of genes encoding proteins

Page 10 of 30
Accep
ted
Man
uscr
ipt
10
involved in DNA/RNA metabolism and membrane transport proteins were altered more
profoundly, whereas in the 7-OHMTX-resistant cells, the most pronounced alterations were
in transcripts coding for proteins involved in metabolism and cell proliferation (Table 1).
The expression levels of certain genes with functions related to folate metabolism, purine
biosynthetic pathway and transport of related substances are detailed in Table 3. Both
resistant cell lines exhibited 4-5-fold up-regulation of MTHFR. In addition, pronounced up-
regulation of more than 2-fold of MTR was detected in MTX-resistant cells, while 7-
OHMTX cells overexpressed FPGH, SLC19A2, PFAS, and GCHFR. Prominent under-
expression involved APRT in MTX-resistant cells, whereas in 7-OHMTX-resistant cells,
ADA and CBS were expressed at very low or undetectable levels.
3.2 DNA Copy Number Alterations by Array-CGH
To characterize alterations in gene copy numbers in parental and antifolate-resistant cells,
each of these cell lines were first compared to normal reference DNA using array-CGH.
Homozygous deletions common to all three cells were recorded at several chromosomal
locations including 7q34, 9p21.2-p21.3, 11p14.3-15.1 and 14q11.2, while gene
amplifications were not found. The target interval in 14q11.2, spans the loci for TRAV20
(gene segment for T-cell receptor alpha variable 20) and TRA genes. The region 9p21.3
encompasses the CDKN2A gene locus encoding p16 and p14. In addition, regular gains
or losses involved almost all chromosomes and were in most situations present in
parental as well as drug-resistant cells (Table 2). Alterations present in drug-resistant
cells are of interest since they may be related to the mechanism by which drug resistance
has emerged. MTX-resistant cells were distinguished from parental cells by chromosomal
Page 11 of 30
Accep
ted
Man
uscr
ipt
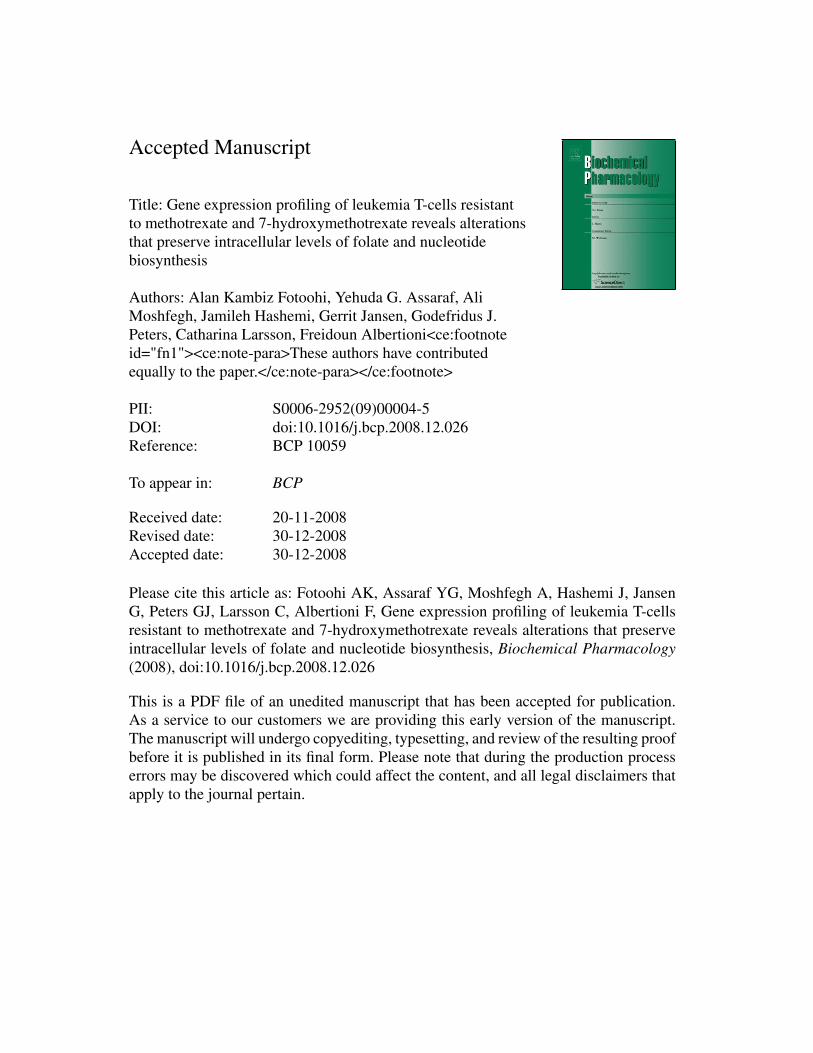
11
gains within 5p, 6p, 7p, 7q, 8p, 12q, 17p, 17q, 18q and 22q as well as by loss in 10p.
Cells resistant to 7-OHMTX differed from parental cells by gains involving 5p, 12q, 17p
and loss of 1p, 10p, and 13q. To further delineate acquired alterations, profiles were
compared visually between parental and drug-resistant cells as a complementary
approach to the scoring of copy number alterations by CGH plotter plugin. This revealed
that several of the distinguishing alterations in resistant cells were present as close to
borderline alterations at the threshold in parental cells. In addition, array-CGH
experiments were carried out whereby resistant cells were hybridized against parental
cells. This approach identified gene copy number alterations outside the +/-0.25 threshold
relative to parental cells including increase in 8pter-q24.3 in MTX-resistant cells, as well
as increases in1q21.1-qter and 12q23.2-qter and decreases in 10p11.22-p11.23 and
13q22.1-qter in 7-OHMTX cells.
3.3 Corroboration of Array Expression Levels by qRT-PCR
Analysis of the gene expression patterns of parental and resistant cells employing the
Affymetrix HG-U133A microarray revealed consistent differences with respect to 9 genes,
some of which encode proteins involved in folate metabolism or purine biosynthesis. These
differences were confirmed by qRT-PCR (Table 4). The levels were normalized against the
endogenous housekeeping gene GAPDH, which showed comparable expression levels in
parental and antifolate-resistant cells. These analyses revealed similar levels of expression
determined by microarray as well as by qRT-PCR for all nine genes analysed. The results
also confirmed the extensive up-regulation of MTR and MTHFR along with down-regulation

Page 12 of 30
Accep
ted
Man
uscr
ipt
12
of RFC in MTX-resistant cells, as well as up-regulation of FPGH/GGH and MTHFR in 7-
OHMTX-resistant cells (Table 4).

Page 13 of 30
Accep
ted
Man
uscr
ipt
13
Discussion
Concentrations of 7-OHMTX, the primary catabolite of MTX, as high as 30-40 M, are
readily attainable in the plasma of childhood ALL patients treated with high-dose MTX (Fig.
2) [12] . Furthermore, although MTX itself is efficiently cleared from the plasma, relatively
high levels of 7-OHMTX (i.e. several M), that exceed those of the parent compound MTX
by approximately 10-fold, persist in the plasma for a long time. Accordingly, we herein
explored the pattern of gene expression and gene dose alterations in human leukemia cells
with acquired resistance to MTX or 7-OHMTX [11] . Copy number alterations were detected
in parental cells as well as in both antifolate-resistant cell lines (Table 2). The genomic
regions of acquired gains and losses do not include the genes whose products are known to
be significant in response to MTX (Table 3). These findings suggest that drug-induced
changes in gene expression do not stem from copy number alterations, but may instead be
due to transcriptional regulatory alterations. Furthermore, gene amplifications were not
detected, thereby demonstrating that increases in copy numbers of drug- resistance mediating
genes were neither induced by treatment with MTX nor with exposure to 7-OHMTX.
Expression of the RFC/SLC19A1 gene was down-regulated more than 2-fold in the MTX-
resistant cells, thereby confirming the role of this influx transporter as an important
determinant of antifolate resistance [18-21] . However, the major finding of the present
investigation is that the dramatic loss of FPGS activity in the 7-OHMTX cells, presumably
associated with decreased intracellular levels of folate, was accompanied by consistent
alterations in the expression of genes capable of preserving intracellular pools of reduced
folate and/or increase purine nucleotide biosynthesis. Thus, among the major differences
observed between these cell lines were the following (Fig. 4): (a) Expression of ADA

Page 14 of 30
Accep
ted
Man
uscr
ipt
14
encoding the major enzyme of purine catabolism was down-regulated 10-fold in 7-OHMTX
cells but unchanged in MTX cells. (b) Consistently, the cystathionine β synthase (CBS) gene
was not expressed at all in 7-OHMTX cells, while being expressed 2-fold lower than the
normal levels present in MTX-resistant cells. (c) Expression of genes encoding for MTHFR
and GART, enzymes involved in methyl-tetrahydrofolate and purine biosyntheses,
respectively, were elevated 5- and 2-fold in 7-OHMTX-resistant cells and 4- and 1.5-fold in
MTX-resistant cells. (d) Furthermore, the levels of mRNAs encoding for the ATP-driven
folate efflux transporters MRP1/ABCC1 and BCRP/ABCG2 were decreased in gene
expression by 30% and approximately 3-fold, respectively, in 7-OHMTX-resistant cells,
whereas in MTX-resistant cells these levels were actually elevated 1.5- and 1.7-fold,
respectively. These results are in accord with our recent findings that folate deprivation leads
to a dramatic loss of BCRP/ABCG2 expression as well as retention of this folate influx
transporter in the cytoplasm rather than sorting it to the plasma membrane [22, 23].
Furthermore, these findings are consistent with those reported recently by Evans and
colleagues [24] who documented differential patterns of gene expression in various subtypes
of bone marrow cells from newly diagnosed patients with B- or T-ALL. These investigators
found that 42-44 hr after MTX administration (0.8 g/m2), T-ALL bone marrow cells formed
long-chain (Glu4-7) MTX polyglutamates at a rate of only 355 pmol/109 cells, while the
corresponding rate for hyperdiploid B-cell leukemia was as high as 3,170 pmol/109 cells.
This difference was consistently associated with very low levels of FPGS mRNA in the T-
ALL cells, as much as two orders of magnitude lower than the level present in B-lineage
hyperdiploid cells, together with low level expression of the BCRP/ABCG2 gene in T-ALL
cells. In contrast, the levels of expression of the AICART and GARFT genes, encoding key

Page 15 of 30
Accep
ted
Man
uscr
ipt
15
enzymes involved in de novo purine biosynthesis were higher in the case of T-ALL than any
other leukemia subtypes.
In agreement with the pronounced reduction observed in MTX uptake into MTX-resistant
cells, diminished RFC mRNA expression was observed by microarray (2-fold) and qRT-PCT
(5-fold) in MTX-resistant leukaemia cells as compared to their parental counterpart (Table
4). However, the expression of RFC was not altered in 7-OHMTX-resistant cells. Moreover,
the level of FPGH mRNA was elevated more than 2-fold in 7-OHMTX-resistant cells. In
contrast, no difference in FPGS expression was detected in either of the resistant cell lines
suggesting that other mechanisms, e. g., post-transcriptional modifications, may be
responsible for the low activity of this enzyme in these cells. In a recent study it has shown
(M. Stark, C. Wichman, I. Avivi and Y.G. Assaraf; "Aberrant splicing of
folylypolyglutamate synthetase as a novel mechanism of antifolate resistance in leukemia",
Blood 2009, in press) that FPGS transcripts in antifolate-resistant ALL cell lines were highly
aberrant as they underwent impaired splicing including exon skipping as well as intron
retention. Hence, these novel alterations result in premature translation termination of FPGS,
thereby leading to lack of FPGS activity and resistance to polyglutamatble antifolates. This
mechanism was also corroborated in specimens from patients harbouring ALL, both at
diagnosis and relapse. These findings provide a novel mechanistic basis for the loss of FPGS
function in the absence of quantitative changes (i.e. decrease) in FPGS levels.
Members of the family of multidrug resistance proteins, notably MRP1-5/ABCC1-
5, and BCRP/ABCG2 are known to export the folate antagonist MTX out of cells
[25-29]. Levels of BCRP and MRP1-5 mRNAs were all slightly elevated (about
50%) in the MTX-resistant subline, but unchanged in 7-OHMTX cells (Table 3).

Page 16 of 30
Accep
ted
Man
uscr
ipt
16
Cells resistant to 7-OHMTX displayed a dramatic up-regulation of VAMP8 (>700-
fold) ; VAMP8 is a vesicle-associated membrane protein involved in exocytosis,
and it is hence tempting to speculate here that elimination of vesicle-sequestered 7-
OHMTX could be facilitated by VAMP8 overexpression. This finding warrants
further studies to explore this interesting possibility.
Among the genes that encode proteins involved in the folate pathway, the expression of
MTHFR was most profoundly altered in both of our antifolate-resistant cell lines (>4-fold up-
regulation) (Fig. 4). MTHFR plays a key role in folate metabolism by channelling single-
carbon units between nucleotide biosynthesis and methylation reactions. This enzyme
converts 5,10-methylene-THF into 5-methyl-THF, the predominant circulating folate form
that provides a methyl group for methylation of homocysteine to methionine. Moreover, 5,10
methylene-THF is required for TS activity and thymidylate biosythesis and its depletion
could lead to dUTP misincorporation into DNA and a consequent increase in the frequency
of chromosome damage, thereby facilitating the genotoxic effects of MTX. It has been
reported that a deactivating MTHFR allele (the MTHFR C677T variant allele) can enhance
the risk for ALL relapse potentially by increasing cellular levels of 5,10 Methylene-THF and
deoxythymidine monophosphate (dTMP), thereby enhancing DNA synthesis and
counteracting MTX cytotoxicity. Thus, the significant increment in the expression of
MTHFR mRNA in both of our antifolate-resistant cell lines may be related to cellular
tolerance to MTX and 7-OHMTX. Although diminished transport and lack of
polyglutamylation can readily explain the mechanisms underlying the significant increase in
resistance to MTX and 7-OHMTX, respectively, some alterations in gene expression of
resistant cells may have contributed to their tolerance.

Page 17 of 30
Accep
ted
Man
uscr
ipt
17
In summary, the present characterization of the different patterns of gene expression profiles
of MTX- and 7-OHMTX-resistant sublines of parental MOLT-4 leukemia cells selected by
exposure to MTX and 7-OHMTX, provides a new perspective on differences in the
pharmacodynamic consequences of HDMTX therapy. 7-OHMTX , the major metabolite of
MTX exerts its cytotoxic effect by mechanisms that are distinct from those underlying the
effects of the parent drug. Our current findings may facilitate the identification of the specific
targets for MTX therapy and may provide additional insight into cellular responses to 7-
OHMTX. The distinct patterns of gene expression profiles in cells that have acquired
resistance to MTX or 7-OHMTX may indicate that part of the gene expression profile
observed following exposure to high doses of MTX reported earlier [30] is related to
exposure to 7-OHMTX, rather than to MTX itself. The differential expression of a relatively
large number of genes by 7-OHMTX- and MTX-resistant cells indicates the occurrence of
separate and independent effects. Thus, in relation with HDMTX therapy, where higher
concentrations of 7-OHMTX can be detected in the plasma, the pattern of gene expression
will be different from that when low concentrations of 7-OHMTX are present.

Page 18 of 30
Accep
ted
Man
uscr
ipt
18
References
[1] Assaraf YG. Molecular basis of antifolate resistance. Cancer Metastasis Rev 2007;26:153-81.
[2] Fotoohi AK, Albertioni F. Mechanisms of antifolate resistance and methotrexate efficacy in leukemia cells. Leuk Lymphoma 2008;49:410-26.
[3] Gorlick R, Goker E, Trippett T, Waltham M, Banerjee D, Bertino JR. Intrinsic and acquired resistance to methotrexate in acute leukemia. N Engl J Med 1996;335:1041-8.
[4] Shafran A, Ifergan I, Bram E, Jansen G, Kathmann I, Peters GJ, et al. ABCG2 harboring the Gly482 mutation confers high-level resistance to various hydrophilic antifolates. Cancer Res 2005;65:8414-22.
[5] Volk EL, Schneider E. Wild-type breast cancer resistance protein (BCRP/ABCG2) is a methotrexate polyglutamate transporter. Cancer Res 2003;63:5538-43.
[6] Gifford AJ, Kavallaris M, Madafiglio J, Matherly LH, Stewart BW, Haber M, et al. P-glycoprotein-mediated methotrexate resistance in CCRF-CEM sublines deficient in methotrexate accumulation due to a point mutation in the reduced folate carrier gene. Int J Cancer 1998;78:176-81.
[7] Newton PA, Blakley RL. 7-Hydroxymethotrexate formation in a human lymphoblastic cell line. Biochem Biophys Res Commun 1984;122:1212-7.
[8] Farquhar D, Loo TL. Synthesis and biologic evaluation of 7-hydroxymethotrexate, 7-methylaminopterin, and 7-methylmethotrexate. J Med Chem 1972;15:567-9.
[9] Drake JC, Allegra CJ, Baram J, Kaufman BT, Chabner BA. Effects on dihydrofolate reductase of methotrexate metabolites and intracellular folates formed following methotrexate exposure of human breast cancer cells. Biochem Pharmacol 1987;36:2416-8.
[10] Sholar PW, Baram J, Seither R, Allegra CJ. Inhibition of folate-dependent enzymes by 7-OH-methotrexate. Biochem Pharmacol 1988;37:3531-4.
[11] Fotoohi K, Jansen G, Assaraf YG, Rothem L, Stark M, Kathmann I, et al. Disparate mechanisms of antifolate resistance provoked by methotrexate and its metabolite 7-hydroxymethotrexate in leukemia cells: implications for efficacy of methotrexate therapy. Blood 2004;104:4194-201.
[12] Rask C, Albertioni F, Bentzen SM, Schroeder H, Peterson C. Clinical and pharmacokinetic risk factors for high-dose methotrexate-induced toxicity in children with acute lymphoblastic leukemia--a logistic regression analysis. Acta Oncol 1998;37:277-84.
[13] Albertioni F, Pettersson B, Beck O, Rask C, Seideman P, Peterson C. Simultaneous quantitation of methotrexate and its two main metabolites in biological fluids by a novel solid-phase extraction procedure using high-performance liquid chromatography. J Chromatogr B Biomed Appl 1995;665:163-70.

Page 19 of 30
Accep
ted
Man
uscr
ipt
19
[14] Jonsson G, Staaf J, Olsson E, Heidenblad M, Vallon-Christersson J, Osoegawa K, et al. High-resolution genomic profiles of breast cancer cell lines assessed by tiling BAC array comparative genomic hybridization. Genes Chromosomes Cancer 2007;46:543-58.
[15] Saal LH, Troein C, Vallon-Christersson J, Gruvberger S, Borg A, Peterson C. BioArray Software Environment (BASE): a platform for comprehensive management and analysis of microarray data. Genome Biol 2002;3:SOFTWARE0003.
[16] Yang MC, Ruan QG, Yang JJ, Eckenrode S, Wu S, McIndoe RA, et al. A statistical method for flagging weak spots improves normalization and ratio estimates in microarrays. Physiol Genomics 2001;7:45-53.
[17] Autio R, Hautaniemi S, Kauraniemi P, Yli-Harja O, Astola J, Wolf M, et al. CGH-Plotter: MATLAB toolbox for CGH-data analysis. Bioinformatics 2003;19:1714-5.
[18] Jansen G, Mauritz R, Drori S, Sprecher H, Kathmann I, Bunni M, et al. A structurally altered human reduced folate carrier with increased folic acid transport mediates a novel mechanism of antifolate resistance. J Biol Chem 1998;273:30189-98.
[19] Rothem L, Aronheim A, Assaraf YG. Alterations in the expression of transcription factors and the reduced folate carrier as a novel mechanism of antifolate resistance in human leukemia cells. J Biol Chem 2003;278:8935-41.
[20] Rothem L, Ifergan I, Kaufman Y, Priest DG, Jansen G, Assaraf YG. Resistance to multiple novel antifolates is mediated via defective drug transport resulting from clustered mutations in the reduced folate carrier gene in human leukaemia cell lines. Biochem J 2002;367:741-50.
[21] Rothem L, Stark M, Kaufman Y, Mayo L, Assaraf YG. Reduced folate carrier gene silencing in multiple antifolate-resistant tumor cell lines is due to a simultaneous loss of function of multiple transcription factors but not promoter methylation. J Biol Chem 2004;279:374-84.
[22] Ifergan I, Jansen G, Assaraf YG. Cytoplasmic confinement of breast cancer resistance protein (BCRP/ABCG2) as a novel mechanism of adaptation to short-term folate deprivation. Mol Pharmacol 2005;67:1349-59.
[23] Ifergan I, Shafran A, Jansen G, Hooijberg JH, Scheffer GL, Assaraf YG. Folate deprivation results in the loss of breast cancer resistance protein (BCRP/ABCG2) expression. A role for BCRP in cellular folate homeostasis. J Biol Chem 2004;279:25527-34.
[24] Kager L, Cheok M, Yang W, Zaza G, Cheng Q, Panetta JC, et al. Folate pathway gene expression differs in subtypes of acute lymphoblastic leukemia and influences methotrexate pharmacodynamics. J Clin Invest 2005;115:110-7.
[25] Assaraf YG. The role of multidrug resistance efflux transporters in antifolate resistance and folate homeostasis. Drug Resist Updat 2006;9:227-46.
[26] Chen ZS, Lee K, Walther S, Raftogianis RB, Kuwano M, Zeng H, et al. Analysis of methotrexate and folate transport by multidrug resistance protein 4 (ABCC4): MRP4 is a component of the methotrexate efflux system. Cancer Res 2002;62:3144-50.
[27] Hooijberg JH, Broxterman HJ, Kool M, Assaraf YG, Peters GJ, Noordhuis P, et

Page 20 of 30
Accep
ted
Man
uscr
ipt
20
al. Antifolate resistance mediated by the multidrug resistance proteins MRP1 and MRP2. Cancer Res 1999;59:2532-5.
[28] Wielinga P, Hooijberg JH, Gunnarsdottir S, Kathmann I, Reid G, Zelcer N, et al. The human multidrug resistance protein MRP5 transports folates and can mediate cellular resistance against antifolates. Cancer Res 2005;65:4425-30.
[29] Zeng H, Bain LJ, Belinsky MG, Kruh GD. Expression of multidrug resistanceprotein-3 (multispecific organic anion transporter-D) in human embryonic kidney 293 cells confers resistance to anticancer agents. Cancer Res 1999;59:5964-7.
[30] Cheok MH, Yang W, Pui CH, Downing JR, Cheng C, Naeve CW, et al. Treatment-specific changes in gene expression discriminate in vivo drug response in human leukemia cells. Nat Genet 2003;34:85-90.
Figure Legends
Figure 1. The chemical structures of methotrexate (MTX) and its major catabolite 7-
hydroxymethotrexate (7-OHMTX).
Figure 2. Comparison of plasma levels for MTX and 7-OHMTX measured by HPLC in
childhood ALL patients 24-90 hr after administration of high dose MTX as part of their
treatment [12] . The lines for MTX and 7-OHMTX (bold) represent the median values for
all 49 cases studied, and dotted and dashed lines indicate the +2SD of plasma levels of
MTX and 7-OHMTX, respectively.
Figure 3. A, Gene expression patterns and B, hierarchical clustering of parental cells
(MOLT4/WT) and derivatives resistant to the MTX (MOLT4/MTX) or 7-OHMTX
(MOLT4/7-OHMTX). Analyses based on three independent experiments were performed in
GeneSpring 7.2, and the genes presented (n = 863) showed a more than 2-fold difference in
expression level. P<0.05.

Page 21 of 30
Accep
ted
Man
uscr
ipt
21
Figure 4. Schematic illustration of dysregulated genes mediating the effects of MTX, as
well as their relation to folate pathway and to purine, pyrimidine and methionine
biosynthesis (modified from Fotoohi and Albertioni 2008) [2] .
Abbreviations are as follows: dihydrofolate reductase (DHFR); dihydrofolate (DHF);
tetrahydrofolate (THF); S-adenosylmethionine (SAM); thymidylate synthetase (TS);
deoxyuridine monophosphate (dUMP); deoxythymidine monophosphate (dTMP); S-
adenosylhomocysteine (SAH); methylenetetrahydrofolate dehydrogenase 1 (MTHFD 1);
5,10-methylenetetrahydrofolate reductase (MTHFR); phosphoribosylglycinamide
formyltransferase (GARFT); 5,10-methenyltetrahydrofolate synthetase (MTHFS), 5-
methyltetrahydrofolate-homocysteine methyltransferase (MTR); 5-
methyltetrahydrofolate-homocysteine methyltransferase reductase (MTRR); 5-
aminoimidazole-4-carboxamide ribonucleotide formyltransferase (ATIC or AICART);
serine hydroxymethyltransferase 1 (SHMT 1); phosphoribosyl pyrophosphate
amidotransferase (PPAT); cystathionine β-synthase (CBS); 10- formyltetrahydrofolate
(10-CHO-THF); 5,10 methylen tetrahydrofolate (5,10=CH-THF); 5-
formyltetrahydrofolate (5-CHO-THF); 5 methyl tetrahydrofolate (5-CH3-THF).

Page 22 of 30
Accep
ted
Man
uscr
ipt
Figure1

Page 23 of 30
Accep
ted
Man
uscr
ipt
Figure2

Page 24 of 30
Accep
ted
Man
uscr
ipt
Figure3

Page 25 of 30
Accep
ted
Man
uscr
ipt
Figure4

Page 26 of 30
Accep
ted
Man
uscr
ipt
Table 1. Genes up- or down-regulated more than 2-fold in resistant versus parental cells. Up-regulated genes Down-regulated genes
Functional category MTX 7-OHMTX MTX 7-OHMTXRNA / DNA metabolism 10% (4) 3% (4) 16% (22) 10% (23)Cell cycle 0% (0) 1% (1) 3% (4) 1% (2)Development 5% (2) 4% (5) 4% (6) 10% (23)Apoptosis 5% (2) 2% (3) 1% (1) 4% (9)Transporter 10% (4) 4% (5) 4% (6) 5% (11)Signaling 30% (12) 36% (49) 26% (35) 33% (75)Stress response 5% (2) 4% (5) 0% (0) 1% (2)Metabolism 10% (4) 22% (31) 17% (24) 14% (32)Growth 15% (6) 11% (15) 20% (27) 15% (34)Organization & Proliferation 0% (0) 4% (5) 9% (13) 7% (16)Other 10% (4) 9% (13) 0% (0) 0% (0)Total 100% (n = 40) 100 (n = 136) 100 (n = 138) 100 (n = 227)
Table1

Page 27 of 30
Accep
ted
Man
uscr
ipt
Table 2. Summary of copy number aberrations by array-CGH in parental and resistant cells.
Chr. Parental MTX resistant 7-OHMTX resistant
Copy number losses and homozygous deletions
1 1q23.1-qter 1q23.3-qter 1p36.31-p36.32
2 2p24.1-p24.2 2p24.1-p24.2 2p24.1-p24.2
4 4q31.23-qter 4q31.23-qter 4q31.23-qter
5 5q13.2; q35.1-qter 5q35.1-qter 5q13.2; q35.1-qter
7 7p21.3 hz ; q34 hz 7q34 hz 7p21.3hz ; q34hz
9 9p21.1-pter/p21.2-p21.3 hz /p23 hz 9p21.1-pter/p21.2-p21.3hz/p23hz 9p21.1-pter/p21.2-p21.3 hz
10 - 10p12.1-pter 10p12.32-pter
11 11p14.3-p15.1hz ; q25-qter 11p14.3-p15.1hz ; q25-qter 11p14.3-p15.1hz ; q25-qter
13 - - 13q22.1-q34
14 14q11.1-11.2; q11.2hz 14q11.2 hz 14q11.2 hz
19 19q13.2 19q13.2 19q13.2
22 22q12.3 - -
Copy number gains and amplifications
1 1p32.3; 1p34.1-p36.31 1p32.2-36.31; 1p36.32-pter 1p32.3-p36.31
3 3p21.1-p21.31 - -
4 4p16.3-pter - 4p16.3-pter
5 - 5p15.33-pter 5p15.33-pter
6 - 6p21.1-p22.1 -
7 - 7p22.1-pter; q11.22-q11.23 -
8 8qter 8p23.3-pter; p22-p21.3; qter 8qter
9 9qter 9qter 9qter
10 10p11.22-p12.1; qter 10p11.22-p12.1; qter 10qter
12 - 12q13.11-q14.1 12q21.33-qter
14 14q32.2-q32.33 14q32.2-q32.33 14q32.2-q32.33
16 16p13.3-pter; q23.3-qter 16p13.3-pter; q23.3-qter 16p13.3-pter; q24.2-qter
17 17q25.1-qter 17p13.1-pter; q12-q21.33; q25.1-qter 17p13.1-pter
18 - 18qter -
19 19p12-pter; q13.31-q13.33 19p13.11-pter; q13.2; q13.31-qter -
20 20pter-qter 20pter-qter 20pter-qter
21 21q22.3-qter 21q22.3-qter -
22 22q13.1-q13.2; qter 22q11.1-q11.23; q12.3-qter 22qter
Homozygous losses hz are indicated in italic and bold; Chr. = Chromosome
Table2

Page 28 of 30
Accep
ted
Man
uscr
ipt
Table 3. Expression levels of selected genes and copy number of cytoband involved. Gene Expression-array Cytoband Array-CGH symbol MTX 7-OHMTX concerned Parental MTX 7-OHMTXFPGS folylpolyglutamate synthetase 1.0 1.0 9q34.11 gain gain gainFPGH / GGH folylpolygammaglutamyl hydrolase, gamma-glutamyl hydrolase 1.2 3.0 8q12.3 n.a n.a n.aMTR 5-methyltetrahydrofolate-homocysteine methyltransferase, 2.8 1.3 1q43 loss loss n.aAICART 5-aminoimidazole-4-carboxamide ribonucleotide formyltransferase 1.0 1.0 2q35 n.a n-a na.RFC / SLC19A1 solute carrier family 19 (folate transporter) member 1 0.4 0.9 21q22.3 gain n.a n.aGART phosphoribosylglycinamide formyltransferase 1.6 1.8 21q22.11 n.a n.a n.aMTHFR 5,10-methylenetetrahydrofolate reductase (NADPH) 4.3 4.8 1p36.22 gain gain gainMRP4 ATP-binding cassette, sub-family C (CFTR/MRP) member 4 1.4 0.9 13q32.1 n.a n.a lossMRP5 ATP-binding cassette, sub-family C (CFTR/MRP) member 5 1.6 1.2 3q27.1 n.a n.a n.aMTHFD1 methylenetetrahydrofolate dehydrogenase 1 1.4 1.5 14q23.2 n.a n.a n.aMTHFD2 methylenetetrahydrofolate dehydrogenase 2 1.2 1.8 2p13.1 n.a n.a n.aDHFR dihydrofolate reductase 1.4 1.0 18q11.2 n.a n.a n.aTS / TYMS thymidylate synthetase 0.6 0.7 18p11.32 n.a n.a n.aMTRR 5-methyltetrahydrofolate-homocysteine methyltransferase reductase 1.1 0.9 5p15.31 n.a n.a n.aMTHFS 5,10-methenyltetrahydrofolate synthetase 1.0 0.9 15q25.1 n.a n.a n.aGCH1 GTP cyclohydrolase 1 (dopa-responsive dystonia) 1.4 0.9 14q22.2 n.a n.a n.aSLC19A2 solute carrier family 19 (thiamine transporter) member 2 1.4 2.1 1q24.2 loss loss n.aSHMT1 serine hydroxymethyltransferase 1 1.1 2.0 17p11.2 n.a n.a n.aBCRP / ABCG2 ATP-binding cassette, sub-family G (WHITE) member 2 1.7 0.4 4q22.1 n.a n.a n.aPFAS phosphoribosylformylglycinamidine synthase (FGAR amidotransferase) 1.9 2.5 17p13.1 n.a gain n.aGCHFR GTP cyclohydrolase I feedback regulator 0.6 7.7 15q15.1 n.a n.a n.aITPA inosine triphosphatase (nucleoside triphosphate pyrophosphatase) 0.6 0.9 20p13 gain gain gaindGK/ DGUOK deoxyguanosine kinase, dGK/ DGUOK 1.0 1.8 2p13.1 n.a n.a n.aAPRT adenine phosphoribosyltransferase 0.4 0.6 16q24.3 gain gain gainADA adenosine deaminase 0.9 0.1 20q13.2 gain gain gainPPAT phosphoribosyl pyrophosphate amidotransferase 1.1 1.3 4q12 n.a n.a n.aMRP1/ABCC1 ATP-binding cassette, sub-family C (CFTR/MRP) member 1 1.5 0.7 16p13.11 n.a n.a n.aMRP2/ABCC2 ATP-binding cassette, sub-family C (CFTR/MRP) member 2 0.8 0.8 10q24.2 n.a n.a n.aMRP3/ABCC3 ATP-binding cassette, sub-family C (CFTR/MRP) member 3 1.0 1.0 17q21.33 n.a gain n.aP-glycoprotein ATP-binding cassette, sub-family B (MDR/TAP) member 1 1.2 0.9 7q21.12 n.a n.a n.aCBS cystathionine β-synthase 0.5 0.0 21q22.3 gain gain n.aExpression levels are in relation to parental cells (MTX / parental or 7-OHMTX / parental) giving an arbitrary value of 1.0 for parental cellsDNA copy number are in relation to normal reference DNA; n.a = no aberration detectedExpression changes greater than 2-fold and copy number aberrations above thresholds are indicted in bold
Table3

Page 29 of 30
Accep
ted
Man
uscr
ipt
Table 4. Expression of selected genes by array and qRT-PCR in resistant as compared to parental cells. by Affymetrix array by qRT-PCR
Parental MTX 7-OHMTX Parental MTX 7-OHMTXFPGS (1.0) 1.0 1.0 (1.0) 0.83 ± 0.02 1.0 ± 0.20FPGH/GGH (1.0) 1.2 3.0 (1.0) 0.76 ± 0.05 2.0 ± 0.38MTR (1.0) 2.8 1.3 (1.0) 1.60 ± 0.24 1.1 ± 0.10ATIC (1.0) 1.0 1.0 (1.0) 0.87 ± 0.03 1.0 ± 0.05RFC / SLC19A1 (1.0) 0.4 0.9 (1.0) 0.20 ± 0.03 2.2 ± 0.37GART (1.0) 1.6 1.8 (1.0) 1.76 ± 0.25 1.6 ± 0.16MTHFR (1.0) 4.3 4.8 (1.0) 2.80 ± 0.40 2.3 ± 0.20MRP4 (1.0) 1.4 0.9 (1.0) 1.30 ± 0.18 1.2 ± 0.08MRP5 (1.0) 1.6 1.2 (1.0) 1.40 ± 0.11 1.9 ± 0.16Expression values are in relation to parental cells (MTX / parental or 7-OHMTX / parental),giving an arbitrary value of 1.0 in parental cells as indicated
Table4

Page 30 of 30
Accep
ted
Man
uscr
ipt
Graphical Abstract