Embed Size (px)
Citation preview

Gender Role Attitudes and the Labour Market Outcomes of WomenAcross OECD Countries
By Nicole M. FortinDepartment of EconomicsUniversity of British Columbia
April 2005
Paper prepared for the Oxford Review of Economic Policy Special Issue on Gender and the Life-Cycle
2
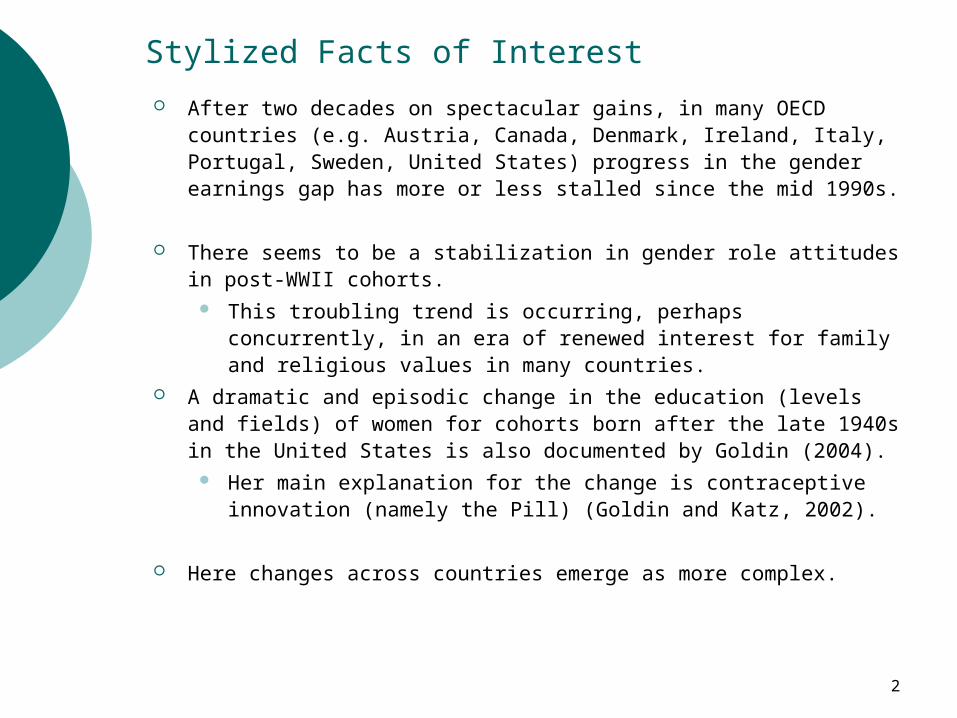
Stylized Facts of Interest
After two decades on spectacular gains, in many OECD countries (e.g. Austria, Canada, Denmark, Ireland, Italy, Portugal, Sweden, United States) progress in the gender earnings gap has more or less stalled since the mid 1990s.
There seems to be a stabilization in gender role attitudes in post-WWII cohorts.
This troubling trend is occurring, perhaps concurrently, in an era of renewed interest for family and religious values in many countries.
A dramatic and episodic change in the education (levels and fields) of women for cohorts born after the late 1940s in the United States is also documented by Goldin (2004).
Her main explanation for the change is contraceptive innovation (namely the Pill) (Goldin and Katz, 2002).
Here changes across countries emerge as more complex.

3
■ Bernstein (EPI, 2005) presents the following view of the US gender pay ratio
■ The recent closing of the pay is due exclusively to male workers, particularly in manufacturing, losing ground relative to women.
4
Objective of the paper
The main goal of the paper is to evaluate the impact of work values and gender role attitudes on women’s labour market outcomes across OECD countries, comparing individual outcomes with country-specific ones.
More specifically, I look at employment rates, incidence of part-time work and the gender pay gap.
This paper explores the possibility that the stabilization of gender role attitudes in post-WWII cohorts may be a contributing factor to the slowing of the economic progress of women.
Related Issue: Was the convergence in male and female educational and labour market outcomes from the 1970s to the 1990s an episodic change?

5
Related literature Convergence in men and women labour market outcomes: Blau and Kahn (2004): slowdown in convergence in the 1990s is
linked to unexplained (by education and experience) part of the gender gap
Goldin (2004), Goldin and Katz (2002): changes in labour market outcomes of cohorts born from late 1940s on is due to innovation in contraception (the Pill)
o Gender role attitudes and women’s labor market outcomes: Vella (1994): using Australian data find a significant positive
impact of an index of “favorable” gender role attitude on educational attainment, labour supply and wages of women.
He predicts women’s attitude on the basis of parental education and religious affiliation.

6
Related literature
Attitudes toward working women and religiosity; Thornton, Alwin and Camburn (1983): find that fundamentalist
Protestant views preserve more traditional outlooks. (also using the World Value Surveys) : Guiso, Sapienzad and Zingalese (2003): look at an array of
economic attitudes and find religiosity is associated with less favorable attitudes toward working womenAlgan and Cahuc (2004):develop a model where gender bias in social status gives rise to job protection and family policies detrimental to women’s employment. They find that the Catholic religion, in particular, is more conservative with regards to the traditional division of work in the family.
Experimental studies of gender differences in work values: Andreoni and Vesterlund, (2001): altruism and greed Gneezy, Niederle, and Rustichini, 2003): leadership and competitiveness

7
Related literature
Impact of work values (also called “soft skills”) and gender role attitudes on labour market outcomes
Day and Devlin (1998): returns to volunteering Kuhn and Weinberger (2002): returns to leadership Fortin (2004): impact of greed, leader and altruism on the gender
wage gap Borghans, ter Weel and Weinberg (2005): look that the growth
rate of the importance of interpersonal interactions in the labor market
Theoretical framework Akerlof and Kranton (2000) have proposed an identity based
model where the gender-job association works to the detriment of women engaged in male professions. Make the point that propaganda was necessary to convince women to participate in work effort in WWII.
Bisin and Verdier (2000) model the cultural transmission of ethnic and religious traits.

8
Data
The paper uses three waves of the World Value Surveys (WVS): the 1990-93 and 1995-97 waves (ICPSR 2970), and 1999-2001 wave (ICPSR 3975), which also includes answers to the European Value Survey (EVS).
The coverage of societies/countries in the Values Studies has grown from 43 in the 1990 wave to 62 in the 1995 wave and 82 in the 2000 wave.
Because of the difficulty of finding comparable measures of the gender pay gap across countries, I limit my analysis to 24-26 OECD societies/countries.
9
Countries selected They include the following countries, classified according to the
gender-sensitive typology of countries proposed by Siaroff (1994):
Protestant social democratic states: Sweden, Finland, Iceland, Norway and Denmark.
Protestant liberal states: Australia, Canada, the United Kingdom and the United States, with minimal family welfare but a relatively egalitarian labour market
Advanced Christian democratic states: Austria, Belgium, France, Italy, Germany and the Netherlands
Late female mobilization states: Greece, Ireland, Japan, Portugal, Spain, Switzerland and Turkey, although Japan and Turkey are actually singletons.
Transition from communist regimes: Czech Republic, Hungary, Poland, Slovakia.
10
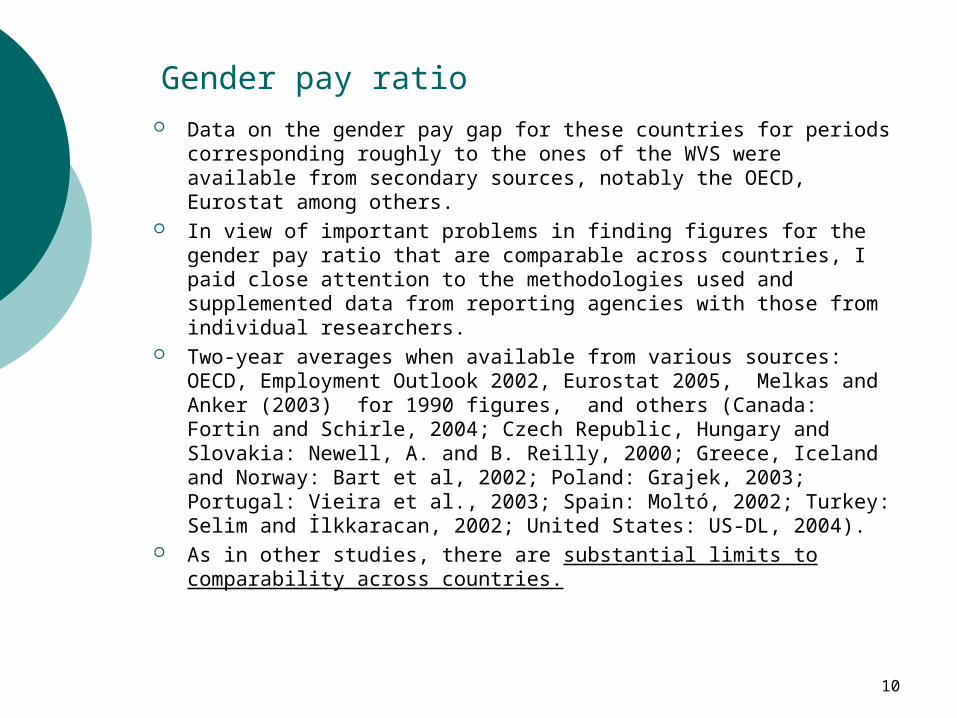
Gender pay ratio Data on the gender pay gap for these countries for periods
corresponding roughly to the ones of the WVS were available from secondary sources, notably the OECD, Eurostat among others.
In view of important problems in finding figures for the gender pay ratio that are comparable across countries, I paid close attention to the methodologies used and supplemented data from reporting agencies with those from individual researchers.
Two-year averages when available from various sources: OECD, Employment Outlook 2002, Eurostat 2005, Melkas and Anker (2003) for 1990 figures, and others (Canada: Fortin and Schirle, 2004; Czech Republic, Hungary and Slovakia: Newell, A. and B. Reilly, 2000; Greece, Iceland and Norway: Bart et al, 2002; Poland: Grajek, 2003; Portugal: Vieira et al., 2003; Spain: Moltó, 2002; Turkey: Selim and İlkkaracan, 2002; United States: US-DL, 2004).
As in other studies, there are substantial limits to comparability across countries.
11
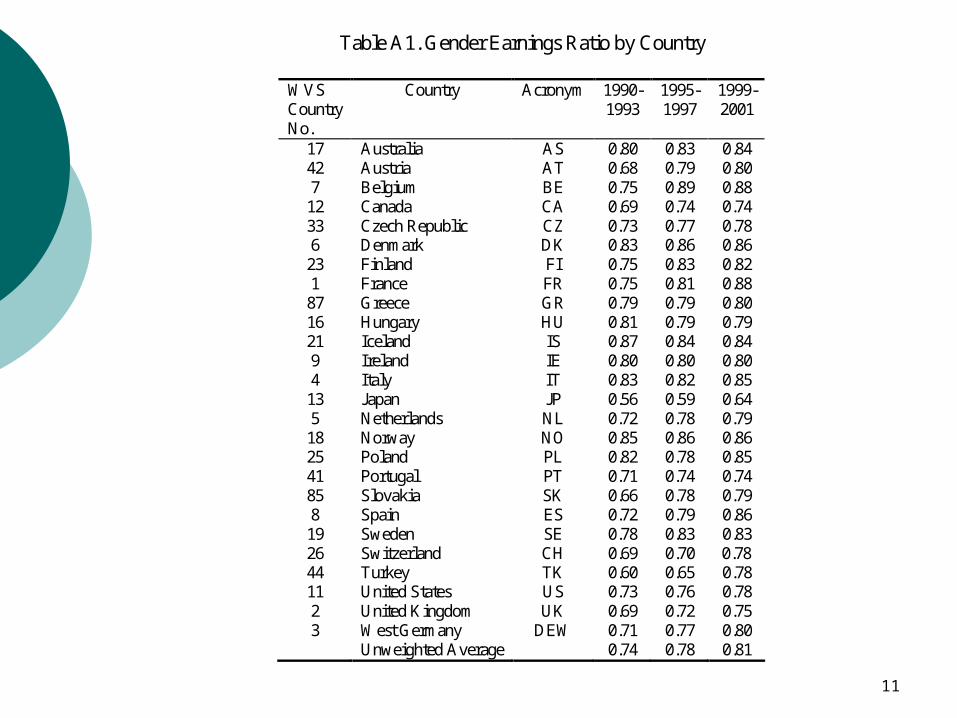
Table A1. Gender Earnings Ratio by Country
WVS Country No.
Country Acronym 1990- 1993
1995- 1997
1999- 2001
17 Australia AS 0.80 0.83 0.84 42 Austria AT 0.68 0.79 0.80 7 Belgium BE 0.75 0.89 0.88
12 Canada CA 0.69 0.74 0.74 33 Czech Republic CZ 0.73 0.77 0.78 6 Denmark DK 0.83 0.86 0.86
23 Finland FI 0.75 0.83 0.82 1 France FR 0.75 0.81 0.88
87 Greece GR 0.79 0.79 0.80 16 Hungary HU 0.81 0.79 0.79 21 Iceland IS 0.87 0.84 0.84 9 Ireland IE 0.80 0.80 0.80 4 Italy IT 0.83 0.82 0.85
13 Japan JP 0.56 0.59 0.64 5 Netherlands NL 0.72 0.78 0.79
18 Norway NO 0.85 0.86 0.86 25 Poland PL 0.82 0.78 0.85 41 Portugal PT 0.71 0.74 0.74 85 Slovakia SK 0.66 0.78 0.79 8 Spain ES 0.72 0.79 0.86
19 Sweden SE 0.78 0.83 0.83 26 Switzerland CH 0.69 0.70 0.78 44 Turkey TK 0.60 0.65 0.78 11 United States US 0.73 0.76 0.78 2 United Kingdom UK 0.69 0.72 0.75 3 West Germany DEW 0.71 0.77 0.80 Unweighted Average 0.74 0.78 0.81

12
WORLD VALUE SURVEYS:Questions on Gender Role Attitudes
Do you agree or disagree with the following statements? 1990-1997
1999-2001
Agree Neither Disagree DK
V128 V78 When jobs are scarce, men should have more right to a job than women
1 2 3 4
V129 When jobs are scarce, people should be forced to retire early
1 2 3 4
V130 V79 When jobs are scarce, employers should give priority to [BRITISH] people over immigrants
1 2 3 4
For each of the following statements I read out, can you tell me how much you agree with each. Do you agree strongly, agree, disagree, or disagree strongly? 1990-1997
1999-2001
Agree strongly
Agree Disagree Strongly disagree
DK
V113 One of my main goals in life has been to make my parents proud
1 2 3 4 9
V114 I make a lot of effort to live up to what my friends expect
1 2 3 4 9
V98 V115 A working mother can establish just as warm and secure a relationship with her children as a mother who does not work
1 2 3 4 9
V99 V116 Being a housewife is just as fulfilling as working for pay
1 2 3 4 9
V100 V117 Both the husband and wife should contribute to household income
1 2 3 4 9
V101 V118 On the whole, men make better political leaders than women do
1 2 3 4 9
V103 V119 A university education is more important for a boy than for a girl
1 2 3 4 9
13
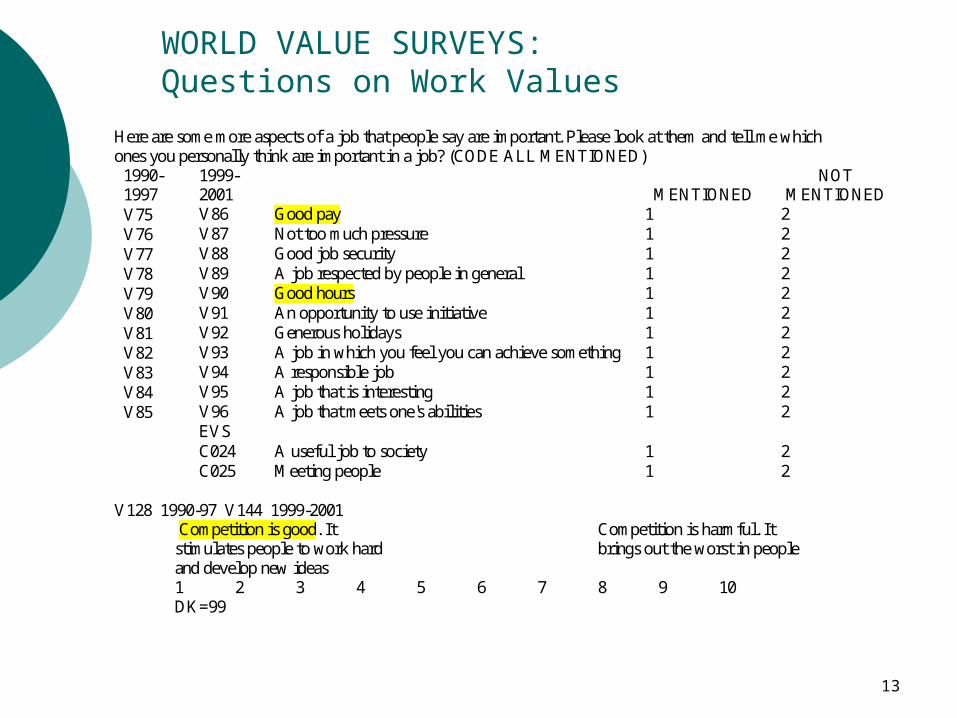
WORLD VALUE SURVEYS:Questions on Work Values
Here are some more aspects of a job that people say are important. Please look at them and tell me which ones you personally think are important in a job? (CODE ALL MENTIONED)
1990-1997
1999-2001
MENTIONED
NOT MENTIONED
V75 V86 Good pay 1 2 V76 V87 Not too much pressure 1 2 V77 V88 Good job security 1 2 V78 V89 A job respected by people in general 1 2 V79 V90 Good hours 1 2 V80 V91 An opportunity to use initiative 1 2 V81 V92 Generous holidays 1 2 V82 V93 A job in which you feel you can achieve something 1 2 V83 V94 A responsible job 1 2 V84 V95 A job that is interesting 1 2 V85 V96 A job that meets one's abilities 1 2 EVS C024 A useful job to society 1 2 C025 Meeting people 1 2
V128 1990-97 V144 1999-2001
Competition is good. It Competition is harmful. It stimulates people to work hard brings out the worst in people and develop new ideas 1 2 3 4 5 6 7 8 9 10 DK=99

14
WORLD VALUE SURVEYS:Questions on Volunteering
Please look carefully at the following list of voluntary organizations and activities and say... A) which, if any, do you belong to? (Code all `yes' answers as 1, if not mentioned code as 2) B) And for which, if any, are you currently doing unpaid voluntary work? [Code all `yes' answers as 1; if not mentioned code as 2]
1990-1997
1999-2001
Do voluntary work
Not Mentioned
Phil V35 V54 Social welfare services for elderly, handicapped or deprived people
1 2
Pers V28 V55 Religious or church organizations 1 2 Pers V30 V56 Education, arts, music or cultural activities 1 2 Lead V31 V57 Labor unions 1 2 Lead V32 V58 Political parties or groups 1 2 Phil V35 V59 Local community action on issues like poverty,
employment, housing, racial equality 1 2
Phil V35 V60 Third world development or human rights 1 2 Phil V33 V61 Conservation, environmental, animal rights groups 1 2 Lead V34 V62 Professional associations 1 2 Phil V36 V63 Youth work (scouts, guides, youth clubs, etc.) 1 2 Lead V29 V64 Sports or recreation 1 2 Phil V36 V65 Women’s groups 1 2 Phil V36 V66 Peace movement 1 2 Phil V36 V67 Voluntary organizations concerned with health 1 2

15
Descriptive Statistics
Table 1. Average Gender Role Attitudes and Work Values Across Birth Cohorts
Women Men
Birth Cohort:
<1935 1936-1945
1946 -1955
1956 -1965 >1965
<1935
1936-1945
1946 -1955
1956 -1965 >1965
Gender Role Attitudes: Scarce jobs should go to men first 0.36 0.32 0.23 0.20 0.15 0.38 0.32 0.26 0.23 0.21 Working mom warm with kids
0.66 0.75 0.80 0.79 0.80 0.59 0.67 0.71 0.71 0.73
Being a housewife fulfilling
0.69 0.65 0.58 0.58 0.57 0.72 0.67 0.63 0.61 0.63
Both should contribute income¹
0.79 0.80 0.81 0.77 0.82 0.82 0.75 0.76 0.74 0.78
Important Aspects of Job: Good pay 0.63 0.68 0.73 0.75 0.79 0.71 0.73 0.78 0.80 0.83 Good hours 0.47 0.49 0.53 0.57 0.59 0.44 0.42 0.46 0.49 0.54 Useful job to society² 0.57 0.46 0.44 0.40 0.40 0.28 0.39 0.42 0.37 0.38 Meeting people² 0.61 0.53 0.50 0.52 0.56 0.62 0.41 0.44 0.47 0.48 Competition OK 0.63 0.62 0.61 0.61 0.60 0.67 0.65 0.65 0.64 0.64 Number of children
Actual 2.91 2.60 2.30 2.00 1.11 2.77 2.48 2.25 1.86 0.76 Ideal 2.76 2.63 2.54 2.49 2.39 2.67 2.55 2.51 2.44 2.42

16
Empirical Results
The issue of causality is a difficult one: Were the women’s attitudes formed before their employment decisions, in their youth for example, or are these attitudes subsequent rationalizations to their previous labour market choices?
I attempt to addressed it, albeit imperfectly, in various ways.
In all individual regressions: 1) country-fixed effects are included in all regressions 2) country-average of the attitudes and values are included 3) performed on a sample of immigrant women and of men
In country level regressions: 1) average men’s responses are used

17
Table 2. Determinants of Employment Status:Marginal Effects from a Probit Model
(1) (2) (3) (4) (5) (6)
Women Immigrant
Women Men Education (primary omitted): Secondary 0.068 0.053 0.072 0.051 0.194 0.043 (5.01) (4.40) (3.58) (3.94) (193) (4.47) Upper secondary 0.137 0.109 0.128 0.101 0.369 0.065 (6.47) (5.28) (6.84) (4.97) (3.35) (5.17) Tertiary 0.251 0.212 0.216 0.187 0.275 0.103 (9.28) (7.91) (11.05) (7.90) (2.31) (4.75) Age 0.001 0.001 0.003 0.001 0.004 0.000 (0.69) (1.46) (4.44) (1.19) (3.78) (-0.32) Married -0.037 -0.033 0.010 -0.040 -0.083 0.110 (-1.67) (-1.54) (0.44) (-2.02) (-0.88) (8.39) Divorced, separated 0.033 0.034 0.032 0.026 -0.027 0.010 (1.32) (1.38) (1.21) (1.18) (-0.12) (0.70) No Kids 0.179 0.181 0.165 0.175 0.149 0.003 (7.67) (7.84) (8.05) (7.78) (1.87) (0.27) Gender Role Attitudes: Scarce jobs should go to men first
-0.068 (-5.82)
-0.049 (-2.65)
-0.077 (-7.34)
-0.222 (-4.57)
-0.007 (-0.95)
Working mom warm 0.147 0.129 0.138 0.129 0.129 with kids (7.58) (7.49) (9.58) (6.52) (1.02) Being a housewife -0.084 -0.078 -0.087 -0.141 -0.004 fulfilling (-5.92) (-5.82) (-10.70) (-2.41) (-0.70) Both spouses should 0.103 contribute income (6.08) Important in a Job: Good pay 0.029 0.022 0.006 0.048 0.036 (1.35) (1.39) (0.58) (0.50) (1.62) Good hours 0.022 -0.002 0.006 -0.060 0.011 (1.66) (-0.14) (0.58) (-0.86) (0.93) Useful to society -0.037 (-2.63) Meeting people 0.023 (1.71) Competition is OK 0.026 0.032 0.041 0.032 0.032 (1.21) (1.12) (2.96) (1.10) (2.81) Volunteer in Organizations with leader building 0.125 0.077 0.127 0.274 0.040 skills (11.56) (3.67) (12.12) (3.34) (5.53) charitable -0.047 -0.047 -0.010 -0.025 -0.039 (-1.46) (-1.95) (-0.61) (-0.42) (-1.29) religious and cultural 0.005 -0.020 0.001 -0.025 0.018 (0.32) (-0.90) (0.04) (-0.46) (2.53) Country Average Gender Role Attitudes No No No Yes No No Chi-2 667.37 3477.8 713.06 37573.2 481.78 914.38 No. obs 24433 24433 6453 23286 362 21079 No. countries 26 26 15 23 8 26

18
Table 3. Determinants of Incidence of Part-Time Work among Employees:Marginal Effects from a Probit Model
(1) (2) (3) (4) (5) Women Men Education (primary omitted): Secondary -0.052 -0.049 -0.056 -0.044 -0.010 (-3.55) (-3.54) (-2.31) (-2.86) (-2.52) Upper secondary -0.032 -0.027 -0.041 -0.022 0.002 (-1.95) (-1.67) (-1.55) (-1.21) (0.36) Tertiary -0.045 -0.040 -0.038 -0.031 0.009 (-2.58) (-2.34) (-1.58) (-1.71) (1.60) Age -0.001 -0.001 -0.002 -0.001 0.000 (-1.02) (-1.42) (-1.91) (-1.37) (-1.24) Married 0.008 0.009 0.043 0.009 -0.048 (0.46) (0.53) (1.99) (0.57) (-6.93) Divorced, separated -0.053 -0.049 -0.034 -0.049 -0.012 (-2.69) (-2.47) (-1.89) (-2.50) (-1.56) No Kids -0.105 -0.102 -0.059 -0.104 0.006 (-4.00) (-3.96) (-1.87) (-4.03) (0.80) Gender Role Attitudes: Scarce jobs should go to men first
0.015 (0.89)
-0.014 (-0.49)
0.019 (1.15)
-0.001 (-0.29)
Working mom warm -0.028 -0.028 -0.027 -0.007 with kids (-2.36) (-1.45) (-2.50) (2.09) Being a housewife 0.033 0.012 0.034 -0.003 fulfilling (3.26) (1.32) (3.75) (-1.26) Both spouses should -0.051 contribute income (-3.15) Important in a Job: Good pay -0.034 -0.027 -0.032 -0.009 (-3.53) (-1.35) (-3.31) (-2.34) Good hours 0.050 0.048 0.052 0.010 (5.26) (3.16) (5.09) (2.32) Useful to society -0.016 (-1.38) Meeting people -0.006 Competition is OK -0.054 -0.057 -0.055 -0.054 (-3.55) (-1.43) (-3.66) (-1.38) (-0.49) Volunteer in Organizations with leader building -0.026 0.001 -0.027 -0.010 skills (-2.72) (0.06) (-3.03) (-2.39) charitable 0.014 0.028 0.022 0.002 (1.62) (1.41) (3.46) (0.54) religious and cultural 0.063 0.046 0.064 0.015 (4.90) (1.38) (4.67) (2.05) Country Average Gender Role Attitudes No No No Yes No
Chi-2 1104.11 477.14 174.26
11881.2 3938.23 No. obs 15028 15028 4469 14756 18221 No. countries 26 26 15 26 26

19
Figure 1 - Women's Employment Rate Across Countries
Wom
en's
Em
ploy
men
t Rat
e
a) Scarce Jobs Should Go to Men
.1 .3 .5
0
.25
.5
.75
1
FR
FR
UKUK
DEWDEW
IT
IT
NL
NL
DK
DK
BE
BE
ESES
ESIE
IE
USUS
US
CACA
JP
JPJP
HU
HUAS
NONOSE
SESE
ISIS FI
FI
FIPL
PL
PL
CH
CH
CZ
CZ
DE
DEPT
PT AT
AT
TK
TK
TK
SK
SK
GR
Wom
en's
Em
ploy
men
t Rat
e
b) Working Mother Warm with Kids
.5 .7 .9
0
.25
.5
.75
1
FR
FR
UKUK
DEWDEW
IT
IT
NL
NL
DK
DK
BE
BE
ESES
ESIE
USUS
US
CACA
JP
JPJP
HU
HUAS
NONO SE
SESE
ISIS FI
FI
FI
PL
PL
CZ
CZ
DE
DEPT
PTAT
TK
TK
TK
SK
SK
GR
Wom
en's
Em
ploy
men
t Rat
e
c) Being a Housewife Fulfilling
.3 .5 .7 .9
0
.25
.5
.75
1
FR
FR
UKUK
DEWDEW
IT
IT
NL
NL
DK
DK
BE
BE
ESES
ESIE
USUS
US
CACA
JP
JPJP
HU
HUAS
NONO SE
SESE
ISISFI
FI
FI
PL
PL
CZ
CZ
DE
DEPT
PT AT
TK
TK
TK
SK
SK
GR
Wom
en's
Em
ploy
men
t Rat
e
d) Volunteer in Leadership Org.
.1 .3 .5
0
.25
.5
.75
1
FR
FR
UKUK
DEWDEW
IT
IT
NL
NL
DK
DK
BE
BE
ESES
ESIE
IE
USUS
US
CACA
JP
JPJP
HU
HUAS
NONOSE
SESE
ISIS FI
FI
FIPL
PL
PL
CH
CH
CZ
CZ
DE
DEPT
PT AT
AT
TK
TK
TK
SK
SK
GR

20
Figure 2 - Women's Incidence of Part-Time Work Across Countries
Wom
en's
Par
t-Tim
e W
ork
Rat
e
a) Working Mother Warm with Kids
.5 .7 .9
0
.1
.2
.3
.4
FRFR
UK
UK
DEW
DEW
IT
IT
NL
NL
DK
DK
BE
BE
ES
ESES
IE
USUS
USCA CA JP
JP
JP
HUHU
AS
NO
NO
SE
SE
SEIS
IS
FI
FIFI
PLPL
CZ
CZ
DE
DEPT
PT
AT
TKTK
TK
SK SK
GR
Wom
en's
Par
t-Tim
e W
ork
Rat
e
b) Good Pay Important in Job
.5 .7 .9
0
.1
.2
.3
.4
FRFR
UK
UK
DEW
DEW
IT
IT
NL
NL
DK
DK
BE
BE
ES
ESES
IE
IEUSUS
USCACA JP
JP
JP
HUHU
AS
NO
NO
SE
SE
SEIS
IS
FI
FI FI
PLPL
PL
CH
CZ
CZ
DE
DEPT
PT
AT
AT
TKTK
TK
SK SK
GR
Wom
en's
Par
t-Tim
e W
ork
Rat
e
c) Competition is Good
.6 .7 .8 .9
0
.1
.2
.3
.4
FRFR
UK
UK
DEW
DEW
IT
IT
NL
NL
DK
DK
BE
BE
ES
ESES
IE
IE USUS
USCACAJP
JP
JP
HUHU
AS
NO
NO
SE
SE
SEIS
IS
FI
FIFI
PLPL
PL
CH
CZ
CZ
DE
DEPT
PT
AT
AT
TKTK
TK
SKSK
GR
Wom
en's
Par
t-Tim
e W
ork
Rat
e
d) Volunteer in Religious Org.
.1 .3 .5 .7
0
.1
.2
.3
.4
FRFR
UK
UK
DEW
DEW
IT
IT
NL
NL
DK
DK
BE
BE
ES
ESES
IE
IE USUS
USCA CAJP
JP
JP
HUHU
AS
NO
NO
SE
SE
SEIS
IS
FI
FIFI
PLPL
PL
CH
CH
CZ
CZ
DE
DEPT
PT
AT
AT
TKTK
TK
SK SK
GR

21
Table 4. Determinants of Women’s Employment Rates, Incidence of Part-Time Work Across Countries: Marginal Effects from a Probit Model
(1) (2) (3) (4) (5) (6) Dependent variable: Women’s Employment Rates Women’s Part-time Work (Mean) 0.649 0.150 Women’s Education (primary omitted):
Secondary 0.416 0.263 0.299 0.179 0.185 0.204 (2.90) (3.33) (1.88) (2.21) (2.99) (2.30) Upper Secondary 0.476 0.309 0.443 0.036 0.179 0.150 (2.47) (2.53) (3.37) (0.26) (1.56) (1.31) Tertiary 0.590 0.261 0.315 0.172 0.001 0.232 (3.88) (2.25) (1.62) (2.00) (0.01) (2.26) Averages by country Women’s Men’s Women’s Men’s Gender Role Attitudes: Scarce jobs should go to men first
-0.663 (-3.94)
-0.471 (-2.98)
Working mom warm 0.118 0.070 with kids (0.682) (0.714) Being a housewife -0.133 -0.290 -0.152 -0.261 fulfilling (-1.22) (-2.75) (-1.86) (-2.60) Important in a Job: Good pay
-0.216 (-2.09)
Good hours 0.192 (1.91) Competition is OK
0.468 (2.00)
0.809 (2.98)
0.591 (-1.74)
-0.316 (-1.54)
Volunteer in Organizations with leader building 0.470 0.344 skills (2.88) (2.21) charitable -0.154 (-1.67) religious and cultural
-0.387 (-2.42)
-0.392 (-1.78)
0.355 (2.21)
Time Trend
0.001 (0.169)
-0.002 (-0.705)
0.003 (0.818)
0.003 (1.04)
-0.001 (-0.26)
0.012 (1.90)
Adjusted-R square 0.313 0.809 0.799
0.052
0.220
0.150 No. observations 45 45 45 45 45 45 No. countries 24 24 24 24 24 24

22
Figure 3 - Gender Pay Gap Across Countries
Gen
der P
ay G
ap
a) Gap: Scarce Jobs Should Go to Men
-.05 0 .05 .1 .15
.1
.2
.3
.4
.5
FR
FR
UK
UK
DEW
DEW
IT
IT
NL
NL
DK
DK
BE
BE
ES
ES
ES
IEIE
US
USUS
CA
CA
JP
JP
JP
HU
NONO
SE
SESE
IS
IS
FI
FIFIPL
PL
PL
CH CH
CZ
PT
AT
AT
TK
TK
TKSK
GR
Gen
der P
ay G
ap
b) Gap: Being a Housewife Fulfilling
-.1 -.05 0 .05 .1 .15
.1
.2
.3
.4
.5
FR
FR
UK
UK
DEW
DEW
IT
IT
NL
NL
DK
DK
BE
BE
ES
ES
ES
IE
US
USUS
CA
CA
JP
JP
JP
HU
NONO
SE
SE SE
IS
IS
FI
FIFI
PL
PL
CZ
PT
AT
TK
TK
TKSK
GR
Gen
der P
ay G
ap
c) Higher Education Gap
-.1 0 .1 .2 .3
.1
.2
.3
.4
.5
FR
FR
UK
UK
DEW
DEW
IT
IT
NL
NL
DK
DK
BE
BE
ES
ES
ES
IEIE
US
USUS
CA
CA
JP
JP
JP
HU
NONO
SE
SESE
IS
IS
FI
FIFI PL
PL
PL
CHCH
CZ
PT
AT
AT
TK
TK
TKSK
GR
Gen
der P
ay G
ap
d) Gap: Religious Volunteering
-.15 -.1 -.05 0 .05
.1
.2
.3
.4
.5
FR
FR
UK
UK
DEW
DEW
IT
IT
NL
NL
DK
DK
BE
BE
ES
ES
ES
IEIE
US
USUS
CA
CA
JP
JP
JP
HU
NONO
SE
SE SE
IS
IS
FI
FIFI PL
PL
PL
CHCH
CZ
PT
AT
AT
TK
TK
TKSK
GR

23
Table 5. Determinants of the Gender Pay Gap across Countries
Gender Gap in Mean (1) (2) (3) (4) Tertiary Education 0.034 0.568 0.544 0.567 0.597 (4.65) (4.55) (5.44) (6.42) Gender Role Attitudes: Scarce jobs should go to men first
0.029
0.402 (3.17)
0.419 (3.16)
0.445 (3.48)
Being a housewife 0.041 -0.313 -0.423 -0.861 fulfilling (-1.93) (-2.43) (-2.52) Volunteer in Organizations -0.027 0.317 0.312 religious and cultural (1.99) (1.95) Time Trend -0.004 -0.003 -0.002 -0.004 (-2.10) (-1.33) (-0.76) (-1.95) Time Trend*Being 0.070 a housewife fulfilling (1.85) Adjusted R-square 0.518 0.552 0.575 0.596 No. obs 45 45 45 45 No. countries 24 24 24 24

24
Conclusion: Policy Implications
Promoting women’s access to higher education remains the primary instrument to promote women’s equality in the labour market.
Work values and gender differences in gender roles attitudes are also found to have an important impact on women’s labour market outcomes
Much research remains to be done on the processes involved in changes in gender role attitudes
The explanatory power of attitudes such as “scare jobs should go to men” directly show that discriminatory attitudes continue to play a role in limiting women’s labour market outcomes.
Counter-acting these beliefs should address the risky-ness of housewifery. There are many female heads of household, because of widowhood, divorce or out-of-wedlock pregnancy, as entitled to scarce jobs as men.

25
Conclusion: Policy Implications
Other gender role attitudes appear to be form in the youth and may be strongly influenced by religious ideology, as argued by others (Vella, 2004; Algan and Cahuc, 2004)
The French policy there of “franciser” the training of priests and mullahs, coming from Africa and North-Africa, is an original response to this concern
Other attitudes “working mom warm with kids” may be influenced by women’s later experience in family formation and market work
There the role of firms and the state in facilitating the work-life balance of the family may be helpful (flexible work hours, affordable day-care, etc)