Embed Size (px)
Citation preview
GGCCSSEE GGEEOOGGRRAAPPHHYY
SSttuuddyy GGuuiiddee
IInnttrroodduuccttiioonn This guide has been put together by the Geography Department to help you revise for your GCSE Geography exams in the summer term. Although you have studied the topics in the course, and now have a vast knowledge about the world, there are techniques and strategies that you can use to your advantage to help you get the best grade possible! In this guide you will find: revision advice, key command words, glossaries, examples of revision diagrams and notes from each module. You should by no means use this as your only source of revision material, but refer to it to improve your study skills, thereby maximising your potential and achieving the best grade possible!! Course Outline Skills Population Tectonic Activity Coasts Agriculture Development Rivers There are two exams: Paper 1: People and the natural environment 1 ¾ hours (40% of total mark) Comprises of 2 sections: Section A – Geographical Skills – examines skills relating to OS maps, photos, cross-sections and other resources. The OS map will always be on UK. Section B – People and the natural environment – 7 resource based questions, short structured questions, one on each of the topics. You answer three questions, each are worth 15 marks each. Paper 2: People and the Human Environment 1 ½ hours (35% of total mark) There are three sections, each with two resource based questions, one on each of the topics. You answer three questions, one from each section, each one is worth 25 marks. Coursework (25% of the total mark) Approximately 2500 words based on a fieldwork investigation to Chew Magna and Wells.

CCoommmmaanndd wwoorrddss One of the major pitfalls that faces candidates in any exam is their difficulty in understanding what a question is actually asking. It’s really important that you read and understand the question, or you may answer it in the wrong way and lose marks. Correct interpretation of the command words of a question is therefore very important! It’s a good idea to pick out the command words when you read a question They tell you exactly what the examiners want you to do and what they will
give you marks for You will get very few marks if you do something else
These command words are the ones that your geography examiners will use. With each word is an explanation of what it means and some of the ways in which it may be used in a question. Describe
Say what you see (WHAT?)
Explain
Say what you see and why you are seeing it (WHY?)
Suggest
Give your own opinion (based on evidence presented to you) (WHAT DO YOU THINK?)
List
Present facts (based on evidence) in a list form. May require elaboration (explaining) but the question will usually tell you this
Give Reasons For / Account For
(see explain)
Compare / How Are ? and ? different
Give the differences and / or similarities between the two (or more) examples
An example might be that the following two questions need very different answers:

1 Describe how a wave breaks on a beach "The top of a wave falls over the bottom crashing onto the beach." 2 Explain how a wave breaks on a beach "The bottom of the wave is slowed down by friction from the sea bed, so the top topples over the bottom because it is moving faster." The answer to question 1 said HOW it happened, and the answer to question 2 said WHY it happened.
RReevviissiioonn AAddvviiccee
The key to successful revision is to organise yourself! If you don’t actively put aside time to revise, and stick to it you will never get down to it. Try to encourage each other to revise! You have been studying for your GCSEs for two years and have all the necessary knowledge to complete the exams. Revision, however, will allow you to achieve the following:
Improve your understanding of geographical ideas and processes Improve your recall (i.e. how to unlock your memory during exams) Learn how to adapt what you know to answer a wide range of questions
It is best to make your revision a DOING task. Don’t just sit and read through your geography books as your mind will tend to drift off onto other things, try and get actively involved in your revision. Active revision techniques:
Make notes from your folder on each topic. This does not mean copying out. Four or five pages can be squashed into one page of notes. You do not have to write in full sentences but you must write clearly so you understand what you are referring to when you come back to the information.
Draw spider diagrams for all the topics you have studied and put all the
important information onto 1 sheet of A4. Once you’ve learnt the information try to re-draw the diagram without referring to your notes or a textbook. I have an example of a spider diagram for Rivers – e-mail me at [email protected] and I will send back with attachment.
Write the most important facts for a particular case study on a small card
into a ‘Fact file’.
Write out case study cards with information on important case studies.
Re-draw important diagrams and annotate them e.g. a cross section of a meander
Learn the words in each topic glossary and ask someone to test you
Come and borrow the Taboo cards in the department and revise with a friend
Attend revision sessions set up by the geography department

Watch the GCSE Bitesize videos and answer the questions on the relevant topics (refer to poster in department for programme times)
TEACH each other – as soon as you try to explain something to someone you
will identify where you need to revise

WWhhaatt ddoo yyoouu nneeeedd ttoo rreevviissee?? It will seem there is loads to revise, but there are certain elements that you must focus on, as these will give you most reward in the exam.
Processes and systems
Facts and figures about places, people and events
Information about and explanations of geographical ideas and processes
Similarities and differences between features and places
Facts and characteristics
Advantages and disadvantages of different plans or solutions to issues and
problems
Sketch maps and diagrams to show or explain different features
Diagrams that help to show or explain how particular features have formed
You have studied all the above in the core of each module. Remember to refer back to your textbook or revision guide where necessary. Look back at the sheet you were given on a checklist for revision from your geography teacher – make sure that you can tick all the boxes in the ‘understand and know’ section – if not possible come and ask one of us for help!

How do you draw and label sketch maps? What is a sketch map?
When drawn, a sketch map allows a representation of a map (OS or other) to be included in an essay, investigation or project which can be used to show the particular features of an area. It is almost impossible to draw out an OS Map, there is just too much information, and it is unlikely that all of it needs to be shown. So the idea of a sketch map is to show only the features you need using coloured areas to highlight them. The example below shows a representation of part of the Kingsbridge and Salcombe (Devon, UK) OS Map. This was used to highlight the reasons for siting a new town in a particular location on the map.
The structure of a sketch map

1. TITLE - the essential first step. A title should explain what the sketch map and labels are intending to show.
2. DRAWING THE SKETCHING AREA - in this example, the sketch map centred on the location of the new town and drew 3 grid squares X 3 grid squares (making a square on the paper roughly 9cm X 9cm). This may vary with different sketch maps. In this example, this size was chosen to show enough of the surrounding area so that site factors could be shown. Make sure the sketching area is situated in the middle of the paper so that labels can be written all around it.
3. SKETCHING - this is the difficult part. Using the OS Map, select those features that are important to what is being shown and use a colour scheme to show those features. It does not have to be exact, just a representation.
4. KEY - make sure that the scheme you used to draw the sketch map is represented in the key, so those who look at the map know what it is you are trying to represent.
5. LABELLING - the rest of the space should be taken up with the most important part. Labels should be detailed and explain what it is you are trying to show. Only label those parts that are important and that are to do with the theme of the sketch map. If in doubt, look again at your title and decide whether your labels have anything to do with it! Look at the

labels on the example sketch map, which looked at site factors / reasons for siting a new town to help.
How is height shown on maps?
Height can be shown on maps in three ways - contours. layer colouring and spot heights. This page attempts to show and explain what the symbols are on the map you can expect. With OS Maps, you are only likely to find spot heights and contour lines, not layer colouring.
1 - Contour Lines
Contour lines are lines on a map which show lines of equal height. They are usually orange or brown and show the height in metres on a break in the line. The closer contour lines are together, the steeper the relief is. The space to put the numbers may be too little on an area that is steep, so the numbers may only be put on every other line. Usually, contours are drawn at 50 metre intervals.
2 - Layer Colouring
Layer colouring involves colouring the areas between contour lines a specific colour to represent a particular height. In this example, white represents below 50 metres, green is 50-100m, yellow is 100-150m and brown is 150m and above. To fully understand what is being shown, the first diagram is an aerial view with a cross-section (X-Y) through it - this is shown in the second diagram as if looking at it from the side.

Stm( Tphh Tgd S
Spot heighthey are a marks the the numbe
The secondpillar (a bluheight at thas been p
To test yogiven near different
Six Figure
• Readnum
• This
• Estitoge
• The
hts are an black spo exact placers do not
d diagram ue trianglethat pointput on the
urself on the startlandforms
e grid refe
d the number up the
s gives you
mate how ether.
4 fig ref
extremelyt with thece on the t mark the
shows a se with a b, and repr land.
patterns st of the tos.
erences:
ber along e side sec
u a 4 fig gr
far along
for the p
3 - Spo
y simple we height inmap that
e place at t
special kinlue spot inesent a po
shown on mopic that s
the bottoond (up th
rid refere
and how f
hone box
ot Heights
way of shown metres pis at the hthat heigh
d of spot n the middoint on the
maps, go bshows the
om first (ahe stairs).
ences.
far up the
is 2776. T
s
wing heighprinted nexheight shoht).
height, cadle). Thesee land whe
back to theaerial and
along the c
e feature i
The 6 fig r
ht on a maxt to it. Town by the
alled a triae are printere a heigh
e sheet thd side view
corridor? A
s and put
reference
p. Simply, The spot e numbers
angulation ted with a ht marker
hat you wews of
And the
the 2
is 270752
ere
2.

3
2
1st
2nd

Population density: How many people there are, usually expressed as people per km2
Population distribution: How a population is spread out.
Factors affecting population density include:
• the availability of water • the availability of housing • the availability of education • the availability of health care
Areas (parts of continents, parts of countries or whole countries) with high population densities are usually much easier for people to live in e.g. flat lowlands or areas with a reasonable climate. They may also be areas with important resources e.g. coal, oil, metals. Or they may be in easily accessible positions e.g. near major rivers.
The main countries that are densely populated are Bangladesh, India, Sri Lanka, Japan, UK, the Netherlands, Germany, the Philippines, South Korea and Vietnam. Most of these countries have sub-tropical to temperate climates and abundant flat land.
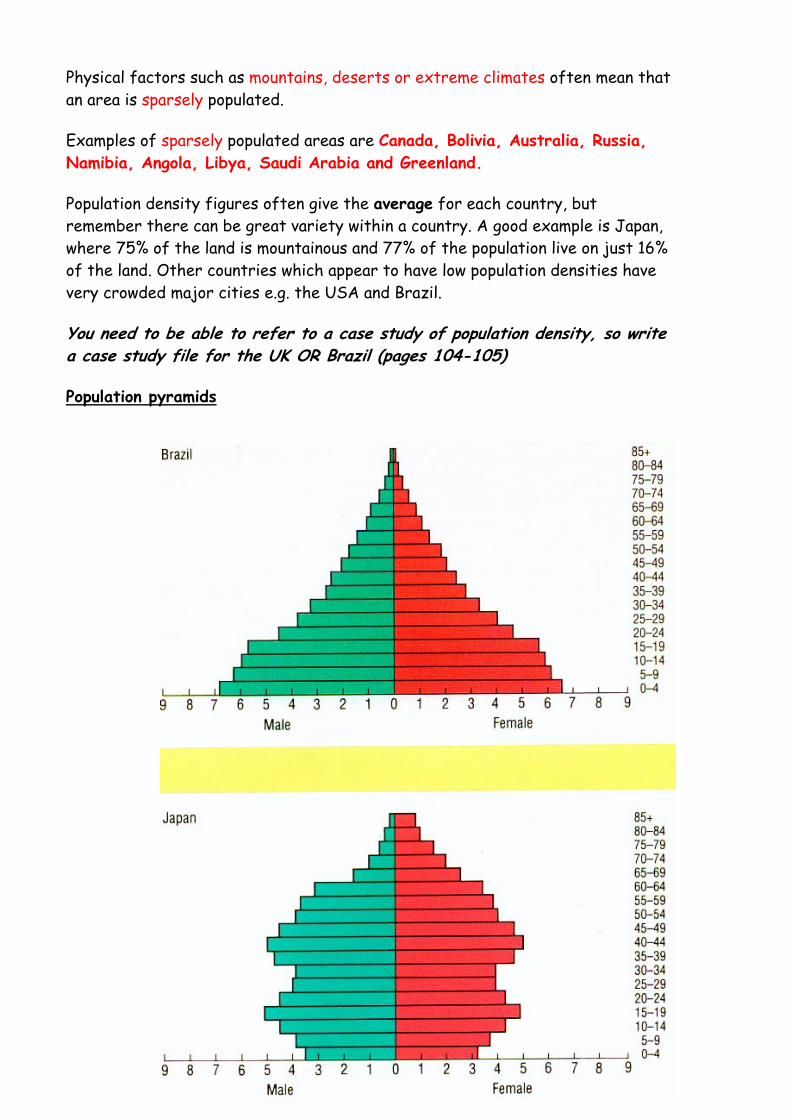
Physical factors such as mountains, deserts or extreme climates often mean that an area is sparsely populated.
Examples of sparsely populated areas are Canada, Bolivia, Australia, Russia, Namibia, Angola, Libya, Saudi Arabia and Greenland.
Population density figures often give the average for each country, but remember there can be great variety within a country. A good example is Japan, where 75% of the land is mountainous and 77% of the population live on just 16% of the land. Other countries which appear to have low population densities have very crowded major cities e.g. the USA and Brazil.
You need to be able to refer to a case study of population density, so write a case study file for the UK OR Brazil (pages 104-105)
Population pyramids
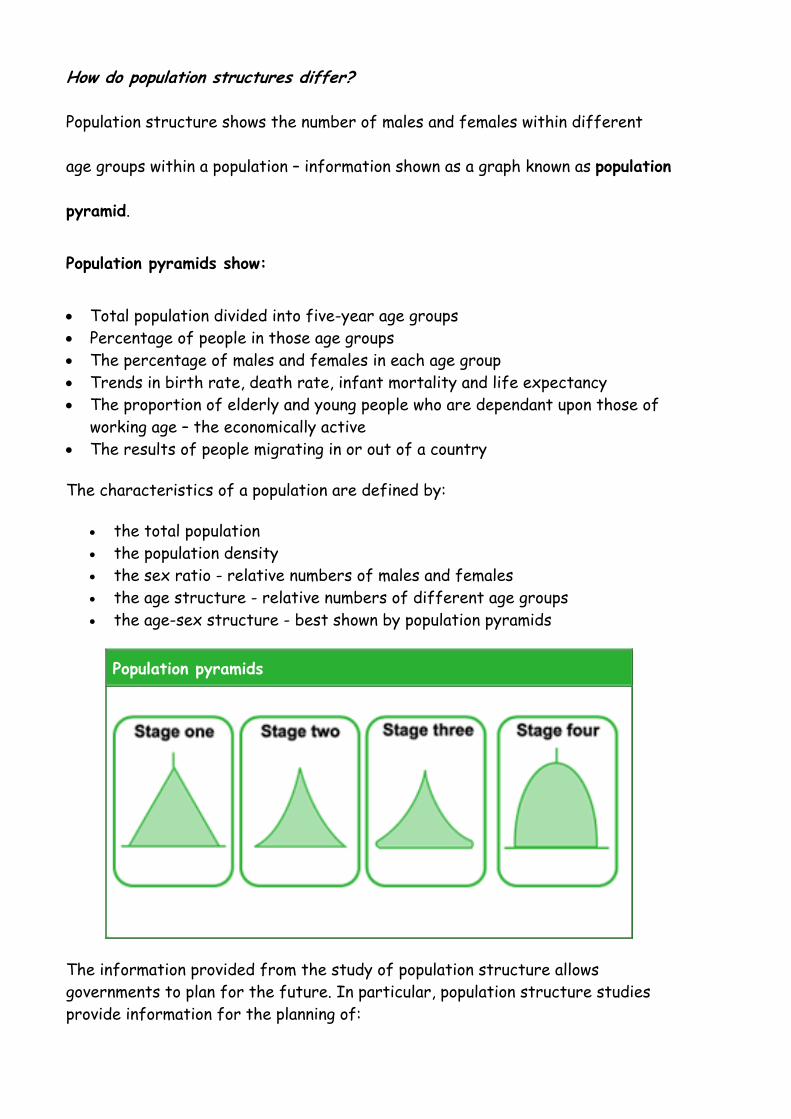
How do population structures differ?
Population structure shows the number of males and females within different
age groups within a population – information shown as a graph known as population
pyramid.
Population pyramids show:
• Total population divided into five-year age groups • Percentage of people in those age groups • The percentage of males and females in each age group • Trends in birth rate, death rate, infant mortality and life expectancy • The proportion of elderly and young people who are dependant upon those of
working age – the economically active • The results of people migrating in or out of a country
The characteristics of a population are defined by:
• the total population • the population density • the sex ratio - relative numbers of males and females • the age structure - relative numbers of different age groups • the age-sex structure - best shown by population pyramids
Population pyramids
The information provided from the study of population structure allows governments to plan for the future. In particular, population structure studies provide information for the planning of:

1. Education
• Stage 2 populations need to provide for a large number of primary schools.
• Stage 4 populations need a greater number of adult education centres.
2. Health care
• Poorer populations suffer more from nutritional diseases and environmental diseases.
• Wealthy populations suffer more from heart diseases and cancers.
3. Housing
• Expanding populations need more housing. • Contracting populations need houses to be repaired and upgraded.
4. Transport systems
• New suburbs and towns need expanded transport and telecommunications systems.
• Older suburbs and communities need money for system maintenance.
5. Social security (state pensions)
• An ageing population needs more money for social security and less for youth facilities such as sport clubs.
Reasons for high birth and death rates in developing countries:
work on land/farms Care for family when ill/old Lots of children die from disease Child go to city to earn money Religious beliefs against birth control Having a large family gives status Tradition of having large families Children are regarded as insurance
Reasons for low birth and death rates in developed countries:
Excellent standard of living Don’t need lots of children to work Children survive so don’t have to have more Excellent healthcare

Excellent family planning Children live free from disease Want to spend money on other things Have pensions for when get old don’t need children to look after them Want careers
Overpopulation often leads to poverty.
The effects of overpopulation in developing countries are:
• Pressure on the land • Land is over-utilised • Housing shortages • Lack of work • The spreading of diseases • Poor medical facilities
How do population structures differ within countries?
The economically active are those people in the 15 to 64 year age group. It is this group of people who usually earn most of the wealth for a region or town. Those outside of this group are referred to as the dependant population.
Consequences of a high proportion of elderly people
Lack of sheltered housing/nursing homes Lack of recreational facilities for young people Economically active provide money for area but services only provided for the
elderly Strain on services such as doctors Lack of services such as meals on wheels and home help as such a great
demand Post Office services over-run by pension withdrawals!
Consequences of a high proportion of young people
Strain on services such as schools Lack of professionals such as midwives due to high demand Lack of safe areas for children to play Lack of services for young people such as youth centres

The demographic Transition Model
A - Stage 1
Both high birth rates and death rates fluctuate in the first stage of the population model giving a small population growth (shown by the small total population graph). There are many reasons for this:
• little access to birth control • many children die in infancy (high infant mortality) so parents tend to have
more children to compensate in the hopes that more will live • children are needed to work on the land to grow food for the family • children are regarded as a sign of virility in some cultures • religious beliefs (e.g. Roman Catholics and Hindus) encourage large families
high death rates, especially among children because of disease, famine, poor diet, poor hygiene, little medical science.
Example: Some tribe sin Amazon
B - Stage 2

Birth rates remain high, but death rates fall rapidly causing a high population growth (as shown by the total population graph). The reasons for this could be:
• improvements in medical care - hospitals, medicines, etc. • improvements in sanitation and water supply • quality and quantity of food produced rises • transport and communications improve the movements of food and medical
supplies
decrease in infant mortality.
Example: Bangladesh, Nigeria
C - Stage 3
Birth rates now fall rapidly while death rates continue to fall. The total population begins to peak and the population increase slows to a constant. The reasons for this could be:
• increased access to contraception • lower infant mortality rate means there is less need to have a bigger
family • industrialisation and mechanisation means fewer labourers are required • the desire for material possessions takes over the desire for large
families as wealth increases
• equality for women means that they are able to follow a career path rather than feeling obligated to have a family.
Example: Brazil
D - Stage 4
Both birth rates and death rates remain low, fluctuating with 'baby booms' and epidemics of illnesses and disease. This results in a steady population.
Example: UK
E? - Stage 5?
A stage 5 was not originally thought of as part of the DTM, but some northern countries are now reaching the stage where total population is declining where birth rates have dropped below death rates. One such country is Germany, which has taken in foreign workers to fill jobs. The UK's population is expected to start declining by 2021.

TThhee ddeemmooggrraapphhiicc ttrraannssiittiioonn iinn rreellaattiioonn ttoo PPooppuullaattiioonn ppyyrraammiiddss
If you understand the demographic transition model and its relationship to population structure, then you are well on the way to understanding population dynamics.
Attempts to solve population problems in MEDCs:
Advertising, Accepting immigrants, High family allowances, tax incentives, banning contraception, crèches for working mothers.
Attempts to solve population problems in LEDCs
Family planning and information services, better education, improved healthcare, better employment prospects, later marriages, migration to cities, education and careers for women.

Migration is the movement of people. There are different types of migration. In voluntary migration, the migrant makes the decision to move rather than being forced to do so.
1. Rural to urban migration Push factors Pull factors
• Unemployment • Low wages • Natural disasters • Mechanisation
• Greater job opportunities • Higher wages • Better social services • Better medical facilities • The "bright lights" theory
Examples: Brazil, mainly developing countries 2. Urban to rural migration People often want to live in the countryside because there is less noise, less pollution, less traffic congestion and the surroundings are often more attractive. Examples: South East to South West, mainly developed countries
3. International migration is a voluntary movement to a different country.
Examples: Mexico to USA, UK to Australia
WWhhaatt aarree tthhee ppuusshh aanndd ppuullll ffaaccttoorrss ffrroomm MMeexxiiccoo iinnttoo tthhee UUSSAA??
Why leave Mexico?
• Low standard of living • Lack of skilled, well-paid employment • Few opportunities • Lack of education • Poor quality housing • Poor health service
Why migrate to the USA?
• Many opportunities • High standard of living (one of highest in the world) • Many job opportunities (well-paid jobs) • Education

• Excellent health care • Search for the ‘American Dream’
Some characteristics of Mexico and the USA: USA Mexico Unemployment 7% 17% People per doctor 400 1800 Family income $24, 750 $3, 750 School attendance 99% 55%
4. Immigration is the movement into a country from another country. 5. Emigration is the movement from one country to another country. Immigration and emigration cannot happen in isolation. The country being left declines in population, while the population of the receiving country increases.
6. Transmigration refers movement within a country.
Example: Indonesia
7. Forced migration is when people are forced to leave their homes (these people are often called "refugees"). Why do they move?
• war • politics • religious persecution • famine

GGLLOOSSSSAARRYY PPOOPPUULLAATTIIOONN
TTEERRMM DDEEFFIINNIITTIIOONN
Birth Rate Number of babies born per 1000 of the population Death Rate Number of deaths per 1000 of the population Natural Increase The rise in population caused by birth rate exceeding death
rate Population Density The number of people living in an area (usually expressed as
people Km2) Population Distribution The location of people within an area Population structure The age and sex composition of a population Demographic Transition Model
A model of population change that shows the fluctuations in birth and death rates over time
Life Expectancy The average age that a person can expect to live Infant Mortality Measure of the number of infants dying under 1 year of age,
expressed as number of deaths per 1000 live births Dependency Ratio Non-economically active divided by economically active Push Factors Any factor which repels people from an area Pull factors Any factor which tends to attract people to an area Migration Movement of people away from their homes Refugee Person fleeing from oppressive or dangerous conditions and
seeking refuge in another country Population Pyramid Graph of the population of an area, using age and sex
groupings Immigration Movement of people to a country emigration Movement from a country Carrying capacity The ability of an area to carry a population according to
resources available. Overpopulation Occurs when the resources of an area are unable to sustain a
population at their existing standard of living Rural-urban migration The movement of people away from the countryside to towns
and cities Urban-rural migration The movement of people out of the old inner city areas to
dormitory settlements, new towns and smaller villages Sparsely populated Few people in an area Densely populated Many people in an area

Structure of the earth
Characteristics Depth Crust
The crust is the outer layer of the earth. It is a thin layer between 0-60km thick. The crust is the solid rock layer upon which we live. There are two different types of crust: continental crust, which carries land, and oceanic crust, which carries water.
0-60km
Mantle
The mantle is the widest section of the earth. It has a diameter of approximately 2900km. The mantle is made up of semi-molten rock called magma. In the upper parts of the mantle the rock is hard, but lower down, nearer the inner core, the rock is soft and beginning to melt.
2900km
Inner Core
Outer Core
Mantle
Crust

Core
The inner core is in the centre of the earth and is the hottest part of the earth. The inner core is solid. It is made up of iron and nickel with temperatures of up to 5500°C. With its immense heat energy, the inner core is like the engine room of the Earth. The outer core is the layer surrounding the inner core. It is a liquid layer, also made up of iron and nickel. It is still extremely hot here, with temperatures similar to the inner core.
2900-5150km 5150-6370km
Plate Boundaries of the earth
Plates and plate boundaries
The earth's crust is broken up into pieces. These pieces are called plates. Heat rising and falling inside the mantle creates convection currents. The convection currents move the plates. The movement of the plates, and the activity inside the earth, is called plate tectonics.
Plate tectonics cause earthquakes and volcanoes. The point where two plates meet is called a plate boundary. Earthquakes and volcanoes are most likely to occur either on or near plate boundaries.

T(
C(sb
Cf
C
P
T
Dpadg
Plate
Tensional / divergent )
Compressionsubduction z
boundaries
Conservativefaults) plate
Collision plat
Plates beh
• At a(TEN
• At aothe
• At a
Types of f
During moplastically as a carpedown-foldgeology we
Boundary
Constructivplate bound
al / Destruzones) plate
e (transform boundaries
te boundarie
ave differ
a construcNSIONALa destructer. (COMPa conserva
folds
untain bui to producet might ws are adje give eac
y
ve aries
uctive e
m
es
rently at d
ctive or divL) tive or conRESSION
ative or tr
ilding or cce folds. wrinkle whacent to ch a separ
Diagram
different
vergent b
nvergent NAL) ransform b
Fold M
compressio Generallyhen you puone anothrate desc
m
Cobotwfro
Debooceundco
Cobotwoth
Coocccotow
plate boun
boundary t
boundary
boundary t
Mountains
onal stresy, a serieush on onher and grcriptive na
Descri
nstructive pundaries occ
wo plates movom each oth
estructive plundaries occeanic plate ider (or subdntinental pla
nservative pundaries occ
wo plates slidher.
llision plate cur when twntinental plawards each
ndaries:
the plates
the plates
the plates
s
ss, rocks s of foldse end. Thrade into ame.
iption
plate cur when ve away
her
late cur when anis forced ducts) a ate
plate cur when de past each
boundaries wo ates move other.
move apar
s move tow
s slide pas
may defos is produhe up-foldone anoth
Examp
North AmericanEurasian Plate
Pacific Plaand the Eurasian Plate
h
North AmericanPlate and Pacific Pla
Indo-Australianand the Eurasian Plate
rt.
wards each
t each oth
orm uced, muchds and thher. In
ple
and
ate
the ate
n
h
her.
h e

Basic types of folds:
anticlines - upfolds
synclines – downfolds
What are fold mountains?
Fold mountains are mountains formed from the folding of the earth's crust.
How are fold mountains formed?
Fold mountains are formed when two plates move together (a compressional plate margin). This can be where two continental plates move towards each other or a continental and an oceanic plate. The movement of the two plates forces sedimentary rocks upwards into a series of folds. Fold mountains are usually formed from sedimentary rocks and are usually found along the edges continents. This is because the thickest deposits of sedimentary rock generally accumulate along the edges of continents. When plates and the continents riding on them collide, the accumulated layers of rock crumple and fold like a tablecloth that is pushed across a table.
There are two types of fold mountains: young fold mountains (10 to 25 million years of age, e.g. Rockies and Himalayas) and old fold mountains (over 200 million years of age, e.g. Urals and Appalachians of the USA).
Human activity in fold mountains - The Alps
The Alps are home to eleven million people and thus the most densely populated mountain area in the world. The economy of this region is based on the exploitation of the coniferous forest and pasturing dairy cattle, and tourism plays an important role.
Tourism
Since the end of the second world war The Alps have become the winter and summer play ground of European urban dwellers.
Winter The Alps are a very popular destination amongst winter tourists. Ski resorts such as Val d'Isere and Les Deux Alps have been purpose-built. These areas are very crowded in the winter but tend to be quieter in the summer. However, traditional ski resorts tend to be busy throughout the year.

Summer Between June and September The Alps is heavily populated with walkers, cable-car riders and paragliders.
The huge number of tourist visitors to The Alps has led to them becoming the most threatened mountain chain in the world. This is in terms of its fragile ecological and physical system.
Farming and Forestry
Coniferous trees are the main trees forested in the Alps. They are ideally suited to the Alpine environment. Their conical shape makes the tree stable in windy conditions. The downward sloping, springy branches allows the snow to slide of the tree without damaging its branches.
The wide meadows of The Alps make the area ideal for sheep farming. In the more extreme upland areas goat herding is the main type of farming. The cold climate and difficult relief make it almost impossible for arable farming to occur.
HEP Schemes
Hydroelectric power schemes are common in The Alps. The combination of tectonic and glacial processes make the area ideally suited for HEP schemes. HEP schemes often involve many different watersheds. It is an area of excess water and deep U-shaped valleys. Since the development of HEP at the end of the 19th and the beginning of the 20th centuries these valleys have been dammed and used to develop HEP.
The development of HEP in The Alps led to the establishment in the lower valleys of electricity-dependent industries, manufacturing such products as aluminium, chemicals, and speciality steels.
TThhee PPrroobblleemmss ooff LLiivviinngg iinn FFoolldd MMoouunnttaaiinn AArreeaass
- Mountainous regions are particularly difficult to build in due to the steep sided valleys and cold climate. Roads and other communications links have to snake their way up wherever they can, and often these roads are not big enough to adequately service a large community.

- The climate is very cold and wet, meaning that most industrial and agricultural activity is difficult. For farmers they have a very short growing season, and it is difficult to use machinery on the steep slopes.
- Avalanches are a constant threat, as was seen to devastating effect in Ranrahirca, Peru, in 1962. Huge amounts of money are spent each year to try and combat the avalanche threat, especially with the large amount of tourists using the mountains.
Volcanoes

Ac
At
Tharestrvolcomsymsidhiglaycin
At destruccannot flow
At construthe volcano
e most me composrato-volccanoes wmposite vmmetricades, somegh. They yers of landers, blo
ctive platew very far
uctive plato’s vent. T
majestic site volcacanoes. Uwhich arevolcanoesally shapeetimes riare built
ava flowsocks, and
e boundarir from the
te boundarThis makes
of the voanoes, alsUnlike thee flat ands are taled, with sing 10,0t of alters, volcanicd bombs.
ies the lave volcano’s
ries the las the volca
olcanoes so knowne shield d broad, l, steep
000 feet rnating c ash,
va is viscous vent. Thi
ava is runnyano gentle
n as
us (thick ls makes th
y and it ca sided.
Shield vvolcanoelike volcvolcanoeexampleexclusivis very freason t(you canruns dowvolcanoesomehowotherwilow-exp
ike treaclehe volcano
an flow fa
volcanoeses on Earcanoes. Tes are thes. Shieldvely basafluid whethese von't pile uwnhill). Ees are onw gets inse they alosivity.
e) and it o steep sid
r away fro
s are therth that The Hawahe most fd volcanoalt, a typeen eruptelcanoes ap a fluid
Eruptionsnly explosnto the vare char
ded.
om
e largest actually
aiian shiefamous oes are ae of lavaed. For tare not s that eass at shielsive if wa
vent, acterize
look eld
almost that
this steep sily ld ater
ed by

Why do people live close to volcanoes?
Volcanoes have a wide range of effects on humans. These can be problematic or beneficial. It is usually the destructive nature of volcanoes which is more widely documented. However, many people rely on volcanoes for their everyday survival. Today, many millions of people live close to volcanoes for this very reason.
People live close to volcanoes because Geothermal energy can be harnessed by using the steam from underground which has been heated by the Earth's magma. This steam is used to drive turbines in geothermal power stations to produce electricity for domestic and industrial use. Countries such as Iceland and New Zealand use this method of generating electricity.
Volcanoes attract millions of visitors around the world every year. Apart from the volcano itself, hot springs and geysers can also bring in the tourists. This creates many jobs for people in the tourism industry. This includes work in hotels, restaurants and gift shops. Often locals are also employed as tour guides. Lava from deep within the earth contains minerals which can be mined once the lava has cooled. These include gold, silver, diamonds, copper and zinc, depending on their mineral composition. Often, mining towns develop around volcanoes.
Volcanic areas often contain some of the most mineral rich soils in the world. This is ideal for farming. Lava and material from pyroclastic flows are weathered to form nutrient rich soil which can be cultivated to produce healthy crops and rich harvests.
Mt Pinatubo eruption 1991 USGS usually first on the scene – their job to predict eruption – when and where so can evacuate the area. Very difficult job. Spring 1991 – Pinatubo began to stir, explosions rocked mountain. Tribespeople fled as the volcano rumbled and stirred. Philippine Institute of Volcanology ordered areal view to be made. Steam was visible but thought just ‘letting off steam’. Ordered seismometers to be placed around volcano and in 2 days had recorded 400 earthquakes. Called in USGS for help. Area has population of over 10 million and 2 US military bases. Less than 3 weeks after first stir, USGS on scene and monitoring. Thought of 3 possibilities: ♦ Magma rising ♦ Letting off steam ♦ Quakes produced by tectonic stresses

By early May – 7 seismic stations on mountain. Recorded quakes 5 miles beneath surface – NOT letting off steam. Measured SO2 as indicator of magma rising – substantial amount so therefore must be. Pinatubo had not erupted in 600 years – was it going to blow? Not unusual for magma to rise. BY 2nd June, activity had increased. Debate as to what to do. Alert level 2 given – eruption probable. Limited evacuation of 20,000 people within 6 miles. At Clark Air Base plans were made to move 15,000 people and equipment. A lot riding on getting prediction right. In 1986 1 day after they said that volcano posed no threat, Nevado Del Ruiz erupted and killed thousands. 5th June – pressure building, more quakes under vent. Discussion about alert level 3, could see a blob of magma, decided to call a 3. 7th June – continuous quakes. Evacuated everyone in 12 mile radius, 120,000 people evacuated. Personnel at Clark Air Base wanted to stay as they believed the volcanologists could give them 6 hours notice to leave. 8th June – serious problem. A slug like dome of magma appeared, very explosive so felt very concerned. June 10th – evacuate rest of air base and leave 1,500 security staff. 12th June – eruption occurs!! Very big blast, massive pyroclastic flow (flow of hot ash and dust that travels like a cloud down the mountain very fast!). Covered area in ash 50 miles away. To make matters worse – typhoon on way! 15th June – eruption from 2.00 am onwards throwing ash and dust 100,000 ft into atmosphere. Eruption looked 10 miles wide – you could see it 15 miles away. Typhoon hit area at same time – EVERYONE TO GET OUT!!
The Eruptions
From June 7 to 12, the first magma reached the surface of Mount Pinatubo. Because it had lost most of the gas contained in it on the way to the surface (like a bottle of soda pop gone flat), the magma oozed out to form a lava dome but did not cause an explosive eruption. However, on June 12 (Philippine Independence Day), millions of cubic yards of gas-charged magma reached the surface and exploded in the reawakening volcano's first spectacular eruption.

When even more highly gas charged magma reached Pinatubo's surface on June 15, the volcano exploded in a cataclysmic eruption that ejected more than 1 cubic mile (5 cubic kilometers) of material. The ash cloud from this climactic eruption rose 22 miles (35 kilometers) into the air. At lower altitudes, the ash was blown in all directions by the intense cyclonic winds of a coincidentally occurring typhoon, and winds at higher altitudes blew the ash southwestward. A blanket of volcanic ash (sand- and silt-size grains of volcanic minerals and glass) and larger pumice lapilli (frothy pebbles) blanketed the countryside. Fine ash fell as far away as the Indian Ocean, and satellites tracked the ash cloud several times around the globe.
Huge avalanches of searing hot ash, gas, and pumice fragments (pyroclastic flows) roared down the flanks of Mount Pinatubo, filling once-deep valleys with fresh volcanic deposits as much as 660 feet (200 meters) thick. The eruption removed so much magma and rock from below the volcano that the summit collapsed to form a large volcanic depression (caldera) 1.6 miles (2.5 kilometers) across.
Much weaker but still spectacular eruptions of ash occurred occassionally through early September 1991. From July to October 1992, a lava dome was built in the new caldera as fresh magma rose from deep beneath Pinatubo.
Continuing Hazards
Even after more than 5 years, hazardous effects from the June 15,1991, climactic eruption of Mount Pinatubo continue. The thick, valley-filling pyroclastic-flow deposits from the eruption insulated themselves and have kept much of their heat. These deposits still had temperatures as high as 900°F (500°C) in 1996 and may retain heat for decades. When water from streams or underground seepage comes in contact with these hot deposits, they explode and spread fine ash downwind. Since the climactic 1991 eruption, ash deposits have also been remobilized by monsoon and typhoon rains to form giant mudflows of volcanic materials (lahars).

The June 15, 1991, explosive eruption of Mount Pinatubo, Philippines, was the second largest volcanic eruption of this century and by far the largest eruption to affect a densely populated area. The eruption produced high-speed avalanches of hot ash and gas (pyroclastic flows), giant mudflows (lahars), and a cloud of volcanic ash hundreds of miles across. (U.S. bases have reverted to Philippine control since 1991.)
Impacts of the Eruptions
Fortunately, scientists from the Philippine Institute of Volcanology and Seismology and the U.S. Geological Survey had forecast Pinatubo's 1991 climactic eruption, resulting in the saving of at least 5,000 lives and at least $250 million in property. Commercial aircraft were warned about the hazard of the ash cloud from the June 15 eruption, and most avoided it, but a number of jets flying far to the west of the Philippines encountered ash and sustained about $100 million in damage. Although much equipment was successfully protected, structures on the two largest U.S. military bases in the Philippines--Clark Air Base and Subic Bay Naval Station--were heavily damaged by ash from the volcano's climactic eruption.
Nearly 20 million tons of sulfur dioxide were injected into the stratosphere in Pinatubo's 1991 eruptions, and dispersal of this gas cloud around the world caused global temperatures to drop temporarily (1991 through 1993) by about 1°F (0.5°C). The eruptions have dramatically changed the face of central Luzon, home to about 3 million people. About 20,000 indigenous Aeta highlanders, who had lived on the slopes of the volcano, were completely displaced, and most still wait in resettlement camps for the day when they can return home. About 200,000 people who evacuated from the lowlands surrounding Pinatubo before and during the eruptions have returned home but face continuing threats from

lahars that have already buried numerous towns and villages. Rice paddies and sugar-cane fields that have not been buried by lahars have recovered; those buried by lahars will be out of use for years to come.
Why do earthquakes happen?
MMaaiinn CCoonncceeppttss
Earthquakes occur along faults, which are large cracks in the earth’s crust. Most of these are associated with the larger plate boundaries, along which the largest earthquakes usually occur.
They are caused by the sudden jerking movements of the fault, either laterally or vertically, and are almost impossible to predict.
An earthquake is the shaking and vibration of the crust due to movement of the Earth's plates (plate tectonics). Earthquakes can happen along any type of plate boundary.
Earthquakes are caused when the tension is released from inside the crust. This happens because plates do not move smoothly - sometimes they get stuck. When this happens a great deal of pressure builds up. When this pressure is eventually released, an earthquake tends to occur.
The point inside the Earth's crust where the pressure is released is called the focus. The point above the focus, on the Earth's surface is called the epicentre.
In an earthquake, energy is released in the form of waves. These are called seismic waves. The waves spread out from the focus. The strongest waves are found near the centre of the earthquake. This means that the most severe damage caused by an earthquake will happen close to the epicentre.

The diagram above illustrates how the movement of two plates at the plate boundary creates pressure deep inside the Earth. This is the focus. This pressure travels up to the Earth's crust and escapes at the epicentre of the earthquake. The pressure, released at the epicentre, travels outwards in all directions in rings (seismic waves). The waves are felt most strongly at the epicentre, becoming less strong as they travel further away.
Earthquakes are measured in two ways:
- The Richter scale measures the magnitude of an earthquake using an instrument called a seismograph. The Richter scale is logarithmic, meaning that an earthquake measuring 7 is 10 times more powerful than one measuring 6, and 100 times more powerful than one measuring 5.
- The mercalli scale measures the damage caused by an earthquake. It rates each quake from I to XII, depending on how much damage was done, and is dependent not only on the magnitude of the earthquake but also the depth of the earthquake.
The point at which an earthquake actually begins, deep below the earth’s surface is called the focus. If the focus is deep then the effects of the earthquake may be less as the shockwaves have more rock to move through. Obviously this also depends on what type of rock it is. The point directly above the focus, on the earth’s surface, is called the epicentre. The effects of the earthquake are usually worst here, and then radiate out from this spot.

EEffffeeccttss ooff EEaarrtthhqquuaakkeess
The effects of an earthquake can be easily split up into two sections. Primary effects are those that occur immediately as the earthquake happens. These include buildings collapsing, roads and bridges being destroyed and railway lines being buckled. All occur due to the shaking of the ground.
Secondary effects are the subsequent effects of the quake, and can be even more devastating then the primary ones. The main secondary effects are:
- Fires: usually from ruptured gas lines. This was the main cause of death and damage after the San Francisco earthquake in 1906.
- Tidal waves: A tidal waves caused by an earthquake is called a tsunami. They can travel very quickly across entire oceans, before engulfing land 1000’s of miles away. The 1964 Alaskan earthquake caused considerable damage in several Californian coastal areas. Although Los Angeles has escaped so far, its is still considered to be a tsunami hazard prone area
- Landslides can often be triggered by earthquakes, causing huge amounts of material to be moved very quickly. This is actually what occurred just before the volcanic eruption on Mt. St. Helens. They are most likely to occur where the land is steep, saturated or weak.
- Diseases can spread very quickly in the unsanitary conditions often left behind by massive earthquakes. Water becomes contaminated very quickly, and in Less Economically Developed Countries (LEDC’s) especially; access for the medical services can be badly hampered by the damage caused by the quake. The most common diseases to be associated with earthquakes are therefore water-borne ones like cholera and typhoid.
San Francisco 1989 and Mexico City 1985 San Fran lies on the San Andreas Fault line where the North American and Pacific plates meet. There are 20 000 tremors a year in California. 30 million people live in California. October 17th 1989 5.04 PM earthquake occurred. When the world series baseball game was happening at Candlestick Park. More than 40 lives were lost. The epicentre was under Loma Prieta – 60 miles up the coast. People described it as a gopher burying under the ground – a loud stamping noise. Lasted for 15 seconds. There was much chaos and confusion.

The hardest hit was the Marina District – shock waves caused soil to be unstable and buildings collapsed. Built on the site of landfill from previous quake in 1906. Many fires – couldn’t extinguish. The Bay Bridge was broken – upper deck had fallen onto lower deck. Nimitz highway collapsed – 1.5 miles broken. Upright beam collapsed. Looked like an ocean wave travelling up highway. People squashed into 18 inch gap. Smoke was bellowing from gap as cars caught fire with people trapped inside. Due to aftershocks, gap made smaller – 9 inches. 42 people died on highway. Many psychological effects. Mexico City – 3 tectonic plates rub together. On site of the Aztec capital. Built on a lake bed, drained swamp. The soft ground means that the buildings are not quake proof. Liquefaction occurred. September 19th 1985 – 7.18 am. Mexico City has population of 20 million and is the world’s largest city. Shockwave came in at 15 000 miles per hour. High rise apartments swayed. 18000 died. 58 babies pulled out alive at site of hospital.
TThhee IImmppaacctt ooff NNaattuurraall HHaazzaarrddss
MMEEDDCC’’ss vv LLEEDDCC’’ss
Natural hazards will affect More Economically Developed Countries (MEDC’s) in a differing way to those that occur in Less Economically Developed Countries (LEDC’s).
- Health Care: MEDC’s have the medical resources and money to quickly get appropriate aid to areas after a natural disaster. LEDC’s often have to rely on aid from overseas as their health system, which is inadequate. This overseas aid takes time to arrive, which could mean far more casualties.
- Emergency Services: In MEDC’s who have a volcanic or earthquake risk, such as Japan and New Zealand, there are well thought out emergency procedures. Practices in schools and places of work mean that people know what to do it the event of a natural disaster. The Government’s and military have special emergency plans to help with the situation.
Often LEDC’s do not have these emergency plans, and so far more damage can be done before the emergency services reach the stricken area.
- Building Technology: Countries such as Japan and the United States have been at the forefront of developing buildings that have more chance of resisting an earthquake. Most houses in San Francisco are made of wood, to make them more

flexible and allow them to move with the quake. Larger skyscrapers are built with flexible foundations, which literally allow them to sway during a quake, rather than being rigid and falling down. Many countries in areas prone to natural hazards have building codes to say where they can and cannot build, and how high the buildings can be. New Zealand is a good example of where this occurs. LEDC’s don’t tend to have the technology available or money to pay for it, and so often their buildings are very susceptible to earthquakes.
- Scientific Prediction: Scientists work throughout the world, trying to predict earthquakes and volcanoes. So far they have found it very difficult to predict earthquakes, although scientists monitoring the San Andreas Fault in California have planted a huge number of seismographs in the ground to try to detect even the faintest of tremors. Volcanoes generally are easier to predict, although the specific time of the eruption is not so easy to do. Scientists can measure changes within the mountain that helps them to predict that the volcano is going to erupt. This usually allows the Local Authorities sufficient time to evacuate people from the danger area (as seen at both Mt. St. Helens and Mt. Pinatubo). However they still find it very difficult to accurately predict the size of the eruption. MEDC’s do tend to have more investment for this type of research and development than LEDC’s.
Recovery: MEDC’s tend to be able to recover quickly from a natural disaster, due to having the investment and technology needed to return the area to as good as new as soon as possible. Because LEDC’s often have to rely on aid from overseas, this quick recovery is often impossible for them.
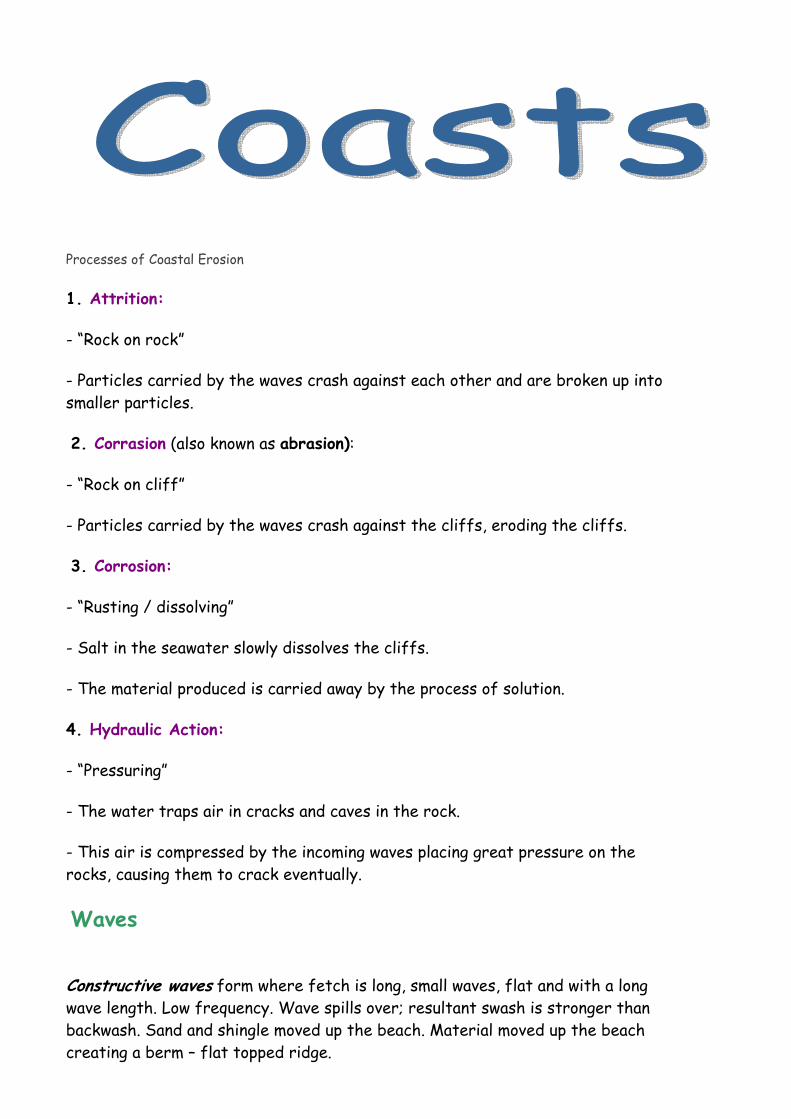
Processes of Coastal Erosion
1. Attrition:
- “Rock on rock”
- Particles carried by the waves crash against each other and are broken up into smaller particles.
2. Corrasion (also known as abrasion):
- “Rock on cliff”
- Particles carried by the waves crash against the cliffs, eroding the cliffs.
3. Corrosion:
- “Rusting / dissolving”
- Salt in the seawater slowly dissolves the cliffs.
- The material produced is carried away by the process of solution.
4. Hydraulic Action:
- “Pressuring”
- The water traps air in cracks and caves in the rock.
- This air is compressed by the incoming waves placing great pressure on the rocks, causing them to crack eventually.
Waves
Constructive waves form where fetch is long, small waves, flat and with a long wave length. Low frequency. Wave spills over; resultant swash is stronger than backwash. Sand and shingle moved up the beach. Material moved up the beach creating a berm – flat topped ridge.
Destructive waves more common where fetch is shorter. Large waves, steep with short wave length. High frequency. Steepen rapidly and plunge over. Powerful backwash moves sediment down the beach. Most material moved down to form a longshore (breakpoint) bar.
Coastal Transportation and Deposition
Coastal transportation
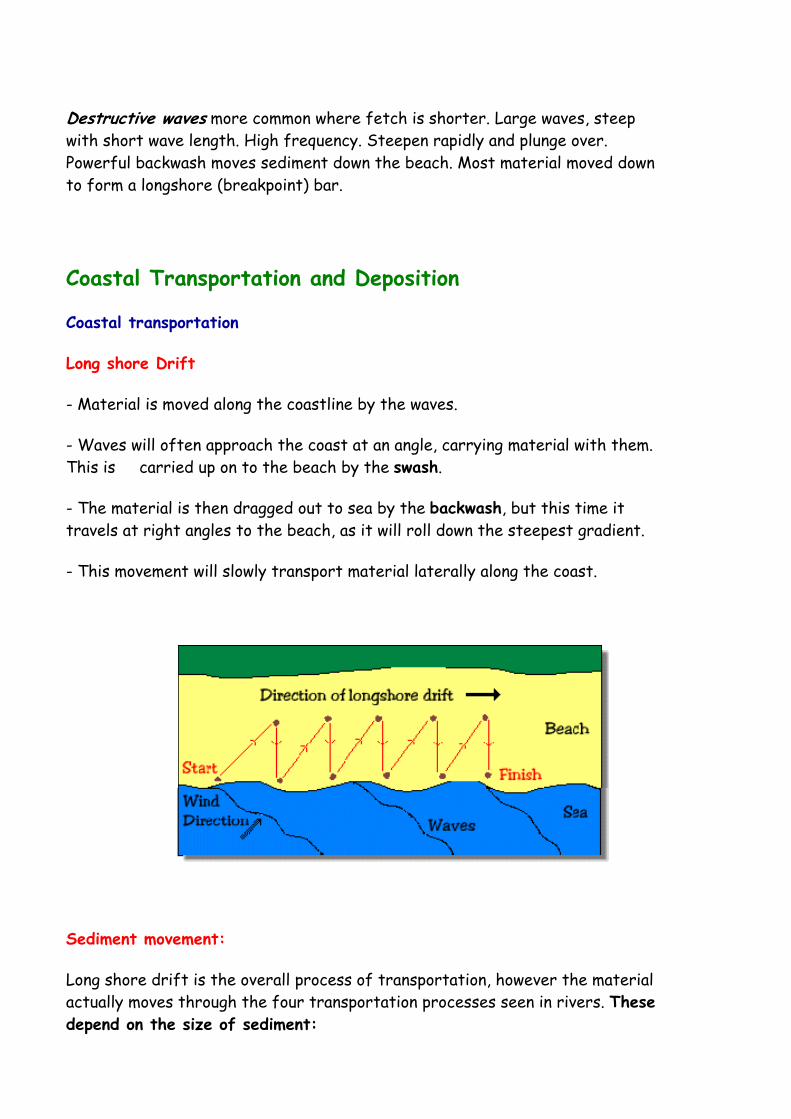
Long shore Drift
- Material is moved along the coastline by the waves.
- Waves will often approach the coast at an angle, carrying material with them. This is carried up on to the beach by the swash.
- The material is then dragged out to sea by the backwash, but this time it travels at right angles to the beach, as it will roll down the steepest gradient.
- This movement will slowly transport material laterally along the coast.
Sediment movement:
Long shore drift is the overall process of transportation, however the material actually moves through the four transportation processes seen in rivers. These depend on the size of sediment:

i) Traction – the rolling of large material along the sea floor by the waves.
ii) Saltation – the bouncing of slightly lighter material along the sea floor.
iii) Suspension – Small particles of material carried by the water.
iv) Solution – Material is dissolved and carried by the water.
Coastal Deposition:
- The process associated with constructive waves.
- Material is dropped by waves once they lose energy, either by rolling up a beach or where a river estuary causes a disruption to the normal movement of material along the coast.
- Creates features such as beaches, spits, bars and tombolos.
Coastal Erosion Features
Headlands and Bays
- Formed on discordant (rocks types perpendicular to coast eg Swanage Bay) coastline due to the softer rock being eroded quicker than the harder rock.
- Beaches form in the bays where the soft rock has been eroded away.
- Headlands of more resistant, hard rock are left behind.
Cliffs & Wave Cut Platforms
- Cliffs are formed when destructive waves attack the bottom of the rock face between high and low water mark.

- The area under attack is eroded using the major processes of coastal erosion.
- Points of weakness, such as faults and joints are attacked most, and eventually a wave-cut notch is gouged out.
- The rock above overhangs the notch, and as it is cut deeper into the rock, gravity causes the overhanging rock to collapse.
- The loose rocks are removed by the sea and transported along the coast by long shore drift.
- The whole process of undercutting the cliff begins again.
- As the cliff is eroded backwards it leaves behind a wave-cut platform, at the level of the low water mark.
- This platform is rarely eroded, as the waves energy is concentrated on eroding the area between the high and low water mark, and not the rock that is underneath them.
Caves, Arches, Stacks and Stumps
- Mainly seen on headlands.
- Waves start by attacking the main points of weakness in the rock: the joints and faults.
- A point of weakness is increased in size until it becomes a cave.
- The waves continue to attack the cave, which finally results in an arch being formed through the headland.

- The arch is attacked both by coastal erosion and sub-aerial erosion and finally the roof of the arch falls into the sea.
- This leaves behind a stack, which is then slowly eroded down to become a stump.
Coastal Depositional Features
Beaches
- Created by constructive waves depositing material (sand, shingle and pebbles) that has been transported from further along the coast.
- They lie between high and low watermark and are gently sloping, towards the sea.
- A constantly changing feature, beaches may be built up at certain times of the year, and eroded away at others, depending on the type of waves hitting them at the time. Often this change can be seasonal.
Spits
- A long, narrow ridge of sand attached at one end to the coast.
- Built up by long shore drift transporting material along the coast.
1. The waves erode FAULTS (cracks) in the headland.
2. The waves eventually erode through the headland to form an ARCH.
3. The arch becomes unsupported and collapses to form a STACK.
4. A STUMP is formed from the collapsed stack.
C DB A
1 23 4

- At a bend or break (for an estuary) in the coastline the material being carried is dropped. However it is deposited away from the coastline.
- As the spit builds out to sea the end is affected more by the wind and by wave currents, causing the end to curve towards the shore, to create a hook end.
- Material often accumulates in the area of standing water that occurs behind a spit, and this can lead to the formation of salt marshes.
- Spits can be areas where large sand dunes build up, nearer the back of it.
Bars
- A ridge of sand that blocks off a bay or river mouth. It will create a lagoon behind it is across a non-river bay.
Tombolos
- A bar of deposited material linking the mainland to an island. Coastal Management
As things like coastal tourism have become more frequent, humans have found it increasingly necessary to attempt to control the effects of the sea. The main reasons for coastal management are:
- to protect the coast from the erosive effects of the sea.
- to increase the amount of sand on the beach.
Many strategies have been tried around the world, and these can be divided into two main groups, hard and soft engineering. Hard engineering methods aim to stop the coastal processes from occurring. Soft engineering methods try to work with nature to protect the coast. Examples of these two strategies are:
Hard Engineering
Sea Walls:
Often built in front of seaside resorts.
- Very expensive.
- They aim to completely block the waves and their effects.
- Life span of approximately 75 years.
- Can cause the erosion of the beach in front of them.
- Socially reassuring for local residents.
Wooden Groynes:
- Wooden “fences” built at right angles to the coastline.
- They aim to stop the movement of material along the beach due to long shore drift.
- Their primary intention is to build up the amount of sand on the beach.
- They have a life span of approximately 25 years.
Gabion Groynes:
- Large steel mesh cages filled with large rocks.
- Aligned at right angles to the coastline.
- They aim to do a similar job to wooden groynes.
- Expected life span of 20 – 25 years, as the steel will rust.
Rip Rap / Rock Armour:
- Large boulders, of 10 tonnes or more, are used as a sea wall.
- The gaps between the rocks allow water through, which means that the energy of the waves is dissipated very effectively.
- It is important that the boulders are big enough to withstand being eroded themselves and therefore becoming part of the coastal system.
Soft Engineering
Beach Replenishment
- Sand is either brought in from elsewhere, or transported back along a beach, usually once a year.
- This is done using trucks, and is therefore very costly and time consuming.
- Over the next 12 months the material is washed along the coast by long shore drift, before being replaced again.

The final method of coastal management is of course to do nothing and allow the sea attack the coastline naturally.
Disadvantages of Coastal Management
Cost: - Most of the solutions detailed are very costly, and in many places questions are being asked as to whether they are actually worth the money.
Problems of disrupting the natural coastal system:
- Whenever you tamper with nature there are going to be knock on effects, which could, in time, become worse than the original problem.
- Coastal defence strategies are often very localised, and can cause problems further down the coast. One such example could be seen where groynes are used to trap sediment. Further down the coast there could be a reduction in the amount of material available to protect the coast there. This in turn would mean an increased amount of coastal erosion.

GGLLOOSSSSAARRYY CCOOAASSTTSS
Arch
When caves, which have developed on either side of a headland, join together they form a natural arch.
Attrition The process whereby rock particles wear down through collisions with other rock particles. This often occurs when pebbles are thrown against cliffs, boulders or other pebbles, causing them to shatter and break.
Backwash Water moves up a beach as a wave breaks. This is called the swash. The return movement of the water, back down the beach, is called the backwash.
Bar A bar is very similar to a spit. It is a ridge of sand or shingle which forms across the mouth of a river, the entrance to a bay or harbour. It is usually parallel to the coast.
Bay A wide indentation into the land by the sea, protected on each side by a headland. The water in a bay is usually relatively shallow; the wave action less strong than at the headlands.
Beach A gently sloping deposit of sand, pebbles or mud, deposited along the coast.
Blow hole A blow hole is formed when a joint between a sea cave and the land surface above the cave becomes enlarged and air can pass through it. As water flows into the cave, air is expelled through the pipe like joint, sometimes producing an impressive blast of air or spray which appears to emanate from the ground.
Cave A weakness, such as a joint, is enlarged by wave action, finally creating a cylindrical tunnel which follows the line of weakness. Caves developing back to back may give rise to arches and stacks.
Cliff A steep, and usually high, rock face found at the edge of the land where it meets the sea. Cliffs can be formed from most rocks, height generally increasing with hardness of rock.
Cliff Line
The margin of the land. The cliff line is identical to the coastline, but consists of cliffs rather than lower features such as dunes and beaches.

Coastline
The margin of the land. Where the margin consists of cliffs, it is known as the Cliff line
Constructive wave
When waves break at a rate of ten or less per minute each wave is able to run up the beach and drain back again before the next wave arrives. The swash is more powerful than the backwash so deposition can occur.
Corrasive action This is a form of wave erosion. Pebbles, boulders and rocks are thrown against the cliff face by breaking waves. This causes undercutting of the cliff and leads to the breakup of both the cliff and the objects being thrown against it.
Destructive wave When waves break at a rate of more than ten per minute each wave is able to run up the beach but unable to drain back again before the next wave arrives. Thus the backwash of the previous wave interferes with the swash, reducing it's efficiency. Such waves remove material from a beach and are destructive.
Estuary The mouth of a river where fresh water and sea water mix, and tides have an effect. Estuaries are often to be found on submerged coastlines, where a river valley has been flooded by the sea. See ria.
Fetch This distance of open water over which the wind can blow and form waves.
Headland Areas of harder rocks tend to resist the erosive powers of the sea. The resulting area of land, jutting out into the sea, is a headland. Bays are to be found between headlands.
Hydraulic action When a wave breaks against a cliff it causes air ,trapped within cracks, to suddenly become compressed. As the water retreats the air is allowed to expand, often explosively. Repeated expansion and contraction of the cracks leads to the break up of the surrounding rock.
Lagoon When a spit extends across the mouth of a river, to the extent that it causes the river to become diverted along the coast, an area of water is created separated from the sea by a narrow strip of land. This is a lagoon.
Load Solid matter carried by water, including material in solution, material suspended in the water, and larger material moved along the water / ground interface.
Longshore Drift

When waves break on to a beach at an angle, material is pushed up the beach at an angle by the swash, but pulled back down the beach by the backwash at ninety degrees to the coast. In consequence, material is slowly moved along the coast, in the direction of the waves. of the surrounding land may become islands. Plymouth Sound and Southampton Water are examples of rias in the United Kingdom.
Spit Longshore Drift transports material along the coast. When the mouth of a river, or an indented area, is encountered material starts to be deposited. The deposition begins where the coast changes direction and extends down coast in the direction of longshore drift. The result is a narrow ridge of material ( sand or pebbles ) attached to the mainland at one end and terminating in the sea. The spit may extend sufficiently to form a lagoon.
Stack When a natural arch collapses, the remaining upright sections form stacks, isolated rocks sticking up out of the sea.
Swash The movement of water in a breaking wave as it moves up the beach.
Tides The daily movements of the sea as it covers and exposes the area between the high tide and low tide marks. Tides are the result of lunar activity, and to a much lesser degree, winds and atmospheric pressure.
Tombolo A bar linking an island to the mainland.
Wave-cut Platform As cliffs become eroded down to beach level they appear to migrate inland. The remains of the former cliffs form a flat rock platform. This is known as a wave cut platform.
The factors vary over local, regional and international scales, giving a wide variety of types of farms. You can classify farms by:
• What they produce (arable - crops; pastoral - animals) • How intensive the land use is (intensive - market gardening in the Fens;
extensive - sheep farming in North Wales) • The economic status (commercial - wheat growing in East Anglia;
subsistence - the Papua New Guinea highland) • The land tenure (sedentary - owning a particular farm; nomadic - moving
around)
Farming as a System
Any farm can be viewed as a system, with inputs, throughputs (or processes), outputs and feedback. The diagram shows how these link together:
Inputs can be divided into two groups.
Physical inputs are naturally occurring things such as water, raw materials and the land.
Human or Cultural Inputs are things like money, labour, and skills.
Processes or Throughputs are the actions within the farm that allow the inputs to turn into outputs. Processes could include things such as milking, harvesting and shearing.
Outputs can be negative or positive, although they are usually the latter. Negative outputs include waste products and soil erosion. The positive outputs are the finished products, such as meat, milk and eggs, and the money gained from the sale of those products.
Feedback is what is put back into the system. The main two examples of this are money, from the sale of the outputs, and knowledge, gained from the whole manufacturing process. This knowledge could then be used to make the product better or improve the efficiency of the processes.

Factors Affecting Farm Type
Capital: Money is vitally important when setting up a farm, or trying to run one. Subsidies and government policies have helped in some cases but they have also meant that farming is having to become more efficient and technological to survive. As prices fall for farm products, so the farmer's profits also fall, meaning he can employ less people and buy less seeds and animals for the following year. It is a vicious downward trend experienced in many farming communities.
Choice: the farmer may have a number of choices over which type of farming he is going to follow. Normally this is determined by the climate, soils and the relief. However farmers are increasingly having to turn to farming crops or animals that will bring them the most money, rather than which ones may be best suited to the area.
Climate: One of the most important factors in deciding what type of farming might occur in a certain area. The important considerations for farmers are the hours of sunshine, the average temperature and the amount of rainfall.
Labour: Every farm needs workers, and so farms need these sources of labour. In the old days there would have been many people doing very labour intensive jobs around the farm. However, with farming becoming increasingly mechanised the numbers of people working on farms has diminished and many of those people tend to be more like farm managers rather than actually getting out and doing the dirty work.
Market: The market is very important for a farmer. He must know that he is going to be able to sell his produce at a good price, in order to make a profit. Quotas and subsidies have been brought in to try to help farmers as the prices of their produce have fallen over the last twenty years. Farmers increasingly have to decide exactly what they are going to grow by the price that they will get for their produce.
Politics: Government and International farming policies have had a huge impact on many farms around the world. In Europe the Common Agricultural Policy and EU regulations have meant that farmers are protected and that their produce will be bought. However they have also meant some farmers have had to completely change what they are growing to suit the new regulations.

Relief: The relief of the land is a very important factor in determining the type of agricultural activity that can take place on it. Flat, sheltered areas are usually best for crops as it is easy to use machinery and there will be the best climatic conditions for crop growth. Steep slopes are more likely to be used for sheep and cattle farming, such as in the valley of South Wales. However in countries such as Indonesia the steep slopes have been terraced to allow rice to grow.
Soils: Thick, well-irrigated, often alluvial (deposited by a river) soil is usually the best for crop farming. In Britain the best soil for arable farming can be found in Norfolk and other Eastern areas of the country. In hilly areas the soil tends to be thinner and less fertile, meaning it is more suitable for pasture farming.
Agricultural Policies and Change
In both MEDC’s and LEDC’s new ideas and regulations have been brought in to try to safe-guard farmers livelihoods and make farm production more efficient. Some of the methods used for this are outlined in this section:
TThhee EEuurrooppeeaann UUnniioonn
The European Union is made up of 15 member countries (Austria, Belgium, Denmark, Finland, France, Germany, Greece, Irish Republic, Italy, Luxembourg, Netherlands, Portugal, Spain, Sweden and the UK.). It began as a group of only 6 countries in 1957 and has expanded ever since. Border controls between the countries are virtually non-existent now, and trade is almost exclusively between the 15 countries.
The EU has brought in many rules and regulations to try and help farmers in all of its member countries. Not all of these have been as eagerly welcomed as they might have been.
The Common Agricultural Policy: This was a policy brought in by the EU in 1962 with a number of aims:
It aimed to increase agricultural production in member countries.
It aimed to improve the standard of living experienced by farmers.
It aimed to maintain prices and supplies of food at a reasonable cost to the consumers.

Some of the methods that it used included subsidies and minimum pricing. Farmers were encouraged to produce as much as they could, and the EU guaranteed that it would buy it all. This led to huge surpluses in butter, milk, cereals and even wine.
In 1992 the policy was reformed with far less subsidies and more concern for the natural environment. Some important aspects of the CAP are outlined below:
Minimum Pricing / Price Guarantees: The Common Agricultural Policy established minimum prices for agricultural produce that the farmer was guaranteed to receive. They also set prices lower than those of imports from outside the EU and bought up any products that were falling in price in an attempt to boost prices again. The idea was to allow the farmers to always get a reasonable price for their product.
Quotas: In 1992 the Common Agricultural Policy was reformed and one of the main things that was brought in was quotas. These set a limit on how much one farmer could produce of a single product, thus protecting the livelihoods of many farmers by continuing to guarantee their crops would be bought, whilst not building up the huge surpluses that occurred before.
Subsidies: Subsidies were given to farmers to allow them to produce more crops. However the intensive farming methods that most farmers employed led to many environmental problems such as hedgerow removal and increased use of pesticides and fertilisers.
The 1992 changes to the policy removed much of the subsidies and price support that the original policy had, as the EU realised that the intensive farming was harming the environment.
Surpluses: The original CAP didn’t limit how much each farmer could produce, it just bought all that they had. This rapidly led to the establishment of huge surpluses in many agricultural products, such as beef, butter, cereals, milk and wine. However in the 1992 reform of the policy they realised that this idea was not working and so introduced quotas.
PPrroobblleemmss ccaauusseedd bbyy aaggrriiccuullttuurree iinn MMEEDDCC’’ss
The Common Agricultural Policy, whilst guaranteeing to farmers that there would be someone to buy their produce also produced
some serious environmental problems. Farmers knew they could produce as much as they possibly could and it would definitely be bought so they tried to use every inch of their land, and often changed from pastoral farming to arable farming. This caused serious environmental problems.
Hedgerow removal: Between the end of the war in 1945 and 1995 over 60% of hedgerows in England and Wales were removed. Hedgerows are important wildlife habitats but they limit the amount of land a farmer can use, and many wanted to merge small pastoral fields into huge arable fields due to the increased money they could make from that form of farming.
The loss of hedgerows also increased the chance of soil erosion occurring as they sheltered the land from wind, helping the soil to bind together.
Pollution: The increased use of pesticides and fertilisers has led to air and water pollution. Chemicals used on the fields, are easily washed into rivers by rainwater and can seriously affect the fish, birds and plants of the river. They can also leach through the ground and into rivers. Fertilisers in water can cause rapid algae growth. This then can lead to the water being starved of oxygen so there is not enough for other plants, and especially fish. This process is called eutrophication.
Soil Erosion: The removal of hedgerows and the change from pasture to arable farming has led to many cases of increased soil erosion. The hedges protected the soil from wind erosion, and their removal created huge fields across which the wind could race. Arable crops do not bind the soil together as well as grass and so more soil was eroded by rainwater run-off.
Also the crops did not cover the ground all year round and when the fields were ploughed they were even more susceptible to rapid erosion, and flooding.
SSttrraatteeggiieess ffoorr aaggrriiccuullttuurree iinn LLEEDDCC’’ss
Food production is one of the most important industries in most LEDC’s and agriculture is often still their main source of employment.

As the population has increased, and with the environmental difficulties that many of these countries face, a number of strategies have been introduced. These have been aimed at helping the farmers become firstly self-sufficient and then begin to allow them to make a profit.
However it has not just been a case of the developed countries of the world throwing money at the problem, the solutions have had to be appropriate to the countries concerned.
Appropriate Technology: This involves small-scale projects that will help a community or maybe even individual subsistence farmers.
Ideas include digging wells to provide water for irrigation, setting up projects that can be easily maintained and sustained by the local people. They have not included bringing in large machines and expensive technology, as this can rarely be repaired when it goes wrong. The use of renewable energy sources, such as wind power and biogas has been encouraged rather than huge HEP schemes
All these things are aimed at being as well suited to a particular area of community as possible, whilst giving them as much help as possible.
The Green Revolution: This involved developing new high yield crops, initially in Mexico, which were then used in countries such as India. Their effect was to increase yields dramatically, and sometimes allow an extra crop each year to grown.
The farmers quickly produced greater amounts of crops and therefore produced larger profit, from which they could buy improved machinery. There were some disadvantages of the scheme however. The new seeds were very expensive to buy and required a lot of expensive fertilisers and pesticides to ensure that they grew properly. This meant that many of the poor farmers just couldn’t afford the new crops. Some farmers fell heavily into debt trying to finance buying the new crops.
Irrigation: The Green Revolution meant the need of massive irrigation schemes. Long series of canals took water to the fields. The canals were fairly cheap to set up but did cause problems of waterlogging and salinisation.
Some communities used deep wells instead of irrigation canals to water their crops, however this method could only really cater for a couple of hectares of land. With the Green Revolution came electric

HT
Pe
H
O
Ppw
O
ADTt
wateland
Hill FarminThe diagra
Physical Inexample, p
Human Inp
Other Inp
Processes processes which in tu
Outputs ar
Arable FaDistributioThe diagrathe UK:
er pumps, d.
ng Systemam below r
nputs are iploughing t
puts are th
uts are an
are thingsaffect th
urn means
re things w
rms on of Farmam below s
which allo
m represents
inputs whithe fields.
he worker
nything els
s which tae outputs. that more
which the
ms in the shows the
owed one w
s an examp
ich are con
s used on
se which c
ake place s. (Such as e sheep ca
farm prod
UK distributi
well to irri
ple of a hi
ntrolled by
the farm
annot be c
such as the burning ban be supp
duces (suc
ion of Ara
igate much
ill farm:
y nature o
(i.e. part t
classified
e shearingbracken wiported on a
ch as wool
able and H
h larger ar
or actions
time / full
in Human
g of the shll give a ria field).
from the
ill farms (
reas of
humans ta
l time).
or Physica
heep. Thesicher soil q
sheep).
(mainly she
ake. For
al inputs.
se quality
eep) in

Why Hill Farming? - Crops won't grow - Weather erodes slopes - Infertile water (few nutrients) - Rocky valley soil - Outcrops on hillside - Length of growing season short
Why Arable Farming? - Reasonably fertile soil (much fertiliser added) - Cold Winters - Warm Summers - Low Rainfall - Flat land
Rice Cultivation Rice is a cereal crop which grows in hot and wet conditions. It produces edible seeds (which can be eaten). Rice is the staple food for a high percentage of the world’s population. A third to a half of the people in the world eat rice as their main source of energy. High population density's usually grow and eat rice. (mostly South East Asia.
Conditions Necessary - A five month long growing season (hot 21 degrees c) - Fertile (often alluvial or volcanic soil) - Annual rainfall (over 120mm each month of the year) - Flat land - Underlying clay (to stop water draining away)
Cultivation & Harvesting Many jobs are done by hand in rice cultivation, they include: planting rice, harvesting, field levelling, building walls to separate fields, ploughing fields and creating river channels. This shows that rice cultivation is a very intensive task. Many people do jobs which would be done by machinery in the UK. It is not capital intensive as it does not have much machinery involved. The land is used to its maximum efficiency. The

c
Ftwg
TT
T
H
I
M
P
H
ttt
Q
"hu
A
P
cultivation
Fields are then plougwater to agrown, the
The GreenThe green
There are
Herbicides
Irrigation
Machinery
Pesticides
High Yield
the bullet to that shothe UK has
Question:
Agriculturhave studieuse."
Answer:
Physical fa
n is very la
levelled. Bhed and mnd from t
e fields are
n Revolutio revolution
five main
s are used
is used to
is used in
are used
Variety C
points belown. The es been use
ral Land Ued. Explai
actors:
and intensi
Bunds (smamanure is she fields. e drained
on n is summe
points wh
d to stop p
o water pla
n fields to
to stop pe
Crops are u
low show texample ofed.
Use is affen how phy
ive.
all earth mspread on Then riceand the cr
ed up in th
hich you ca
lants gett
ants in fie
plant and
ests eating
used (GM
the main pf Gilbert H
ected by mysical and h
mounds) arthem. Dra
e seedlingsrops are h
he diagram
an summar
ting diseas
lds which
harvest c
g crops
Crops)
points needHitchen's
many factohuman fac
re built toainage chas are plantharvested.
m below:
rise the Gr
ses
do not rec
crops
ded to ans Farm on t
ors. Choosctors have
o hold watennels are ted. Once .
reen Revol
ceive much
swer a quethe Chesh
e a pastor affected
er in. The then builtthe rice h
lution by:
h water
estion simiire Plain in
ral farm yo the land
field is t to take has
lar n
ou

• Flat land needed • Fertile soil • Suitable climate with enough rain and sunshine
Human factors:
• Transport - M6 is nearby • Markets - Manchester and Liverpool nearby • Government - enforces that 15% of the farm's land should be set aside. • Lack of profits through milk etc... because he does not have the money to
invest in quality control therefore he gets a lower price for the milk. This may lead him to diversification. Paint-balling, bike-racing, opening for tourists, caravan sites, bed and breakfasts, or complete conversion of farm land into a golf course for example...

GGLLOOSSSSAARRYY
agribusiness - the organisation of a farm as a business arable farm - one that grows crops cash crop - a crop that is grown for sale cereal crop - grain crop e.g. wheat Common Agricultural Policy (CAP) - the European Union's farming policy that looks after the farmers in Europe crofting - part time farming found in the north of Scotland crop rotation - the swapping around of crops to help look after the soil diversification - branching out into a different way of earning money extensive farm - one that has few inputs for its area e.g. hill sheep farming factory farming - the very intensive rearing of animals, often indoors e.g. chickens fodder crops - crops that are grown for animals to eat horticulture - is growing flowers, fruit and vegetables inputs - these are needed in order to farm e.g. land, workers, equipment Intensive farm - one that has high inputs for its area e.g. a market garden market gardening - a small farm in which the produce is sent directly to market e.g. flowers, vegetables mixed farm - one that grows crops and keeps animals organic farming - one that does not use artificial chemicals outputs - what the farmer produces e.g. wheat, potatoes, milk pastoral land - land that is left as grass for the animal to eat permanent pasture - land that is always used as pasture rough grazing - poor quality grazing land

Drainage Basin
Processes of erosion and transportantion in a river Attrition – material is moved along the river bed. It collides with other material and breaks into smaller pieces Corrasion – Fine material rubs against the river bank. The bank is worn away and collapses Corrosion – Some rocks forming the banks ands bed of a river are dissolved by acids in the water Hydraulic action – The sheer force of water hitting the river banks Traction – large rocks and boulders are rolled along the river bed Saltation – smaller stones are bounced along the river bed in a leap-frogging motion Suspension – Fine material, light enough to be carried by the river.

Solution – dissolved material transported by the river
What landforms are created in the Upper Course?
1 - Interlocking Spurs (Oblique Front View)
Interlocking spurs are alternate hills in the river valley. The river does not have a high water volume at this point and even though it is fast flowing, the river cannot laterally erode (sideways) to remove the spurs. Because of this, the river has to flow around the spurs, eroding vertically.
2 - Waterfall and Gorge (1) (Oblique Front View)

In the Upper Course, the river is not only eroding vertically (down) but towards its source (HEADWARD EROSION). This means the feature shown in the diagram above is created. The river erodes the softer rock underneath the harder rock on top faster, and this means the level of the land along the river's course becomes lower over time and the waterfall retreats back towards the source. Successive positions of the waterfall are shown on the diagram. The movement backwards leaves a second feature called a GORGE.
2 - Waterfall and Gorge (2) (Side View) Looking at a side view, the process becomes clearer. Splash back from the falling water erodes away the softer rock faster, leaving the hard rock without support and it collapses into the plunge pool. The process then repeats itself, with the waterfall further towards the source of the river.
What landforms are created in the middle course?
1 - Meanders (1) (Aerial View)

Meanders are created by the lateral erosion that the river undertakes in this part of its journey to the sea. Water flows around the bend in the river and as it does so, it swings to the outside of the bend (at X on the above diagram - imagine it like a bobsleigh swinging to the outside of a snow run) - this means the fastest flowing and highest volume of water is concentrated on the outside of the bend causing it to erode the bank at this point. On the inside of the bend (point Y on the above diagram), the flow is extremely slow and because of this lack of energy, the river is depositing.
What is a meander? Meanders are simply bends in a river's course. They usually occur in the middle and lower course of a river and because of the way they affect the structure of the water velocity in the river channel, meanders create specific features. The main two are slip-off slope and river cliff. Slip-off slopes are features of deposition. They are formed on the inside of a meander where the velocity is slowest. The current swings to the outside of the bend (like a toboggan). The river cliff is formed on the outside of the bend where the current is at its fastest. The current erodes (undercuts) the river bank and this collapses, leaving a vertical slope.

1(
Trcclaola
2(
1 - MeandSide View
This crossriver. At pcreating a creates a laterally (son the benateral ero
2 - Ox-BoAerial Vie
ders (2) w of Cross-
-section doint X, th landform landform csideways and). This cosion is abl
ow Lakes ew)
-Section X
diagram clee river's f known as called a SLand downcoreates a lale to remo
(1)
X-Y)
early showflow is cona RIVER CLIP-OFF Sourse, as targe FLOOove the In
ws what is ncentratedCLIFF. OnSLOPE. Ththe river fODPLAIN terlocking
happeningd on the en the insidehe river is flow is con in the rivg Spurs.
g at the beeroding thee, the dep thereforencentrateder valley,
end of a e bank, position e eroding d forwardas the
ds

2 - Ox-Bow Lakes (2) (Aerial View)
Ox-Bow lakes are created by the processes at work in a river meander where two River Cliffs are eroding towards each other. Eventually, this will breach and the water will flow along the straightened course. In the river bend, the water stops flowing, and this loss of energy means the river deposits its load - this creates 'plugs' at both ends of the meander and creates a lake. This lake will silt up and evaporate away to leave an 'impression' of a meander on the landscape.
In the Lower Course (Old Age or Plain Stage) , the river slows down as the gradient is almost flat. The river is no longer able to erode and therefore deposits its load and landforms in this course are features of deposition. The volume is the largest on the river's course. This part of a river is liable to flood.
What landforms are created in the lower course?

1 - Leveés and Raised Beds (1) (Front View)
1 - Leveés and Raised Beds (2)
(Front View)
In the winter, when the river volume is at its highest, the river is prone to flooding. As the river overflows its banks, friction with the floodplain slows down the flow. The loss of energy means load is deposited. The deposition is graded - this means that the larger particles are dropped first (being the heaviest) near the river bank edge and the smaller particles are taken further along the floodplain. The larger particles build up over repeated flooding to create a leveé, which increases the capacity of the river. However, in the summer when the river volume and energy is at its lowest, deposition occurs in the river channel, raising the bed. This means that the capacity of the river is lowered and flooding again will occur in the winter months, creating bigger leveés. This cycle raises the river higher than the landscape over time.
3 - Delta (Aerial View)

Deltas are formed when the river meets the sea. The sea does not flow, so the
river suddenly stops upon meeting the sea and loses its energy to carry load. The
load is then deposited on the sea bed and over time, this builds up to form a new
piece of land in the river mouth. The river then has to divert its flow into smaller
'distributaries' to reach the sea again. When it does so, more load is deposited
and this builds the new delta out into the sea.
For a delta to survive, the river must bring a constant supply of material to
deposit on the delta or it will be eroded away by the sea. Many human-made dams
on rivers stop silt getting to deltas in this way.
How does a river flood?
A flood is simply when a river overflows because the amount of water in the channel is too much for the river to carry. This causes the water to flow out of the channel and over the surrounding land. It is actually a very important natural event, which is necessary for the adding of fertile material to farmland, but is perceived as a nuisance which causes damage to human property.

Flooding risk is measured in MAGNITUDES (amount) and FREQUENCIES (how often) and usually floods fall into categories such as high frequency - low magnitude (happening often, but only small) or low frequency - high magnitude (don't happen often, but are major floods when they do) events. The diagrams below are designed to show the terminology and stages associated with a flooding event and occur in the Lower Course.
1
This is a river in a normal flow. You can see that the water is contained within the channel in the lower course. The terminology associated with this stage is:
2
More water has entered the river, increasing the discharge. Heavy rainfall, snowmelt or other event has increased the flow. You can see that the river is now at its fullest level or BANKFULL capacity, rather like filling a glass to the brim. This is the maximum amount of water that the river can carry. Any more and the flood will take place.
3 Even more water has entered the channel and the river is unable to discharge the amount of water successfully. The water overspills the levées and a flood

occurs, where load is dropped onto the floodplain. This load raises the levées and grades the floodplain. The load dropped is called SILT or ALLUVIUM, and makes the floodplain a fertile place for agriculture.
FLOODING
Case study – MISSISSIPPI
In the summer of 1993, the Mississippi River in the USA burst its banks.
• 150 levees (embankments) collapsed under the pressure of water. • Dams burst and bridges were closed. By mid July 100 tributaries had
flooded and the Mississippi spread across the flood plain for 10 - 25 kilometres.
The effects of the flood were:
• 48 people were killed. • Nine states were affected. Floodwater stretched from Memphis in the
south to Minneapolis in the north - covering 23 million acres. • 26.5 million sandbags were used. • Almost 70,000 people were evacuated from their homes. • Final damage costs were estimated at $10 billion. Over 25% of this was
crop losses. • Some areas never recovered. The town of Valmeyer, Illinois, was
abandoned after the floods and rebuilt on higher ground. • The river was closed to traffic for two months - 15% of the USA's
freight uses the Mississippi.
Exam tip
A typical exam question that uses this case study would be Describe the effects on people of a flood event you have studied. Make sure you name the place (river), country and date of the event.
The influences of nature and people
The climatic conditions leading up to the flood
• From April and all through the summer, record heavy rain fell across the north part of the Mississippi drainage basin. This was partly caused by high pressure system around Bermuda.
• Thunderstorms brought torrential rain in June and July adding to the rising waters. Rainfall in these two months was the highest since 1895.
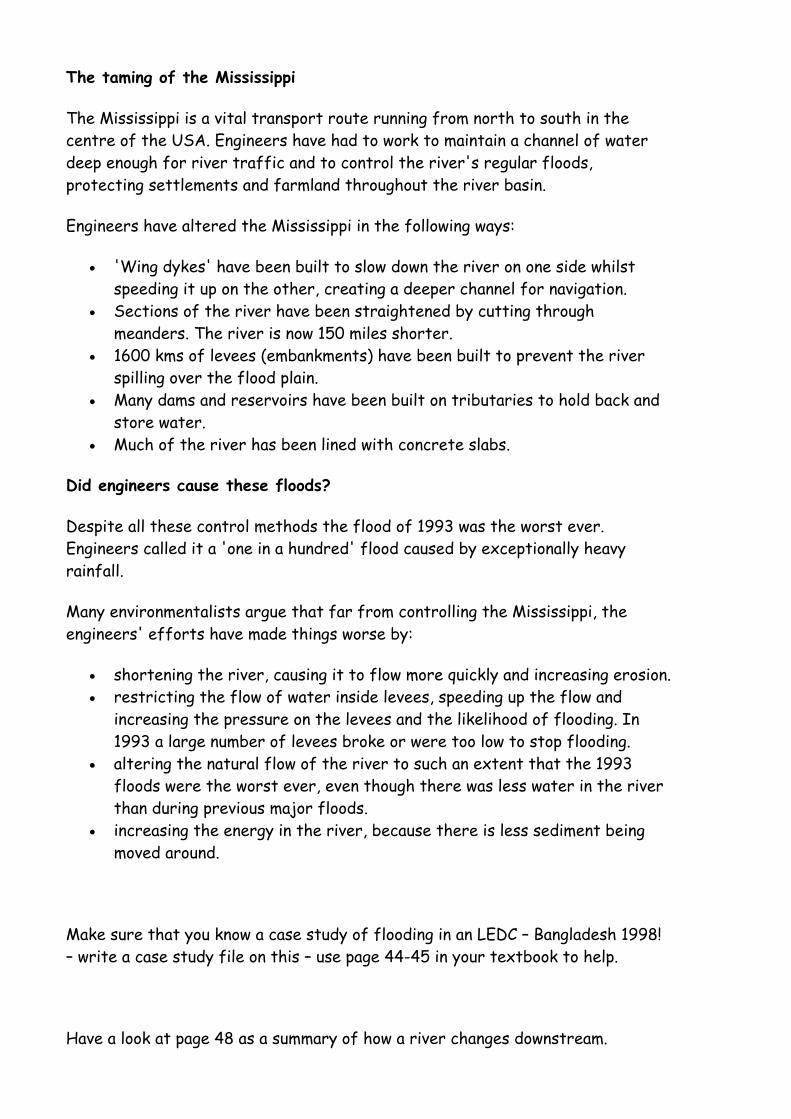
The taming of the Mississippi
The Mississippi is a vital transport route running from north to south in the centre of the USA. Engineers have had to work to maintain a channel of water deep enough for river traffic and to control the river's regular floods, protecting settlements and farmland throughout the river basin.
Engineers have altered the Mississippi in the following ways:
• 'Wing dykes' have been built to slow down the river on one side whilst speeding it up on the other, creating a deeper channel for navigation.
• Sections of the river have been straightened by cutting through meanders. The river is now 150 miles shorter.
• 1600 kms of levees (embankments) have been built to prevent the river spilling over the flood plain.
• Many dams and reservoirs have been built on tributaries to hold back and store water.
• Much of the river has been lined with concrete slabs.
Did engineers cause these floods?
Despite all these control methods the flood of 1993 was the worst ever. Engineers called it a 'one in a hundred' flood caused by exceptionally heavy rainfall.
Many environmentalists argue that far from controlling the Mississippi, the engineers' efforts have made things worse by:
• shortening the river, causing it to flow more quickly and increasing erosion. • restricting the flow of water inside levees, speeding up the flow and
increasing the pressure on the levees and the likelihood of flooding. In 1993 a large number of levees broke or were too low to stop flooding.
• altering the natural flow of the river to such an extent that the 1993 floods were the worst ever, even though there was less water in the river than during previous major floods.
• increasing the energy in the river, because there is less sediment being moved around.
Make sure that you know a case study of flooding in an LEDC – Bangladesh 1998! – write a case study file on this – use page 44-45 in your textbook to help.
Have a look at page 48 as a summary of how a river changes downstream.

Exam Tip: photocopy page 48 and cut up. See if you can put back together (Without using the textbook obviously!)
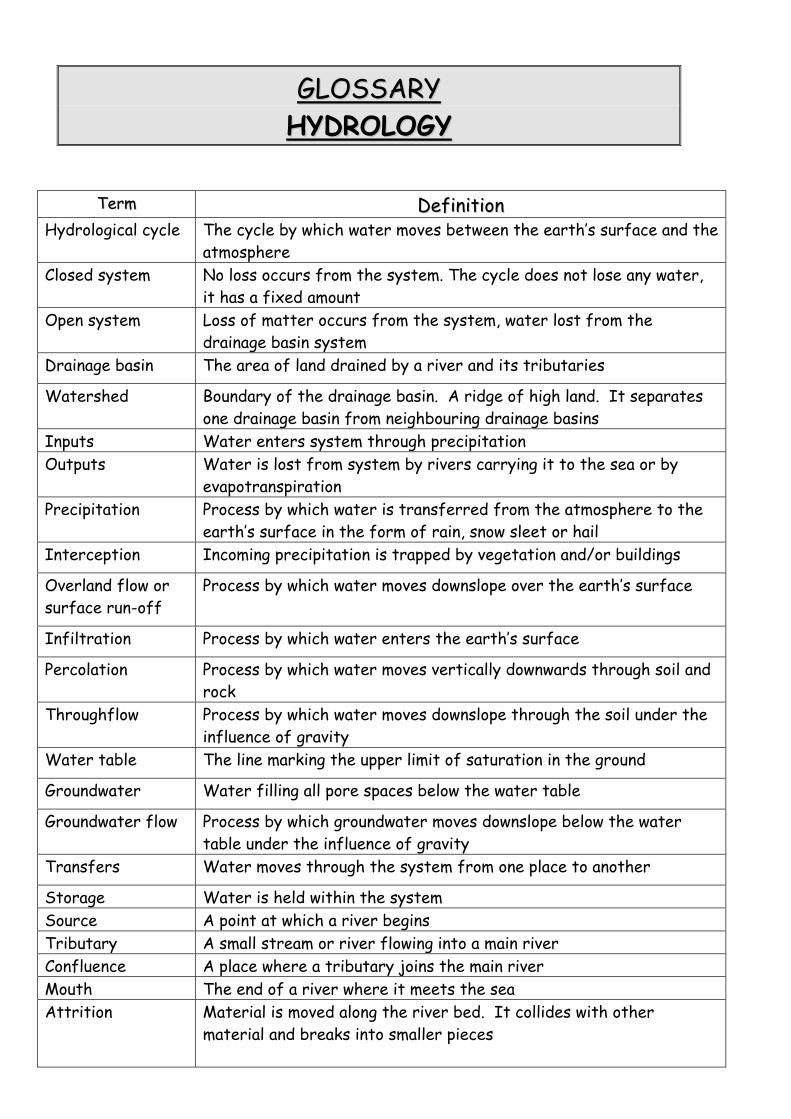
GGLLOOSSSSAARRYY HHYYDDRROOLLOOGGYY
TTeerrmm DDeeffiinniittiioonn Hydrological cycle The cycle by which water moves between the earth’s surface and the
atmosphere Closed system
No loss occurs from the system. The cycle does not lose any water, it has a fixed amount
Open system Loss of matter occurs from the system, water lost from the drainage basin system
Drainage basin The area of land drained by a river and its tributaries
Watershed
Boundary of the drainage basin. A ridge of high land. It separates one drainage basin from neighbouring drainage basins
Inputs Water enters system through precipitation Outputs Water is lost from system by rivers carrying it to the sea or by
evapotranspiration Precipitation Process by which water is transferred from the atmosphere to the
earth’s surface in the form of rain, snow sleet or hail Interception Incoming precipitation is trapped by vegetation and/or buildings
Overland flow or surface run-off
Process by which water moves downslope over the earth’s surface
Infiltration Process by which water enters the earth’s surface
Percolation Process by which water moves vertically downwards through soil and rock
Throughflow Process by which water moves downslope through the soil under the influence of gravity
Water table The line marking the upper limit of saturation in the ground
Groundwater Water filling all pore spaces below the water table
Groundwater flow Process by which groundwater moves downslope below the water table under the influence of gravity
Transfers Water moves through the system from one place to another
Storage Water is held within the system Source A point at which a river begins Tributary A small stream or river flowing into a main river Confluence A place where a tributary joins the main river Mouth The end of a river where it meets the sea Attrition
Material is moved along the river bed. It collides with other material and breaks into smaller pieces

Corrasion Fine material rubs against the river bank. The bank is worn away and collapses
Corrosion
Some rocks forming the banks ands bed of a river are dissolved by acids in the water
Hydraulic action The sheer force of water hitting the river banks Traction Large rocks and boulders are rolled along the river bed Saltation
Smaller stones are bounced along the river bed in a leap-frogging motion
Suspension Fine material, light enough to be carried by the river Solution Dissolved material transported by the river Meander Sweeping curve in the course of a river Oxbow lake Curved lake found on the flood plain of a river. Caused by the loops
of meanders being cut off at times of flood and the river subsequently adopting a shorter course
Lateral erosion Erosion that occurs sideways instead of vertically
LLeevveeeess Naturally formed raised bank along the side of river channel
Flood plain Area that suffers periodic flooding along the course of the river. Delta Feature composed of silt formed when sediment is deposited at the
mouth of the river, caused by the slowing of the water on entering the sea.
Distributary River that has branched away from a main river. Aquifer A rock which stores significant amounts of groundwater in its pore
spaces Evaporation Process by which water is transferred from the earth’s surface to
the atmosphere Transpiration Process by which water is transferred from vegetation to the
atmosphere via stomata on leaves Evapotranspiration The total output of water vapour from the drainage basin system to
the atmosphere through the combined processes of evaporation and transpiration
Storm hydrograph Graph showing discharge against time following a single precipitation event. Comprises of a rising limb and a recession limb
Lag time The time between peak precipitation and peak discharge River discharge The volume of water passing a given point at a given time. Calculated
by multiplying cross-sectional area by average velocity. Expressed in cumecs (m/s3)
Suspended load Solid particles carried within the current, but not touching the bed Bedload The coarser material carried along the bed of a stream by the force
of the water.

What is the economic north / south?
The terms 'Economic North' (or MEDC - More Economically Developed Country)
and 'Economic South' (or LEDC - Less Economically Developed Country) refer to
the northern countries being richer and the southern countries being poorer.
1 - Population Density The amount of people per square kilometre (p / km2). The higher the number, the more developed an area is supposed to be.
2 - Birth Rate The amount of babies born per thousand of the population per year (B. R. / 1000). The higher this is, the less developed a country is supposed to be.
3 - Death Rate The amount of deaths per thousand of the population per year (D. R. / 1000). The higher this figure is, the less developed a country is supposed to be.
4 - Urbanisation The percentage of the population that lives in urban areas (%). The higher the figure, the more developed a country is supposed to be.
5 - Agricultural Percentage The amount of the working population that works in agriculture. The higher the figure, the less developed the country.
6 - Life Expectancy This is the average age to which everyone in a country is supposed to live. It is measured in 'years'. The higher the figure, the more developed a country is supposed to be.
7 - Health This is measured in population per doctor. The higher the number is, the less doctors there are and therefore the less developed the country is.
8 - Education The amount of children who go to primary and secondary schools (%). The less the numbers are, the less developed the country is likely to be.
9 - G. D. P. (Gross Domestic Product) /G. N. P. (Gross National Product) This is a measure of the average amount of income of a person in a country and the amount the country itself earns. It is measured in US $. The higher these figures, the more developed a country is.
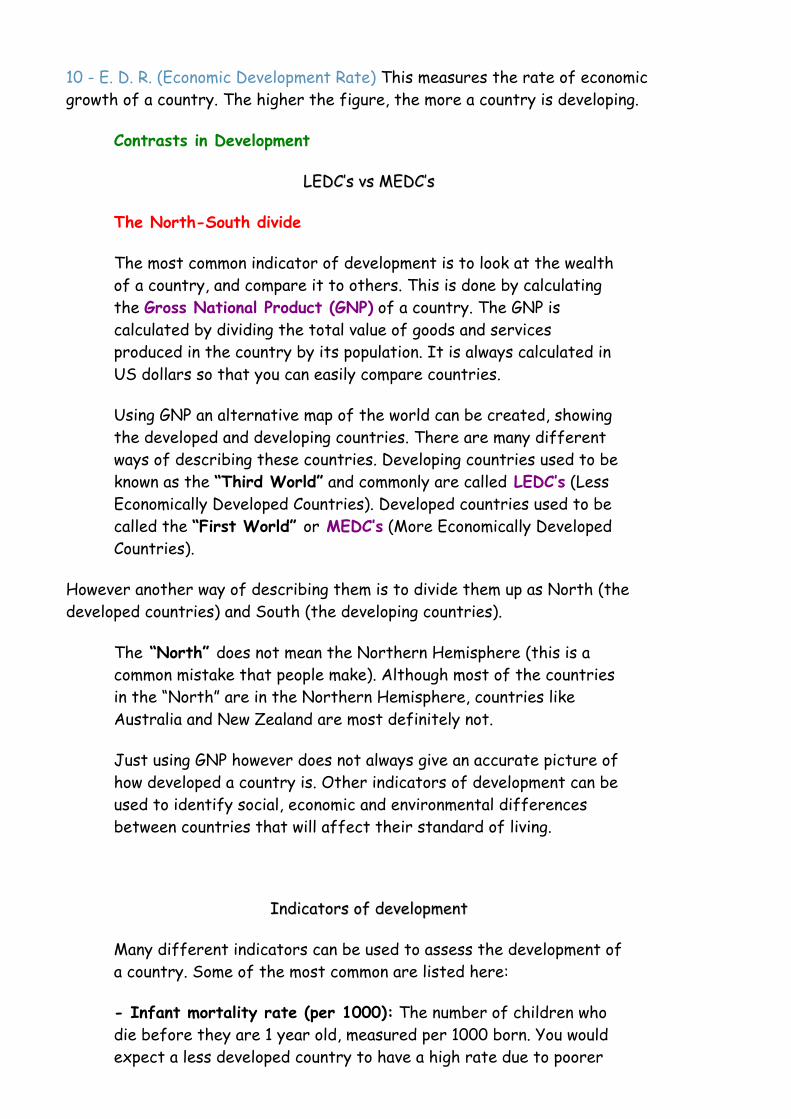
10 - E. D. R. (Economic Development Rate) This measures the rate of economic growth of a country. The higher the figure, the more a country is developing.
Contrasts in Development
LLEEDDCC’’ss vvss MMEEDDCC’’ss
The North-South divide
The most common indicator of development is to look at the wealth of a country, and compare it to others. This is done by calculating the Gross National Product (GNP) of a country. The GNP is calculated by dividing the total value of goods and services produced in the country by its population. It is always calculated in US dollars so that you can easily compare countries.
Using GNP an alternative map of the world can be created, showing the developed and developing countries. There are many different ways of describing these countries. Developing countries used to be known as the “Third World” and commonly are called LEDC’s (Less Economically Developed Countries). Developed countries used to be called the “First World” or MEDC’s (More Economically Developed Countries).
However another way of describing them is to divide them up as North (the developed countries) and South (the developing countries).
The “North” does not mean the Northern Hemisphere (this is a common mistake that people make). Although most of the countries in the “North” are in the Northern Hemisphere, countries like Australia and New Zealand are most definitely not.
Just using GNP however does not always give an accurate picture of how developed a country is. Other indicators of development can be used to identify social, economic and environmental differences between countries that will affect their standard of living.
IInnddiiccaattoorrss ooff ddeevveellooppmmeenntt
Many different indicators can be used to assess the development of a country. Some of the most common are listed here:
- Infant mortality rate (per 1000): The number of children who die before they are 1 year old, measured per 1000 born. You would expect a less developed country to have a high rate due to poorer
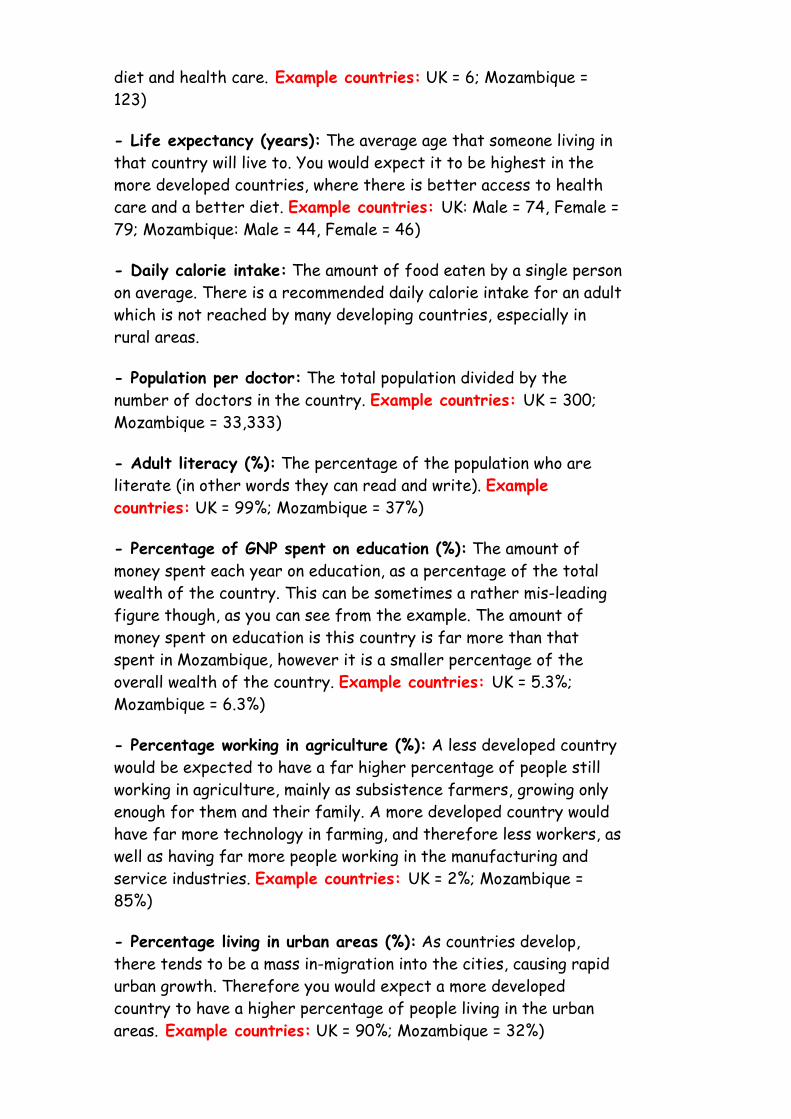
diet and health care. Example countries: UK = 6; Mozambique = 123)
- Life expectancy (years): The average age that someone living in that country will live to. You would expect it to be highest in the more developed countries, where there is better access to health care and a better diet. Example countries: UK: Male = 74, Female = 79; Mozambique: Male = 44, Female = 46)
- Daily calorie intake: The amount of food eaten by a single person on average. There is a recommended daily calorie intake for an adult which is not reached by many developing countries, especially in rural areas.
- Population per doctor: The total population divided by the number of doctors in the country. Example countries: UK = 300; Mozambique = 33,333)
- Adult literacy (%): The percentage of the population who are literate (in other words they can read and write). Example countries: UK = 99%; Mozambique = 37%)
- Percentage of GNP spent on education (%): The amount of money spent each year on education, as a percentage of the total wealth of the country. This can be sometimes a rather mis-leading figure though, as you can see from the example. The amount of money spent on education is this country is far more than that spent in Mozambique, however it is a smaller percentage of the overall wealth of the country. Example countries: UK = 5.3%; Mozambique = 6.3%)
- Percentage working in agriculture (%): A less developed country would be expected to have a far higher percentage of people still working in agriculture, mainly as subsistence farmers, growing only enough for them and their family. A more developed country would have far more technology in farming, and therefore less workers, as well as having far more people working in the manufacturing and service industries. Example countries: UK = 2%; Mozambique = 85%)
- Percentage living in urban areas (%): As countries develop, there tends to be a mass in-migration into the cities, causing rapid urban growth. Therefore you would expect a more developed country to have a higher percentage of people living in the urban areas. Example countries: UK = 90%; Mozambique = 32%)
- Access to clean water (%): In Britain, we take clean, safe water for granted, but that is not the case in many of the less developed countries of the world. This can lead to outbreaks of diseases such as cholera, dysentry and typhoid.
The Human Development Index:
The Human Development Index was devised by the United Nations in 1990 and uses a number of indicators of development to give each country in the world a development score. The score ranges from 0 to 1, with 1 being the most developed. No country has reached a score of 1, although some, such as Japan and Canada have attained marks well over 0.9.
The indicators of development used in the index are:
- Literacy Rate
- Life Expectancy
- The GNP per person, adjusted to take into account the cost of living in that country.
The HDI is a more effective measure than just using GDP, as it brings in social considerations also. However it still has problems because it does not show any of the regional differences within a country.
Scatter graphs:
It is easy to compare two different indicators of development, using the figures for a number of different countries to plot a scatter graph. Scatter graphs show whether there is any connection between the two sets of figures. This is called a correlation and it can be either positive or negative.
- A positive correlation slopes up from the left axis to the top right hand corner of the graph. This tells us that if one of the indicators increases, for instance the GNP, then the other (literacy rate perhaps) will also increase.
- A negative correlation slopes from the left axis down towards the right of the graph. This tells us that if one indicator increases, for instance the number of people per doctor, the other indicator will fall (in this case the life expectancy).
Environmental Hazards
Although there are many problems faced by the developing countries of the world, the two areas that are of most concern are food and water supply, as well as diseases.
Natural hazards such as earthquakes, volcanoes and floods also pose great threats to the developing world, as they often do not have the resources to cope with such disasters.
FFoooodd aanndd wwaatteerr ssuupppplliieess
Water: Water is essential for life and yet nearly one third of the population of the world do not have access to safe drinking water. Despite not being clean, this water is used, and so contaminated water contributes to many of the devastating diseases that are outlined in the next section.
It is often the rural areas of these countries that lack the clean water, and they are usually the areas furthest away from medical help if people contract diseases.
Aid agencies have establishing safe water resources as one of their primary targets when they give aid to a country.
Food: Food shortages are also common throughout the developing world. In particular are the countries of Africa such as Ethiopia and Sudan, where droughts wrecked the harvest and caused millions to die of starvation.
DDiisseeaasseess
There are many life threatening diseases that affect huge numbers of people in the developing world. Three of the most common are:
Bilharzia: Threatens over half a billion people in the world. Transmitted in stagnant water by parasitic worms which originate from human waste and then grow within bilharzia snails before seeking a human host. They break the skin and enter the bloodsteam. The worms lay eggs within the human causing many internal problems, especially in the bladder.
Cholera: It is prevalent in unsanitary conditions and is caught by drinking water or eating food contaminated by the waste of people carrying the disease. The wastes contain the infective bacillus part

of the disease, which causes diarrhoea, vomiting and cramps. All can lead to death through the loss of many vital body fluids.
Malaria: A disease carried by mosquitoes which threatens 40% of the population of the world. The main areas where malaria is found is in Central and South America (the Amazon Rainforest only); central and southern Africa: India and South-east Asia. Parasites are transmitted to the human’s bloodstream during a mosquito bite. These live in the persons liver destroying blood cells, causing fever, and even death!
NNaattuurraall hhaazzaarrddss
Earthquakes and Volcanoes: Natural hazards such as earthquakes and volcanoes have a devastating effect on developing countries, as they tend not to have the resources available to cope with such disasters. Buildings are easily knocked down, medical services are poor and rescue efforts often come too late, especially to remote areas. A weak earthquake in a developing country can cause far more damage and destruction than a more powerful one in a developed country.
Floods: Early in 2000, the world saw how torrential rains and tropical storms could cause wide-spread and devastating flooding in a developing country: Mozambique. The flood waters rose so quickly that many people were stranded, forced to clamber into trees and wait to be rescued. But, as in many developing countries facing such a disaster, the country itself did not have the resources to cope.
International aid from countries such as South Africa (helicopters) and Britain (food, medicines and clothes) was required to try to help them get through the disaster.
Drought: Droughts reduce or destroy harvests and mean that water supply is severely limited. Countries in Africa, such as Ethiopia, have been badly affected by droughts, with hundreds of thousands of people dying from starvation or thirst.
However in developed countries the technology is available to enable water to be brought in from other parts of the country. Consequently when California experienced a three-year drought in the mid-1990’s there were no serious problems.
Interdependence
Interdependence means that LEDC’s and MEDC’s actually rely on each other, and without one the other would not be able to survive.
For this reason it is in both sets of countries interests to trade freely with each other. However it is also the case that the developed countries of the world rather like their position as world leaders and so they use trade to keep the developing countries in a position that does not threaten them too much.
TThhee bbaallaannccee ooff ttrraaddee
There is a balance of trade between the countries of the developed North and the developing South. However not everyone agrees that it is particularly fair.
The developing countries of the world tend to have most of the raw materials that the developed countries need. However the developing countries do not have the technology or finances to process these raw materials and so sell them to the developed countries who can process them.
Often the products produced are then sold back to the developing countries for a far higher price than the original raw materials were sold for.
Every country imports and exports. This is their own trade balance. Developed countries tend to earn more money from their exports than they spend on imports, meaning they have a trade surplus and will become richer. Many developing countries import more than they export, meaning they have a trade deficit and so become poorer, and fall greater into debt.
The biggest single problem for developing countries is the debts that they have, especially as there are interest payments on them. That is why many people have been calling for the debts to be written off to allow these countries a real chance to spend their money on becoming more developed. The chances of it occurring appear minimal though because that would mean the developed countries losing their economic control over the developed countries.
Aid
Aid is given by donor countries to recipient countries to help their development, or help them recover from a natural disaster.
The aid takes many forms and can be given on a large scale or small scale. Large scale aid is called top-down aid as it is usually given to the government of the developing country so that they can spend it on the projects that they need.
Unfortunately this can lead to the mis-use of aid money by unscrupulous governments. Aid from developing country governments tends to be given as top-down aid.
Small scale aid projects are called bottom-up aid. These target the people most in need of the aid and help them directly, without any government interference. Aid from charities tends to be bottom-up aid.
There are five main types of aid that can be given to developing countries, and these are outlined below:
TThhee ddiiffffeerreenntt ttyyppeess ooff aaiidd
Bilateral Aid: See conditional aid.
Charities (Non-Governmental Organisations): Charities such as Oxfam, Comic Relief and Save the Children raise huge amounts of money for projects in developing countries. They mainly get their money from the general publics generosity, however they also receive government grants.
The charities tend to target small scale community-based projects to fund. They realise that in this way their money is going directly to the people who most need it.
The charities are also the ones who often are quickest on the scene with short term aid after a natural disaster such as a famine or flood.
Conditional Aid: Conditional aid is given by a donor country (MEDC) to a receptor country (LEDC) to finance projects in that country. In return the receptor country usually has to agree to buy other products from the from the donor country.
- A good example was the building of the Aswan dam in Egypt. The Russians gave the Egyptians money to help build the dam, in return for Egypt allowing them unlimited access to its airfields.
The project began in the 1950’s and General Nassua eventually told the Russians to leave after the six day war in 1967.

- In 1994 the British Government came under fire as details of a supposed conditional aid package reached the public. The scheme involved Britain giving £234 million worth of aid to help the Malaysian Government build their Pergau hydro-electric dam scheme.
However it then emerged that this aid was linked to £1.3 billion of British defence contracts with Malaysia. Similar claims were made about defence contracts and aid money given to Indonesia.
Long-term Aid: Long term aid aims to help the country develop in the future, by introducing schemes to help things like health care, education and food production. Many of the NGO’s are involved in these long term schemes, which can be large scale or small scale projects.
The main aim of the schemes is to introduce ideas and thinking that can be easily sustained by the local community, with only the help of the NGO to set them up in the first place.
Many of the schemes introduced by Comic Relief into countries like Burkina Faso and Ethiopia are examples of long term sustainable aid.
Multilateral Aid: This form of aid involves the developed countries giving money to central international organisations such as the World Bank and the World Health Organisation. These then decide where and when the money is going to be spent. In the case of the World Bank this money is still a loan, that will need to be paid back, whilst other organisations act more like charities.
It is this form of aid that the Brandt Report suggested each country should give 0.7% of its GNP towards. However most countries do not get close to reaching that target.
Short-term Aid: Also known as emergency aid, this is the aid that you will have seen on the news. Charities and governments send short term aid after a natural disaster to help the country recover.
Two recent examples include the famines in Africa for which food, medicine and shelters were quickly sent over to countries such as Ethiopia and Sudan. Then there were the terrible floods in Mozambique in early 2000, which led to food, medicine, clothes and shelters being sent over, as well as South African helicopters being used to pluck people from the flood waters.
Tied Aid: See conditional aid.

The main disadvantage of all forms of aid is that many developing countries have become dependent upon it for their survival.
This has led to some developing countries calling aid an “economic colonialism” where the developed countries have a tight hold over the development of the developing countries. The massive debts that many of them have only increase this dependency on aid form the developed countries.
Case study Ethiopia:
Last year Ethiopia could feed itself was 1982.
Famine at greatest in 1984. Natural cause was drought – years of lower than average rain, rains failed in 83/84. Civil war worsened proble.
500, 000 died in 1984
nearly £15million was rasied in 1984 in Britain alone by the UK Disasters Emergency Committee. Nearky wall was food aid.
From 1984-1992 the Ethiopian Famine Relief Fund, consisting of Band Aid and Live Aid, raised £110 million.
1990s – continued need for relief. Drought not gone away and high birth rate! Half population still live in poverty and malnutrition major problem.
Some NGOS (non-governmental organisations) are setting long-term targets to help areas like Ethiopia. Cafod provides practical help:
• Finding high quality seeds which mature even if rains are poor • Planting drought-resistant trees • Digging ponds and wells • Marketing surplus produce • Providing loans