Embed Size (px)
Citation preview

GB electricity capacity margin c1
GB electricity capacity marginA report by the Royal Academy of Engineeringfor the Council for Science and TechnologyOctober 2013

c2 Royal Academy of Engineering
© Royal Academy of EngineeringOctober 2013ISBN: 978-1-909327-02-3
Published by Royal Academy of Engineering Prince Philip House 3 Carlton House Terrace London SW1Y 5DGTel: 020 7766 0600 Fax: 020 7930 1549 www.raeng.org.uk
Registered Charity Number: 293074

GB electricity capacity margin 1
Contents
1. Overview of the main issues considered in this report 21.1 Introduction 21.2 Key conclusions 21.3 Background and main drivers 21.4 Near term 31.5 Medium term 41.6 Conclusions and recommendations 5
2. Introduction 82.1 Objective 82.2 Background to the report 82.3 Calculating the capacity margin: de-rated and gross capacity margins 9
3. How did we get here? 103.1 EU directives 103.2 Nuclear plant reaching end of life 113.3 Low profitability of gas fired generation 113.4 Regulatory uncertainty around EMR 11
4. Is there a problem? 13
5. Review of existing plant capacities and possible future system stresses 145.1 Installed capacity of conventional plant 155.2 Stress testing 16
6. Short- and medium-term risk factors and mitigation strategies 196.1 Short term – 2015 196.2 Medium term – 2019 20
7. The effect on prices of tightening supply, the ‘missing money’, and capacity mechanisms 21
8. Recommendations 23
Appendix 1: List of abbreviations 25Appendix 2: Glossary of terms 26Appendix 3: List of interview participants 27Appendix 4: Data and assumptions for scenario analysis 28Appendix 5: Project Working Group members 31

2 Royal Academy of Engineering
1. Overview of the main issues considered in this report
1.1 IntroductionThe Royal Academy of Engineering was invited by the Prime Minister’s Council for Science and Technology to undertake an investigation into the capacity margin of the GB electricity system. In conducting this study, the Academy spoke to a number of participants in the GB electricity system, whose contributions are gratefully acknowledged. We have taken on board and carefully considered the range of viewpoints received, which are reflected in the body of the report. Ultimately however, the conclusions and recommendations set down in this report are those developed by the Academy working group, and should not be assumed to represent those of any single individual or company that was interviewed.
1.2 Key conclusionsThere are a number of market-based and political factors that are currently combining to bring about a reduction in the electricity capacity margin within the next five years. It is our view that this combination of factors, in the absence of intervention, would reduce the capacity margin during the time frame considered by this report, in a manner that would present an increasing risk to security of supply.
We therefore recommend that the government:1. Undertake interim measures to maintain capacity in the period before the
Electricity Market Reform (EMR) package takes effect2. Resolve the EMR process as quickly as possible3. Resolve uncertainties regarding the carbon price floor4. Work together with industry to foster a constructive dialogue with the public
on energy policy5. Develop a holistic energy system strategy
1.3 Background and main driversThis report considers the capacity margin of the GB electricity system. The capacity margin is the proportion by which the total expected available generation exceeds the maximum expected level of electricity demand, at the time at which that demand occurs. This margin is important as an insurance against occasional unexpected losses of power or surges in demand. The electricity capacity margin is thus maintained to support security of supply on the electricity system. The smaller the capacity margin, the greater the risk that the GB electricity generation system will at some point fail to meet the total demand placed upon it.
In broad terms, therefore, the capacity margin is calculated from two variables: the expected level of peak electricity demand and the expected level of available power generation at the time of peak demand.

GB electricity capacity margin 3
1 Ofgem (2013) Electricity Capacity Assessment Report 2013 [Online] Available at: www.ofgem.gov.uk/Markets/WhlMkts/monitoring-energy-security/elec-capacity-assessment/Pages/index.aspx
Demand for electricity is increased by economic activity, and decreased by the successful implementation of energy efficiency measures. Because of the current economic conditions, recent projections have shown demand remaining flat or decreasing slightly1 over the next five years. In this study, we have broadly assumed the peak demand to remain more or less flat over the period of study, though we have also considered the possibility of demand increases due to economic recovery.
In our study we have focused primarily on supply, and particularly on the amount of installed generation capacity that will be available to provide power to meet peak demand. There are two significant influences on the provision and availability of electricity generation capacity. One is the effect of market conditions, the other the effect of political conditions. These factors play out slightly differently in the near-term and medium-term time horizons.
1.4 Near termIn the near term (as far as winter 2015), both market and political factors could affect the total level of installed electricity generation capacity, and therefore the capacity margin. The dynamics of the electricity market are strongly affected by the price of its primary fuels. In the US, the recent opening up of large supplies of cheap shale gas has caused coal to be displaced as an electricity generation fuel to such an extent that the world price of coal has dropped significantly.
The availability of cheap coal on world markets means that, in the UK, it is now more profitable to generate electricity from coal than from gas. As a result, power companies have begun to retire gas-fired plant, either permanently or temporarily, the latter known as ‘mothballing’.
At the same time, coal- and oil-fired plants are affected by the EU Large Combustion Plant Directive (LCPD), which limits emissions of pollutants from all power plants. Those plants that have chosen to ‘opt out’ of the implementation of the required technologies to meet the emissions standards of the directive must close once they have operated for a maximum of 20,000 hours from 1 January 2008 to 31 December 2015. By the end of 2015, 11.5 GW of coal and oil plant will have closed as a result of the LCPD, with 7.3 GW having already closed by mid-2013.
The combination of these market and political conditions means that the plant margin will fall over the next two to three years. If the LCPD closures are backed up by further closures or mothballing of combined cycle gas turbine (CCGT) plant as a result of current economic conditions, the consequence, we believe, will be a significant reduction in the resilience of the system. While the resulting capacity margin might appear adequate when considering average winter demand levels and average winter plant availabilities, a combination of external stress events could significantly increase the risk of power outages. For example, if cold and low-wind weather conditions, such as experienced in December 2010, were to occur simultaneously with the loss of one or two major generating plants, then the plant margin would be very thin. Such a combination of events has a relatively low probability. However, the probability of at some point experiencing stress events in combination with a low capacity margin increases the more years a system is operating with a low capacity margin. A reduced capacity margin means a reduced level of system flexibility to deal
Overview of the main issues considered in this report
4 Royal Academy of Engineering
with such events, should they arise. When considering such external stress factors, the adequacy of the plant margin in the short term depends to a large extent on whether the economic conditions described above provoke additional closures and mothballing of CCGT plant, beyond those already seen.
1.5 Medium termIn the medium-term time frame (2016 to the end of the decade) it becomes appropriate to consider the possible contribution to the capacity margin of new generation plant. In this time frame, as well as the current unfavourable market conditions for gas plant, political conditions are having a significant effect on the environment for new investment. The government’s EMR proposals are currently on their passage through Parliament. When translated into law, these proposals will significantly change the way the GB electricity market operates2. Its main components are Feed-in Tariffs based on Contracts for Difference (FIT-CfDs) for low carbon generators, a capacity mechanism, and an Emissions Performance Standard. The last component prohibits construction of new unabated coal plant; however, because of the impact of the LCPD, this mechanism will have limited additional effect and is not discussed in detail in this report. An additional policy that was originally part of the EMR proposals, but has already been implemented through an adaption of the existing Climate Change Levy, is the carbon price floor.
The proposals for FIT-CfDs and a capacity mechanism3 have introduced a very significant level of uncertainty into the market. This is because the full details of these proposed new policies are not yet clear to generating companies. The resulting uncertainty is inhibiting investors and generators from investing in and building new power generation plant. There are currently 18.5 GW of consents held by generators to build new CCGT plant4, only one project of which is currently being developed, for reasons specific to the company in question. Apart from this case, the view from a number of the major generators is that market conditions and policy uncertainty are holding back investment in new CCGT plant. Generators want to know much more of the detail around the capacity mechanism and the FIT-CfDs in order to be able to plan their investments.
There is also concern around the carbon price floor. The price trajectory is set firmly only for the next three years, and indicatively thereafter. The lack of a firm price signal beyond the next three years creates long-term investment uncertainty. There are also doubts about the long-term political sustainability of the policy. The carbon price floor was initially intended to bolster the carbon price generated by the European Union Emissions Trading Scheme (EU ETS). However, following the collapse of the price of carbon in the EU ETS, the carbon price floor now constitutes the bulk of the UK cost of carbon for electricity generators, and represents a considerable increment over the equivalent cost in the rest of Europe. Generators are mindful of the possibility that policies that become politically unpopular can be reversed, as for example was seen in the case of the road fuel escalator5. In summary, the carbon price floor creates uncertainty both because it is difficult to forecast, and because of the lack of confidence in industry that it will not be rescinded under public pressure.
2 Some of the EMR proposals also affect Northern Ireland. 3 In broad terms, the mechanism is likely to involve a capacity auction, whereby generators or demand-side response providers will bid for contracts to provide capacity at specified future times. The number of contracts issued will depend on the level of capacity deemed necessary to achieve a given level of system security. Successful bidders will be rewarded with a fixed payment for the capacity they provide, in addition to any remuneration they receive from actual operation. Participants would be penalised should they fail to provide capacity when called upon to do so. 4 ‘Energy Infrastructure’, Onshore Power Station Consents / Recent decisions on applications [Online] Available at: https://www.og.decc.gov.uk/EIP/pages/recent.htm 5 A ‘road fuel escalator’, in the form of a commitment to increase the duty on road fuel by a specified percentage each year, was introduced in the Budget of 1993. Complaints from road users and hauliers led to the withdrawal of the escalator in 2000. A commitment to increase fuel duty by 1p above inflation each year was re-introduced in the Budget of 2009, but subsequent budgets have frozen or reversed planned rises, including the 2013 Budget which cancelled the planned September 2013 rise. See Steely (2013) Taxation of Road Fuels, House of Commons Library Standard Note SN 824 [Online] Available at: www.parliament.uk/briefing-papers/SN00824.pdf

GB electricity capacity margin 5
Overview of the main issues considered in this report
6 Fraser, P. et al (2003) Power Generation Investment in Electricity Markets, IEA/OECD, Paris 7 By this specific term we are not referring to overall energy efficiency improvements (which nonetheless remain important), or to forced load shedding (which would be an undesirable but necessary emergency measure in the event of a crisis), but to the controlled shifting of load away from the system peak, by commercial and industrial users who have sufficient flexibility to move forward or delay some of their power demand, and would be rewarded by the System Operator for doing so.
1.6 Conclusions and recommendationsA key question to emerge from the interviews was whether the market would send sufficient signals in time to bring forward necessary investment as capacity margins tighten. The differing opinions on this subject were at the root of the divergence of views as to the adequacy of the capacity margin. Experience across OECD countries has shown that well-functioning markets can deliver appropriate and timely signals for new power generation investment. However, supply shortage and price spike crises have been seen in markets (for example Ontario, Canada, 2002–03 and Victoria, Australia, 2000) where political and regulatory uncertainty obscured the price signals available to investors in the electricity market6. In large-scale engineered systems, even a temporary period of uncertainty can have more amplified effects than in other commodity markets, owing to the long lead times and investment risks associated with planning and building new generation investments, and taking mothballing or closure decisions. The issue of timing is therefore crucial. Our concern is that the current uncertainties associated with the EMR transition are occurring at the same time as the LCPD begins to force plant closures. The uncertainty of EMR may be masking the signals that a well functioning market would otherwise give in anticipation of the forthcoming LCPD closures. It is this coincidence of factors that leads us to believe that the government should be mindful of the possibility of capacity shortages during the next five years.
To mitigate this risk, if the regulatory conditions were clarified, new plant could be built within the medium-term time frame. However, in the near term the focus must be on maintaining sufficient existing plant on the system, and on making use of the potential for demand-side response (DSR)7. We therefore recommend that the government:
1. Undertake interim measures to maintain capacity in the period before the EMR takes effect
In the short term we judge that, given the current uncertainties in market conditions, the regulatory uncertainties associated with the EMR transition and the recent hiatus in investment in new plant, there is a risk that, between now and winter 2015, the capacity margin could reduce to a level that puts security of supply at risk, particularly if various stress factors were to coincide with the peak of system demand.
We therefore consider that there may be merit in preparing an early form of capacity auction or equivalent interim measures to prevent the further withdrawal and mothballing of gas-fired plant, and to bring forward more demand-side response, both of which could be critical to maintaining an adequate capacity margin in the middle of the decade. However, care should be taken that any short-term capacity measure does not negatively affect the efficient operation of the rest of the market in delivering longer-term objectives of a low carbon, secure system.
[Note: On 27 June 2013, DECC announced that it would be running a capacity auction in 2014, to deliver in 2018. Ofgem and National Grid also launched consultations on additional balancing services to provide capacity by winter 2014–15. We support the implementation of the capacity mechanism, but consider that 2018 would be too late to affect the near-term issues highlighted. We would therefore support the proposals for interim balancing measures to cover the period up to 2018.]
6 Royal Academy of Engineering
2. Resolve the EMR process as quickly as possible In the medium term, there is the potential for new generation investments to
contribute to capacity. To facilitate this, it is vital that the EMR process be completed as quickly as possible in order to return much-needed certainty to the market. This is critical for stimulating investment in the technologies that will meet our medium- and longer-term security of supply and low carbon objectives. In particular, all the details on the FIT-CfD process and the capacity mechanism should be set out in full as soon as is reasonably possible, to enable investors and industry to model their long-term investments with a degree of confidence.
In the mid to longer term, the increasing replacement of thermal plant with renewable generation, which is more intermittent in operation, will present challenges to the maintenance of a secure capacity margin. The government should ensure that the design of the capacity mechanism is robust to the transitional challenges of a future low carbon system and is accessible to capacity contributions from a range of sources, including demand-side response.
3. Resolve uncertainties regarding the carbon price floor Our discussions with industry revealed considerable concerns around the carbon
price floor, both because its price is only set three years ahead, and because there is considerable doubt that it will ultimately be a sustainable policy. We recommend that government work closely with industry to consider how the investment and hedging uncertainties brought about by the policy can be mitigated, and how the long-term sustainability of the policy can be more firmly established, particularly given the collapse of the price of carbon in the EU ETS.
4. Work together with industry to foster a constructive dialogue with the public on energy policy
Participants from across industry expressed the view that one of their biggest challenges is political uncertainty. This is in part caused by changes in policy, although companies were broadly understanding of the need to get EMR right. Perhaps more concerning for many, however, was the degree of mixed messaging that occurs in political and media debate regarding the priorities of decarbonisation, security of supply and keeping costs low for the consumer. The major power companies recognise that they are the delivery agency for the first two objectives, and yet feel that they are sometimes blamed when the result is that delivering on the third is much harder.
Our energy companies have multinational investment portfolios. In that context, we heard that the UK is still broadly considered as one of the most favourable investment environments for low carbon technologies; however, inconsistent messaging can undermine the investment case even in the most favourable policy environments.
Achieving decarbonisation and security of supply within a system that is ageing and due for renewal is likely to result in an increase in the unit cost of electricity. We recommend that the government work with industry to foster a constructive dialogue with the public about the nature of our energy challenges.

GB electricity capacity margin 7
5. Develop a holistic energy system strategy Participants in our interviews also widely indicated the need to view electricity policy
within a whole energy system context. EMR is largely focused on electricity generation but this is only one part of a complex and interconnected energy system. Important cross-sectoral interactions that were raised within the capacity margin discussions included:
• Increasingelectricitydemandarisingfromelectrificationofheatandtransport• Theroleofthedemandside,bothinoverallefficiencyandloadshifting• Theinteractionofgasandelectricitymarketsandnetworks,includingthefuture
availability of gas resources and their prioritisation for heat or power generation• Theeffectoftransmissionchargingpolicy,includingtheextentofthelocational
element within that, on generation investment decisions
It is important that a holistic energy strategy is developed that takes account of all the major sectors within the energy system, the government bodies with responsibility for them, the regulations that govern them, and how all of these interact with each other. Insights from energy system modelling studies, including, for example, work undertaken through the UK Energy Research Centre8, DECC’s own 2050 Pathways analysis 9, and National Grid’s Future Scenarios work10, should be drawn on to support this strategic approach.
8 Ekins, P. et al (2013) The UK Energy System in 2050: Comparing Low Carbon, Resilient Scenarios, UKERC Research Report [Online] Available at: www.ukerc.ac.uk 9 DECC (2010) 2050 Pathways Analysis [Online] Available at: www.gov.uk/government/publications/2050-pathways-analysis 10 National Grid (2013) 2013 UK Future Energy Scenarios [Online] Available at: www.nationalgrid.com/uk/Gas/OperationalInfo/TBE/Future+Energy+Scenarios/
Overview of the main issues considered in this report

8 Royal Academy of Engineering
2. Introduction
2.1 ObjectiveThe objective of this study is to explore the question of whether the capacity margin of the GB electricity system could reach dangerously low levels within the next five years, and to offer recommendations on how best to deal with any potential issues.
2.2 Background to the report The Royal Academy of Engineering was invited by the Prime Minister’s Council for Science and Technology to undertake an investigation into the capacity margin of the GB electricity system. The objective of the study is to explore the question of whether the capacity margin of the GB electricity system could reach dangerously low levels within the next five years. This study follows work carried out by Ofgem11, National Grid12 and the Department for Energy and Climate Change (DECC)13, which has raised the possibility of reduced security as a result of a tightening supply margin as early as the winter of 2015/16. However, beyond this headline result, the three studies also show significant ranges of uncertainty, which arise from different assumptions in relation to a number of important variables. The aim of this report was not to attempt to repeat the detailed quantitative work undertaken by Ofgem, National Grid and DECC, but to explore some of these underlying uncertainties.
The primary approach taken in this study was to investigate perceptions of the issues through an interview-based methodology. To support this report, the Academy conducted interviews with a number of major participants in the GB electricity system, whose contributions are gratefully acknowledged (see Appendix 3). In using this interview-based methodology, our aim was to uncover how different perceptions of the issue may lead to different understandings of the level of risk. In our discussions, we have found a wide range of interpretations of the data, and a correspondingly wide range of perceptions of risk. We have taken on board and carefully considered the range of viewpoints received, which are reflected in the body of the report.
As a means of exploring and testing the different perceptions we encountered through our interviews, we have also reviewed the publicly available data on installed capacities of electricity generation technologies and tested this data against a single-point, multiple-stress case.
Drawing on both the interview data and our review of publicly available data on generation capacity, we have reached our own conclusions about the issue and set out recommendations. The conclusions and recommendations set down in this report are those of the Academy working group, and should not be assumed to represent those of any single individual or company that was interviewed.
11 Ofgem (2013) Electricity Capacity Assessment Report 2013 [Online] Available at: www.ofgem.gov.uk/Markets/WhlMkts/monitoring-energy-security/elec-capacity-assessment/Pages/index.aspx 12 National Grid (2013) 2013 UK Future Energy Scenarios [Online] Available at: www.nationalgrid.com/uk/Gas/OperationalInfo/TBE/Future+Energy+Scenarios/ 13 DECC (2012) Electricity Market Reform – Policy Overview. Annex C – Capacity Market Design and Implementation Update. Figure 2, page 12. [Online] Available at: www.gov.uk/government/publications/electricity-market-reform-policy-overview--2

GB electricity capacity margin 9
Introduction
2.3 Calculating the capacity margin: de-rated and gross capacity marginsThe capacity margin is the level by which available electricity generation capacity exceeds the maximum expected level of demand. It is normally expressed as the percentage calculated by:
The precise definition of ‘total available capacity’ is important, as alternative definitions lead to different types of capacity margin calculation. Traditionally, total available capacity was taken as the sum of full theoretical or ‘nameplate’ capacities of all plant on the system. The capacity margin calculated in this way is now referred to as ‘gross capacity margin’. Owing in large part to the increasing contribution of variable renewable resources, whose average output is considerably lower than their full rated nameplate capacity, an increasingly preferred capacity margin measure is the ‘de-rated capacity margin’. In this indicator, the nameplate capacity of each generation type is ‘de-rated’ by a factor which reflects the statistically expected level of reliable availability from that plant type during a given season. For thermal plants, planned and unplanned outages might reduce the actual generation that can reliably be expected to be available at any given time. For wind turbines, the variability of wind speeds is such that the proportion of wind capacity which can be considered as reliably available at any given time during the season being considered, is much less than the total theoretical capacity. The de-rating factors used by Ofgem for each generation type are shown in Table 1. For example, as shown in Table 1, Ofgem considers that when analysing the winter season, 85% of the total installed capacity of CCGT plant can be considered reliably available to meet that demand.
An important point to take from this is that the traditional measure of ‘gross capacity margin’ cannot be directly compared to a ‘de-rated’ capacity margin, which is now the more favoured measure. In the past, the CEGB14 would typically have planned the system on the basis of maintaining a 20% gross capacity margin. Several of our interviewees judged this to be comparable to a 4–5% de-rated capacity margin, though this of course depends on the precise plant mix and the de-rating factors chosen. However, the important point is that the difference between a 20% gross margin and a 4% de-rated margin is by no means as significant as might appear when taking the numbers at face value.
Fuel type Winter availability
Coal / biomass 88%
Gas CCGT / Gas CHP 85%
Gas OCGT 92%
Oil 82%
Nuclear 81%
Hydro 84%
Pumped storage 96%
Wind 17–24%
Table 1: Generator de-rating factors per technology type, as used in Ofgem Electricity Capacity Assessment Report, 2013
14 The Central Electricity Generating Board (CEGB) was the state-owned owner and operator of the England and Wales electricity system during the period of nationalisation from 1957 until privatisation began in 1990.
capacity margin (%) = x 100total available capacity - peak demand
peak demand

10 Royal Academy of Engineering
3. How did we get here?
There was wide agreement across our interviewees that the current electricity capacity margin is comfortable. A brief look at publicly available data confirms this view. The current total installed nameplate capacity on the system amounts to 77.9 GW. Over a 58 GW peak demand, this equates to a 34% gross capacity margin, or a 7% de-rated capacity margin using Ofgem’s de-rating factors (Table 1). Over a 60 GW peak demand (last experienced in 2010), this would become 30% (gross) and 3% (de-rated). Both gross margins look generous compared to the traditional CEGB measure, although the impact of wind makes direct comparison increasingly difficult. Some of our interviewees noted that in the period of 2003–05 the system was operating on de-rated margins of around 2%. Although there were no major supply disruptions, the tightness of the system was evidenced by the fact that the system operator National Grid issued several Notices of Inadequate System Margin (NISMs) during this period.15 Interviewees suggested that a de-rated margin of 4% would be an appropriate level to aim for, as this would provide a loss of load expectation (LOLE) of 1¾ hours per year, which would be an acceptable security standard across most national electricity systems. Given that the most recent winter peak demand was 56 GW, the current system margin appears comfortable according to the de-rated measure as well. However, it was also widely agreed among interviewees that a number of factors are currently coinciding to bring about closures of existing plant and to delay investment in new plant. These factors, which can be distinguished as market driven and politically driven, and which play out both over the short and the medium term, are discussed below.
3.1 EU directivesIn the near term, the most significant directive is the Large Combustion Plant Directive (LCPD), which limits SO2, NOX and dust emissions from all power plants. Those plants that have chosen to ‘opt out’ of the implementation of the required technologies to meet the emissions standards of the directive must close once they have operated for a maximum of 20,000 hours from 1 January 2008 to 31 December 2015. By the end of 2015, 11.5 GW of coal and oil plant will have closed due to the LCPD, with 7.3 GW having already closed by mid-2013.
In the medium term, another directive, The Industrial Emissions Directive (IED), will have additional impact. This directive consolidates the LCPD with six other existing directives, and will impose more stringent emissions limits on large combustion plant. Existing plant will be able to ‘opt in’ either by committing to the directive’s emission limit values from 2016, or by entering into a Transitional National Plan from 2016–2020 and fully complying with the emission limit values from 2020. Opted-out plant will be permitted to operate for a maximum of 17,500 hours between 2016 and 2023, after which they must close.
The precise impact of the IED, in terms of which existing plant will opt out, is currently unknown. As the above timetable indicates, impacts of plant closures might be expected to begin towards the end of decade (if opted-out plant use up their hours quickly), and to occur to a greater extent from 2020 onwards.
15 Following a trigger of insufficient operating margin, National Grid can issue a Notice of Inadequate System Margin (NISM) to request market participants to review their availability. NISMs can be cancelled closer to real time.

GB electricity capacity margin 11
How did we get here?
3.2 Nuclear plant reaching end of lifeA significant proportion of the existing nuclear fleet will reach the end of its expected operational life time towards the end of the decade (see Table 2). Many of these plants have already been granted life extensions.
Plant Capacity (MW) Published closure date
Wylfa 490 2014
Dungeness B 1110 2018
Heysham 1 1160 2019
Hartlepool 1190 2019
Torness 1250 2023
Heysham 2 1250 2023
Hinkley Point B 1220 2023
Hunterston B 1190 2023
Sizewell B 1188 2035
Table 2: Current nuclear power stations and expected closure dates16
3.3 Low profitability of gas-fired generationIn the US, the recent opening up of large supplies of cheap shale gas has caused coal to be displaced as an electricity generation fuel to such an extent that the world price of coal has dropped significantly. The availability of cheap coal on world markets means that, in the UK, it is now more profitable to generate electricity from coal than from gas. The comparatively higher fuel cost of gas means that the profit margin between the gas price and the electricity price, or ‘spark spread’, is too low to justify investment in new gas-fired generation. As a result, power companies have begun to retire gas-fired plant, either permanently or temporarily, the latter known as ‘mothballing’.
3.4 Regulatory uncertainty around EMRThe government’s EMR proposals, when translated into law, will significantly affect the operation of the GB electricity market. The package contains proposals for Feed-in tariffs based on Contracts for Difference (FIT-CfDs) as the new low carbon support mechanism, and for a capacity mechanism to maintain security of supply. A third component is the Emissions Performance Standard which prohibits construction of new unabated coal plant; however, because of the impact of the LCPD, this mechanism will have limited additional effect and is therefore not discussed in detail in this report. An additional policy that was originally part of the EMR proposals but has already been implemented through an adaption of the existing Climate Change Levy, is the carbon price floor. The proposals for FIT-CfDs and for a capacity mechanism, as well as the currently active carbon price floor policy, all introduce uncertainty into the investment environment.
The uncertainty around a possible future capacity mechanism17 is a factor inhibiting investment decisions in new gas-fired plant. The presence or absence of this mechanism will critically affect the economics of new gas investment decisions. As a result, interviewees indicated that investment decisions were likely to be delayed until the
16 Source: Table of past and present nuclear reactors. Available at: www.gov.uk/government/uploads/system/uploads/attachment_data/file/48353/2027-past-and-present-uk-nuclear-reactors.pdf 17 In broad terms, the mechanism is likely to involve a capacity auction, whereby generators or demand-side response providers will bid for contracts to provide capacity at specified future times. The number of contracts issued will depend on the level of capacity deemed necessary to achieve a given level of system security. Successful bidders will be rewarded with a fixed payment for the capacity they provide, in addition to any remuneration they receive from actual operation. Participants would be penalised should they fail to provide capacity when called upon to do so.

12 Royal Academy of Engineering
capacity mechanism policy was confirmed one way or the other. The confirmation of the first auction in 2014 to deliver capacity in 2018, which was announced by DECC subsequent to the interview stage of this project, will have reduced uncertainty. However, the detail of the mechanism remains to be fully worked out, and this detail will be required before companies are able to model their investments with sufficient confidence.
The carbon price floor was intended to bolster the carbon price generated by the European Union Emissions Trading Scheme (EU ETS) and thus provide a clearer and more stable carbon signal to assist low carbon investment. However, the firm price trajectory only extends three years ahead, which creates a ‘cliff-edge’ for investment decisions. Furthermore, owing to the increasingly wide disparity in the cost of carbon between the UK and the rest of Europe, many industry participants are unsure as to whether the government will ultimately view this policy as sustainable in the long term, creating another element of uncertainty. Generators are mindful of the possibility that policies that become politically unpopular can be reversed, as for example was seen in the case of the road fuel escalator18.
It was widely commented that other aspects of the EMR process, notably the transition from Renewables Obligation Certificates (ROCs) to contracts for difference (CfDs) as the low carbon delivery mechanism, are also creating uncertainties around future investment. This is posing challenges for some renewable investment decisions, particularly those whose completion timetable approaches the ROC deadline, and may be contributing to a slowing of renewables investment. However, other participants noted that investments in renewables have continued in the period during which the EMR has been passing through its stages towards legislation.
18 A ‘road fuel escalator’, in the form of a commitment to increase the duty on road fuel by a specified percentage each year, was introduced in the Budget of 1993. Complaints from road users and hauliers led to the withdrawal of the escalator in 2000. A commitment to increase fuel duty by 1p above inflation each year was re-introduced in the Budget of 2009, but subsequent budgets have frozen or reversed planned rises, including the 2013 Budget which cancelled the planned September 2013 rise. See Steely (2013) Taxation of Road Fuels, House of Commons Library Standard Note SN 824 [Online] Available at: www.parliament.uk/briefing-papers/SN00824.pdf

GB electricity capacity margin 13
4. Is there a problem?
There were contrasting views on whether the factors outlined above constituted a risk to the security of the GB electricity system. On one hand, some participants had confidence in the ability of the market to deliver an appropriate capacity margin. We would summarise this view as follows:
• Significantinvestmentingasplantoccurredupto2009,inanticipationofthegapthatwould be caused by the LCPD. However, demand has been depressed by the effects of the recession meaning that capacity is currently oversupplied.
• Thelowsparkspreadissimplyareflectionofthisoversupply,andiscorrectlygivingthesignal that new investment is not required.
• Asthemargintightens,forwardelectricitypriceswillprovidethesignaltogeneratorsthat new investment is required.
On the other hand, other participants had less confidence in the ability of the market, in current conditions, to deliver an appropriate capacity margin. We would summarise this view as follows:
• Themarketcannotcurrentlybereliedupontoprovidethecorrectforwardinvestmentsignals for a number of reasons:
– The current low spark spread is not caused by general over supply, but by the recent availability of cheap coal caused by global factors – however, the availability of coal-burning capacity will be rapidly curtailed because of the effects of the LCPD.
– The unconfirmed possibility of a capacity mechanism is creating uncertainty and interfering with forward price signals, holding back investment.
– The uncertainty around the carbon price floor is limiting long-term investment decisions.
• Theleadtimesassociatedwithclosing,mothballing,reopeningorbuildingplantaresuch that decisions taken during a period of uncertainty can have long ramifications. Thus even a temporary interruption of clear market signals, if it occurs at a critical investment decision point, may have disproportionate effects.

14 Royal Academy of Engineering
5. Review of existing plant capacities and possible future system stresses
The different perceptions among interviewees as to the extent of the problem partly reflect different perceptions about the ability of the market to deliver capacity. They also reflect genuine uncertainties around the way the analysis of capacity margins should be undertaken. There are a number of key analytical variables – in particular the de-rating factors that should be chosen for different technology types, peak demand projections, and what to assume about the behaviour of interconnectors at times of peak – which in themselves add considerable bounds of uncertainty to any capacity margin calculations, even before different assumptions about levels of installed capacity are considered. These points are discussed in detail in Ofgem’s Electricity Capacity Assessment Report.
It was beyond the scope of this report to seek to reproduce the detailed statistical analysis undertaken by Ofgem, nor would there have been any additional benefit in doing so. However, in order to help explore and interrogate the different arguments put forward by our interviewees, we undertook a review of the publicly available data on electricity generation installed capacities, comparing the figures against a variety of sensitivities.
The focus of this work is not a probabilistic approach to the interaction of generation availability and demand over an entire winter season. Rather, its focus is solely on the moment of peak winter demand, and the effect of a number of simultaneous stress factors occurring at this time, against different hypothetical generation backgrounds. When considering such ‘worst case scenarios’, there is to some extent a political decision to be made about the benefits of insuring against them, given the relatively low probability of their occurrence. However, we note that the low range of capacity margins in the Ofgem report derives from sensitivities that do precisely alter these variables, in particular the behaviour of interconnectors. In addition, those of our interviewees who believe that the capacity shortfall is a real problem have tended to cite such combinations of events as being more pertinent to consider than seasonal averages. Hence, we have chosen to set out explicitly the impacts of such simultaneous events in as transparent a manner as possible, making all assumptions clear. We do not intend what follows as a fully fledged methodology for calculating capacity margin adequacy in the long term – in particular as more renewables join the system. Rather, we intend to test quantitatively some of the main concerns of a significant section of our interviewees, with a focus on the near- and medium-term issues that have been raised.
Following concerns consistently raised by interviewees, the three stress factors we are testing against are:• lowwindconditions• plantoutages• interconnectorbehaviour

GB electricity capacity margin 15
Review of existing plant capacities and possible future system stresses
75
55
45
65
2012 2020
GW
Possible impact of plant closures on available conventional capacity
5.1 Installed capacity of conventional plantOur analysis compares electricity generation installed capacities for the years 2013, 2015 and 2019. The 2013 data were extracted from the National Grid’s Transmission Entry Capacity (TEC) register published on 18 June 2013. The data for the years 2015 and 2019 involve assumptions about the future, and is correspondingly more speculative. Our analysis is focused on the availability of conventional generation capacity and does not include the potential contribution of renewables. The reason for this is that, as noted above, one of the key stress factors we are testing against is a low wind condition. Further details on the assumptions and approach are provided in Appendix 4.
Figure 1 provides an overview of the possible effect of plant closures on the overall availability of conventional generation capacity19 in the years 2013, 2015 and 2019. It includes the following assumptions:• 2015:remainingexpectedplantclosuresresultingfromtheLCPD,andendoflife
retirement of remaining Wylfa reactor• 2019:closureof5GWcoalresultingfromtheIndustrialEmissionsDirective(IED).
This is an illustrative assumption, not based on any commercial information about the prospects for specific plant in relation to the IED. This assumption is made purely for the purposes of illustrating a possible overall effect of this driver
• Noadditionalclosuresormothballingofplantforcommercialreasons• Noadditionalnewplant,withtheexceptionofCarringtonCCGTwhichiscurrently
under construction20.
The above assumptions have been deliberately kept very basic, to avoid overcomplicating at the expense of clarity. The ‘no new build’ assumption should not be taken as an indication that we expect or predict no new capacity to be developed and built during the period – rather we are indicating how possible closures could create need for new capacity which, given favourable market and political conditions, we would expect to be forthcoming. Needless to say, it is possible to imagine how the available capacity represented in Figure 1 could decline more steeply as well as less steeply.
Factors driving faster decline in capacity could include:• Continuingpooreconomicconditionsforgascompelsfurtherearlyretirementand
mothballing of CCGTs.• Technicalproblemswithlifeextensionforcenuclearretirementbefore2020.There
are three plants currently scheduled to close in 2018 and 2019 (Table 2)21.• FewercoalplantsundertakethenecessaryupgradestocomplywiththeIED.
Factors driving a slower decline, or an increase in capacity could include:• Improvementineconomicconditionsforgasencouragesthereturnofmothballedplant
to the system, as well as new investment.• CompletionofEMRresolvesregulatoryuncertaintiesandprovidescasefornew
investment.• MorecoalplantsundertakethenecessaryupgradestocomplywiththeIED.
Figure 1 carries two horizontal lines representing respectively a ‘low’ end of peak demand (56 GW, which was the winter 2012 peak) and a ‘high’ end (60 GW, last recorded in December 2010).
The figure therefore compares a declining trajectory of available conventional capacity based on the assumptions outlined above, with a plausible range of expected peak demand.
19 These are ‘nameplate’ or ‘gross’ capacities, not de-rated according to historic seasonal availability. See glossary for definition of ‘gross capacity margin’ and ‘de-rated capacity margin’, and Appendix 4 for further discussion of the issue. 20 Carrington CCGT, 880 MW, is currently under construction and due to come on line in early 2016. 21 EDF Energy has announced that it expects to achieve an average of seven years of life extensions across the AGR fleet which implies life extensions in individual plants beyond those already formally announced. Formal decisions on further life extension at these three plants, Dungeness, Heysham 1 and Hartlepool, have not been taken, however, EDF Energy has indicated it has an aspiration to run these plants into the next decade. Hence, our scenario includes the assumption that these plants will still be running in 2019, however, there is of course a risk that life extension does not prove possible.
available capacitypeak demand (high)peak demand (low)
Figure 1: Possible impact of plant closures on available conventional capacity
16 Royal Academy of Engineering
5.2 Stress testingWe have considered these hypothetical overall installed capacity levels against multiple stress events occurring simultaneously with the winter peak. Figures 2–4 illustrate this stress testing.
The first stress event is a low wind condition. There are ongoing debates around the appropriate de-rating factor for wind in relation to the winter peak. Several of our interviewees suggested that when considering winter peak, as opposed to the average across the winter season, a factor of less than 10% is appropriate. However, rather than attempting to take a position within this debate, our aim to include low wind as a stress event entails an extreme assumption in this instance of no contribution from wind. This is already reflected by the fact that we have counted conventional generation only in the installed capacities. We acknowledge that extreme low wind events across the whole of the UK are infrequent – a statistical analysis of 33 years of MET Office weather data found that events when wind speeds of less than 4m/s affected more than 90% of the UK had an average recurrence rate of 1 hour per year22. On the other hand, the actual output of installed wind turbines in January 2009 did in fact fall to close to zero MW for a continuous period of ten days23. There is a greater vulnerability to lower overall wind outputs when wind turbines are geographically clustered. Therefore we conclude that there is a justification in considering the possibility of zero wind output as we examine the near- and medium-term system prospects, but acknowledge that such an approach would be increasingly less justified in the longer term as a larger and more geographically diverse wind portfolio is developed.
The second stress event is the effect of a double plant outage. In each of the figures, the first bar marked ‘Base scenario’ represents the available capacity counting conventional (non-renewable) generation only. The second bar marked ‘Outage scenario’ represents the available conventional capacity following the near simultaneous loss of two large generators. For illustrative purposes, capacities corresponding to Longannet coal fired power station (2260 MW), and Sizewell B nuclear power station (1212 MW) are deducted from the total available capacity. Both of these stations did indeed have near simultaneous unplanned outages on 27 May 2008. Again, it should be stressed that occurrences of such a simultaneous outage are highly infrequent, but not impossible. De-rated capacity margins account for the possibility of both planned and unplanned outages. Several of our interviewees argued that to include planned outages or commercial unavailability within the de-rating factor for thermal plant against the winter peak was unrealistic, as planned outages would be scheduled away from the winter peak. By using full nameplate capacities in our calculations, we are assuming full commercial availability of all conventional generators at the point of winter peak. This outage sensitivity accounts for the possibility, which cannot be discounted, of unplanned outages.
The third stress event is the additional variability posed by interconnectors. Interconnectors should assist with security of supply by providing the potential to import power. However interconnectors also export power. The outage scenario bar in each of the figures carries a range bar of 4 GW above and below the total available capacity. With 4 GW representing the total currently existing capacity of UK interconnection with transmission systems in Europe, Republic of Ireland and Northern Ireland, the range bar represents the swing between a full import situation and a full export situation. Some of our interview participants have argued that full interconnector export, at a time when GB generators are struggling to meet peak GB demand, is unlikely as resulting high prices are likely to make
22 Sinden (2007) Characteristics of the UK wind resource: Long-term patterns and relationship to electricity demand, Energy Policy, 35 (1), 112-127 23 Royal Academy of Engineering (2012) Heat: degrees of comfort? Royal Academy of Engineering, London; Page 32, Figure 12

GB electricity capacity margin 17
the GB market attractive to sell into at such times. However, others argued that if similar crisis conditions were occurring on the continent, it is not impossible that even higher prices in competing markets would cause the electricity to flow the other way.
Clearly, the simultaneous coincidence of three relatively unlikely events with the system peak is itself even more unlikely. However, the probability of experiencing stress events in combination with a low capacity margin increases the more years a system is operating with a low capacity margin. Thus, if the capacity margin was to be low for only one year, the probability of such infrequent stress events occurring in that one year might be minimal. If the low capacity margin persisted for five years, the probability of experiencing such events at some point in those five years would be compounded.
Figures 2–4 also carry the same two horizontal lines found in Figure 1, representing a ‘low’ and ‘high’ end of expected peak demand, of 56 and 60 GW respectively.
Figures 2–4 therefore illustrate a test of hypothetical installed capacities against the cumulative effect of three additional stress factors (zero wind, plant outages, and interconnector flow) at a time of peak demand.
Figure 2 presents the current situation. It appears to confirm the view of the majority of our interviewees that current capacity margins are comfortable. Even if a low wind event were to coincide with an unplanned outage at two major stations, and full export from interconnectors (shown by the lower end of the interconnector range bar), the total available conventional capacity still remains above the highest expected peak demand. Figure 3 illustrates a possible scenario for the end of the year 2015, using the capacity assumptions previously described. This figure shows that in the event of zero wind, two outages and maximum export through interconnectors, the available capacity would be not significantly higher than the top of the peak demand range, as shown by the position
75
55
45
65
Basescenario
Outagescenario
GW
2013 Conventional capacity
Figure 2: Current conventional capacity availability
available capacitypeak demand (high)peak demand (low)interconnector import/export range
75
55
45
65
Basescenario
Outagescenario
GW
2015 Conventional capacity
Figure 3: Projected 2015 conventional capacity availability
available capacitypeak demand (high)peak demand (low)interconnector import/export range
Review of existing plant capacities and possible future system stresses

18 Royal Academy of Engineering
of the lower end of the interconnector range bar. This would represent a very thin margin. We note that the reference scenario in Ofgem’s Electricity Capacity Assessment Report 2013 assumes, in addition to the plant closures and mothballing included in our figures, a further 0.8 GW of CCGT plant to be mothballed before winter 2014/15. Clearly this is an assumption with some uncertainty attached – however, this amount of additional mothballing, in combination with the three stress events, would be sufficient to cause available capacity to drop below the high end of the peak demand range.
Figure 4 shows the effect of assuming significant closures of plant towards the end of the decade, which are not replaced by new plant. Such a scenario would mean that, in a zero-wind event with two plant failures, meeting similar peak demand to that experienced in recent years would be possible – however, the combination of these factors with significant exports of power through interconnectors would place the system at risk, as shown by the lower end of the interconnector range bar, which now extends to just below the low peak demand line. If peak demand were to recover to around 60 GW, the system would struggle to meet demand and would be dependent on imports through the interconnectors at the time of peak to guarantee system security.
75
55
45
65
Basescenario
Outagescenario
GW
2019 Conventional capacity
Figure 4: Projected 2019 conventional capacity availability
coal reductionavailable capacitypeak demand (high)peak demand (low)interconnector import/export range

GB electricity capacity margin 19
6. Short- and medium-term risk factors and mitigation strategies
Bringing together our interview data with our quantitative analysis, it appears that there are significant factors that could drive reductions in plant margin over the next five years. The range of different factors prompts a need to analyse the risk with both a short-term and medium-term perspective.
6.1 Short term – 2015The gap which will be left by LCPD opted out plants is a known factor. What is less clear is the extent to which economic conditions, compounded by regulatory uncertainty, may drive further closures or mothballing of existing CCGT plant.
As noted, there were differences in views between those interviewees who believed that recent mothballing decisions were representative of correctly functioning market signals at the current time of comfortable capacity margins, and those who feared that the market will not be sufficiently liquid to provide the correct signals in time, as the capacity margin narrows.
Experience across OECD countries has shown that well-functioning markets can deliver appropriate and timely signals for new power generation investment. However, supply shortage and price spike crises have been seen in markets (for example Ontario, Canada, 2002–03 and Victoria, Australia, 2000) where political and regulatory uncertainty obscured the price signals available to investors in the electricity market24. In large-scale engineered systems, even a temporary period of uncertainty can have more amplified effects than in other commodity markets, because of the long lead times and investment risks associated with planning new generation investments and taking mothballing or closure decisions. The issue of timing is therefore crucial. It is conceivable that, at the present time, the uncertainty of the EMR transition may be masking the signals that a well-functioning market would otherwise give in anticipation of the forthcoming LCPD closures.
If the government is concerned that the market may not provide timely signals to currently marginal CCGT plant which could be on the verge of mothballing decisions, then a mitigating option would be an early capacity auction, or equivalent interim measure, designed to reward generators for keeping capacity available.
There is not sufficient lead time for new plant to be constructed and commissioned to provide capacity within this short-term time frame. Therefore, if urgent capacity directed measures are to be considered for this time frame, they would need to be designed primarily for maintaining existing marginal plant. Additional alleviation of capacity margins may also be offered by demand-side response. Some interviewees estimated a potential near-term availability of up to 1 GW equivalent capacity from commercial and industrial demand-side response.
24 Fraser, P. et al (2003) Power Generation Investment in Electricity Markets, IEA/OECD, Paris

20 Royal Academy of Engineering
6.2 Medium term – 2019The picture looking out to 2019 becomes more affected by even stronger drivers for plant closure, including the possible end of life retirement of nuclear and the impact of the IED. However, within this timeframe, there is clearly much more opportunity for mitigation through investment in new plant, provided the uncertainties currently holding back investment can be resolved.
The medium term could also see a greater contribution from demand-side response from commercial and industrial users. The total potential contribution of demand-side response programmes in the US has been estimated at 9.2% of US national peak demand25, largely as a result of the ability of demand-side response to participate in capacity mechanisms. The extent of development of demand-side response potential in the UK depends upon regulatory design, in particular of any future capacity mechanism. A successful roll-out of smart meters may, in time, facilitate demand-side response from the residential sector. However, this possibility is longer-term and beyond the time frame of this report.
The clear mitigating strategy against capacity shortfall in the medium-term time frame is therefore the resolution of the EMR process, so that companies can make investment decisions unhindered by regulatory uncertainty.
25 Federal Energy Regulatory Commission (2012) Assessment of Demand Response and Advanced Metering. Available at: http://www.ferc.gov/legal/staff-reports/12-20-12-demand-response.pdf

GB electricity capacity margin 21
26 Joskow, P. (2006) Competitive Electricity Markets and Investment in New Generating Capacity, Research Paper, June 12 2006, MIT, US
7. The effect on prices of tightening supply, the ‘missing money’, and capacity mechanisms
A tightening capacity margin would provide an upward pressure on forward power prices. This would be a result of the increased value of securing future electricity supply for retail companies, rather than relying on trading closer to real time.
At times of peak demand, spot power prices also rise, reflecting the increased demand. This means that a generator producing power at these times can receive greater remuneration than at times of lower demand.
Those of our interviewees who favoured the freer operation of the market argued that both of these kinds of price rises were essential – the first because it creates the forward incentive to take a long-term investment decision in new plant, the second because it rewards generators who are able to make capacity available at times of peak demand.
However, the spiking of prices at peak times can be perceived negatively by the public and by politicians. If, either because of direct regulatory intervention in the market or because of the pre-emptive fear of such intervention, peak power prices are inhibited from rising as high as they naturally would, generators operating at these times are remunerated less. For generators whose operation is confined to these peak hours, the reduced remuneration may not be sufficient to justify investment in new plant. The restriction of thermal plant to a relatively small number of operational hours during the year will become an increasing phenomenon as more renewables, with variable power output, are installed on the system.
If price spikes are politically unacceptable, there is a problem of ‘missing money’26 for plant that will not be called on to operate for the majority of the year, but whose operation at times of peak demand is essential for maintaining system security.
This situation prompts the need for capacity mechanisms, where plant which cannot recoup sufficient reward from peak prices are rewarded on a fixed-cost basis for their overall availability.
In theory, the costs of either approach should be equal. However, some of our interviewees noted a concern that, if poorly designed, capacity mechanisms could result in paying too much for a service that would be more efficiently selected by an energy-only market. Such participants argued that avoiding the discomfort of price spikes could, ironically, lead to paying more overall on a fixed-cost basis.

22 Royal Academy of Engineering
It was also noted that the mere possibility of a future capacity mechanism was already affecting the market. From an investor perspective, given the possibility of a future capacity mechanism, it is unwise to undertake a new investment which could qualify for such a mechanism, before its details have been finalised.
Therefore, if implemented, capacity mechanisms require careful design. They need to avoid distorting the energy market to the extent that they interfere with efficient investment decisions in that market. They need to avoid the selection and rewarding of inefficient plant. They need to be designed to allow participation from a range of capacity providers, both on the supply and demand sides. They need to incentivise flexible plant that can respond quickly to changes in demand and they need to avoid relying on coal plant that could close en masse because of the Industrial Emissions Directive.

GB electricity capacity margin 23
8. Recommendations
There are a number of market-based and political factors that are currently combining to bring about a reduction in the electricity capacity margin within the next five years. It is our view that this combination of factors, in the absence of intervention, would reduce the capacity margin during the time frame considered by this report, in a manner that would present an increasing risk to security of supply.
We therefore recommend that the government:
1. Undertake interim measures to maintain capacity in the period before the EMR takes effect
In the short term we judge that, given the current uncertainties in market conditions, the regulatory uncertainties associated with the EMR transition and the recent hiatus in investment in new plant, there is a risk that, between now and winter 2015, the capacity margin could reduce to a level that puts security of supply at risk, particularly if various stress factors were to coincide with the peak of system demand.
We therefore consider that there may be merit in preparing an early form of capacity auction or equivalent interim measures to prevent the further withdrawal and mothballing of gas-fired plant, and to bring forward more demand-side response, both of which could be critical to maintaining an adequate capacity margin in the middle of the decade. However, care should be taken that any short-term capacity measure does not negatively affect the efficient operation of the rest of the market in delivering longer-term objectives of a low carbon, secure system.
[Note: On 27 June 2013, DECC announced that it would be running a capacity auction in 2014, to deliver in 2018. Ofgem and National Grid also launched consultations on additional balancing services to provide capacity by winter 2014–15. We support the implementation of the capacity mechanism, but consider that 2018 would be too late to affect the near-term issues highlighted. We would therefore support the proposals for interim balancing measures to cover the period up to 2018.]
2. Resolve the EMR process as quickly as possible In the medium term, there is the potential for new generation investments to
contribute to capacity. To facilitate this, it is vital that the EMR process be completed as quickly as possible in order to return much-needed certainty to the market. This is critical for stimulating investment in the technologies that will meet our medium- and longer-term security of supply and low carbon objectives. In particular, all the details on the FIT-CfD process and the capacity mechanism should be set out in full as soon as is reasonably possible, to enable investors and industry to model their long-term investments with a degree of confidence.
In the mid to longer term, the increasing replacement of thermal plant with renewable generation, which is more intermittent in operation, will present challenges to the maintenance of a secure capacity margin. The government should ensure that the design of the capacity mechanism is robust to the transitional challenges of a future low carbon system and is accessible to capacity contributions from a range of sources, including demand-side response.

24 Royal Academy of Engineering
3. Resolve uncertainties regarding the carbon price floor Our discussions with industry revealed considerable concerns around the carbon
price floor, both because its price is only set three years ahead, and because there is considerable doubt that it will ultimately be a sustainable policy. We recommend that government work closely with industry to consider how the investment and hedging uncertainties brought about by the policy can be mitigated, and how the long-term sustainability of the policy can be more firmly established, particularly given the collapse of the price of carbon in the EU ETS.
4. Work together with industry to foster a constructive dialogue with the public on energy policy
Participants from across industry expressed the view that one of their biggest challenges is political uncertainty. This is in part caused by changes in policy, although companies were broadly understanding of the need to get EMR right. Perhaps more concerning for many, however, was the degree of mixed messaging that occurs in political and media debate regarding the priorities of decarbonisation, security of supply and keeping costs low for the consumer. The major power companies recognise that they are the delivery agency for the first two objectives, and yet feel that they are sometimes blamed when the result is that delivering on the third is much harder.
Our energy companies have multinational investment portfolios. In that context, we heard that the UK is still broadly considered as one of the most favourable investment environments for low carbon technologies; however, inconsistent messaging can undermine the investment case even in the most favourable policy environments.
Achieving decarbonisation and security of supply within a system that is ageing and due for renewal is likely to result in an increase in the unit cost of electricity. We recommend that the government work with industry to foster a constructive dialogue with the public about the nature of our energy challenges.
5. Develop a holistic energy system strategy Participants in our interviews also widely indicated the need to view electricity policy
within a whole energy system context. EMR is largely focused on electricity generation but this is only one part of a complex and interconnected energy system. Important cross-sectoral interactions that were raised within the capacity margin discussions included:
• Increasingelectricitydemandarisingfromelectrificationofheatandtransport• Theroleofthedemandside,bothinoverallefficiencyandloadshifting• Theinteractionofgasandelectricitymarketsandnetworks,includingthefuture
availability of gas resources and their prioritisation for heat or power generation• Theeffectoftransmissionchargingpolicy,includingtheextentofthelocational
element within that, on generation investment decisions
It is important that a holistic energy strategy is developed that takes account of all the major sectors within the energy system, the government bodies with responsibility for them, the regulations that govern them, and how all of these interact with each other. Insights from energy system modelling studies, including, for example, work undertaken through the UK Energy Research Centre27, DECC’s own 2050 Pathways analysis28, and National Grid’s Future Scenarios work29, should be drawn on to support this strategic approach.
27 Ekins, P. et al (2013) The UK Energy System in 2050: Comparing Low Carbon, Resilient Scenarios, UKERC Research Report [Online] Available at: www.ukerc.ac.uk 28 DECC (2010) 2050 Pathways Analysis [Online] Available at: www.gov.uk/government/publications/2050-pathways-analysis 29 National Grid (2013) 2013 UK Future Energy Scenarios [Online] Available at: www.nationalgrid.com/uk/Gas/OperationalInfo/TBE/Future+Energy+Scenarios/

GB electricity capacity margin 25
Appendix 1: List of abbreviations
CCGT Combined cycle gas turbine
DECC Department for Energy and Climate Change
EMR Electricity Market Reform
EU ETS European Union Emissions Trading Scheme
FIT – CfDs Feed-in tariffs / Contracts for Difference
GW Gigawatt (1,000,000,000 Watts)
IED Industrial Emissions Directive
LOLE Loss of load expectation
LCPD Large Combustion Plant Directive
MW Megawatt (1,000,000 Watts)
OCGT Open cycle gas turbine
OECD Organisation for Economic Cooperation and Development
ROCs Renewable Obligation Certificates
TEC Transmission entry capacity
GB electricity capacity margin 25

26 Royal Academy of Engineering
Appendix 2: Glossary of terms
Capacity margin The level by which available electricity generation capacity exceeds the maximum expected level of demand. Normally expressed as the percentage calculated by: Alternative definitions of ‘Total available capacity’ lead to alternative ways of expressing the capacity margin (see ‘Gross Capacity Margin’ and ‘De-rated capacity margin’).
Capacity mechanism A mechanism by which generators can be rewarded on a fixed-cost basis for making capacity available to be called on by the system operator at times of high demand and insufficient supply. The mechanism is argued to be necessary to finance such plants if they cannot gain sufficient remuneration from the energy-only market, due to their low total hours of operation and an insufficiently high electricity price during these hours.
De-rated capacity margin A measure of the capacity margin in which the total available capacity is ‘de-rated’ by technology-specific factors, reflecting the historical level of availability of each technology during the seasonal period being examined. The historic level of availability can account for unavailability caused by unplanned outages, planned maintenance as well as commercially driven unavailability.
Gross capacity margin A measure of the capacity margin in which the total available capacity is the total or ‘nameplate’ capacity of all generators, without ‘de-rating’ by technology specific factors according to historic availability.
Loss of load expectation A probabilistic measure of the amount of time in hours per year during which demand is expected to be greater than the generation available to supply.
Missing money The phenomenon whereby peaking plant cannot achieve sufficient remuneration for their investment from the energy-only market. The solutions to missing money are either to allow power prices to rise without intervention, or to provide a capacity mechanism.
Spark spread The difference between the price of gas and the price of electricity. In other words, the profit margin for gas-fired electricity generators.
26 Royal Academy of Engineering
capacity margin (%) = x 100total available capacity - peak demand
peak demand

GB electricity capacity margin 27
Appendix 3: List of interview participants
To inform the study, the Academy project working group sought the views of a range of industry participants and other expert stakeholders. The Academy project working group recorded the discussions and subsequently shared the written notes with the respective interviewees, to provide the opportunity for any inaccuracies or misrepresentations to be corrected. The discussions took place on the basis of the ‘Chatham House Rule’, according to which any views given could be referred to in the report, but not directly attributed to any individual or organisation.
The Academy gratefully acknowledges the contributions to this report of representatives of the following organisations:
Carlton PowerCentricaDepartment for Energy and Climate ChangeEDF EnergyEnergy PoolE.ONESBIImperial College LondonKiwi PowerMorgan StanleyNational GridOfgemRWE / NpowerScottish PowerSiemensSSE
GB electricity capacity margin 27

28 Royal Academy of Engineering
Appendix 4: Data and assumptions for scenario analysis
In order to illustrate the issues discussed in the report, we developed a simple set of scenarios to illustrate possible combinations of events and their effect on capacity margins, as discussed in the main report in Section 5.
ApproachThe approach was based on subtracting capacity from the most recent version of National Grid’s TEC register (18 June 2013) available at the time the analysis was undertaken.
We focused only on conventional capacity and did not include the contribution of renewables. This was to avoid the complicating questions of the appropriate de-rating factor to apply to renewables, and justified as one of the stress factors we wished to investigate was a low or zero wind event. We acknowledge that, as the contribution of renewables becomes increasingly large in future years, such a simplistic approach would be increasingly less justifiable.
A further simplification is that, with the exception of Carrington CCGT which is currently under construction, we have made no assumptions about the construction and commissioning of new capacity. This should not be taken as an indication that we expect or predict no new capacity to be built during the period; rather we are indicating how possible closures could create need for new capacity which, given favourable market and political conditions, we would expect to be forthcoming. Clearly it would be possible for renewables to make a contribution to this capacity requirement, even though they are not considered in this analysis.
There was some discussion within our interviews around the methodology for calculating de-rated capacity margins. In particular, the appropriate ‘de-rating’ factor applied to various different technology types was discussed (see Appendix 2, Glossary, for definitions). We noted that different choices about de-rating factors can have material effects on the calculation of the capacity margin. However, in this report, we did not have the scope to imitate the methodology applied in Ofgem’s Capacity Assessment using the same or alternative de-rating factors, or to directly contribute to the debate around what the de-rating factors should be. We therefore avoided presenting the discussion of our data in terms gross or de-rated capacity margins, instead seeking a simpler presentation of installed capacities, with the issues covered by de-rated margins dealt with separately.
In its Capacity Assessment Report, Ofgem uses historical availability over the winter period to calculate de-rating factors. A potential criticism of this approach is that the average availability throughout the season may not be indicative of the likely availability
28 Royal Academy of Engineering
GB electricity capacity margin 29
at winter peak, which is the main stress point. Historically based availability factors will include unplanned outages, but also planned maintenance and commercial unavailability. Most generators would plan their outages away from winter peak and would be likely to take commercial decisions to make their plant available during times of the highest prices. Because we are explicitly focusing on the winter peak demand, our analysis assumes full commercial availability. The analysis deals with the possibility of unplanned outages through the ‘outage scenario’ which is applied in each year. For wind, we assume zero output as one of the three ‘stress factors’ we are examining. In this way, we address the important issues which the de-rating methodology is intended to capture, in a more simple and transparent manner which focuses purely on the winter peak. As noted in the report, this way of looking at the data is purely intended to illustrate the most important near-term issues considered by this report in as transparent a manner as possible. It is not proposed as a fully fledged methodology to compare with that which underlies Ofgem’s Capacity Assessment, particularly given the longer-term expected level of contribution from wind power.
Our 2013 data include the 7.3 GW of LCPD closures that had occurred up to June 2013. They also include the reduction in capacity caused by the mothballing of CCGT capacity at Keadby and Peterhead.
Our data for the future years 2015 and 2019 are inevitably more speculative. Due to considerable uncertainties involved in predicting future generation investment decisions, we have not included any new build projects from any technology in either year, with the exception of Carrington CCGT which is under construction and due to come online in early 2016. The 2015 and 2019 data are developed purely by subtracting plant from the 2013 data on the basis of expected closures. It is almost certain that there will be some new build by 2019; hence these figures are not intended as a prediction that there will be no new build. Rather they should be seen as indicating the need for new build that will be created by expected plant closures, which, given favourable policy conditions, we would fully expect to be forthcoming.
The 2015 data further subtract from the 2013 data the remaining 4.2 GW of LCPD closures, and the 440MW closure of the final reactor at Wylfa.
The 2019 data further subtract from the 2015 data 5 GW coal, as an indication of potential closures resulting from the Industrial Emissions Directive (IED). 880 MW of CCGT are added which correspond to Carrington CCGT coming online in 2016.
The resulting installed capacity data for each year are given in Table A4.1. Although, for the reasons noted, we do not quote capacity margin figures in our analysis, the table also includes gross and de-rated capacity margins for comparison with other scenarios. The de-rated margins have been calculated using the same de-rating factors used for the reference scenario in Ofgem’s Electricity Capacity Assessment Report 2013.
GB electricity capacity margin 29
Appendix 4: Data and assumptions for scenario analysis
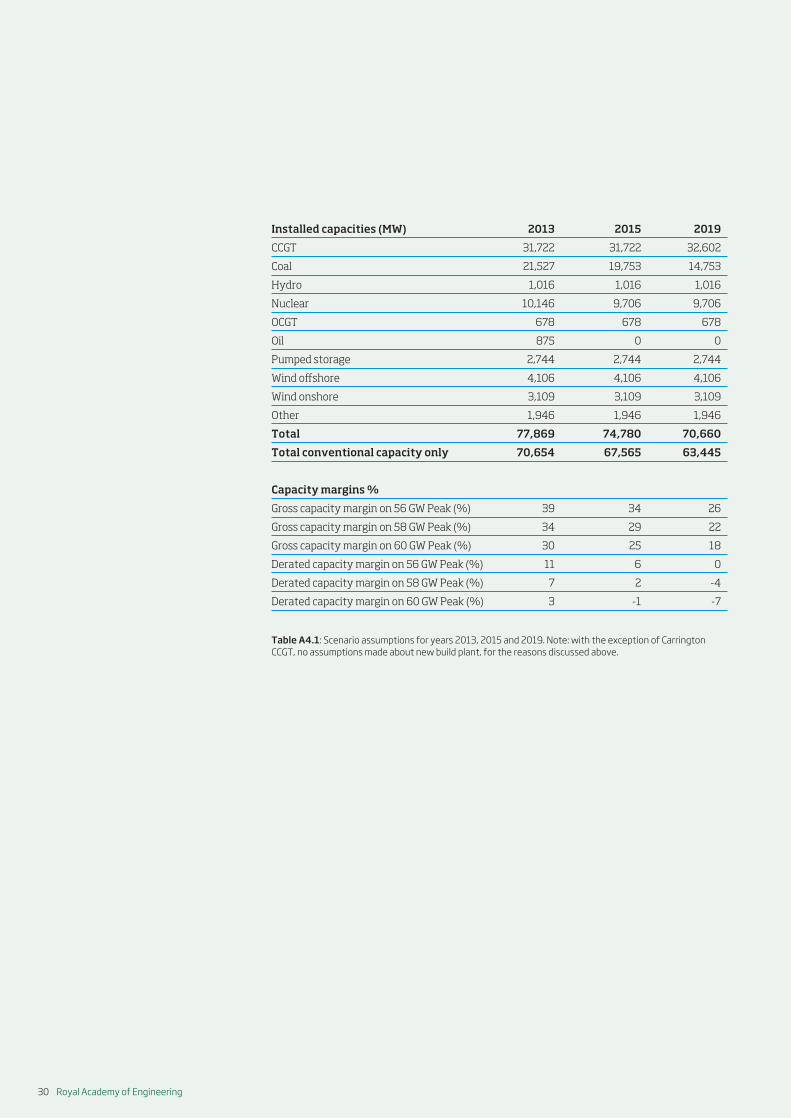
30 Royal Academy of Engineering30 Royal Academy of Engineering
Installed capacities (MW) 2013 2015 2019
CCGT 31,722 31,722 32,602
Coal 21,527 19,753 14,753
Hydro 1,016 1,016 1,016
Nuclear 10,146 9,706 9,706
OCGT 678 678 678
Oil 875 0 0
Pumped storage 2,744 2,744 2,744
Wind offshore 4,106 4,106 4,106
Wind onshore 3,109 3,109 3,109
Other 1,946 1,946 1,946
Total 77,869 74,780 70,660
Total conventional capacity only 70,654 67,565 63,445
Capacity margins %
Gross capacity margin on 56 GW Peak (%) 39 34 26
Gross capacity margin on 58 GW Peak (%) 34 29 22
Gross capacity margin on 60 GW Peak (%) 30 25 18
Derated capacity margin on 56 GW Peak (%) 11 6 0
Derated capacity margin on 58 GW Peak (%) 7 2 -4
Derated capacity margin on 60 GW Peak (%) 3 -1 -7
Table A4.1: Scenario assumptions for years 2013, 2015 and 2019. Note: with the exception of Carrington CCGT, no assumptions made about new build plant, for the reasons discussed above.

GB electricity capacity margin 31GB electricity capacity margin 31
Appendix 5: Project working group members
Chairman of the working groupDr John Roberts CBE, FREng
Steering groupDr Paul Golby CBE, FREngProfessor John Loughhead OBE, FREng
SecretariatDr Alan WalkerNick Hughes
ReviewersDr Dame Sue Ion FREngProfessor Roger Kemp FREng

32 Royal Academy of Engineering
As the UK’s national academy for engineering, we bring together the most successful and talented engineers from across the engineering sectors for a shared purpose: to advance and promote excellence in engineering.
We provide analysis and policy support to promote the UK’s role as a great place from which to do business.
We take a lead on engineering education and we invest in the UK’s world class research base to underpin innovation. We work to improve public awareness and understanding of engineering. We are a national Academy with a global outlook.
The Academy’s work programmes for 2011 to 2015 are driven by four strategic challenges:
Drive faster and more balanced economic growth
Foster better education and skills
Lead the profession
Promote engineering at the heart of society
Royal Academy of EngineeringPrince Philip House3 Carlton House TerraceLondon SW1Y 5DGTel: +44 (0)20 7766 0600www.raeng.org.ukRegistered charity number 293074