Embed Size (px)
Citation preview
1
Gatwick Airport Flight Performance Team
Quarterly report for the period July to September 2013
About this report
This report is produced by the Gatwick Flight Performance Team (FPT). This team is responsible for
recording, investigating and responding to aircraft noise enquiries as well as monitoring airline compliance
to noise mitigation measures as detailed in the UK Aeronautical Information Publication (AIP). This
department also actively engages with the airlines to improve their adherence to the above noise
mitigation measures and in addition manages the night-time restrictions on flying at Gatwick.
This report contains detailed data on aircraft activity at Gatwick including the adherence to the noise
mitigation measures detailed in the UK AIP, a report on night flying during the quarter, and an analysis of
noise complaints received during the period.
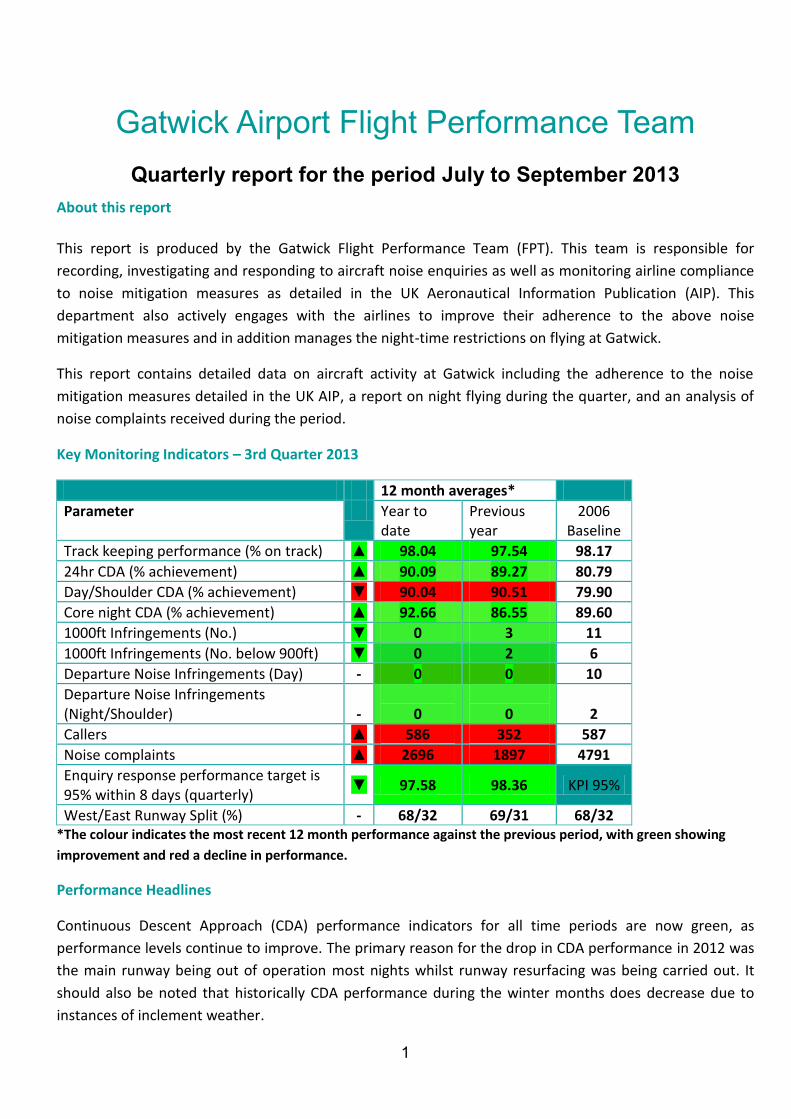
Key Monitoring Indicators – 3rd Quarter 2013
12 month averages*
Parameter Year to date
Previous year
2006 Baseline
Track keeping performance (% on track) ▲ 98.04 97.54 98.17
24hr CDA (% achievement) ▲ 90.09 89.27 80.79
Day/Shoulder CDA (% achievement) ▼ 90.04 90.51 79.90
Core night CDA (% achievement) ▲ 92.66 86.55 89.60
1000ft Infringements (No.) ▼ 0 3 11
1000ft Infringements (No. below 900ft) ▼ 0 2 6
Departure Noise Infringements (Day) - 0 0 10
Departure Noise Infringements (Night/Shoulder) -
0
0
2
Callers ▲ 586 352 587
Noise complaints ▲ 2696 1897 4791
Enquiry response performance target is 95% within 8 days (quarterly)
▼ 97.58 98.36 KPI 95%
West/East Runway Split (%) - 68/32 69/31 68/32 *The colour indicates the most recent 12 month performance against the previous period, with green showing
improvement and red a decline in performance.
Performance Headlines
Continuous Descent Approach (CDA) performance indicators for all time periods are now green, as
performance levels continue to improve. The primary reason for the drop in CDA performance in 2012 was
the main runway being out of operation most nights whilst runway resurfacing was being carried out. It
should also be noted that historically CDA performance during the winter months does decrease due to
instances of inclement weather.
2
It is encouraging that track keeping performance has shown another small improvement on the previous
year’s performance. It should be noted that the Noise Preferential Routes for departing aircraft were
designed in the late 1960s with aircraft of that era in mind. Some of these departure routes have turns of
90 and 180⁰ which were designed with older and slower types in mind. Today’s aircraft are faster with a ⁰
much greater climb rate. Although track deviations occur on all routes, it is the 26 Lambourne ‘wrap
around’ route that has by far the largest proportion, as the tight turn is much harder to negotiate with
modern aircraft types. Further details on track keeping will follow later in this report.
As part of our continuing commitment to increase on track performance the FPT also continues to engage
with the airlines directly and through the Flight Operations Performance and Safety Committee on a range
of initiatives.
During this period the number of complaints has increased by about 40% compared to the previous twelve
months and the number of individual callers to the Flight Performance Team has increased by
approximately 65%.
The postcode areas with the greatest number of enquiries this quarter were, Lingfield, Edenbridge (which
includes surrounding villages) and East Grinstead. A breakdown of complaints is shown later in this report.
Airport Operations
During the quarter, there were a total of 75262 fixed wing aircraft movements at Gatwick, an increase in
traffic of about 3% compared to the same period in 2012. The direction of operation is determined by wind
direction and this quarter was split 65% on the westerly runway and 35% on the easterly runway. The
rolling 20 year average for the split in runway usage is approximately 70% westerly and 30% easterly.
Northern Runway (26R/08L) usage
Although Gatwick has the main runway and the ‘reserve’ or northern runway, they cannot be operated
simultaneously.
The northern runway is normally only utilised during the night when maintenance on the main runway is
planned. During these three months there were a total of 700 movements from the northern runway.
Would you like to know more about Aircraft Noise or track a flight?
To track aircraft, see noise readings or make a complaint about aircraft noise at Gatwick you can visit our
website: www.gatwickairport.com/noise
The website provides detailed maps on aircraft traffic around the airport as well as useful information on
noise and statistics on aircraft movements. It also details the work we undertake with others in the aviation
industry to try and alleviate the impact of our operations on both the local and wider community

3
Community Noise Monitoring
The Gatwick Noise Monitoring Group is a forum where Local Authority technical experts and independent
consultants meet with Gatwick Airport Ltd to discuss the location of mobile noise monitors, the duration
they are to be onsite and to review and verify the data. This group makes recommendations to the Noise &
Track Monitoring Advisory Group (NATMAG) who are responsible for deciding the placement of monitors in
the local community. Mobile noise monitors are currently deployed at sites in Lingfield, Rusper, Okewood
Hill, Hever, Domewood, Billingshurst and Bidborough.
Runway Direction
The following graph represents the direction of runway operation at Gatwick. Aircraft operating in a
westerly direction take off towards the west and land from the east. Aircraft operating in an easterly
direction take off towards the east and land from the west. Compared to the last few years this summer
has seen a marked shift towards more easterly operations. This has also coincided with the best summer
weather since 2006 (MET Office).
The Aeronautical Information Publication
An Aeronautical Information Publication (or AIP) is defined by the International Civil Aviation Organisation
(ICAO) as a publication issued by or with the authority of a state and containing aeronautical information of
a lasting character essential to air navigation.
0.00%
10.00%
20.00%
30.00%
40.00%
50.00%
60.00%
70.00%
80.00%
90.00%
100.00%
Runway modal split %
Westerly Easterly

4
It is designed to be a manual containing thorough details of regulations, procedures and other information
pertinent to flying aircraft in the particular country to which it relates. It is usually issued by or on behalf of
the respective civil aviation administration.
The structure and contents of AIPs are standardized by international agreement through ICAO. AIPs
normally have three parts - GEN (general), ENR (en route) and AD (aerodromes).
The Gatwick Aerodrome AIP contains details regarding the noise mitigation measures in place and
adherence to these is reported in this section.
Adherence to noise mitigation measures as detailed in the Gatwick AIP
Each element of this report is preceded where applicable by the relevant Aeronautical Information
Publication (AIP) reference and summary text detailing the purpose of the requirement. Data is then
presented on current performance.
It should be noted that Gatwick is 202ft above mean sea level and the NTK system measures height relative
to Gatwick elevation and not sea level.
References in the AIP are usually above sea level (quoted as Gatwick QNH) and therefore need to be
reduced by 202ft to be comparable with heights as measured by the Noise and Track keeping system. For
example the requirement to join the ILS at 3000ft would equate to 2798ft in the Noise and Track keeping
system.
No account is taken of the variability of heights as measured by the radar which, depending on the distance
from the radar head, can be +/- 200ft from that indicated. This is obviously allowed for by NATS when
managing operations.
FOR THE PURPOSES OF THIS REPORT ANY REFERENCE TO HEIGHT SHOULD BE READ AS ABOVE
AIRFIELD ELEVATION UNLESS OTHERWISE STATED.
ALL DATA CONTAINED WITHIN THIS REPORT SHOULD BE CONSIDERED IN LIGHT OF THE PRECEDING
TEXT AND THE COMMENTARY THAT FOLLOWS.
5
DEPARTURES - INITIAL CLIMB PERFORMANCE
EGKK AD 2.21 (3 (1) ). After take-off the aircraft shall be operated in such a way that it is at a height of not
less than 1000 ft aal (above airfield level) at 6.5 km from start of roll as measured along the departure track
of the aircraft. This is to ensure departing aircraft achieve at least that climb gradient in order to reduce the
impact on the ground.
Comment:
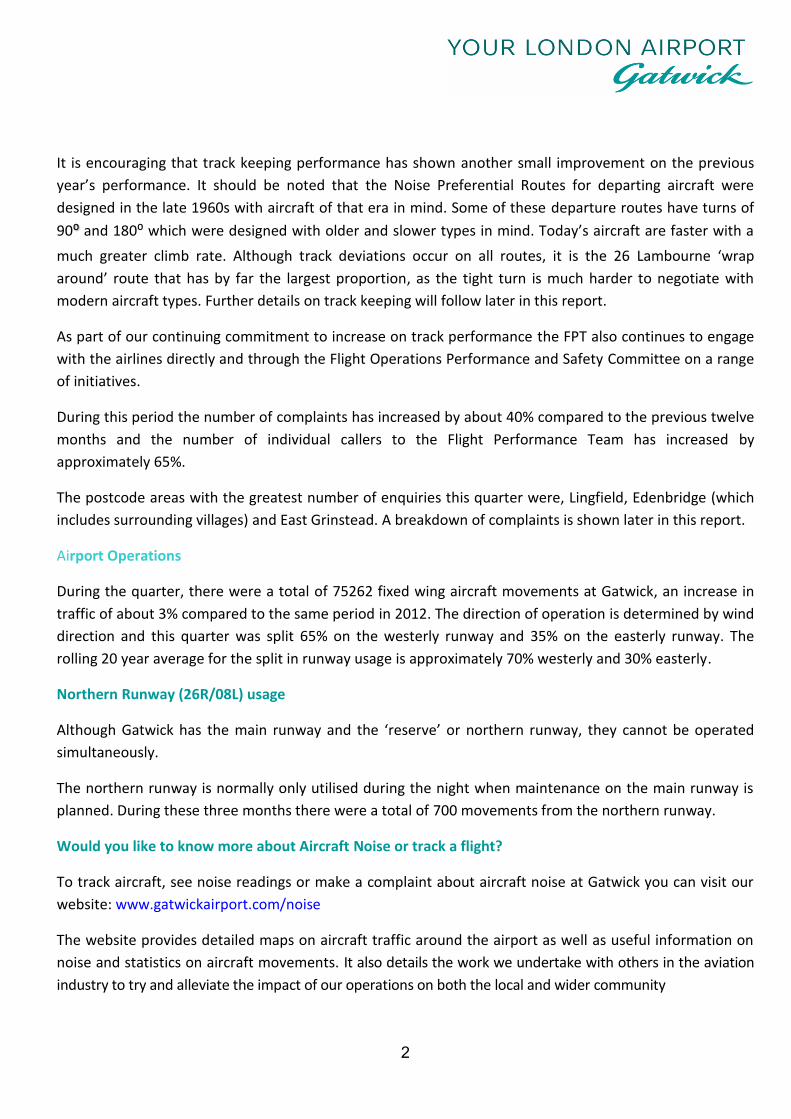
There were no infringements of the 1000ft rule during this quarter.
Historically the summer months are typically the peak period for aircraft failing to meet the 1,000ft
requirement primarily due to the warmer weather, which reduces aircraft climb performance.
1000ft Infringement Table
Year Total
Infringements Year
Total Infringements
Year Total
Infringements
2005 28 2008 11 2011 3
2006 11 2009 22 2012 2
2007 26 2010 6 2013 0
Graph illustrating 1000ft Performance
0
2
4
6
8
10
12
Jan Feb Mar Apr May Jun Jul Aug Sep Oct Nov Dec
Air
cra
ft b
elo
w 1
,000ft
Month
Initial Climb Performance
2004 2005 2006 2007 2008 2009 2010 2011 2012 2013
6
DEPARTURES - NOISE INFRINGEMENTS
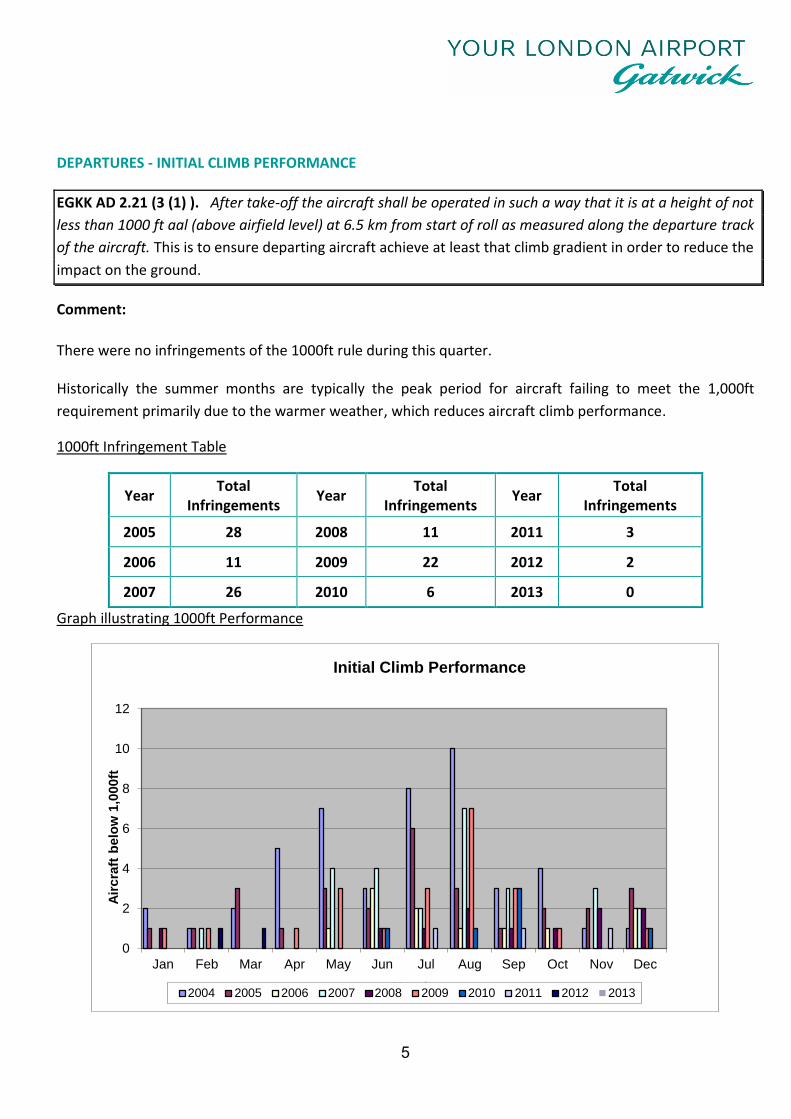
Departure Noise Limits (Daytime)
EGKK AD 2.21(3(3)) Subject to sub-paragraphs (5) and (6) below, any aircraft shall, after take-off, be
operated in such a way that it will not cause more than 94 dBA Lmax by day 0700 to 2300 hours local time)
as measured at any noise monitoring terminal at any of the sites referred to in sub-paragraph (2). This is to
ensure that departing aircraft do not exceed the stated level during the day.
Year Number of Day Infringements
Year Number of Day Infringements
Year Number of Day Infringements
2005 29 2008 2 2011 0
2006 9 2009 0 2012 0
2007 13 2010 0 2013 0
Comment:
There were no infringements of the noise limits during the day time period during the quarter.
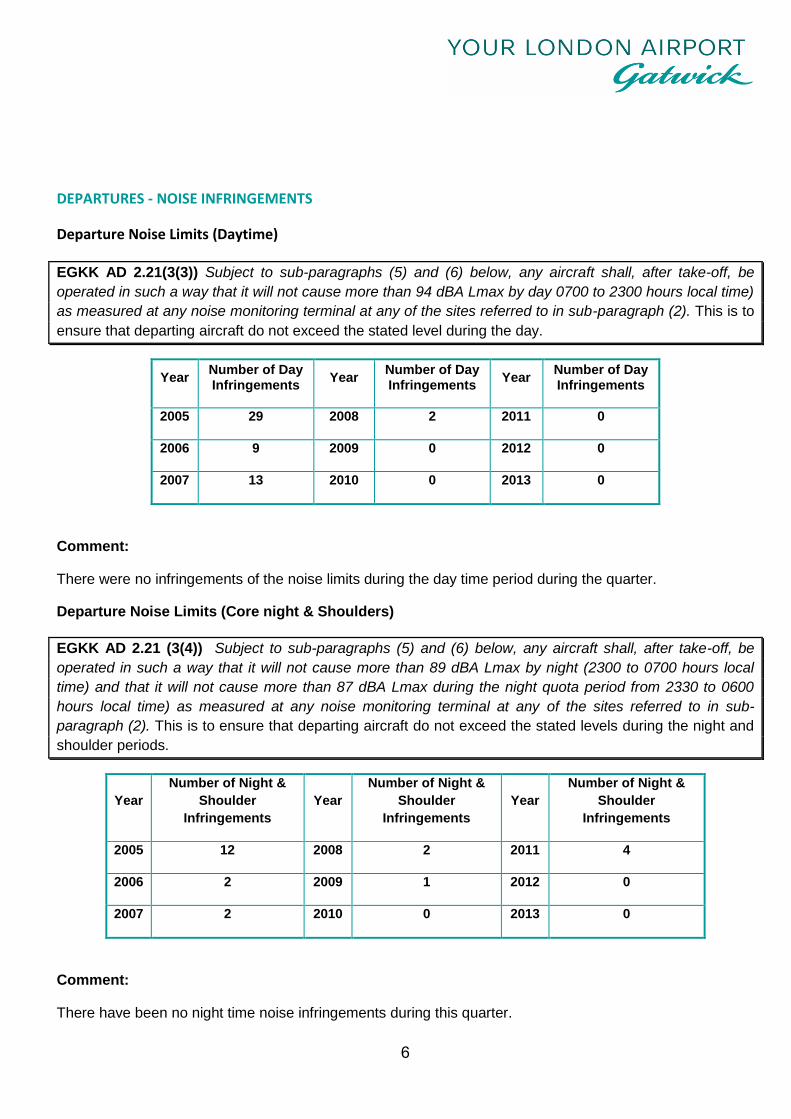
Departure Noise Limits (Core night & Shoulders)
EGKK AD 2.21 (3(4)) Subject to sub-paragraphs (5) and (6) below, any aircraft shall, after take-off, be
operated in such a way that it will not cause more than 89 dBA Lmax by night (2300 to 0700 hours local
time) and that it will not cause more than 87 dBA Lmax during the night quota period from 2330 to 0600
hours local time) as measured at any noise monitoring terminal at any of the sites referred to in sub-
paragraph (2). This is to ensure that departing aircraft do not exceed the stated levels during the night and
shoulder periods.
Year
Number of Night &
Shoulder
Infringements
Year
Number of Night &
Shoulder
Infringements
Year
Number of Night &
Shoulder
Infringements
2005 12 2008 2 2011 4
2006 2 2009 1 2012 0
2007 2 2010 0 2013 0
Comment:
There have been no night time noise infringements during this quarter.

7
DEPARTURES - TRACK KEEPING
All jet aircraft leaving Gatwick Airport should follow flight paths known as Noise Preferential Routes (NPRs) up to a height of 3,000ft or 4,000ft depending on the route. NPRs were set by the Department for Transport (DfT) in the 1960s and were designed to avoid over flight of built-up areas where possible.
They lead from the runway to the main UK air traffic routes, and form the first part of the Standard Instrument Departure routes (SIDs). The routes have not been altered since they were established to give people the predictability of knowing where noise from departing planes will be heard. Their location remains the responsibility of the Government. As an airport operator, Gatwick Airport Ltd has no authority to change them. Any significant changes to the NPR’s would be subject to a public consultation exercise.
Air Traffic Control (ATC) are responsible for the routing of aircraft once airborne and when 3,000 or 4,000ft
has been reached they may give a flight a more direct heading (known as vectoring) off the route. This is
subject to certain factors including weather conditions or other traffic in the vicinity.
An NPR is a corridor 3 kilometres wide and aircraft are not obliged to follow any particular track within it. As
long as aircraft remain within the corridor boundaries they are deemed to be on track. A map illustrating the
Noise Preferential Routes at Gatwick is available on our website.www.gatwickairport.com/noise
Flights leaving the route below the required height are automatically tagged and details sent to the airline
for investigation. Our Flight Operations Performance & Safety Committee regularly review track keeping
performance.
Comment: The table below shows track keeping performance over the previous 12 month period. The on
track performance has decreased to 97.10% from the 98.09% performance rate measured in the 2nd
quarter. On a positive note the rolling 12 month year on year period on track performance stands at 98.04%
as opposed to 97.54% for the 12 months ended Sep 2012.
Total Westerly Easterly
Month Deviations Departures %
Deviations Deviations Departures %
Deviations Deviations Departures %
Deviations
Jul-12 459 12214 3.76% 438 10613 4.13% 21 1601 1.31%
Aug-12 506 12524 4.04% 478 10272 4.65% 28 2250 1.24%
Sep-12 370 11713 3.16% 292 10210 2.86% 78 1498 5.21%
Oct-12 202 10881 1.86% 186 6079 3.06% 16 4787 0.33%
Nov-12 157 8241 1.91% 145 6699 2.16% 12 1542 0.78%
Dec-12 134 8597 1.56% 122 7139 1.71% 12 1458 0.82%
Jan-13 70 8272 0.85% 60 5087 1.18% 10 3185 0.31%
Feb-13 66 7850 0.84% 49 3505 1.40% 17 4345 0.39%
Mar-13 73 9234 0.79% 35 1823 1.92% 38 7411 0.51%
Apr-13 194 10151 1.91% 182 5974 3.05% 13 4177 0.31%
May-13 167 11463 1.46% 155 8409 1.84% 12 3054 0.39%
Jun-13 271 11583 2.34% 243 7103 3.42% 28 4480 0.63%
Jul-13 381 12598 3.02% 331 6299 5.25% 50 6299 0.79%
Aug-13 395 12909 3.06% 374 9868 3.79% 21 3040 0.69%
Sep-13 313 12113 2.58% 296 8292 3.57% 17 3821 0.44%

8
DEPARTURES - OVER CONGESTED AREAS
The WIZAD Noise Preferential Route
EGKK AD 2.21 (8) (c) The ATC clearance via Mayfield specified in the second column of the table will not
be available between 2300 hours and 0700 hours local time. Aircraft following the Noise Preferential
Routing which relates to that clearance shall not fly over Crawley, Crawley Down or East Grinstead. This is
to avoid aircraft noise from departing aircraft over areas of high population at night on the 26WIZAD NPR.
Comment: This quarter there have been no departures during the restricted period, on the ’26 WIZAD’
Noise Preferential Route.
Map illustrating Crawley town boundary and Noise Preferential Route 26 Wizad
Overflight of Crawley and Horley
EGKK AD 2.21 (9) After take-off the aircraft shall avoid flying over the congested areas of Horley and
Crawley This is to avoid aircraft noise from departing aircraft over areas of high population
Comment: During this monitoring period there was one departing aircraft that over-flew Crawley town. This was
an Easyjet Airbus A319 on 2 August 2013, which overflew the town above 9000 feet, which was diverted from
the normal route due to Cumulonimbus (storm cloud) activity along the intended route.

9
Map below shows the track of the departing flight passing overhead Crawley
Map below illustrates the track density of aircraft overflying Horley during the three month period

10
Breakdown showing the analysis of Horley overflight
Month Departures on 26LAM
Horley gate
% through Horley gate
Month Departures on 26LAM
Horley gate
% through Horley gate
Month Departures on 26LAM
Horley gate
% through Horley gate
Jan-11 2270 79 3.48% Jan-12 2835 109 3.84 Jan-13 2196 67 3.05
Feb-11 2721 76 2.79% Feb-12 2326 99 4.26 Feb-13 1447 101 6.98
Mar-11 1540 55 3.57% Mar-12 2176 84 3.86 Mar-13 1427 70 4.91
Apr-11 1841 43 2.34% Apr-12 457 14 3.06 Apr-13 2499 78 3.00
May11 3980 98 2.46% May12 2634 140 5.32 May13 3545 186 5.25
Jun-11 3675 92 2.50% Jun-12 3407 76 2.23 Jun-13 3114 153 4.91
Jul-11 3262 127 3.89% Jul-12 4579 151 3.30 Jul-13 2777 78 2.81
Aug11 4319 98 2.27% Aug12 4493 109 2.43 Aug13 4157 152 3.66
Sep11 4321 65 1.50% Sep12 4374 147 3.36 Sep13 3590 185 5.15
Oct 11 3487 101 2.90% Oct 12 2673 55 2.06 Oct 13
Nov11 1753 28 1.60% Nov12 2966 131 4.42 Nov13
Dec11 3903 162 4.15% Dec12 2989 142 4.75 Dec13
*April 12 – radar data was corrupted one week of data available
Comment:
The FPT monitors all departing aircraft that overfly the town of Horley with details also being passed to Air Traffic Control so that they can continue to review how they direct traffic over the area.
ARRIVALS – CONTINUOUS DESCENT APPROACHES (CDA)
EGKK AD 2.21 (10) Where the aircraft is approaching the aerodrome to land it shall commensurate with it
ATC clearance minimise noise disturbance by the use of continuous decent and low power, low drag,
operating procedures (referred to in Detailed Procedures for descent clearance in AD (2-EGKK-1-17).
Where the use of these procedures is not practicable, the aircraft shall maintain as high an altitude as
possible. In addition, when descending on initial approach including in the closing heading, and on
intermediate and final approach, thrust reductions should be achieved where possible by maintaining a
'clean' aircraft configuration and by landing with reduce flaps, provided that in all the circumstances of the
flight this is consistent with safe operation of the aircraft. This is to avoid prolonged periods of level flight
and keep aircraft as high as possible for as long as possible.
CDA data is measured over three time periods, the core night period (2330-0600), the day and
shoulder periods (06:00 – 2330) and the 24hour period.
CORE NIGHT PERIOD
During the quarter the core night-time CDA achievement rate was 95.45%, an increase from the 93.12%
recorded in the previous quarter. As the majority of the main runway rehabilitation has been completed we
are now seeing a significant improvement in the night time CDA performance. As previously recognised in
the historical statistics the winter period typically sees a reduced level of performance.
Breakdown of the core night time period

11
Month All Arrivals 08 Easterly Arrivals 26 Westerly Arrivals
Total Non CDA CDA Total Non CDA CDA Total Non CDA CDA
Jul-12 1517 185 87.80% 271 44 83.76% 1246 141 88.68%
Aug-12 1551 262 83.11% 327 63 80.73% 1224 199 83.74%
Sep-12 1382 225 83.72% 192 41 78.65% 1190 184 84.54%
Oct-12 986 143 85.50% 387 56 85.53% 599 87 85.48%
Nov-12 257 35 86.38% 42 10 76.19% 215 25 88.37%
Dec-12 280 38 86.43% 37 5 86.49% 243 33 86.42%
Jan-13 285 21 92.63% 104 9 91.35% 181 12 93.37%
Feb-13 257 33 87.16% 162 21 87.04% 95 12 87.37%
Mar-13 283 39 86.22% 235 36 84.68% 48 3 93.75%
Apr-13 696 43 93.82% 306 18 94.12% 390 25 93.59%
May-13 1049 78 92.56% 290 23 92.07% 759 55 92.75%
Jun-13 1320 90 93.18% 543 47 91.34% 777 43 94.47%
Jul-13 1463 66 95.49% 603 25 95.85% 860 41 95.23%
Aug-13 1586 64 95.96% 343 17 95.04% 1243 47 96.22%
Sep-13 1368 71 94.81% 391 26 93.35% 977 45 95.39%
Core night-time compliance graph
DAYTIME AND SHOULDER PERIOD
0.00%
10.00%
20.00%
30.00%
40.00%
50.00%
60.00%
70.00%
80.00%
90.00%
100.00%
Jul-1
2
Au
g-1
2
Se
p-1
2
Oct-
12
Nov-1
2
Dec-1
2
Jan
-13
Fe
b-1
3
Ma
r-13
Ap
r-13
Ma
y-1
3
Jun
-13
Jul-1
3
Au
g-1
3
Se
p-1
3
Month
Core night-time CDA compliance rate

12
The average daytime and shoulder period achievement rate for this period is 92.24% compared to 88.39%
for the same period in 2013. The twelve month period to the end of September 2013 shows an achievement
rate of 90.08% compared to 89.51% for the same period ending September 2012.
Breakdown of the daytime and shoulder time period with graph
Total Easterly Westerly
Month Total Non CDA
Jul-12 10715 1122
CDA Total Non CDA CDA Total Non CDA
CDA
Aug-12 10961 1118 89.53% 1333 133 90.02% 9382 989 89.46%
Sep-12 10334 1475 89.80% 1881 207 89.00% 9080 911 89.97%
Oct-12 9909 1217 85.73% 1198 284 76.29% 9136 1191 86.96%
Nov-12 7979 912 87.72% 4321 644 85.10% 5588 573 89.75%
Dec-12 8331 964 88.57% 1416 153 89.19% 6563 759 88.44%
Jan-13 7971 780 88.43% 1390 189 86.40% 6941 775 88.83%
Feb-13 7592 855 90.21% 3085 359 88.36% 4886 421 91.38%
Mar-13 8252 1138 88.74% 4294 537 87.49% 3298 318 90.36%
Apr-13 9326 961 86.21% 6478 939 85.50% 1774 199 88.78%
May-13 10370 905 89.70% 3980 496 87.54% 5349 465 91.31%
Jun-13 10259 919 91.27% 2826 279 90.13% 7544 626 91.70%
Jul-13 11057 908 91.04% 4009 446 88.88% 6250 473 92.43%
Aug-13 11220 866 91.79% 5394 552 89.77% 5663 356 93.71%
Sep-13 10695 783 92.28% 2691 272 89.89% 8529 594 93.04%
24 HOUR PERIOD
0%
10%
20%
30%
40%
50%
60%
70%
80%
90%
100%
Jul-1
2
Au
g-1
2
Se
p-1
2
Oct-
12
Nov-1
2
Dec-1
2
Jan
-13
Fe
b-1
3
Ma
r-13
Ap
r-13
Ma
y-1
3
Jun
-13
Jul-1
3
Au
g-1
3
Se
p-1
3
Month
Gatwick Day & Shoulder CDA Achievement (0600 - 2330) with quarterly trend line
13
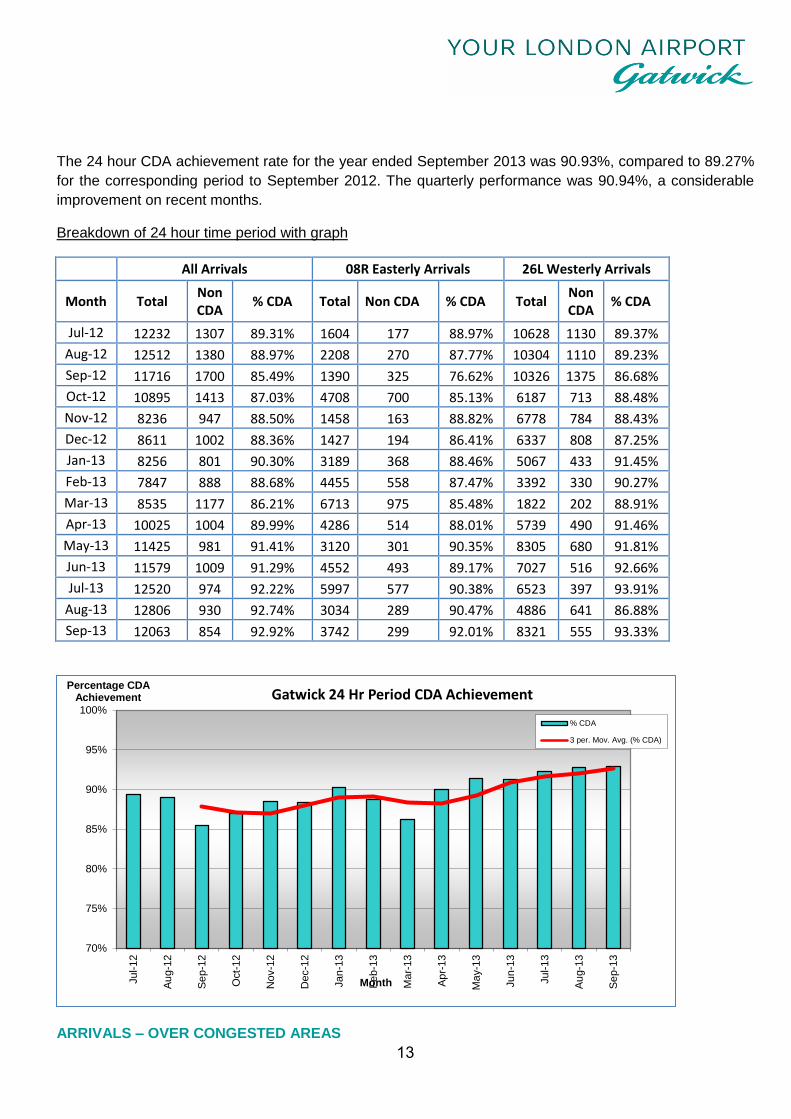
The 24 hour CDA achievement rate for the year ended September 2013 was 90.93%, compared to 89.27%
for the corresponding period to September 2012. The quarterly performance was 90.94%, a considerable
improvement on recent months.
Breakdown of 24 hour time period with graph
All Arrivals 08R Easterly Arrivals 26L Westerly Arrivals
Month Total Non CDA
% CDA Total Non CDA % CDA Total Non CDA
% CDA
Jul-12 12232 1307 89.31% 1604 177 88.97% 10628 1130 89.37%
Aug-12 12512 1380 88.97% 2208 270 87.77% 10304 1110 89.23%
Sep-12 11716 1700 85.49% 1390 325 76.62% 10326 1375 86.68%
Oct-12 10895 1413 87.03% 4708 700 85.13% 6187 713 88.48%
Nov-12 8236 947 88.50% 1458 163 88.82% 6778 784 88.43%
Dec-12 8611 1002 88.36% 1427 194 86.41% 6337 808 87.25%
Jan-13 8256 801 90.30% 3189 368 88.46% 5067 433 91.45%
Feb-13 7847 888 88.68% 4455 558 87.47% 3392 330 90.27%
Mar-13 8535 1177 86.21% 6713 975 85.48% 1822 202 88.91%
Apr-13 10025 1004 89.99% 4286 514 88.01% 5739 490 91.46%
May-13 11425 981 91.41% 3120 301 90.35% 8305 680 91.81%
Jun-13 11579 1009 91.29% 4552 493 89.17% 7027 516 92.66%
Jul-13 12520 974 92.22% 5997 577 90.38% 6523 397 93.91%
Aug-13 12806 930 92.74% 3034 289 90.47% 4886 641 86.88%
Sep-13 12063 854 92.92% 3742 299 92.01% 8321 555 93.33%
ARRIVALS – OVER CONGESTED AREAS
70%
75%
80%
85%
90%
95%
100%
Jul-1
2
Au
g-1
2
Se
p-1
2
Oct-
12
Nov-1
2
Dec-1
2
Jan
-13
Fe
b-1
3
Ma
r-13
Ap
r-13
Ma
y-1
3
Jun
-13
Jul-1
3
Au
g-1
3
Se
p-1
3
Percentage CDA Achievement
Month
Gatwick 24 Hr Period CDA Achievement
% CDA
3 per. Mov. Avg. (% CDA)

14
AD 2-EGKK1-12 (11)
Before landing at the aerodrome the aircraft shall maintain as high an altitude as practical and shall not fly
over the congested areas of Crawley, East Grinstead, Horley and Horsham at an altitude of less than 3000ft
(Gatwick QNH) nor over the congested area of Lingfield at an altitude of less than 2000ft (Gatwick QNH). NB. 2000 ft – (202ft (airfield elevation) + 100ft (radar/ILS tolerance)) = 1698ft on ANOMS.
Comment:
Aircraft tracks were analysed for July, August and September 2013 and there was a single flight that
passed over the western edge of Horsham. However this was a calibration flight by a small propeller driven
aircraft operated by the CAA. Calibration checks are a periodic safety requirement for all UK airports and
the light aircraft that carry them out are held at an altitude lower than the commercial traffic to avoid conflict.
A gate at 7 nautical miles (nm) from touchdown is normally used to analyse tracks over the Lingfield area.
There was a total of 21483 arrivals that passed through this gate, of which 1 (>0.01%) was at a height of
less than 1698 feet.
EGKK AD 2.21 (13 (a)) Where the aircraft is using the ILS in IMC or VMC it shall not descend below 2000 ft (Gatwick QNH) before intercepting the glide path, nor thereafter fly below the glide path. This is aimed at keeping aircraft as high as possible for as long as possible.
15
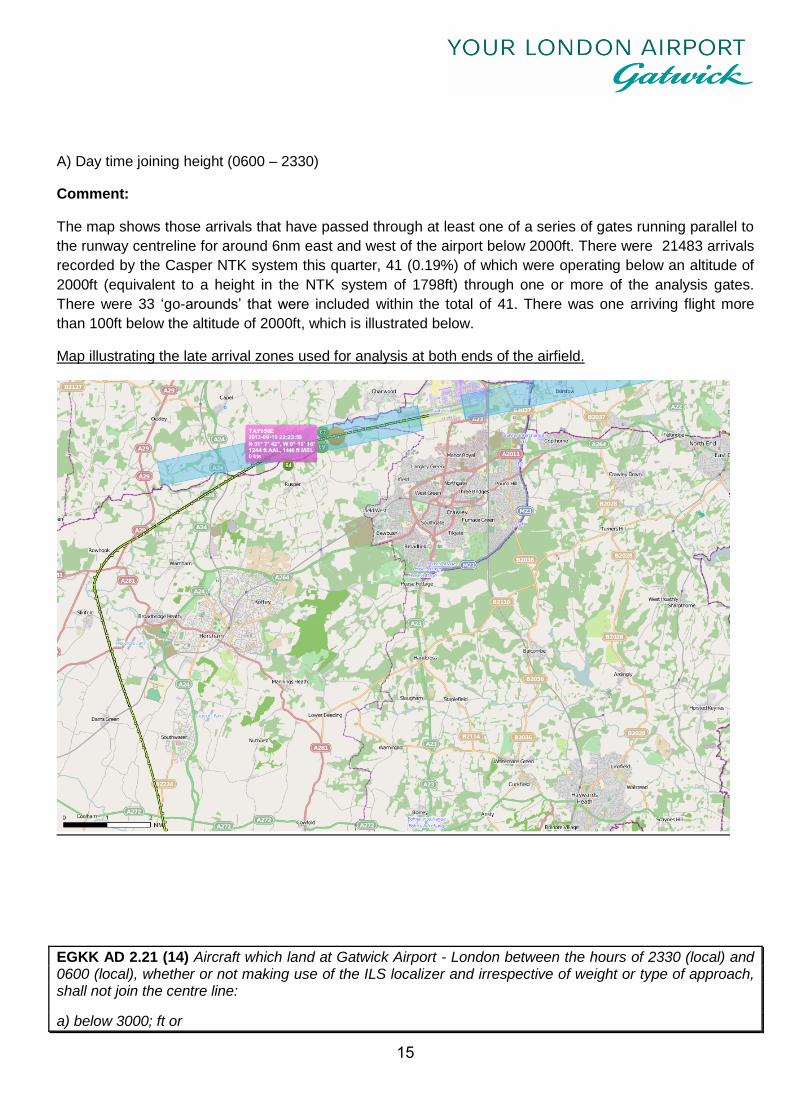
A) Day time joining height (0600 – 2330)
Comment:
The map shows those arrivals that have passed through at least one of a series of gates running parallel to
the runway centreline for around 6nm east and west of the airport below 2000ft. There were 21483 arrivals
recorded by the Casper NTK system this quarter, 41 (0.19%) of which were operating below an altitude of
2000ft (equivalent to a height in the NTK system of 1798ft) through one or more of the analysis gates.
There were 33 ‘go-arounds’ that were included within the total of 41. There was one arriving flight more
than 100ft below the altitude of 2000ft, which is illustrated below.
Map illustrating the late arrival zones used for analysis at both ends of the airfield.
EGKK AD 2.21 (14) Aircraft which land at Gatwick Airport - London between the hours of 2330 (local) and 0600 (local), whether or not making use of the ILS localizer and irrespective of weight or type of approach, shall not join the centre line:
a) below 3000; ft or

16
b) closer than 10 nm from touchdown.
This aims to keep aircraft higher for longer and avoid overflying areas en route to the ILS below 3000ft.
B) Night joining height & distance
A change in the NTK system introduced in June 2007 caused a corresponding rise in aircraft joining below
3000ft, however this was not the reason. Previously only aircraft below 2598ft at 10nm would have been
recorded which takes account of the 202ft elevation of Gatwick and the 200ft tolerance of the radar
equipment. This metric is primarily used by NATS to ensure compliance and in allowing for these tolerances
it is reasonable for a controller to assume that if an aircraft displays an altitude of 2800ft on their system it is
compliant with the 3000ft requirements. The same aircraft would be at 2598ft above the airfield as
displayed on the Casper NTK system (or any NTK) system. Since June 2007 statistics have only taken
account of the airfield elevation and consequently any aircraft below 2798ft at 10nm has been flagged.
JOINING POINT GRAPH
GO - AROUNDS
A go-around is a procedure adopted when an arriving aircraft on final approach aborts landing by applying
take off power and climbing away from the airport. It is a set procedure to be followed by the flight crew in
0
5
10
15
20
25
Ju
l-1
2
Au
g-1
2
Se
p-1
2
Oct-
12
No
v-1
2
De
c-1
2
Ja
n-1
3
Fe
b-1
3
Mar-
13
Ap
r-13
May-1
3
Ju
n-1
3
Ju
l-1
3
Au
g-1
3
Se
p-1
3
Month
Night Joining Point
% Joining at less than 10nm
% Joining below 3000ft (measured to2598ft)% Joining below 3000ft (measured to2798ft)

17
the event of an aircraft being unable to land. The procedure is published so that Air Traffic Control (ATC)
and the pilots can anticipate where the aircraft will go following the decision to go-around.
The number and reasons for go-arounds are routinely discussed at FLOPSC meetings and Pilot Forums.
All parties are focussed on minimising the number of occasions when a go around is required but expect
some to occur given the fact that Gatwick is a busy single runway airport. It should be stated that there are
well established standard procedures which both pilots and controllers are trained in and are familiar with.
Gatwick Airport Ltd as the airport operator actively encourages airlines operating at the airport to fly to the
best possible environmental standards. However safety must and always will be the number one priority.
NATS currently record go-arounds under one of the following causal factors
Go Around Statistics 2003 - 2013
0
10
20
30
40
50
60
UnstableApproach
RunwayOccupied
AbortedTake Off
ATCSpacing
IRVR FOD Birdstrike TechnicalProblem
Cabin NotSecure
Other
Go Around reason July - September 2013

18
Year Total Total Arrivals % of Arrivals
2003 312 120854 0.26
2004 344 124665 0.28
2005 450 129509 0.35
2006 405 130954 0.31
2007 434 133271 0.33
2008 359 131858 0.35
2009 455 125861 0.36
2010 364 120263 0.30
2011 386 125541 0.31
2012 520 123408 0.42
2013 342 96359 0.35
Comment: The utilisation of the northern runway during this time was likely to have been a contributing
factor to the high number of go arounds during 2012.
NIGHT FLIGHTS
Introduction
The Secretary of State in exercise of his powers under Section 78 of the Civil Aviation Act 1982 has
imposed restrictions at Gatwick Airport on aircraft operating at night. These restrictions are in place to limit
and mitigate noise disturbance from aircraft operating at night and to prohibit aircraft of specified
descriptions from operating, also to limit the number of occasions on which other aircraft may take off or
land.
The night flying restrictions are divided into summer and winter seasons which coincide with the start and
end of British Summer Time. They consist of a movement limit and a quota count system. The quota count
(QC) means that points are allocated to different aircraft types according to how noisy they are. The noisier
the aircraft type, the higher the points allocated. This provides an incentive for airlines to use quieter aircraft
types. Aircraft are certified by the International Civil Aviation Organisation according to the noise they
produce and are classified separately for both take off and landing
For the purposes of night flying operations, the night quota period is defined as the period between 23:30 -
06:00 (Local time). In addition there are two further shoulder periods of 23:00 – 23:30 and 06:00 – 07:00
(Local time), where other restrictions apply to the scheduling and operation of aircraft of specified
descriptions
Restrictions
19
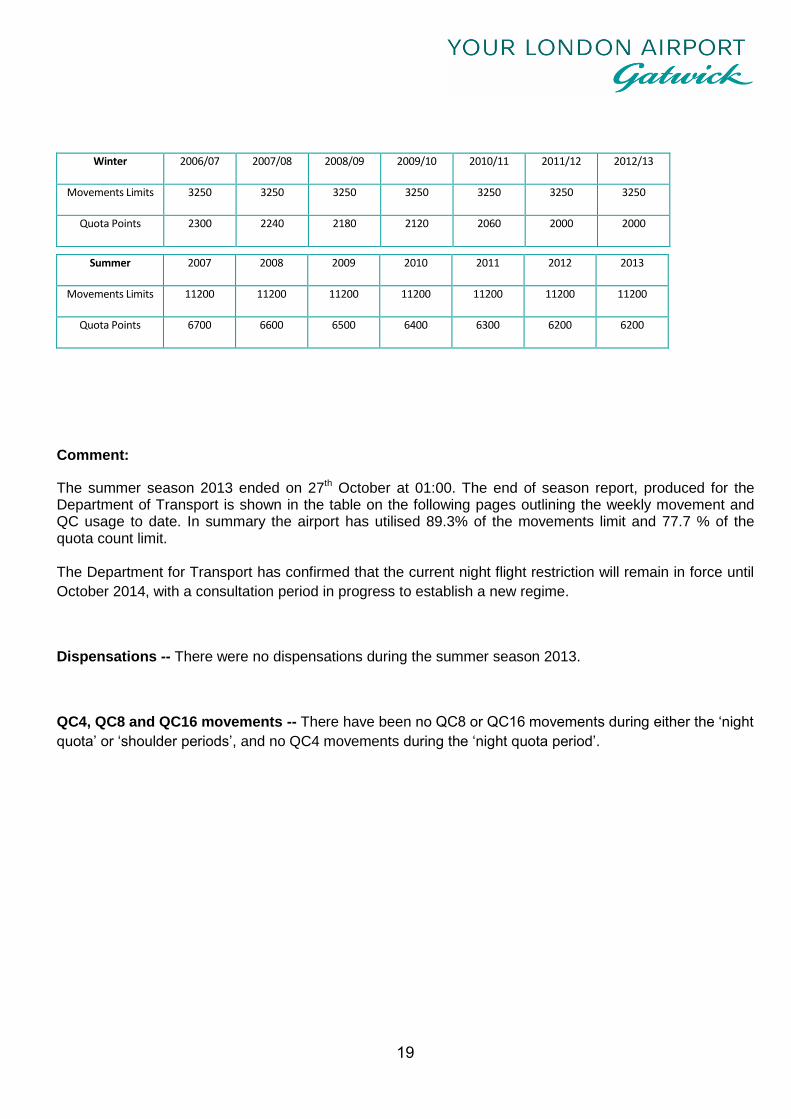
Winter 2006/07 2007/08 2008/09 2009/10 2010/11 2011/12 2012/13
Movements Limits 3250 3250 3250 3250 3250 3250 3250
Quota Points 2300 2240 2180 2120 2060 2000 2000
Summer 2007 2008 2009 2010 2011 2012 2013
Movements Limits 11200 11200 11200 11200 11200 11200 11200
Quota Points 6700 6600 6500 6400 6300 6200 6200
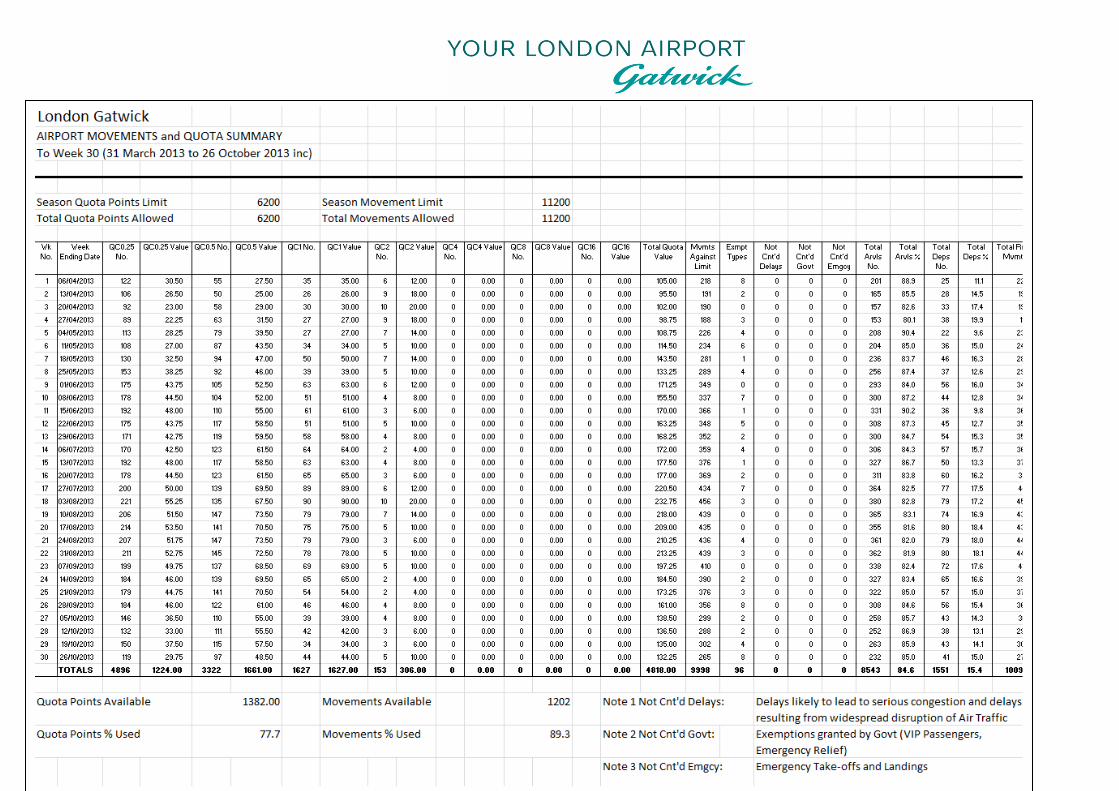
Comment:
The summer season 2013 ended on 27th October at 01:00. The end of season report, produced for the Department of Transport is shown in the table on the following pages outlining the weekly movement and QC usage to date. In summary the airport has utilised 89.3% of the movements limit and 77.7 % of the quota count limit. The Department for Transport has confirmed that the current night flight restriction will remain in force until
October 2014, with a consultation period in progress to establish a new regime.
Dispensations -- There were no dispensations during the summer season 2013.
QC4, QC8 and QC16 movements -- There have been no QC8 or QC16 movements during either the ‘night
quota’ or ‘shoulder periods’, and no QC4 movements during the ‘night quota period’.
20
:
21
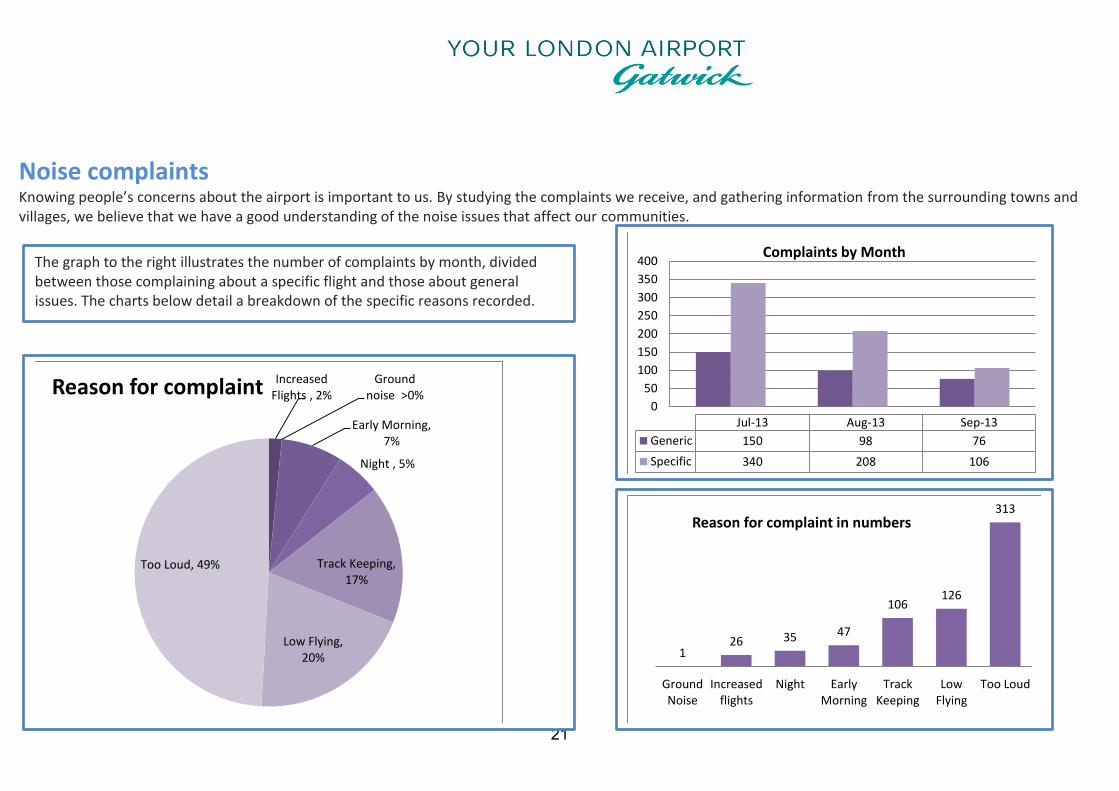
Noise complaints Knowing people’s concerns about the airport is important to us. By studying the complaints we receive, and gathering information from the surrounding towns and villages, we believe that we have a good understanding of the noise issues that affect our communities.
Increased Flights , 2%
Ground noise >0%
Early Morning, 7%
Night , 5%
Track Keeping, 17%
Low Flying, 20%
Too Loud, 49%
Reason for complaint
1 26 35 47
106 126
313
GroundNoise
Increasedflights
Night EarlyMorning
TrackKeeping
LowFlying
Too Loud
Reason for complaint in numbers
0
50
100
150
200
250
300
350
400
Jul-13 Aug-13 Sep-13
Generic 150 98 76
Specific 340 208 106
Complaints by Month The graph to the right illustrates the number of complaints by month, divided between those complaining about a specific flight and those about general issues. The charts below detail a breakdown of the specific reasons recorded.

22
Noise complaints W
Noise is very subjective and peoples’ attitude to various forms of
noise can vary widely. What one person may consider
acceptable may disturb another. These charts provide further
analysis of where our complainants live and whether they have
been disturbed by arriving or departing flights, or by noise from
within the airport boundary.
0
100
200
300
400
500
600
Jul-13 Aug-13 Sep-13
Complaints - sources Letter
Web
Phone
Right hand diagram indicates
the mode of operation for
complaints matched to flights
The graph shows the
location of complaints
This graph illustrates how people contact the airport

23
Map illustrating the location of noise complaints and the Noise Preferential Routes at Gatwick for the 3rd quarter 2013

24
Ground Noise complaints
We occasionaly receive complaints about disturbance from noise from within the boundary of the airfield. These can be caused by the normal
operation of aircraft moving about the airfield, taking off and landing. Additional sources of noise disturbance can be the use of Auxiliary Power Units
by aircraft on stand or the testing of engines following maintenance or repair (engines runs). Strict regulations exist to minimise this disturbance,
which includes a ban on engine running during the night. Details of any ground noise complaints are outlined below.
A single complaint quoting disturbance from ‘ground noise’
was received from a resident in central East Grinstead. As
the location is over 6 miles from the airfield it is likely the
disturbance was caused by departing aircraft on the
published Noise Preferential Route to the west of the town
rather than operations within the airfield boundary.
An engine run did take place on the day in question, 22 July
2013, but at a time later than the complaint had been
received.
For more information visit us at
www.gatwickairport.com/noise
Contact us:
© Gatwick Airport Limited 2013